Zip Codes with the Highest Percentage of Population with a Degree in Education in O Fallon, MO
RELATED REPORTS & OPTIONS
Education
O Fallon
Compare Zip Codes
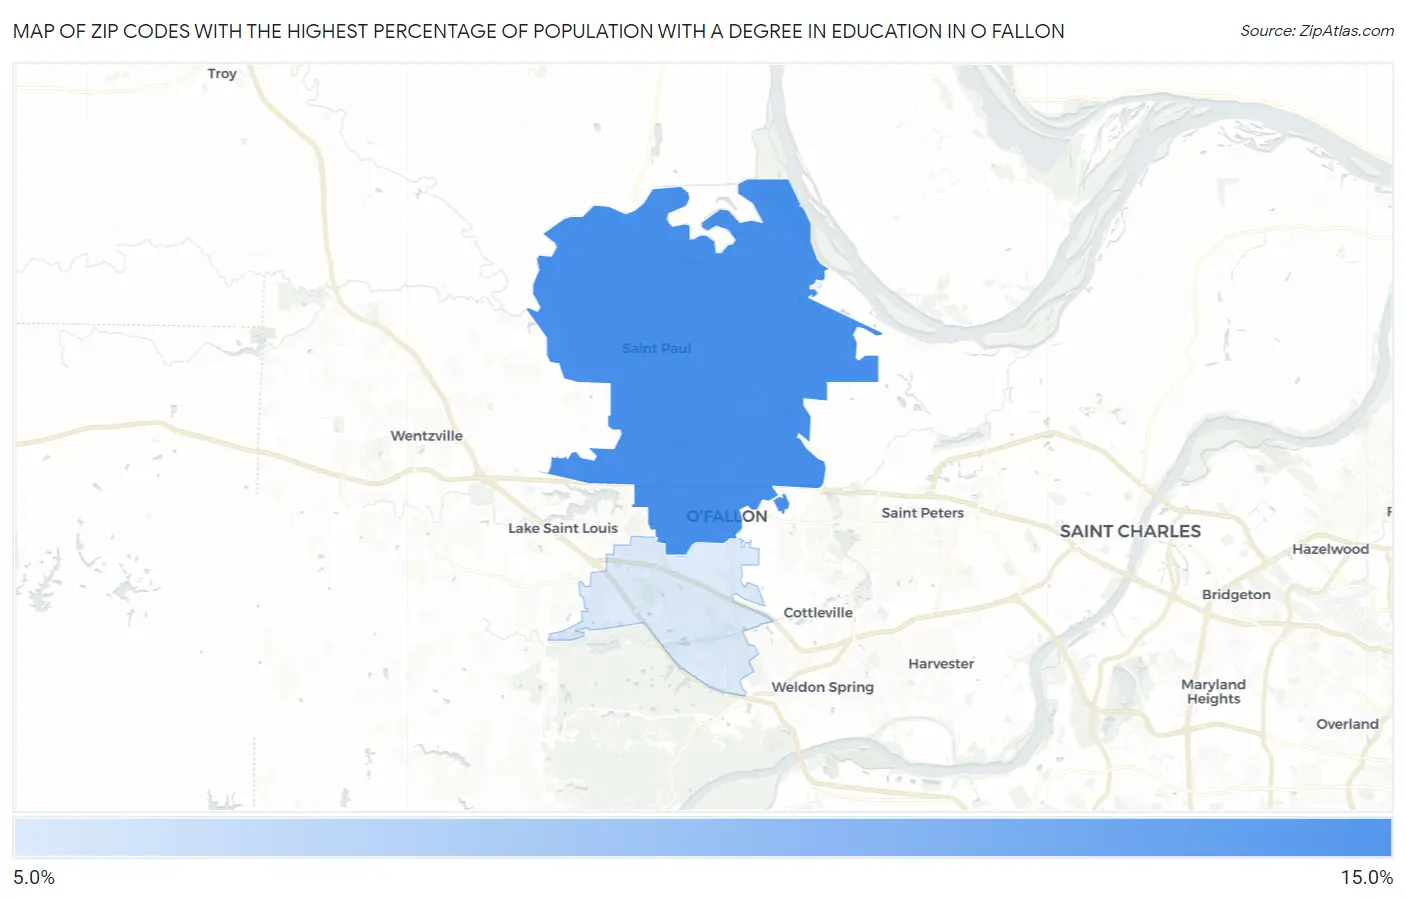
Map of Zip Codes with the Highest Percentage of Population with a Degree in Education in O Fallon
11.8%
14.4%
Zip Codes with the Highest Percentage of Population with a Degree in Education in O Fallon, MO
| Zip Code | % Graduates | vs State | vs National | |
| 1. | 63366 | 14.4% | 14.5%(-0.171)#652 | 11.1%(+3.31)#16,494 |
| 2. | 63368 | 11.8% | 14.5%(-2.78)#726 | 11.1%(+0.706)#19,955 |
1
Common Questions
What are the Top Zip Codes with the Highest Percentage of Population with a Degree in Education in O Fallon, MO?
Top Zip Codes with the Highest Percentage of Population with a Degree in Education in O Fallon, MO are:
What zip code has the Highest Percentage of Population with a Degree in Education in O Fallon, MO?
63366 has the Highest Percentage of Population with a Degree in Education in O Fallon, MO with 14.4%.
What is the Percentage of Population with a Degree in Education in O Fallon, MO?
Percentage of Population with a Degree in Education in O Fallon is 13.4%.
What is the Percentage of Population with a Degree in Education in Missouri?
Percentage of Population with a Degree in Education in Missouri is 14.5%.
What is the Percentage of Population with a Degree in Education in the United States?
Percentage of Population with a Degree in Education in the United States is 11.1%.