Zip Codes with the Highest Percentage of Population Employed in Arts, Media & Entertainment in O Fallon, MO
RELATED REPORTS & OPTIONS
Arts, Media & Entertainment
O Fallon
Compare Zip Codes
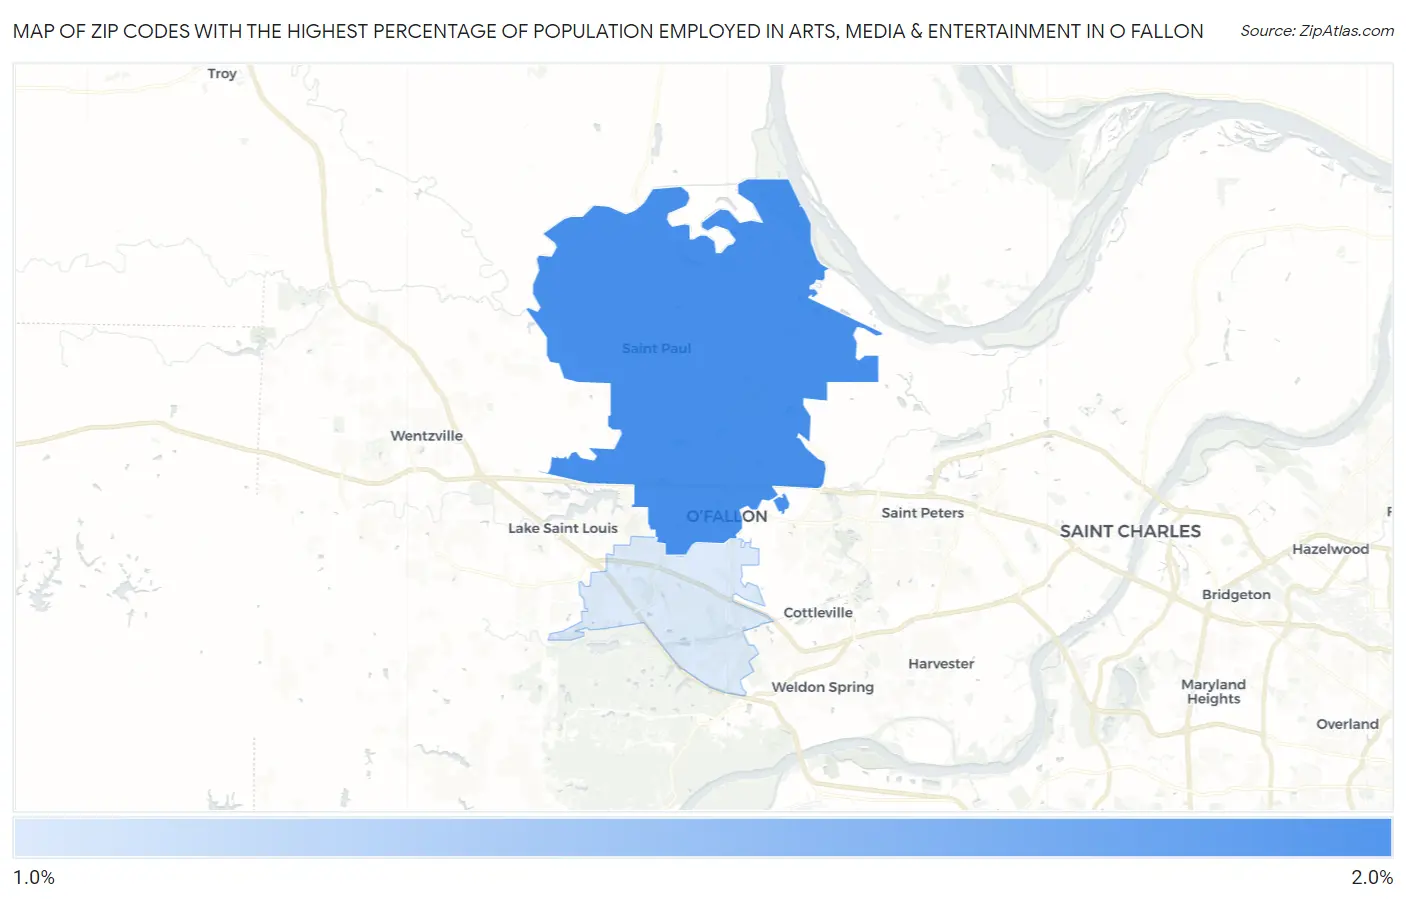
Map of Zip Codes with the Highest Percentage of Population Employed in Arts, Media & Entertainment in O Fallon
1.5%
1.8%
Zip Codes with the Highest Percentage of Population Employed in Arts, Media & Entertainment in O Fallon, MO
| Zip Code | % Employed | vs State | vs National | |
| 1. | 63366 | 1.8% | 1.7%(+0.154)#192 | 2.1%(-0.251)#8,922 |
| 2. | 63368 | 1.5% | 1.7%(-0.201)#245 | 2.1%(-0.606)#11,316 |
1
Common Questions
What are the Top Zip Codes with the Highest Percentage of Population Employed in Arts, Media & Entertainment in O Fallon, MO?
Top Zip Codes with the Highest Percentage of Population Employed in Arts, Media & Entertainment in O Fallon, MO are:
What zip code has the Highest Percentage of Population Employed in Arts, Media & Entertainment in O Fallon, MO?
63366 has the Highest Percentage of Population Employed in Arts, Media & Entertainment in O Fallon, MO with 1.8%.
What is the Percentage of Population Employed in Arts, Media & Entertainment in O Fallon, MO?
Percentage of Population Employed in Arts, Media & Entertainment in O Fallon is 1.8%.
What is the Percentage of Population Employed in Arts, Media & Entertainment in Missouri?
Percentage of Population Employed in Arts, Media & Entertainment in Missouri is 1.7%.
What is the Percentage of Population Employed in Arts, Media & Entertainment in the United States?
Percentage of Population Employed in Arts, Media & Entertainment in the United States is 2.1%.