Zip Codes with the Highest Percentage of Households With Three or more Vehicles in O Fallon, MO
RELATED REPORTS & OPTIONS
Households with 3 or more Cars
O Fallon
Compare Zip Codes
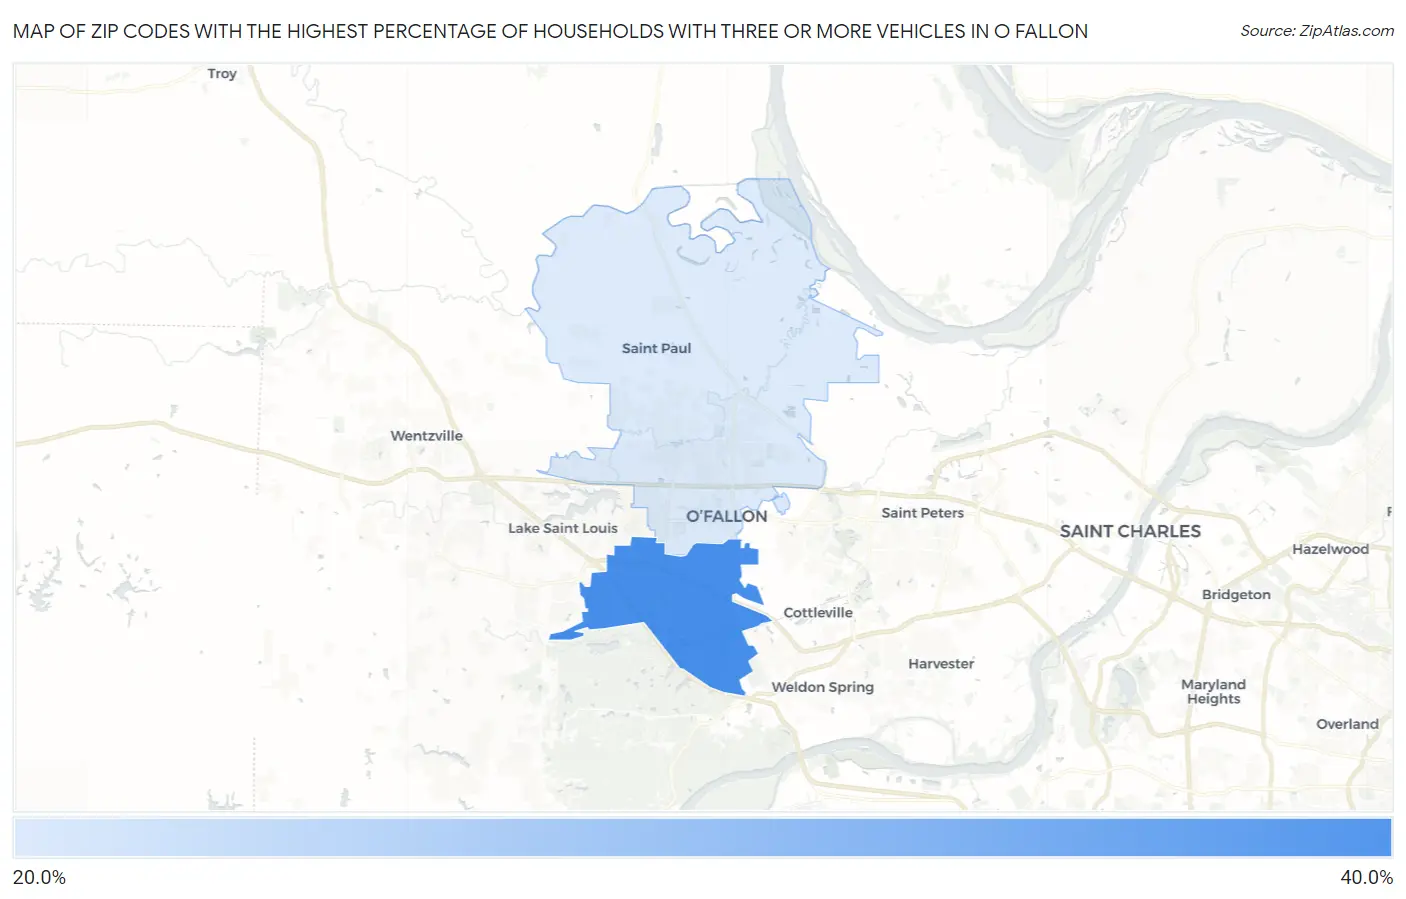
Map of Zip Codes with the Highest Percentage of Households With Three or more Vehicles in O Fallon
29.8%
30.7%
Zip Codes with the Highest Percentage of Households With Three or more Vehicles in O Fallon, MO
| Zip Code | Housholds With 3+ Cars | vs State | vs National | |
| 1. | 63368 | 30.7% | 29.8%(+0.900)#638 | 29.0%(+1.70)#17,259 |
| 2. | 63366 | 29.8% | 29.8%(=0.000)#667 | 29.0%(+0.800)#18,161 |
1
Common Questions
What are the Top Zip Codes with the Highest Percentage of Households With Three or more Vehicles in O Fallon, MO?
Top Zip Codes with the Highest Percentage of Households With Three or more Vehicles in O Fallon, MO are:
What zip code has the Highest Percentage of Households With Three or more Vehicles in O Fallon, MO?
63368 has the Highest Percentage of Households With Three or more Vehicles in O Fallon, MO with 30.7%.
What is the Percentage of Households With Three or more Vehicles in O Fallon, MO?
Percentage of Households With Three or more Vehicles in O Fallon is 29.1%.
What is the Percentage of Households With Three or more Vehicles in Missouri?
Percentage of Households With Three or more Vehicles in Missouri is 29.8%.
What is the Percentage of Households With Three or more Vehicles in the United States?
Percentage of Households With Three or more Vehicles in the United States is 29.0%.