Zip Codes with the Highest Percentage of Population Enrolled in Private School in O Fallon, MO
RELATED REPORTS & OPTIONS
In Private School
O Fallon
Compare Zip Codes
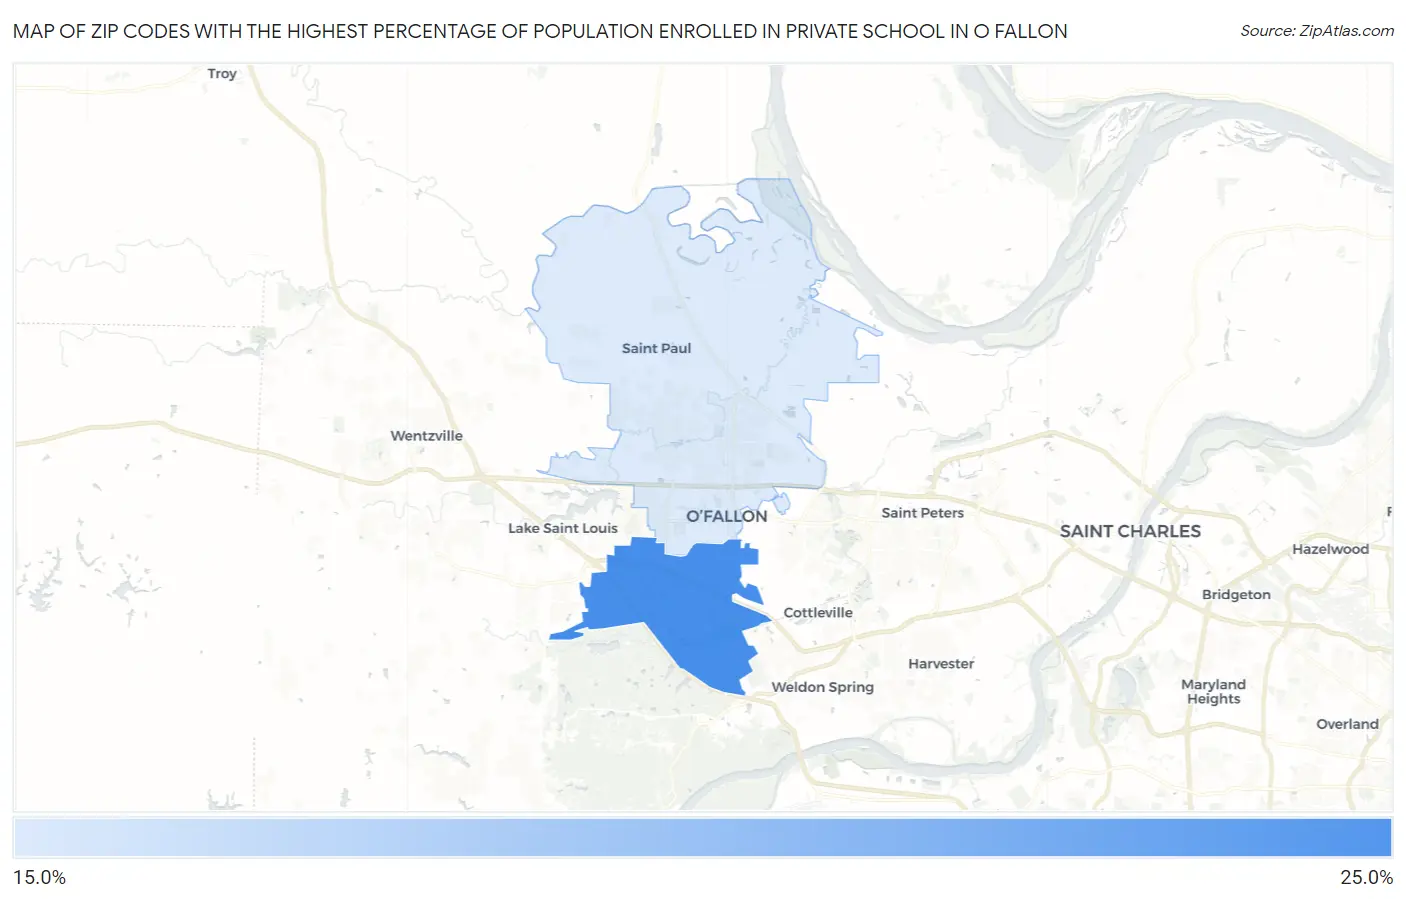
Map of Zip Codes with the Highest Percentage of Population Enrolled in Private School in O Fallon
20.0%
21.4%
Zip Codes with the Highest Percentage of Population Enrolled in Private School in O Fallon, MO
| Zip Code | % in Private School | vs State | vs National | |
| 1. | 63368 | 21.4% | 19.1%(+2.30)#234 | 17.3%(+4.10)#7,360 |
| 2. | 63366 | 20.0% | 19.1%(+0.900)#267 | 17.3%(+2.70)#8,397 |
1
Common Questions
What are the Top Zip Codes with the Highest Percentage of Population Enrolled in Private School in O Fallon, MO?
Top Zip Codes with the Highest Percentage of Population Enrolled in Private School in O Fallon, MO are:
What zip code has the Highest Percentage of Population Enrolled in Private School in O Fallon, MO?
63368 has the Highest Percentage of Population Enrolled in Private School in O Fallon, MO with 21.4%.
What is the Percentage of Population Enrolled in Private School in O Fallon, MO?
Percentage of Population Enrolled in Private School in O Fallon is 21.6%.
What is the Percentage of Population Enrolled in Private School in Missouri?
Percentage of Population Enrolled in Private School in Missouri is 19.1%.
What is the Percentage of Population Enrolled in Private School in the United States?
Percentage of Population Enrolled in Private School in the United States is 17.3%.