Zip Codes with the Highest Percentage of Population Employed in Office & Administration in O Fallon, MO
RELATED REPORTS & OPTIONS
Office & Administration
O Fallon
Compare Zip Codes
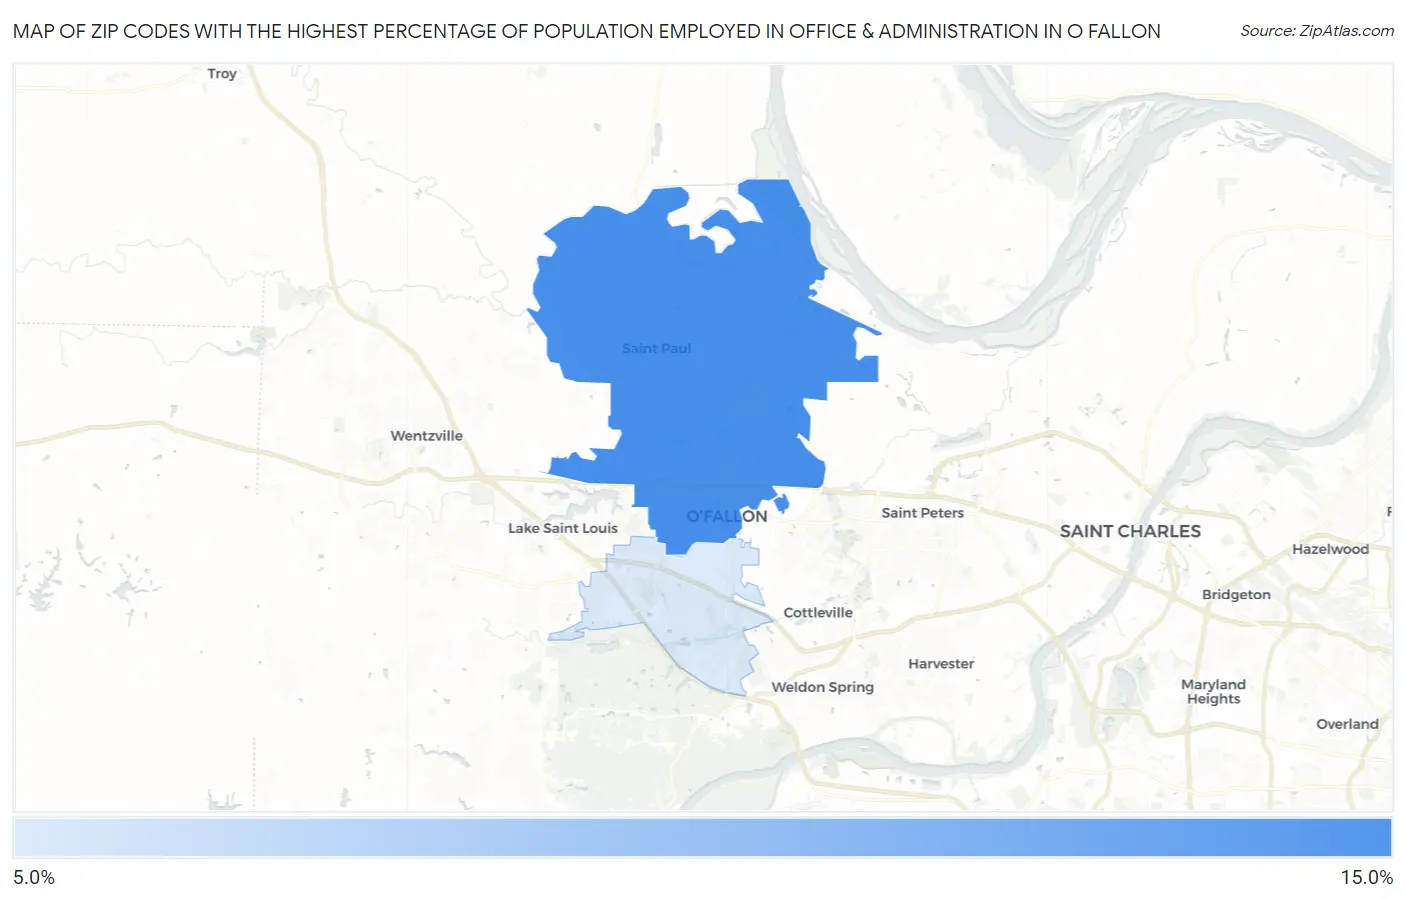
Map of Zip Codes with the Highest Percentage of Population Employed in Office & Administration in O Fallon
10.1%
12.1%
Zip Codes with the Highest Percentage of Population Employed in Office & Administration in O Fallon, MO
| Zip Code | % Employed | vs State | vs National | |
| 1. | 63366 | 12.1% | 11.3%(+0.793)#367 | 10.9%(+1.29)#10,311 |
| 2. | 63368 | 10.1% | 11.3%(-1.24)#531 | 10.9%(-0.744)#16,756 |
1
Common Questions
What are the Top Zip Codes with the Highest Percentage of Population Employed in Office & Administration in O Fallon, MO?
Top Zip Codes with the Highest Percentage of Population Employed in Office & Administration in O Fallon, MO are:
What zip code has the Highest Percentage of Population Employed in Office & Administration in O Fallon, MO?
63366 has the Highest Percentage of Population Employed in Office & Administration in O Fallon, MO with 12.1%.
What is the Percentage of Population Employed in Office & Administration in O Fallon, MO?
Percentage of Population Employed in Office & Administration in O Fallon is 11.0%.
What is the Percentage of Population Employed in Office & Administration in Missouri?
Percentage of Population Employed in Office & Administration in Missouri is 11.3%.
What is the Percentage of Population Employed in Office & Administration in the United States?
Percentage of Population Employed in Office & Administration in the United States is 10.9%.