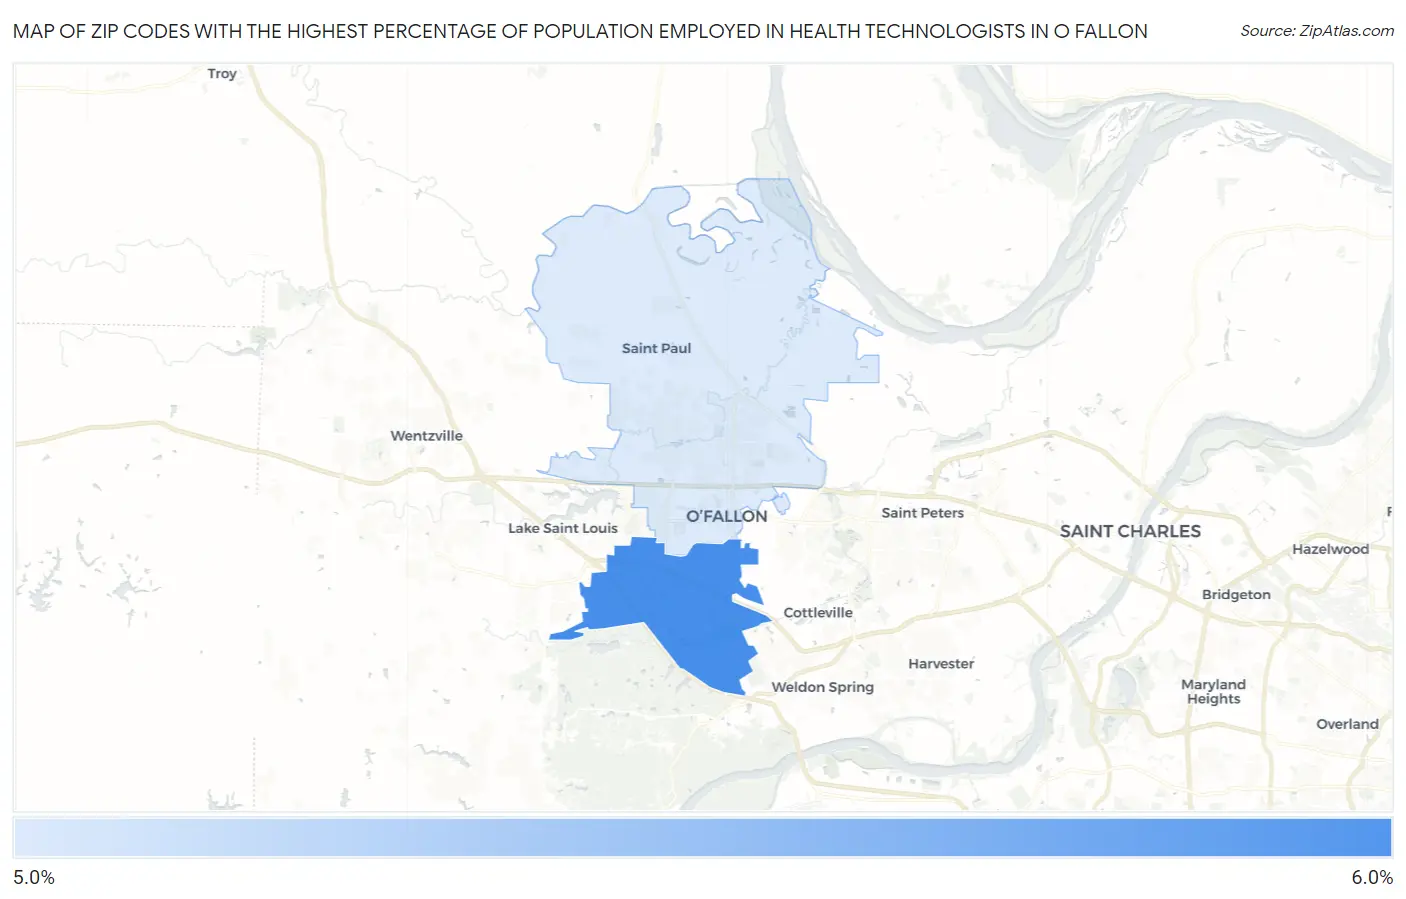
Zip Codes with the Highest Percentage of Population Employed in Health Technologists in O Fallon, MO
RELATED REPORTS & OPTIONS
Health Technologists
O Fallon
Compare Zip Codes
Map of Zip Codes with the Highest Percentage of Population Employed in Health Technologists in O Fallon
5.4%
5.5%
Zip Codes with the Highest Percentage of Population Employed in Health Technologists in O Fallon, MO
| Zip Code | % Employed | vs State | vs National | |
| 1. | 63368 | 5.5% | 4.5%(+0.972)#213 | 4.3%(+1.22)#7,228 |
| 2. | 63366 | 5.4% | 4.5%(+0.820)#227 | 4.3%(+1.06)#7,678 |
1
Common Questions
What are the Top Zip Codes with the Highest Percentage of Population Employed in Health Technologists in O Fallon, MO?
Top Zip Codes with the Highest Percentage of Population Employed in Health Technologists in O Fallon, MO are:
What zip code has the Highest Percentage of Population Employed in Health Technologists in O Fallon, MO?
63368 has the Highest Percentage of Population Employed in Health Technologists in O Fallon, MO with 5.5%.
What is the Percentage of Population Employed in Health Technologists in O Fallon, MO?
Percentage of Population Employed in Health Technologists in O Fallon is 5.4%.
What is the Percentage of Population Employed in Health Technologists in Missouri?
Percentage of Population Employed in Health Technologists in Missouri is 4.5%.
What is the Percentage of Population Employed in Health Technologists in the United States?
Percentage of Population Employed in Health Technologists in the United States is 4.3%.