Zip Codes with the Highest Percentage of Self-Employed / Not Incorporated in O Fallon, MO
RELATED REPORTS & OPTIONS
Self-Employed / Not Incorporated
O Fallon
Compare Zip Codes
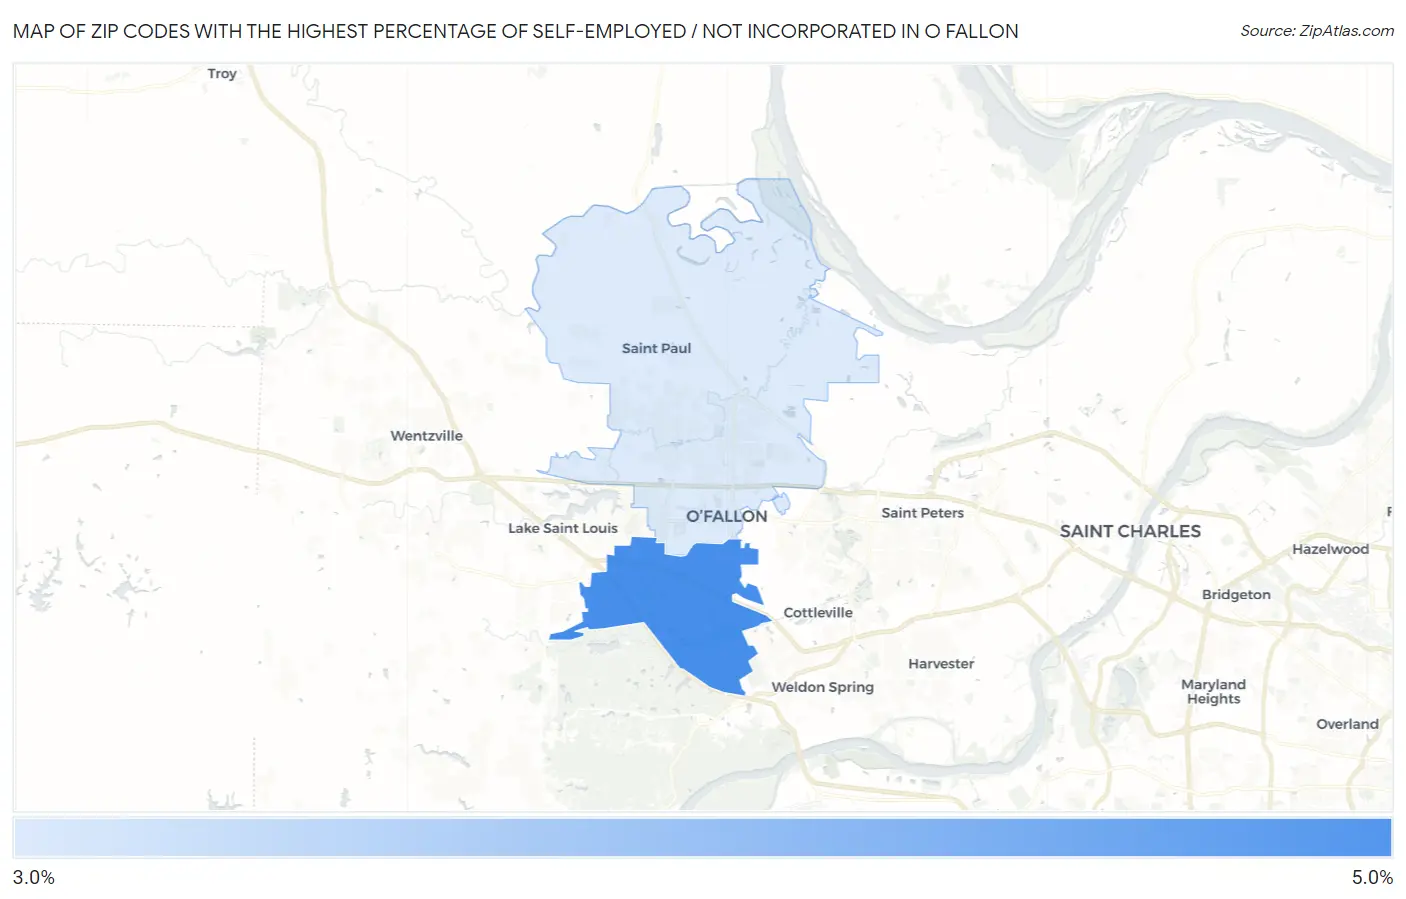
Map of Zip Codes with the Highest Percentage of Self-Employed / Not Incorporated in O Fallon
0.0%
5.0%
Zip Codes with the Highest Percentage of Self-Employed / Not Incorporated in O Fallon, MO
| Zip Code | % Self-Employed / Not Incorporated | vs State | vs National | |
| 1. | 63368 | 4.4% | 5.5%(-1.15)#707 | 5.8%(-1.46)#22,097 |
| 2. | 63366 | 3.3% | 5.5%(-2.22)#824 | 5.8%(-2.52)#25,614 |
1
Common Questions
What are the Top Zip Codes with the Highest Percentage of Self-Employed / Not Incorporated in O Fallon, MO?
Top Zip Codes with the Highest Percentage of Self-Employed / Not Incorporated in O Fallon, MO are:
What zip code has the Highest Percentage of Self-Employed / Not Incorporated in O Fallon, MO?
63368 has the Highest Percentage of Self-Employed / Not Incorporated in O Fallon, MO with 4.4%.
What is the Percentage of Self-Employed / Not Incorporated in O Fallon, MO?
Percentage of Self-Employed / Not Incorporated in O Fallon is 3.8%.
What is the Percentage of Self-Employed / Not Incorporated in Missouri?
Percentage of Self-Employed / Not Incorporated in Missouri is 5.5%.
What is the Percentage of Self-Employed / Not Incorporated in the United States?
Percentage of Self-Employed / Not Incorporated in the United States is 5.8%.