Zip Codes with the Highest Percentage of Population Employed in Utilities in O Fallon, MO
RELATED REPORTS & OPTIONS
Utilities
O Fallon
Compare Zip Codes
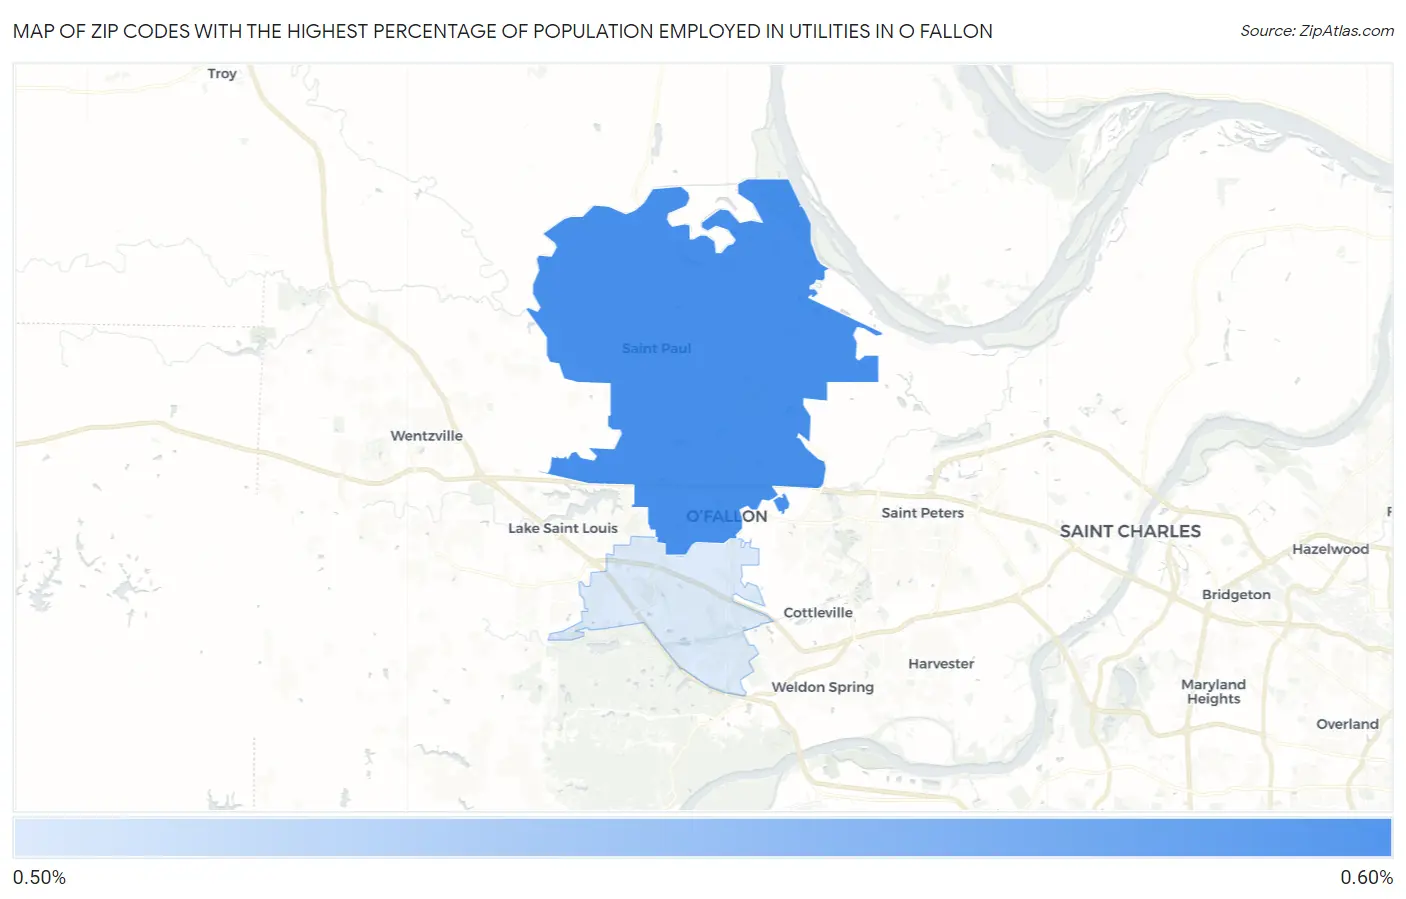
Map of Zip Codes with the Highest Percentage of Population Employed in Utilities in O Fallon
0.54%
0.58%
Zip Codes with the Highest Percentage of Population Employed in Utilities in O Fallon, MO
| Zip Code | % Employed | vs State | vs National | |
| 1. | 63366 | 0.58% | 0.91%(-0.332)#460 | 0.84%(-0.256)#15,000 |
| 2. | 63368 | 0.54% | 0.91%(-0.370)#479 | 0.84%(-0.294)#15,555 |
1
Common Questions
What are the Top Zip Codes with the Highest Percentage of Population Employed in Utilities in O Fallon, MO?
Top Zip Codes with the Highest Percentage of Population Employed in Utilities in O Fallon, MO are:
What zip code has the Highest Percentage of Population Employed in Utilities in O Fallon, MO?
63366 has the Highest Percentage of Population Employed in Utilities in O Fallon, MO with 0.58%.
What is the Percentage of Population Employed in Utilities in O Fallon, MO?
Percentage of Population Employed in Utilities in O Fallon is 0.62%.
What is the Percentage of Population Employed in Utilities in Missouri?
Percentage of Population Employed in Utilities in Missouri is 0.91%.
What is the Percentage of Population Employed in Utilities in the United States?
Percentage of Population Employed in Utilities in the United States is 0.84%.