Zip Codes with the Highest Percentage of Immigrants from Eastern Asia in Belleville, IL
RELATED REPORTS & OPTIONS
Eastern Asia
Belleville
Compare Zip Codes
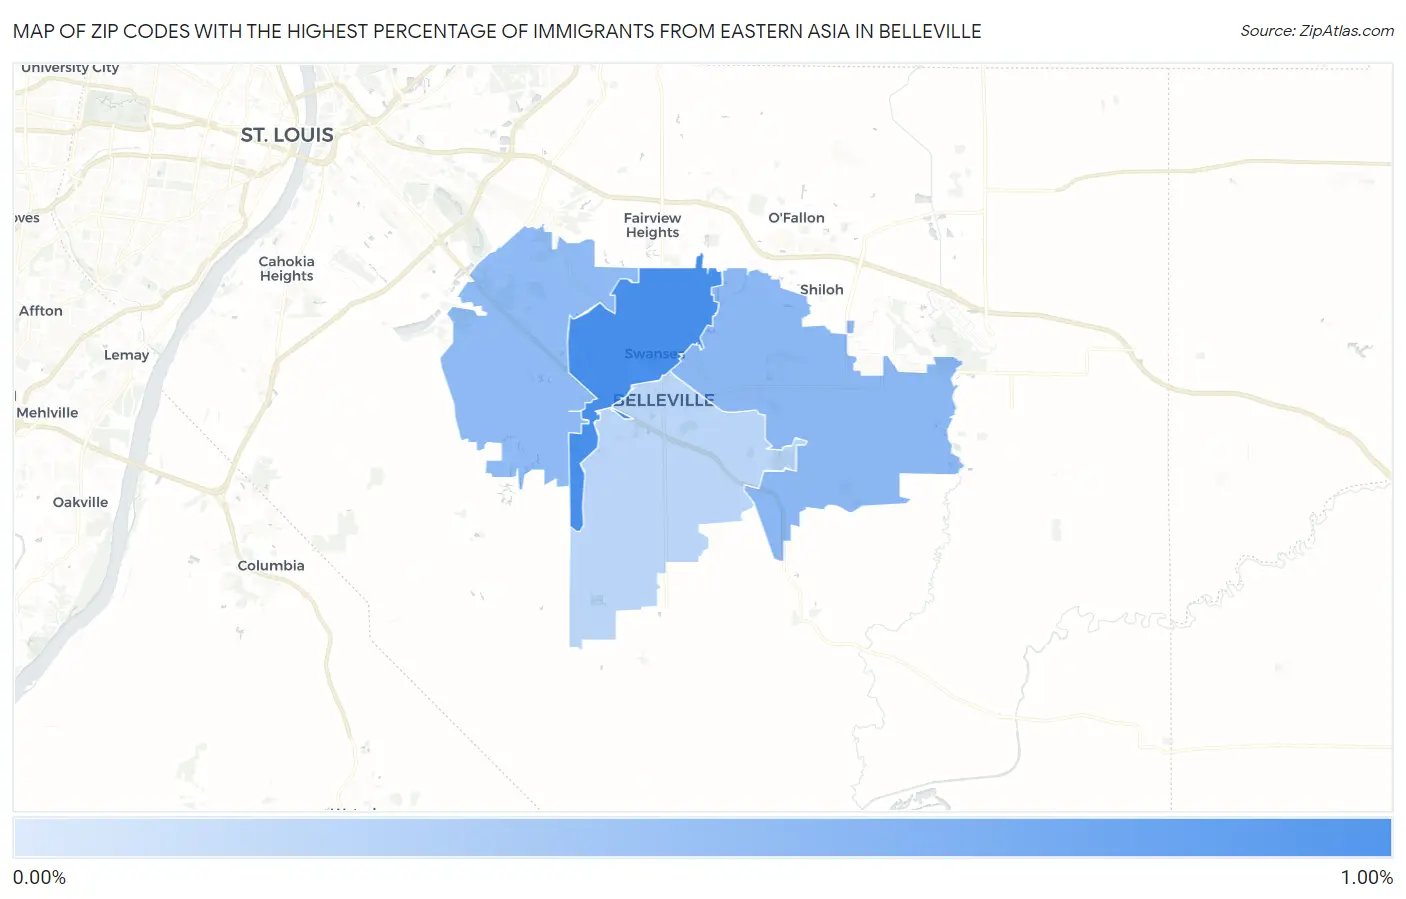
Map of Zip Codes with the Highest Percentage of Immigrants from Eastern Asia in Belleville
0.22%
0.96%
Zip Codes with the Highest Percentage of Immigrants from Eastern Asia in Belleville, IL
| Zip Code | Eastern Asia | vs State | vs National | |
| 1. | 62226 | 0.96% | 1.12%(-0.161)#146 | 1.28%(-0.314)#4,031 |
| 2. | 62221 | 0.53% | 1.12%(-0.590)#205 | 1.28%(-0.743)#6,320 |
| 3. | 62223 | 0.51% | 1.12%(-0.615)#213 | 1.28%(-0.768)#6,523 |
| 4. | 62220 | 0.22% | 1.12%(-0.900)#373 | 1.28%(-1.05)#9,910 |
1
Common Questions
What are the Top 3 Zip Codes with the Highest Percentage of Immigrants from Eastern Asia in Belleville, IL?
Top 3 Zip Codes with the Highest Percentage of Immigrants from Eastern Asia in Belleville, IL are:
What zip code has the Highest Percentage of Immigrants from Eastern Asia in Belleville, IL?
62226 has the Highest Percentage of Immigrants from Eastern Asia in Belleville, IL with 0.96%.
What is the Percentage of Immigrants from Eastern Asia in Belleville, IL?
Percentage of Immigrants from Eastern Asia in Belleville is 0.21%.
What is the Percentage of Immigrants from Eastern Asia in Illinois?
Percentage of Immigrants from Eastern Asia in Illinois is 1.12%.
What is the Percentage of Immigrants from Eastern Asia in the United States?
Percentage of Immigrants from Eastern Asia in the United States is 1.28%.