Zip Codes with the Highest Percentage of Population Employed in Architecture & Engineering in Belleville, IL
RELATED REPORTS & OPTIONS
Architecture & Engineering
Belleville
Compare Zip Codes
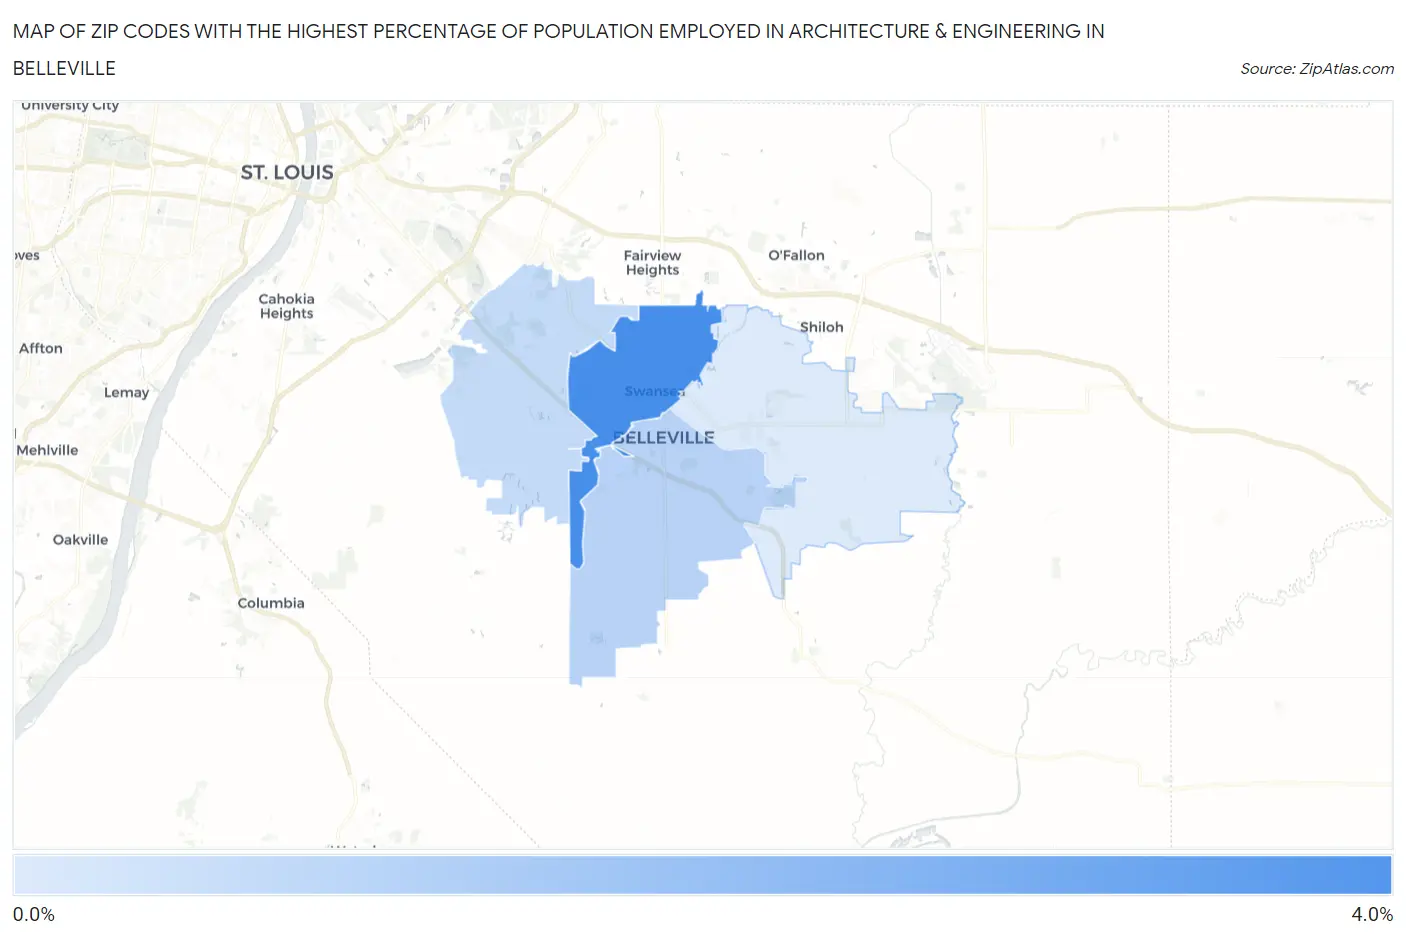
Map of Zip Codes with the Highest Percentage of Population Employed in Architecture & Engineering in Belleville
0.84%
3.5%
Zip Codes with the Highest Percentage of Population Employed in Architecture & Engineering in Belleville, IL
| Zip Code | % Employed | vs State | vs National | |
| 1. | 62226 | 3.5% | 1.9%(+1.62)#130 | 2.1%(+1.37)#3,692 |
| 2. | 62220 | 1.5% | 1.9%(-0.382)#533 | 2.1%(-0.637)#12,792 |
| 3. | 62223 | 1.3% | 1.9%(-0.612)#605 | 2.1%(-0.867)#14,431 |
| 4. | 62221 | 0.84% | 1.9%(-1.05)#764 | 2.1%(-1.31)#17,818 |
1
Common Questions
What are the Top 3 Zip Codes with the Highest Percentage of Population Employed in Architecture & Engineering in Belleville, IL?
Top 3 Zip Codes with the Highest Percentage of Population Employed in Architecture & Engineering in Belleville, IL are:
What zip code has the Highest Percentage of Population Employed in Architecture & Engineering in Belleville, IL?
62226 has the Highest Percentage of Population Employed in Architecture & Engineering in Belleville, IL with 3.5%.
What is the Percentage of Population Employed in Architecture & Engineering in Belleville, IL?
Percentage of Population Employed in Architecture & Engineering in Belleville is 2.8%.
What is the Percentage of Population Employed in Architecture & Engineering in Illinois?
Percentage of Population Employed in Architecture & Engineering in Illinois is 1.9%.
What is the Percentage of Population Employed in Architecture & Engineering in the United States?
Percentage of Population Employed in Architecture & Engineering in the United States is 2.1%.