Zip Codes with the Highest Percentage of Population with a Degree in Visual and Performing Arts in Belleville, IL
RELATED REPORTS & OPTIONS
Visual and Performing Arts
Belleville
Compare Zip Codes
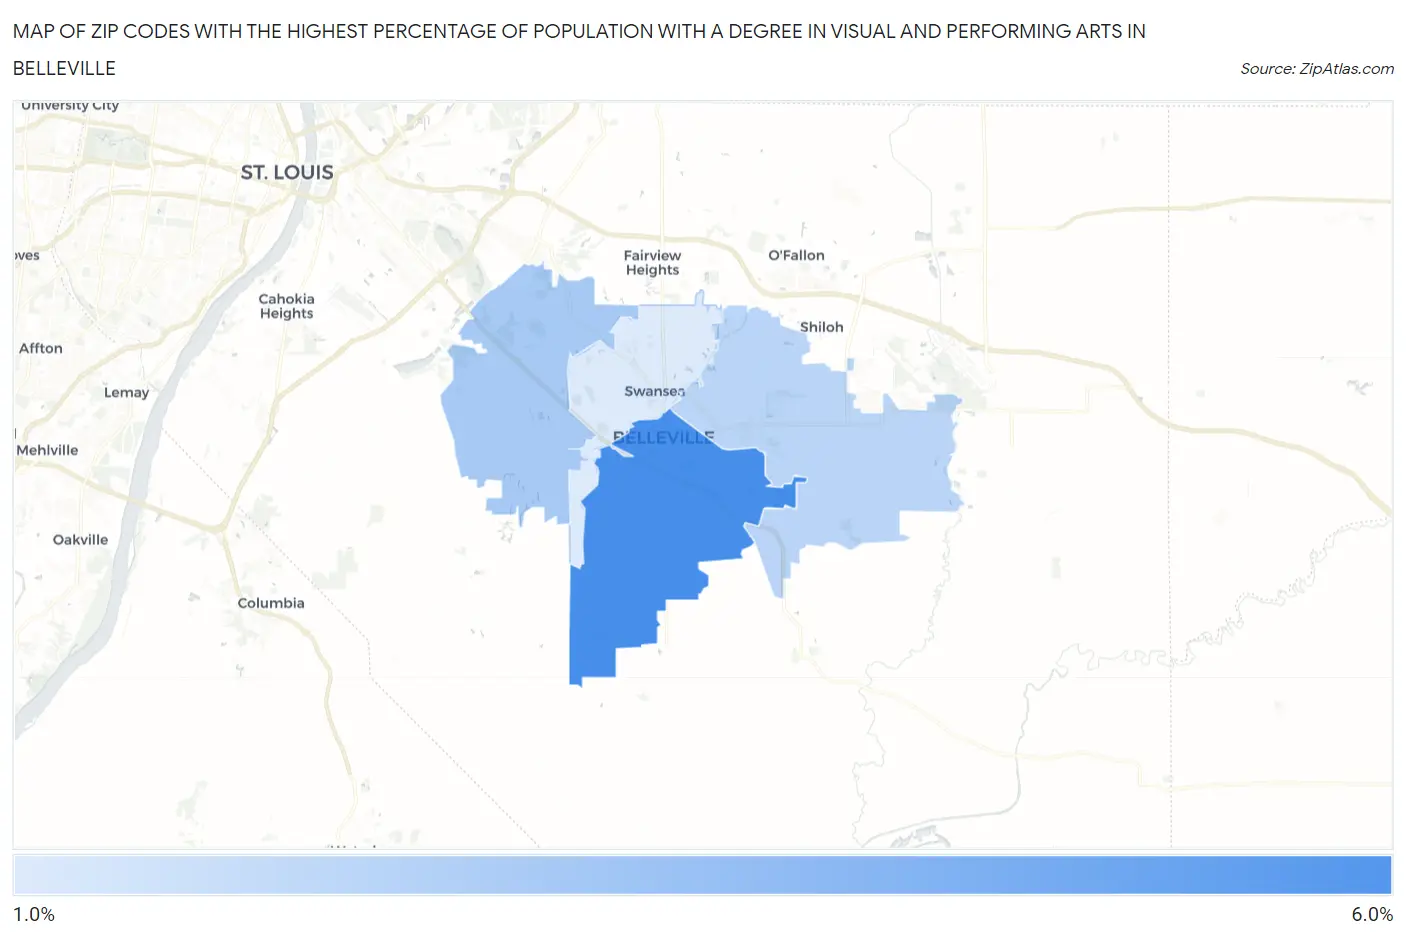
Map of Zip Codes with the Highest Percentage of Population with a Degree in Visual and Performing Arts in Belleville
1.7%
5.0%
Zip Codes with the Highest Percentage of Population with a Degree in Visual and Performing Arts in Belleville, IL
| Zip Code | % Graduates | vs State | vs National | |
| 1. | 62220 | 5.0% | 4.4%(+0.571)#241 | 4.3%(+0.769)#6,584 |
| 2. | 62223 | 2.8% | 4.4%(-1.63)#546 | 4.3%(-1.43)#13,394 |
| 3. | 62221 | 2.4% | 4.4%(-2.00)#607 | 4.3%(-1.81)#14,802 |
| 4. | 62226 | 1.7% | 4.4%(-2.79)#705 | 4.3%(-2.59)#17,638 |
1
Common Questions
What are the Top 3 Zip Codes with the Highest Percentage of Population with a Degree in Visual and Performing Arts in Belleville, IL?
Top 3 Zip Codes with the Highest Percentage of Population with a Degree in Visual and Performing Arts in Belleville, IL are:
What zip code has the Highest Percentage of Population with a Degree in Visual and Performing Arts in Belleville, IL?
62220 has the Highest Percentage of Population with a Degree in Visual and Performing Arts in Belleville, IL with 5.0%.
What is the Percentage of Population with a Degree in Visual and Performing Arts in Belleville, IL?
Percentage of Population with a Degree in Visual and Performing Arts in Belleville is 2.7%.
What is the Percentage of Population with a Degree in Visual and Performing Arts in Illinois?
Percentage of Population with a Degree in Visual and Performing Arts in Illinois is 4.4%.
What is the Percentage of Population with a Degree in Visual and Performing Arts in the United States?
Percentage of Population with a Degree in Visual and Performing Arts in the United States is 4.3%.