Zip Codes with the Highest Percentage of Population with a Degree in Visual and Performing Arts in Hawaii
RELATED REPORTS & OPTIONS
Visual and Performing Arts
Hawaii
Compare Zip Codes
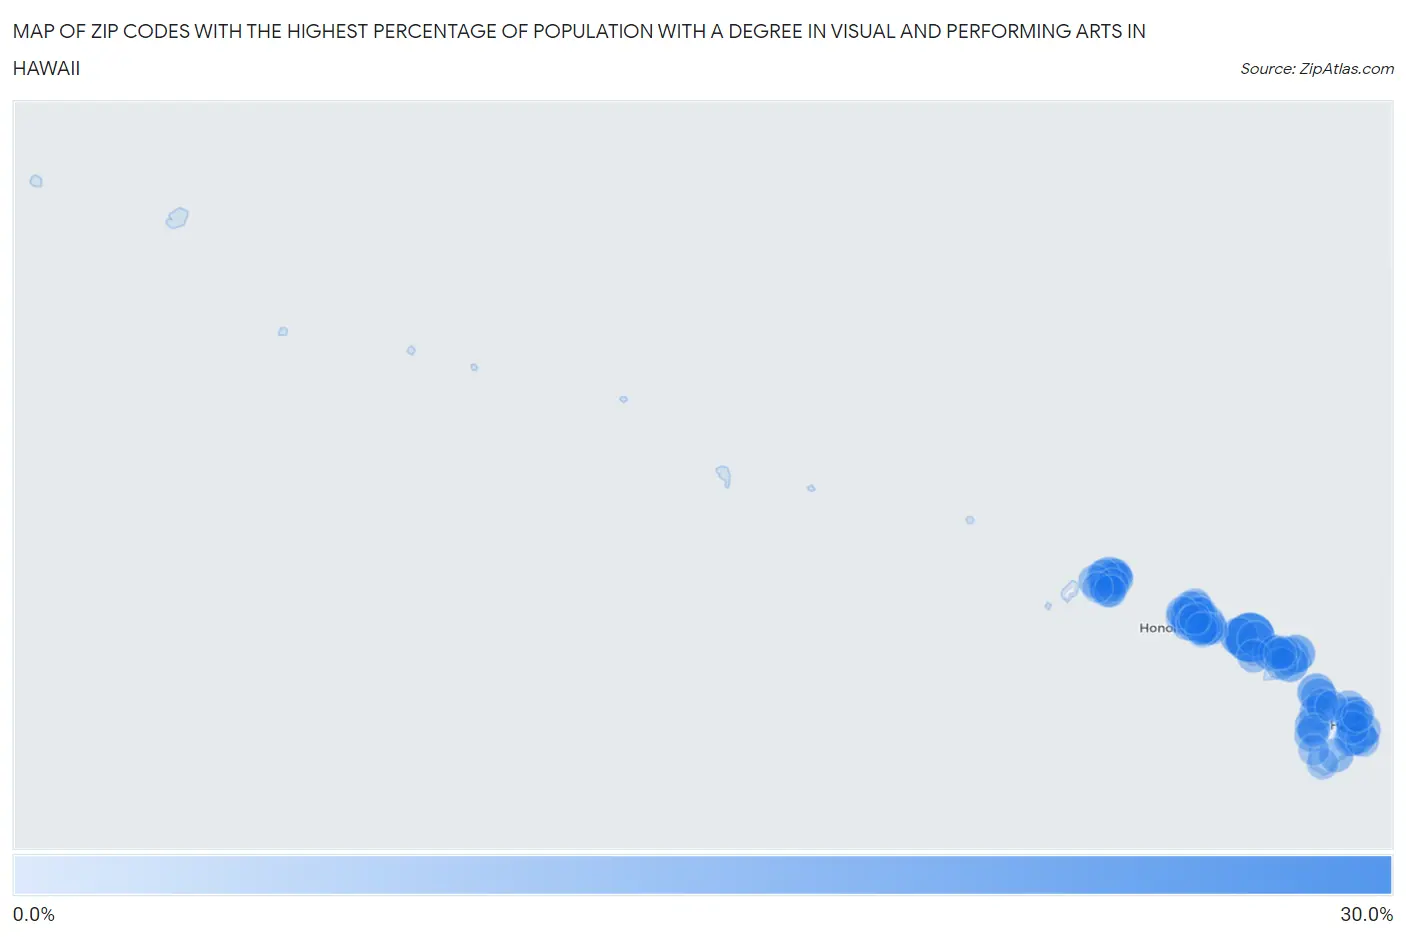
Map of Zip Codes with the Highest Percentage of Population with a Degree in Visual and Performing Arts in Hawaii
0.0%
30.0%
Zip Codes with the Highest Percentage of Population with a Degree in Visual and Performing Arts in Hawaii
| Zip Code | % Graduates | vs State | vs National | |
| 1. | 96757 | 28.7% | 4.7%(+24.0)#1 | 4.3%(+24.4)#242 |
| 2. | 96771 | 13.1% | 4.7%(+8.36)#2 | 4.3%(+8.81)#1,092 |
| 3. | 96857 | 12.5% | 4.7%(+7.79)#3 | 4.3%(+8.25)#1,185 |
| 4. | 96722 | 12.2% | 4.7%(+7.45)#4 | 4.3%(+7.90)#1,255 |
| 5. | 96719 | 11.0% | 4.7%(+6.31)#5 | 4.3%(+6.76)#1,526 |
| 6. | 96768 | 10.9% | 4.7%(+6.20)#6 | 4.3%(+6.66)#1,560 |
| 7. | 96708 | 10.8% | 4.7%(+6.08)#7 | 4.3%(+6.53)#1,597 |
| 8. | 96770 | 10.7% | 4.7%(+5.98)#8 | 4.3%(+6.43)#1,631 |
| 9. | 96790 | 9.3% | 4.7%(+4.55)#9 | 4.3%(+5.00)#2,137 |
| 10. | 96710 | 9.1% | 4.7%(+4.38)#10 | 4.3%(+4.84)#2,229 |
| 11. | 96761 | 8.6% | 4.7%(+3.94)#11 | 4.3%(+4.39)#2,449 |
| 12. | 96755 | 8.5% | 4.7%(+3.77)#12 | 4.3%(+4.22)#2,540 |
| 13. | 96728 | 8.4% | 4.7%(+3.70)#13 | 4.3%(+4.15)#2,601 |
| 14. | 96738 | 8.0% | 4.7%(+3.29)#14 | 4.3%(+3.74)#2,852 |
| 15. | 96813 | 7.5% | 4.7%(+2.83)#15 | 4.3%(+3.28)#3,185 |
| 16. | 96740 | 7.1% | 4.7%(+2.36)#16 | 4.3%(+2.81)#3,598 |
| 17. | 96822 | 6.8% | 4.7%(+2.13)#17 | 4.3%(+2.59)#3,833 |
| 18. | 96748 | 6.7% | 4.7%(+2.04)#18 | 4.3%(+2.49)#3,937 |
| 19. | 96815 | 6.6% | 4.7%(+1.93)#19 | 4.3%(+2.38)#4,080 |
| 20. | 96785 | 6.4% | 4.7%(+1.66)#20 | 4.3%(+2.11)#4,385 |
| 21. | 96793 | 6.3% | 4.7%(+1.61)#21 | 4.3%(+2.07)#4,449 |
| 22. | 96754 | 6.1% | 4.7%(+1.39)#22 | 4.3%(+1.84)#4,743 |
| 23. | 96777 | 6.0% | 4.7%(+1.34)#23 | 4.3%(+1.80)#4,805 |
| 24. | 96762 | 6.0% | 4.7%(+1.28)#24 | 4.3%(+1.73)#4,901 |
| 25. | 96703 | 5.9% | 4.7%(+1.21)#25 | 4.3%(+1.67)#4,982 |
| 26. | 96765 | 5.9% | 4.7%(+1.21)#26 | 4.3%(+1.66)#4,990 |
| 27. | 96817 | 5.6% | 4.7%(+0.935)#27 | 4.3%(+1.39)#5,423 |
| 28. | 96749 | 5.5% | 4.7%(+0.796)#28 | 4.3%(+1.25)#5,679 |
| 29. | 96746 | 5.4% | 4.7%(+0.742)#29 | 4.3%(+1.20)#5,769 |
| 30. | 96714 | 5.4% | 4.7%(+0.720)#30 | 4.3%(+1.17)#5,801 |
| 31. | 96816 | 5.4% | 4.7%(+0.691)#31 | 4.3%(+1.15)#5,867 |
| 32. | 96701 | 5.3% | 4.7%(+0.617)#32 | 4.3%(+1.07)#6,007 |
| 33. | 96819 | 5.3% | 4.7%(+0.589)#33 | 4.3%(+1.04)#6,063 |
| 34. | 96764 | 5.3% | 4.7%(+0.557)#34 | 4.3%(+1.01)#6,131 |
| 35. | 96750 | 5.0% | 4.7%(+0.300)#35 | 4.3%(+0.754)#6,616 |
| 36. | 96795 | 4.8% | 4.7%(+0.062)#36 | 4.3%(+0.516)#7,135 |
| 37. | 96786 | 4.7% | 4.7%(+0.035)#37 | 4.3%(+0.489)#7,215 |
| 38. | 96826 | 4.7% | 4.7%(-0.017)#38 | 4.3%(+0.437)#7,325 |
| 39. | 96778 | 4.5% | 4.7%(-0.159)#39 | 4.3%(+0.295)#7,670 |
| 40. | 96743 | 4.3% | 4.7%(-0.360)#40 | 4.3%(+0.094)#8,229 |
| 41. | 96792 | 4.3% | 4.7%(-0.382)#41 | 4.3%(+0.072)#8,289 |
| 42. | 96741 | 4.3% | 4.7%(-0.411)#42 | 4.3%(+0.043)#8,364 |
| 43. | 96752 | 4.2% | 4.7%(-0.493)#43 | 4.3%(-0.039)#8,586 |
| 44. | 96766 | 4.1% | 4.7%(-0.593)#44 | 4.3%(-0.139)#8,890 |
| 45. | 96707 | 4.1% | 4.7%(-0.596)#45 | 4.3%(-0.142)#8,907 |
| 46. | 96734 | 4.0% | 4.7%(-0.700)#46 | 4.3%(-0.246)#9,242 |
| 47. | 96731 | 4.0% | 4.7%(-0.706)#47 | 4.3%(-0.252)#9,261 |
| 48. | 96712 | 4.0% | 4.7%(-0.720)#48 | 4.3%(-0.266)#9,304 |
| 49. | 96725 | 3.9% | 4.7%(-0.815)#49 | 4.3%(-0.361)#9,606 |
| 50. | 96779 | 3.9% | 4.7%(-0.830)#50 | 4.3%(-0.376)#9,645 |
| 51. | 96763 | 3.9% | 4.7%(-0.854)#51 | 4.3%(-0.400)#9,725 |
| 52. | 96782 | 3.7% | 4.7%(-1.04)#52 | 4.3%(-0.582)#10,263 |
| 53. | 96744 | 3.7% | 4.7%(-1.05)#53 | 4.3%(-0.594)#10,313 |
| 54. | 96818 | 3.6% | 4.7%(-1.13)#54 | 4.3%(-0.672)#10,561 |
| 55. | 96825 | 3.6% | 4.7%(-1.15)#55 | 4.3%(-0.697)#10,680 |
| 56. | 96781 | 3.5% | 4.7%(-1.16)#56 | 4.3%(-0.709)#10,731 |
| 57. | 96706 | 3.5% | 4.7%(-1.20)#57 | 4.3%(-0.747)#10,861 |
| 58. | 96720 | 3.5% | 4.7%(-1.21)#58 | 4.3%(-0.758)#10,900 |
| 59. | 96730 | 3.4% | 4.7%(-1.28)#59 | 4.3%(-0.822)#11,150 |
| 60. | 96753 | 3.4% | 4.7%(-1.28)#60 | 4.3%(-0.831)#11,173 |
| 61. | 96717 | 3.3% | 4.7%(-1.38)#61 | 4.3%(-0.926)#11,515 |
| 62. | 96791 | 3.2% | 4.7%(-1.53)#62 | 4.3%(-1.08)#12,080 |
| 63. | 96756 | 3.0% | 4.7%(-1.74)#63 | 4.3%(-1.29)#12,852 |
| 64. | 96821 | 2.9% | 4.7%(-1.77)#64 | 4.3%(-1.31)#12,961 |
| 65. | 96797 | 2.8% | 4.7%(-1.87)#65 | 4.3%(-1.42)#13,361 |
| 66. | 96732 | 2.8% | 4.7%(-1.94)#66 | 4.3%(-1.49)#13,633 |
| 67. | 96848 | 2.6% | 4.7%(-2.06)#67 | 4.3%(-1.61)#14,103 |
| 68. | 96814 | 2.5% | 4.7%(-2.18)#68 | 4.3%(-1.73)#14,540 |
| 69. | 96727 | 2.5% | 4.7%(-2.22)#69 | 4.3%(-1.77)#14,674 |
| 70. | 96789 | 2.0% | 4.7%(-2.73)#70 | 4.3%(-2.28)#16,539 |
| 71. | 96772 | 1.7% | 4.7%(-2.98)#71 | 4.3%(-2.53)#17,397 |
| 72. | 96783 | 1.2% | 4.7%(-3.49)#72 | 4.3%(-3.04)#19,040 |
| 73. | 96704 | 1.2% | 4.7%(-3.53)#73 | 4.3%(-3.08)#19,165 |
| 74. | 96796 | 0.41% | 4.7%(-4.30)#74 | 4.3%(-3.85)#20,942 |
1
Common Questions
What are the Top 10 Zip Codes with the Highest Percentage of Population with a Degree in Visual and Performing Arts in Hawaii?
Top 10 Zip Codes with the Highest Percentage of Population with a Degree in Visual and Performing Arts in Hawaii are:
What zip code has the Highest Percentage of Population with a Degree in Visual and Performing Arts in Hawaii?
96757 has the Highest Percentage of Population with a Degree in Visual and Performing Arts in Hawaii with 28.7%.
What is the Percentage of Population with a Degree in Visual and Performing Arts in the State of Hawaii?
Percentage of Population with a Degree in Visual and Performing Arts in Hawaii is 4.7%.
What is the Percentage of Population with a Degree in Visual and Performing Arts in the United States?
Percentage of Population with a Degree in Visual and Performing Arts in the United States is 4.3%.