Zip Codes with the Highest Percentage of Population Employed in Installation, Maintenance & Repair in Hawaii
RELATED REPORTS & OPTIONS
Installation, Maintenance & Repair
Hawaii
Compare Zip Codes
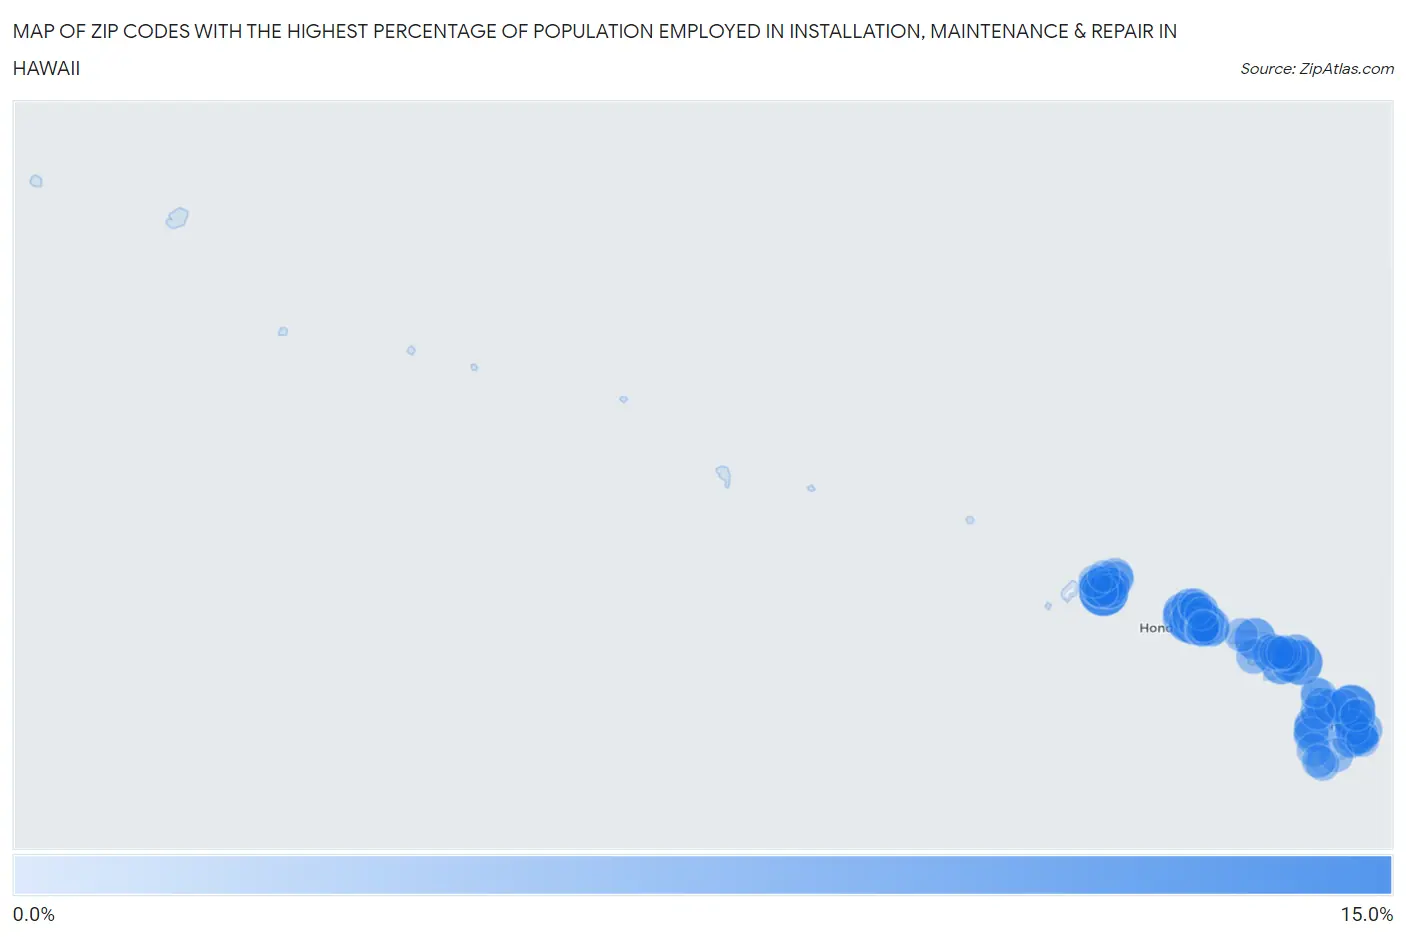
Map of Zip Codes with the Highest Percentage of Population Employed in Installation, Maintenance & Repair in Hawaii
0.0%
15.0%
Zip Codes with the Highest Percentage of Population Employed in Installation, Maintenance & Repair in Hawaii
| Zip Code | % Employed | vs State | vs National | |
| 1. | 96705 | 10.6% | 3.1%(+7.51)#1 | 3.1%(+7.56)#1,746 |
| 2. | 96780 | 9.6% | 3.1%(+6.51)#2 | 3.1%(+6.56)#2,187 |
| 3. | 96713 | 8.1% | 3.1%(+4.95)#3 | 3.1%(+5.00)#3,250 |
| 4. | 96748 | 6.1% | 3.1%(+2.97)#4 | 3.1%(+3.02)#5,939 |
| 5. | 96753 | 5.8% | 3.1%(+2.69)#5 | 3.1%(+2.74)#6,530 |
| 6. | 96717 | 5.5% | 3.1%(+2.35)#6 | 3.1%(+2.40)#7,347 |
| 7. | 96725 | 5.3% | 3.1%(+2.23)#7 | 3.1%(+2.28)#7,686 |
| 8. | 96860 | 5.3% | 3.1%(+2.14)#8 | 3.1%(+2.20)#7,905 |
| 9. | 96771 | 5.0% | 3.1%(+1.85)#9 | 3.1%(+1.90)#8,816 |
| 10. | 96792 | 5.0% | 3.1%(+1.83)#10 | 3.1%(+1.88)#8,882 |
| 11. | 96795 | 4.7% | 3.1%(+1.61)#11 | 3.1%(+1.66)#9,588 |
| 12. | 96708 | 4.6% | 3.1%(+1.52)#12 | 3.1%(+1.57)#9,897 |
| 13. | 96791 | 4.6% | 3.1%(+1.44)#13 | 3.1%(+1.50)#10,183 |
| 14. | 96786 | 4.3% | 3.1%(+1.15)#14 | 3.1%(+1.20)#11,260 |
| 15. | 96706 | 4.2% | 3.1%(+1.10)#15 | 3.1%(+1.15)#11,450 |
| 16. | 96701 | 4.2% | 3.1%(+1.07)#16 | 3.1%(+1.12)#11,540 |
| 17. | 96712 | 4.2% | 3.1%(+1.06)#17 | 3.1%(+1.12)#11,577 |
| 18. | 96785 | 4.2% | 3.1%(+1.06)#18 | 3.1%(+1.11)#11,617 |
| 19. | 96761 | 4.2% | 3.1%(+1.05)#19 | 3.1%(+1.10)#11,633 |
| 20. | 96797 | 4.0% | 3.1%(+0.924)#20 | 3.1%(+0.977)#12,160 |
| 21. | 96707 | 4.0% | 3.1%(+0.852)#21 | 3.1%(+0.904)#12,485 |
| 22. | 96765 | 3.9% | 3.1%(+0.781)#22 | 3.1%(+0.833)#12,803 |
| 23. | 96789 | 3.9% | 3.1%(+0.772)#23 | 3.1%(+0.825)#12,841 |
| 24. | 96790 | 3.7% | 3.1%(+0.581)#24 | 3.1%(+0.633)#13,674 |
| 25. | 96749 | 3.6% | 3.1%(+0.525)#25 | 3.1%(+0.578)#13,943 |
| 26. | 96781 | 3.6% | 3.1%(+0.520)#26 | 3.1%(+0.573)#13,977 |
| 27. | 96760 | 3.6% | 3.1%(+0.515)#27 | 3.1%(+0.568)#14,001 |
| 28. | 96782 | 3.6% | 3.1%(+0.514)#28 | 3.1%(+0.567)#14,009 |
| 29. | 96796 | 3.5% | 3.1%(+0.399)#29 | 3.1%(+0.451)#14,544 |
| 30. | 96819 | 3.4% | 3.1%(+0.277)#30 | 3.1%(+0.330)#15,097 |
| 31. | 96744 | 3.4% | 3.1%(+0.261)#31 | 3.1%(+0.313)#15,169 |
| 32. | 96703 | 3.3% | 3.1%(+0.194)#32 | 3.1%(+0.247)#15,482 |
| 33. | 96768 | 3.2% | 3.1%(+0.097)#33 | 3.1%(+0.150)#15,940 |
| 34. | 96740 | 3.2% | 3.1%(+0.051)#34 | 3.1%(+0.103)#16,172 |
| 35. | 96857 | 3.1% | 3.1%(+0.021)#35 | 3.1%(+0.074)#16,318 |
| 36. | 96755 | 3.1% | 3.1%(-0.042)#36 | 3.1%(+0.010)#16,621 |
| 37. | 96769 | 3.1% | 3.1%(-0.043)#37 | 3.1%(+0.009)#16,632 |
| 38. | 96783 | 3.0% | 3.1%(-0.086)#38 | 3.1%(-0.033)#16,817 |
| 39. | 96720 | 3.0% | 3.1%(-0.120)#39 | 3.1%(-0.068)#16,981 |
| 40. | 96747 | 2.9% | 3.1%(-0.256)#40 | 3.1%(-0.204)#17,692 |
| 41. | 96825 | 2.8% | 3.1%(-0.282)#41 | 3.1%(-0.230)#17,809 |
| 42. | 96743 | 2.8% | 3.1%(-0.344)#42 | 3.1%(-0.291)#18,133 |
| 43. | 96746 | 2.7% | 3.1%(-0.414)#43 | 3.1%(-0.361)#18,509 |
| 44. | 96727 | 2.7% | 3.1%(-0.425)#44 | 3.1%(-0.372)#18,572 |
| 45. | 96750 | 2.7% | 3.1%(-0.450)#45 | 3.1%(-0.398)#18,715 |
| 46. | 96766 | 2.7% | 3.1%(-0.468)#46 | 3.1%(-0.415)#18,809 |
| 47. | 96763 | 2.6% | 3.1%(-0.518)#47 | 3.1%(-0.466)#19,067 |
| 48. | 96741 | 2.5% | 3.1%(-0.616)#48 | 3.1%(-0.564)#19,534 |
| 49. | 96732 | 2.4% | 3.1%(-0.741)#49 | 3.1%(-0.689)#20,179 |
| 50. | 96776 | 2.4% | 3.1%(-0.753)#50 | 3.1%(-0.701)#20,231 |
| 51. | 96813 | 2.3% | 3.1%(-0.781)#51 | 3.1%(-0.729)#20,376 |
| 52. | 96738 | 2.3% | 3.1%(-0.796)#52 | 3.1%(-0.743)#20,451 |
| 53. | 96734 | 2.3% | 3.1%(-0.796)#53 | 3.1%(-0.744)#20,456 |
| 54. | 96793 | 2.3% | 3.1%(-0.824)#54 | 3.1%(-0.772)#20,590 |
| 55. | 96818 | 2.3% | 3.1%(-0.852)#55 | 3.1%(-0.800)#20,741 |
| 56. | 96814 | 2.2% | 3.1%(-0.919)#56 | 3.1%(-0.866)#21,079 |
| 57. | 96779 | 2.2% | 3.1%(-0.943)#57 | 3.1%(-0.891)#21,188 |
| 58. | 96777 | 2.2% | 3.1%(-0.968)#58 | 3.1%(-0.915)#21,294 |
| 59. | 96756 | 2.1% | 3.1%(-0.988)#59 | 3.1%(-0.936)#21,382 |
| 60. | 96772 | 2.0% | 3.1%(-1.08)#60 | 3.1%(-1.03)#21,845 |
| 61. | 96704 | 2.0% | 3.1%(-1.10)#61 | 3.1%(-1.05)#21,934 |
| 62. | 96816 | 2.0% | 3.1%(-1.15)#62 | 3.1%(-1.09)#22,136 |
| 63. | 96737 | 1.9% | 3.1%(-1.24)#63 | 3.1%(-1.19)#22,555 |
| 64. | 96729 | 1.8% | 3.1%(-1.31)#64 | 3.1%(-1.26)#22,844 |
| 65. | 96826 | 1.7% | 3.1%(-1.39)#65 | 3.1%(-1.34)#23,230 |
| 66. | 96731 | 1.7% | 3.1%(-1.40)#66 | 3.1%(-1.35)#23,250 |
| 67. | 96817 | 1.7% | 3.1%(-1.41)#67 | 3.1%(-1.35)#23,292 |
| 68. | 96778 | 1.7% | 3.1%(-1.45)#68 | 3.1%(-1.40)#23,480 |
| 69. | 96815 | 1.6% | 3.1%(-1.53)#69 | 3.1%(-1.48)#23,813 |
| 70. | 96821 | 1.6% | 3.1%(-1.55)#70 | 3.1%(-1.49)#23,876 |
| 71. | 96716 | 1.6% | 3.1%(-1.57)#71 | 3.1%(-1.51)#23,945 |
| 72. | 96752 | 1.5% | 3.1%(-1.67)#72 | 3.1%(-1.62)#24,357 |
| 73. | 96762 | 1.4% | 3.1%(-1.69)#73 | 3.1%(-1.64)#24,443 |
| 74. | 96730 | 1.2% | 3.1%(-1.93)#74 | 3.1%(-1.88)#25,308 |
| 75. | 96822 | 0.97% | 3.1%(-2.15)#75 | 3.1%(-2.10)#26,019 |
| 76. | 96728 | 0.96% | 3.1%(-2.16)#76 | 3.1%(-2.11)#26,041 |
| 77. | 96714 | 0.91% | 3.1%(-2.21)#77 | 3.1%(-2.16)#26,162 |
| 78. | 96719 | 0.35% | 3.1%(-2.77)#78 | 3.1%(-2.72)#27,486 |
1
Common Questions
What are the Top 10 Zip Codes with the Highest Percentage of Population Employed in Installation, Maintenance & Repair in Hawaii?
Top 10 Zip Codes with the Highest Percentage of Population Employed in Installation, Maintenance & Repair in Hawaii are:
What zip code has the Highest Percentage of Population Employed in Installation, Maintenance & Repair in Hawaii?
96705 has the Highest Percentage of Population Employed in Installation, Maintenance & Repair in Hawaii with 10.6%.
What is the Percentage of Population Employed in Installation, Maintenance & Repair in the State of Hawaii?
Percentage of Population Employed in Installation, Maintenance & Repair in Hawaii is 3.1%.
What is the Percentage of Population Employed in Installation, Maintenance & Repair in the United States?
Percentage of Population Employed in Installation, Maintenance & Repair in the United States is 3.1%.