Zip Codes with the Highest Percentage of Families with Income Below $10,000 in Hawaii
RELATED REPORTS & OPTIONS
Family Income | $0-10k
Hawaii
Compare Zip Codes
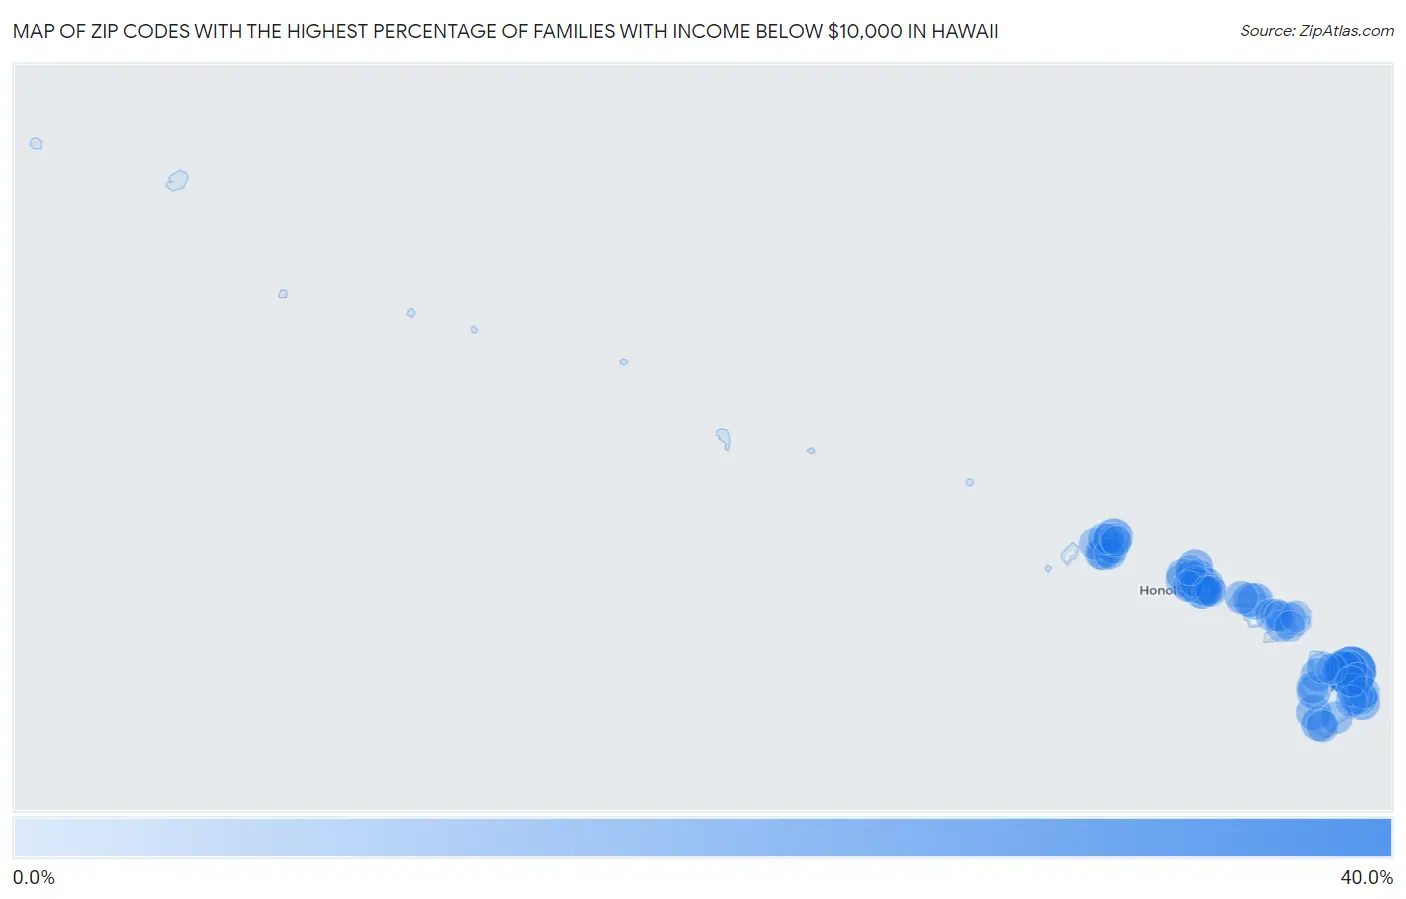
Map of Zip Codes with the Highest Percentage of Families with Income Below $10,000 in Hawaii
0.0%
40.0%
Zip Codes with the Highest Percentage of Families with Income Below $10,000 in Hawaii
| Zip Code | Families with Income < $10k | vs State | vs National | |
| 1. | 96780 | 31.4% | 2.5%(+28.9)#1 | 3.1%(+28.3)#175 |
| 2. | 96774 | 21.8% | 2.5%(+19.3)#2 | 3.1%(+18.7)#412 |
| 3. | 96754 | 12.4% | 2.5%(+9.90)#3 | 3.1%(+9.30)#1,239 |
| 4. | 96764 | 11.8% | 2.5%(+9.30)#4 | 3.1%(+8.70)#1,382 |
| 5. | 96748 | 9.8% | 2.5%(+7.30)#5 | 3.1%(+6.70)#2,001 |
| 6. | 96731 | 9.2% | 2.5%(+6.70)#6 | 3.1%(+6.10)#2,268 |
| 7. | 96776 | 8.2% | 2.5%(+5.70)#7 | 3.1%(+5.10)#2,879 |
| 8. | 96778 | 7.7% | 2.5%(+5.20)#8 | 3.1%(+4.60)#3,138 |
| 9. | 96704 | 7.6% | 2.5%(+5.10)#9 | 3.1%(+4.50)#3,221 |
| 10. | 96737 | 7.3% | 2.5%(+4.80)#10 | 3.1%(+4.20)#3,427 |
| 11. | 96814 | 7.0% | 2.5%(+4.50)#11 | 3.1%(+3.90)#3,632 |
| 12. | 96760 | 6.9% | 2.5%(+4.40)#12 | 3.1%(+3.80)#3,735 |
| 13. | 96757 | 6.3% | 2.5%(+3.80)#13 | 3.1%(+3.20)#4,391 |
| 14. | 96771 | 5.2% | 2.5%(+2.70)#14 | 3.1%(+2.10)#5,814 |
| 15. | 96725 | 5.2% | 2.5%(+2.70)#15 | 3.1%(+2.10)#5,832 |
| 16. | 96792 | 5.1% | 2.5%(+2.60)#16 | 3.1%(+2.00)#5,914 |
| 17. | 96738 | 5.0% | 2.5%(+2.50)#17 | 3.1%(+1.90)#6,144 |
| 18. | 96741 | 4.7% | 2.5%(+2.20)#18 | 3.1%(+1.60)#6,693 |
| 19. | 96705 | 4.3% | 2.5%(+1.80)#19 | 3.1%(+1.20)#7,540 |
| 20. | 96729 | 4.3% | 2.5%(+1.80)#20 | 3.1%(+1.20)#7,560 |
| 21. | 96815 | 4.2% | 2.5%(+1.70)#21 | 3.1%(+1.10)#7,676 |
| 22. | 96777 | 4.2% | 2.5%(+1.70)#22 | 3.1%(+1.10)#7,799 |
| 23. | 96768 | 3.7% | 2.5%(+1.20)#23 | 3.1%(+0.600)#9,008 |
| 24. | 96720 | 3.6% | 2.5%(+1.10)#24 | 3.1%(+0.500)#9,213 |
| 25. | 96826 | 3.4% | 2.5%(+0.900)#25 | 3.1%(+0.300)#9,809 |
| 26. | 96791 | 3.3% | 2.5%(+0.800)#26 | 3.1%(+0.200)#10,256 |
| 27. | 96740 | 3.0% | 2.5%(+0.500)#27 | 3.1%(-0.100)#11,103 |
| 28. | 96772 | 3.0% | 2.5%(+0.500)#28 | 3.1%(-0.100)#11,300 |
| 29. | 96761 | 2.9% | 2.5%(+0.400)#29 | 3.1%(-0.200)#11,519 |
| 30. | 96716 | 2.9% | 2.5%(+0.400)#30 | 3.1%(-0.200)#11,680 |
| 31. | 96743 | 2.8% | 2.5%(+0.300)#31 | 3.1%(-0.300)#11,943 |
| 32. | 96752 | 2.8% | 2.5%(+0.300)#32 | 3.1%(-0.300)#12,046 |
| 33. | 96819 | 2.7% | 2.5%(+0.200)#33 | 3.1%(-0.400)#12,202 |
| 34. | 96786 | 2.7% | 2.5%(+0.200)#34 | 3.1%(-0.400)#12,225 |
| 35. | 96797 | 2.6% | 2.5%(+0.100)#35 | 3.1%(-0.500)#12,582 |
| 36. | 96822 | 2.6% | 2.5%(+0.100)#36 | 3.1%(-0.500)#12,614 |
| 37. | 96793 | 2.6% | 2.5%(+0.100)#37 | 3.1%(-0.500)#12,645 |
| 38. | 96818 | 2.5% | 2.5%(=0.000)#38 | 3.1%(-0.600)#13,021 |
| 39. | 96766 | 2.5% | 2.5%(=0.000)#39 | 3.1%(-0.600)#13,157 |
| 40. | 96783 | 2.5% | 2.5%(=0.000)#40 | 3.1%(-0.600)#13,330 |
| 41. | 96749 | 2.4% | 2.5%(-0.100)#41 | 3.1%(-0.700)#13,556 |
| 42. | 96744 | 2.2% | 2.5%(-0.300)#42 | 3.1%(-0.900)#14,313 |
| 43. | 96817 | 2.2% | 2.5%(-0.300)#43 | 3.1%(-0.900)#14,314 |
| 44. | 96714 | 2.1% | 2.5%(-0.400)#44 | 3.1%(-1.000)#15,156 |
| 45. | 96782 | 2.0% | 2.5%(-0.500)#45 | 3.1%(-1.10)#15,286 |
| 46. | 96753 | 2.0% | 2.5%(-0.500)#46 | 3.1%(-1.10)#15,324 |
| 47. | 96785 | 2.0% | 2.5%(-0.500)#47 | 3.1%(-1.10)#15,530 |
| 48. | 96816 | 1.9% | 2.5%(-0.600)#48 | 3.1%(-1.20)#15,730 |
| 49. | 96732 | 1.7% | 2.5%(-0.800)#49 | 3.1%(-1.40)#16,788 |
| 50. | 96717 | 1.7% | 2.5%(-0.800)#50 | 3.1%(-1.40)#16,971 |
| 51. | 96734 | 1.6% | 2.5%(-0.900)#51 | 3.1%(-1.50)#17,189 |
| 52. | 96708 | 1.6% | 2.5%(-0.900)#52 | 3.1%(-1.50)#17,370 |
| 53. | 96813 | 1.5% | 2.5%(-1.00)#53 | 3.1%(-1.60)#17,765 |
| 54. | 96701 | 1.4% | 2.5%(-1.10)#54 | 3.1%(-1.70)#18,186 |
| 55. | 96756 | 1.4% | 2.5%(-1.10)#55 | 3.1%(-1.70)#18,433 |
| 56. | 96722 | 1.4% | 2.5%(-1.10)#56 | 3.1%(-1.70)#18,526 |
| 57. | 96706 | 1.3% | 2.5%(-1.20)#57 | 3.1%(-1.80)#18,653 |
| 58. | 96789 | 1.1% | 2.5%(-1.40)#58 | 3.1%(-2.00)#19,698 |
| 59. | 96795 | 1.0% | 2.5%(-1.50)#59 | 3.1%(-2.10)#20,395 |
| 60. | 96707 | 0.90% | 2.5%(-1.60)#60 | 3.1%(-2.20)#20,711 |
| 61. | 96790 | 0.90% | 2.5%(-1.60)#61 | 3.1%(-2.20)#20,891 |
| 62. | 96825 | 0.80% | 2.5%(-1.70)#62 | 3.1%(-2.30)#21,236 |
| 63. | 96727 | 0.80% | 2.5%(-1.70)#63 | 3.1%(-2.30)#21,434 |
| 64. | 96703 | 0.80% | 2.5%(-1.70)#64 | 3.1%(-2.30)#21,478 |
| 65. | 96746 | 0.50% | 2.5%(-2.00)#65 | 3.1%(-2.60)#22,662 |
| 66. | 96821 | 0.50% | 2.5%(-2.00)#66 | 3.1%(-2.60)#22,670 |
| 67. | 96712 | 0.40% | 2.5%(-2.10)#67 | 3.1%(-2.70)#23,138 |
| 68. | 96781 | 0.20% | 2.5%(-2.30)#68 | 3.1%(-2.90)#23,799 |
1
Common Questions
What are the Top 10 Zip Codes with the Highest Percentage of Families with Income Below $10,000 in Hawaii?
Top 10 Zip Codes with the Highest Percentage of Families with Income Below $10,000 in Hawaii are:
What zip code has the Highest Percentage of Families with Income Below $10,000 in Hawaii?
96780 has the Highest Percentage of Families with Income Below $10,000 in Hawaii with 31.4%.
What is the Percentage of Families with Income Below $10,000 in the State of Hawaii?
Percentage of Families with Income Below $10,000 in Hawaii is 2.5%.
What is the Percentage of Families with Income Below $10,000 in the United States?
Percentage of Families with Income Below $10,000 in the United States is 3.1%.