Zip Codes with the Highest Percentage of Population Employed in Education Instruction & Library in Hawaii
RELATED REPORTS & OPTIONS
Education Instruction & Library
Hawaii
Compare Zip Codes
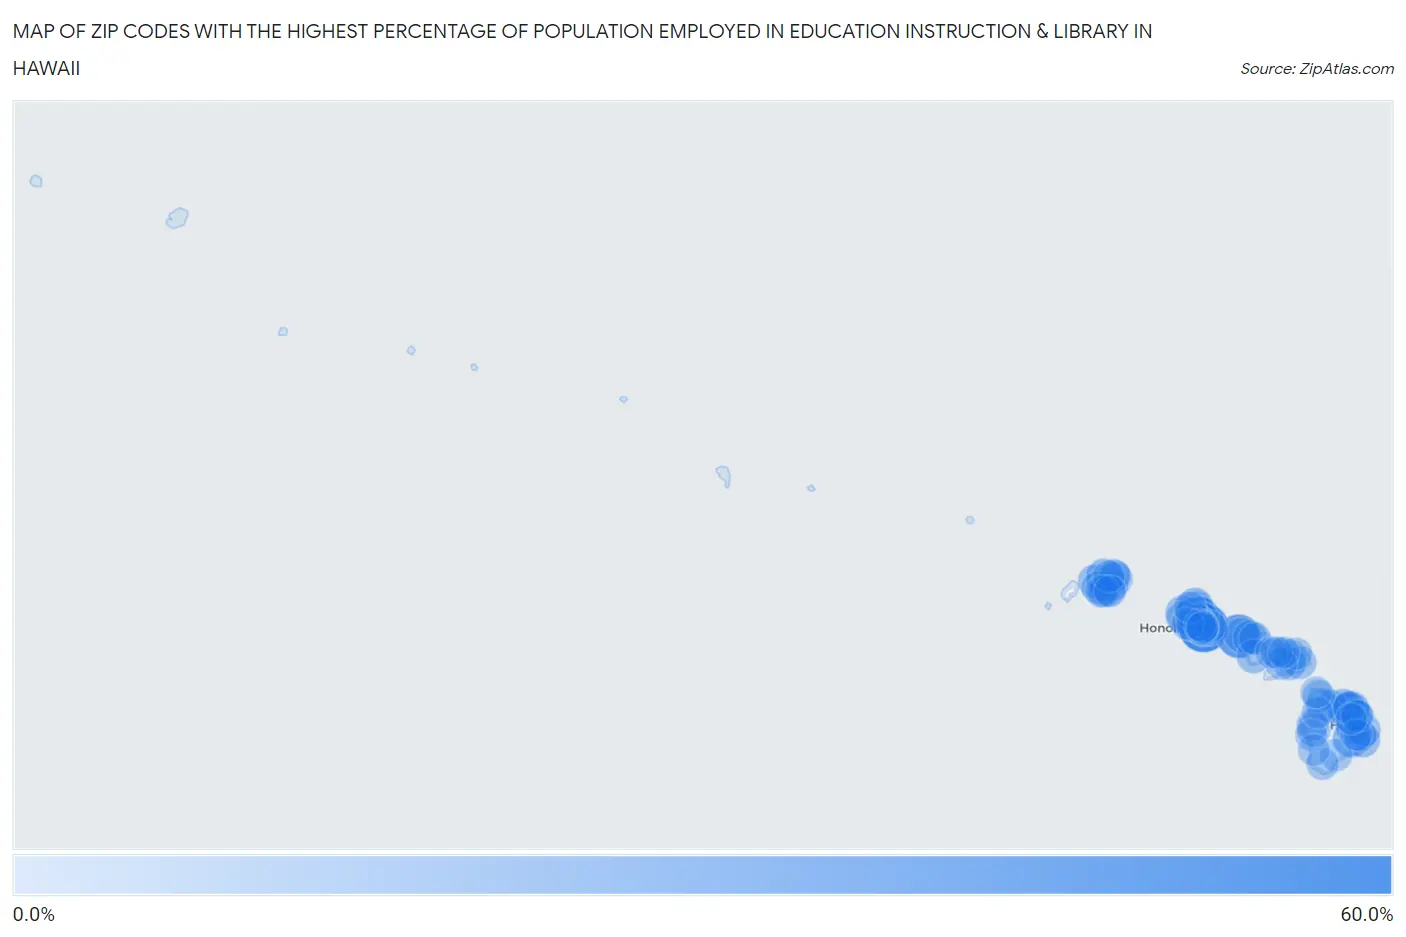
Map of Zip Codes with the Highest Percentage of Population Employed in Education Instruction & Library in Hawaii
0.0%
60.0%
Zip Codes with the Highest Percentage of Population Employed in Education Instruction & Library in Hawaii
| Zip Code | % Employed | vs State | vs National | |
| 1. | 96848 | 53.0% | 6.8%(+46.2)#1 | 6.2%(+46.8)#53 |
| 2. | 96770 | 36.4% | 6.8%(+29.6)#2 | 6.2%(+30.2)#160 |
| 3. | 96773 | 24.1% | 6.8%(+17.3)#3 | 6.2%(+18.0)#403 |
| 4. | 96785 | 18.5% | 6.8%(+11.7)#4 | 6.2%(+12.3)#787 |
| 5. | 96780 | 14.1% | 6.8%(+7.26)#5 | 6.2%(+7.89)#1,528 |
| 6. | 96714 | 13.3% | 6.8%(+6.51)#6 | 6.2%(+7.14)#1,782 |
| 7. | 96762 | 13.3% | 6.8%(+6.49)#7 | 6.2%(+7.12)#1,787 |
| 8. | 96778 | 12.3% | 6.8%(+5.53)#8 | 6.2%(+6.16)#2,215 |
| 9. | 96729 | 11.9% | 6.8%(+5.06)#9 | 6.2%(+5.69)#2,462 |
| 10. | 96776 | 11.8% | 6.8%(+5.02)#10 | 6.2%(+5.65)#2,485 |
| 11. | 96731 | 11.8% | 6.8%(+4.97)#11 | 6.2%(+5.60)#2,510 |
| 12. | 96730 | 11.6% | 6.8%(+4.78)#12 | 6.2%(+5.41)#2,640 |
| 13. | 96757 | 10.9% | 6.8%(+4.11)#13 | 6.2%(+4.74)#3,116 |
| 14. | 96763 | 10.4% | 6.8%(+3.59)#14 | 6.2%(+4.22)#3,547 |
| 15. | 96752 | 10.2% | 6.8%(+3.42)#15 | 6.2%(+4.05)#3,701 |
| 16. | 96791 | 10.2% | 6.8%(+3.37)#16 | 6.2%(+4.00)#3,752 |
| 17. | 96717 | 10.1% | 6.8%(+3.30)#17 | 6.2%(+3.93)#3,819 |
| 18. | 96822 | 10.0% | 6.8%(+3.15)#18 | 6.2%(+3.78)#3,974 |
| 19. | 96720 | 9.7% | 6.8%(+2.93)#19 | 6.2%(+3.56)#4,238 |
| 20. | 96749 | 9.2% | 6.8%(+2.42)#20 | 6.2%(+3.05)#4,895 |
| 21. | 96768 | 9.0% | 6.8%(+2.19)#21 | 6.2%(+2.82)#5,224 |
| 22. | 96725 | 8.7% | 6.8%(+1.91)#22 | 6.2%(+2.54)#5,688 |
| 23. | 96789 | 8.7% | 6.8%(+1.86)#23 | 6.2%(+2.49)#5,777 |
| 24. | 96826 | 8.6% | 6.8%(+1.74)#24 | 6.2%(+2.37)#6,003 |
| 25. | 96734 | 8.5% | 6.8%(+1.71)#25 | 6.2%(+2.34)#6,051 |
| 26. | 96821 | 8.5% | 6.8%(+1.69)#26 | 6.2%(+2.32)#6,095 |
| 27. | 96816 | 8.3% | 6.8%(+1.44)#27 | 6.2%(+2.07)#6,602 |
| 28. | 96765 | 8.2% | 6.8%(+1.34)#28 | 6.2%(+1.97)#6,820 |
| 29. | 96825 | 7.9% | 6.8%(+1.13)#29 | 6.2%(+1.76)#7,299 |
| 30. | 96743 | 7.9% | 6.8%(+1.10)#30 | 6.2%(+1.73)#7,355 |
| 31. | 96760 | 7.8% | 6.8%(+1.03)#31 | 6.2%(+1.66)#7,506 |
| 32. | 96792 | 7.4% | 6.8%(+0.627)#32 | 6.2%(+1.26)#8,600 |
| 33. | 96727 | 7.4% | 6.8%(+0.621)#33 | 6.2%(+1.25)#8,612 |
| 34. | 96713 | 7.3% | 6.8%(+0.521)#34 | 6.2%(+1.15)#8,893 |
| 35. | 96744 | 7.1% | 6.8%(+0.325)#35 | 6.2%(+0.956)#9,458 |
| 36. | 96746 | 7.1% | 6.8%(+0.290)#36 | 6.2%(+0.920)#9,581 |
| 37. | 96728 | 6.7% | 6.8%(-0.115)#37 | 6.2%(+0.515)#10,904 |
| 38. | 96764 | 6.6% | 6.8%(-0.184)#38 | 6.2%(+0.446)#11,139 |
| 39. | 96815 | 6.6% | 6.8%(-0.205)#39 | 6.2%(+0.426)#11,224 |
| 40. | 96701 | 6.4% | 6.8%(-0.374)#40 | 6.2%(+0.256)#11,820 |
| 41. | 96782 | 6.4% | 6.8%(-0.452)#41 | 6.2%(+0.178)#12,125 |
| 42. | 96818 | 6.3% | 6.8%(-0.560)#42 | 6.2%(+0.071)#12,546 |
| 43. | 96766 | 6.2% | 6.8%(-0.569)#43 | 6.2%(+0.062)#12,601 |
| 44. | 96797 | 6.2% | 6.8%(-0.605)#44 | 6.2%(+0.026)#12,725 |
| 45. | 96777 | 6.1% | 6.8%(-0.688)#45 | 6.2%(-0.058)#13,032 |
| 46. | 96795 | 6.1% | 6.8%(-0.712)#46 | 6.2%(-0.082)#13,111 |
| 47. | 96786 | 6.1% | 6.8%(-0.716)#47 | 6.2%(-0.085)#13,124 |
| 48. | 96783 | 6.1% | 6.8%(-0.745)#48 | 6.2%(-0.114)#13,230 |
| 49. | 96706 | 6.0% | 6.8%(-0.824)#49 | 6.2%(-0.193)#13,534 |
| 50. | 96790 | 5.9% | 6.8%(-0.897)#50 | 6.2%(-0.267)#13,823 |
| 51. | 96741 | 5.9% | 6.8%(-0.936)#51 | 6.2%(-0.305)#13,986 |
| 52. | 96748 | 5.9% | 6.8%(-0.963)#52 | 6.2%(-0.332)#14,102 |
| 53. | 96755 | 5.8% | 6.8%(-0.972)#53 | 6.2%(-0.342)#14,138 |
| 54. | 96772 | 5.8% | 6.8%(-1.03)#54 | 6.2%(-0.396)#14,362 |
| 55. | 96817 | 5.7% | 6.8%(-1.11)#55 | 6.2%(-0.480)#14,720 |
| 56. | 96814 | 5.7% | 6.8%(-1.15)#56 | 6.2%(-0.523)#14,925 |
| 57. | 96707 | 5.6% | 6.8%(-1.17)#57 | 6.2%(-0.542)#14,987 |
| 58. | 96754 | 5.4% | 6.8%(-1.39)#58 | 6.2%(-0.756)#15,864 |
| 59. | 96796 | 5.2% | 6.8%(-1.63)#59 | 6.2%(-1.00)#16,864 |
| 60. | 96712 | 5.1% | 6.8%(-1.67)#60 | 6.2%(-1.04)#16,991 |
| 61. | 96732 | 5.0% | 6.8%(-1.80)#61 | 6.2%(-1.17)#17,575 |
| 62. | 96703 | 5.0% | 6.8%(-1.80)#62 | 6.2%(-1.17)#17,601 |
| 63. | 96708 | 5.0% | 6.8%(-1.81)#63 | 6.2%(-1.18)#17,627 |
| 64. | 96705 | 4.9% | 6.8%(-1.91)#64 | 6.2%(-1.28)#18,052 |
| 65. | 96716 | 4.8% | 6.8%(-2.00)#65 | 6.2%(-1.37)#18,426 |
| 66. | 96740 | 4.8% | 6.8%(-2.01)#66 | 6.2%(-1.38)#18,485 |
| 67. | 96819 | 4.7% | 6.8%(-2.07)#67 | 6.2%(-1.44)#18,755 |
| 68. | 96753 | 4.7% | 6.8%(-2.11)#68 | 6.2%(-1.48)#18,916 |
| 69. | 96722 | 4.7% | 6.8%(-2.12)#69 | 6.2%(-1.49)#18,960 |
| 70. | 96750 | 4.6% | 6.8%(-2.24)#70 | 6.2%(-1.61)#19,424 |
| 71. | 96813 | 4.4% | 6.8%(-2.43)#71 | 6.2%(-1.80)#20,202 |
| 72. | 96761 | 4.2% | 6.8%(-2.56)#72 | 6.2%(-1.93)#20,707 |
| 73. | 96704 | 4.2% | 6.8%(-2.58)#73 | 6.2%(-1.95)#20,792 |
| 74. | 96756 | 4.2% | 6.8%(-2.63)#74 | 6.2%(-2.00)#20,964 |
| 75. | 96793 | 4.2% | 6.8%(-2.65)#75 | 6.2%(-2.02)#21,067 |
| 76. | 96738 | 3.9% | 6.8%(-2.94)#76 | 6.2%(-2.31)#22,122 |
| 77. | 96771 | 3.9% | 6.8%(-2.96)#77 | 6.2%(-2.33)#22,195 |
| 78. | 96719 | 3.7% | 6.8%(-3.13)#78 | 6.2%(-2.50)#22,771 |
| 79. | 96779 | 3.3% | 6.8%(-3.51)#79 | 6.2%(-2.88)#24,011 |
| 80. | 96781 | 3.2% | 6.8%(-3.63)#80 | 6.2%(-3.00)#24,390 |
1
Common Questions
What are the Top 10 Zip Codes with the Highest Percentage of Population Employed in Education Instruction & Library in Hawaii?
Top 10 Zip Codes with the Highest Percentage of Population Employed in Education Instruction & Library in Hawaii are:
What zip code has the Highest Percentage of Population Employed in Education Instruction & Library in Hawaii?
96848 has the Highest Percentage of Population Employed in Education Instruction & Library in Hawaii with 53.0%.
What is the Percentage of Population Employed in Education Instruction & Library in the State of Hawaii?
Percentage of Population Employed in Education Instruction & Library in Hawaii is 6.8%.
What is the Percentage of Population Employed in Education Instruction & Library in the United States?
Percentage of Population Employed in Education Instruction & Library in the United States is 6.2%.