Zip Codes with the Highest Percentage of Guamanian / Chamorro Population in Hawaii
RELATED REPORTS & OPTIONS
Guamanian / Chamorro
Hawaii
Compare Zip Codes
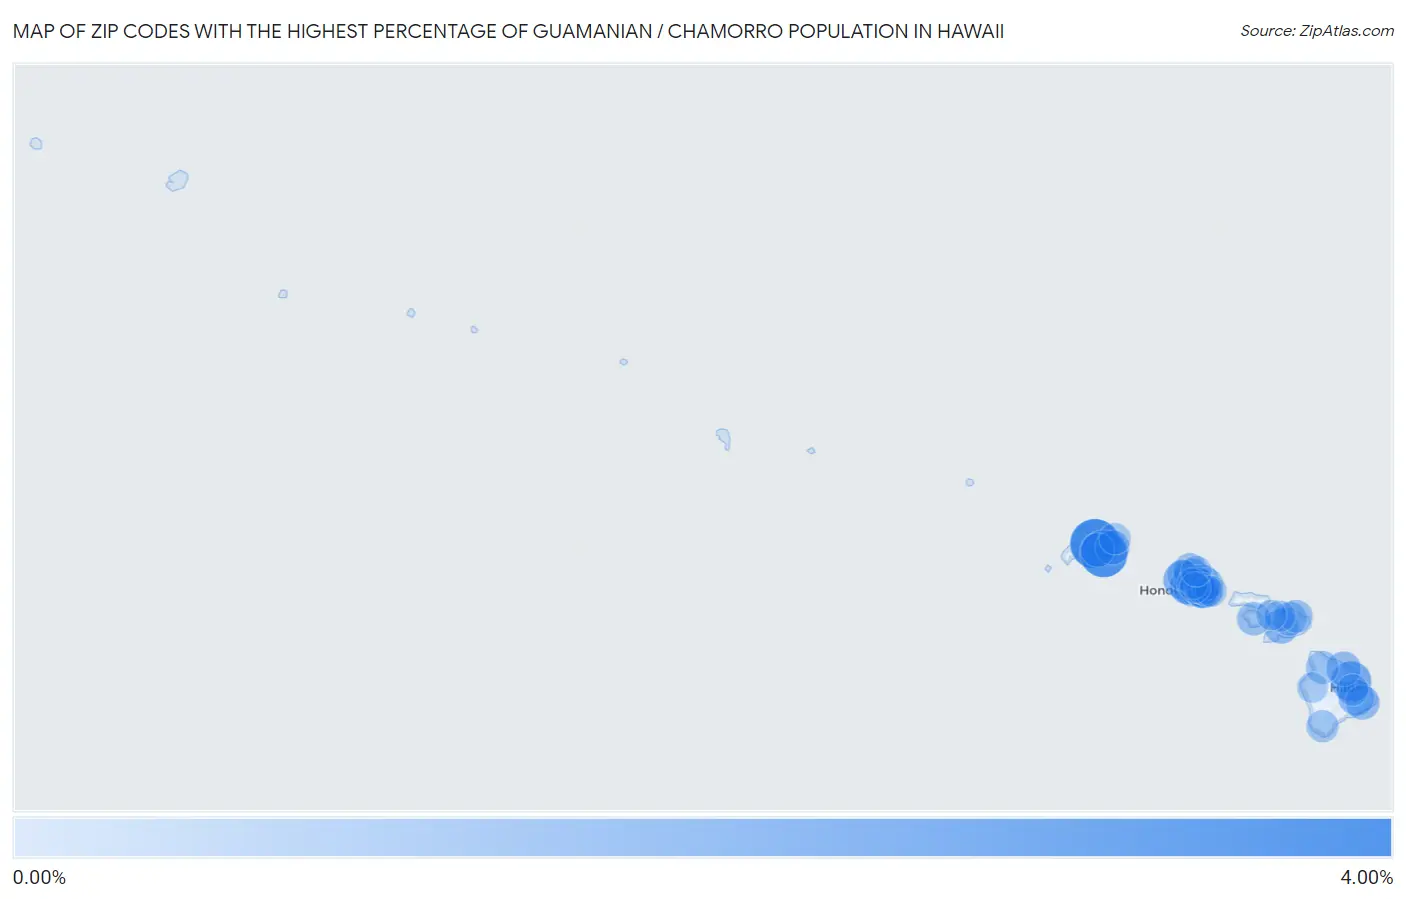
Map of Zip Codes with the Highest Percentage of Guamanian / Chamorro Population in Hawaii
0.00%
4.00%
Zip Codes with the Highest Percentage of Guamanian / Chamorro Population in Hawaii
| Zip Code | Guamanian / Chamorro | vs State | vs National | |
| 1. | 96752 | 3.42% | 0.46%(+2.96)#1 | 0.047%(+3.37)#22 |
| 2. | 96705 | 3.00% | 0.46%(+2.54)#2 | 0.047%(+2.95)#28 |
| 3. | 96781 | 1.72% | 0.46%(+1.26)#3 | 0.047%(+1.67)#67 |
| 4. | 96792 | 1.37% | 0.46%(+0.917)#4 | 0.047%(+1.33)#89 |
| 5. | 96706 | 1.28% | 0.46%(+0.826)#5 | 0.047%(+1.24)#103 |
| 6. | 96818 | 1.12% | 0.46%(+0.662)#6 | 0.047%(+1.07)#135 |
| 7. | 96707 | 1.02% | 0.46%(+0.566)#7 | 0.047%(+0.977)#155 |
| 8. | 96771 | 0.95% | 0.46%(+0.496)#8 | 0.047%(+0.907)#169 |
| 9. | 96786 | 0.86% | 0.46%(+0.400)#9 | 0.047%(+0.811)#203 |
| 10. | 96753 | 0.79% | 0.46%(+0.331)#10 | 0.047%(+0.742)#231 |
| 11. | 96776 | 0.73% | 0.46%(+0.272)#11 | 0.047%(+0.683)#253 |
| 12. | 96778 | 0.71% | 0.46%(+0.248)#12 | 0.047%(+0.659)#265 |
| 13. | 96766 | 0.64% | 0.46%(+0.178)#13 | 0.047%(+0.590)#300 |
| 14. | 96796 | 0.62% | 0.46%(+0.157)#14 | 0.047%(+0.569)#321 |
| 15. | 96768 | 0.60% | 0.46%(+0.142)#15 | 0.047%(+0.554)#339 |
| 16. | 96712 | 0.59% | 0.46%(+0.128)#16 | 0.047%(+0.540)#350 |
| 17. | 96744 | 0.57% | 0.46%(+0.117)#17 | 0.047%(+0.528)#356 |
| 18. | 96763 | 0.56% | 0.46%(+0.102)#18 | 0.047%(+0.513)#372 |
| 19. | 96816 | 0.54% | 0.46%(+0.078)#19 | 0.047%(+0.489)#397 |
| 20. | 96789 | 0.50% | 0.46%(+0.043)#20 | 0.047%(+0.454)#423 |
| 21. | 96813 | 0.48% | 0.46%(+0.024)#21 | 0.047%(+0.435)#435 |
| 22. | 96814 | 0.44% | 0.46%(-0.013)#22 | 0.047%(+0.398)#474 |
| 23. | 96708 | 0.44% | 0.46%(-0.015)#23 | 0.047%(+0.397)#475 |
| 24. | 96743 | 0.43% | 0.46%(-0.024)#24 | 0.047%(+0.388)#487 |
| 25. | 96826 | 0.34% | 0.46%(-0.122)#25 | 0.047%(+0.289)#622 |
| 26. | 96772 | 0.33% | 0.46%(-0.126)#26 | 0.047%(+0.285)#628 |
| 27. | 96782 | 0.31% | 0.46%(-0.145)#27 | 0.047%(+0.266)#672 |
| 28. | 96815 | 0.30% | 0.46%(-0.162)#28 | 0.047%(+0.250)#709 |
| 29. | 96822 | 0.27% | 0.46%(-0.187)#29 | 0.047%(+0.224)#779 |
| 30. | 96720 | 0.27% | 0.46%(-0.192)#30 | 0.047%(+0.219)#802 |
| 31. | 96701 | 0.26% | 0.46%(-0.193)#31 | 0.047%(+0.218)#806 |
| 32. | 96817 | 0.24% | 0.46%(-0.221)#32 | 0.047%(+0.190)#890 |
| 33. | 96734 | 0.23% | 0.46%(-0.223)#33 | 0.047%(+0.188)#902 |
| 34. | 96703 | 0.19% | 0.46%(-0.266)#34 | 0.047%(+0.145)#1,076 |
| 35. | 96819 | 0.18% | 0.46%(-0.280)#35 | 0.047%(+0.131)#1,154 |
| 36. | 96821 | 0.13% | 0.46%(-0.330)#36 | 0.047%(+0.081)#1,435 |
| 37. | 96732 | 0.13% | 0.46%(-0.330)#37 | 0.047%(+0.081)#1,439 |
| 38. | 96791 | 0.12% | 0.46%(-0.333)#38 | 0.047%(+0.078)#1,461 |
| 39. | 96825 | 0.11% | 0.46%(-0.353)#39 | 0.047%(+0.059)#1,627 |
| 40. | 96797 | 0.099% | 0.46%(-0.359)#40 | 0.047%(+0.053)#1,688 |
| 41. | 96860 | 0.075% | 0.46%(-0.383)#41 | 0.047%(+0.028)#1,931 |
| 42. | 96762 | 0.069% | 0.46%(-0.388)#42 | 0.047%(+0.023)#1,993 |
| 43. | 96740 | 0.044% | 0.46%(-0.414)#43 | 0.047%(-0.003)#2,354 |
| 44. | 96761 | 0.034% | 0.46%(-0.423)#44 | 0.047%(-0.012)#2,529 |
1
Common Questions
What are the Top 10 Zip Codes with the Highest Percentage of Guamanian / Chamorro Population in Hawaii?
Top 10 Zip Codes with the Highest Percentage of Guamanian / Chamorro Population in Hawaii are:
What zip code has the Highest Percentage of Guamanian / Chamorro Population in Hawaii?
96752 has the Highest Percentage of Guamanian / Chamorro Population in Hawaii with 3.42%.
What is the Percentage of Guamanian / Chamorro Population in the State of Hawaii?
Percentage of Guamanian / Chamorro Population in Hawaii is 0.46%.
What is the Percentage of Guamanian / Chamorro Population in the United States?
Percentage of Guamanian / Chamorro Population in the United States is 0.047%.