Zip Codes with the Highest Percentage of Population Employed in Construction & Extraction in Hawaii
RELATED REPORTS & OPTIONS
Construction & Extraction
Hawaii
Compare Zip Codes
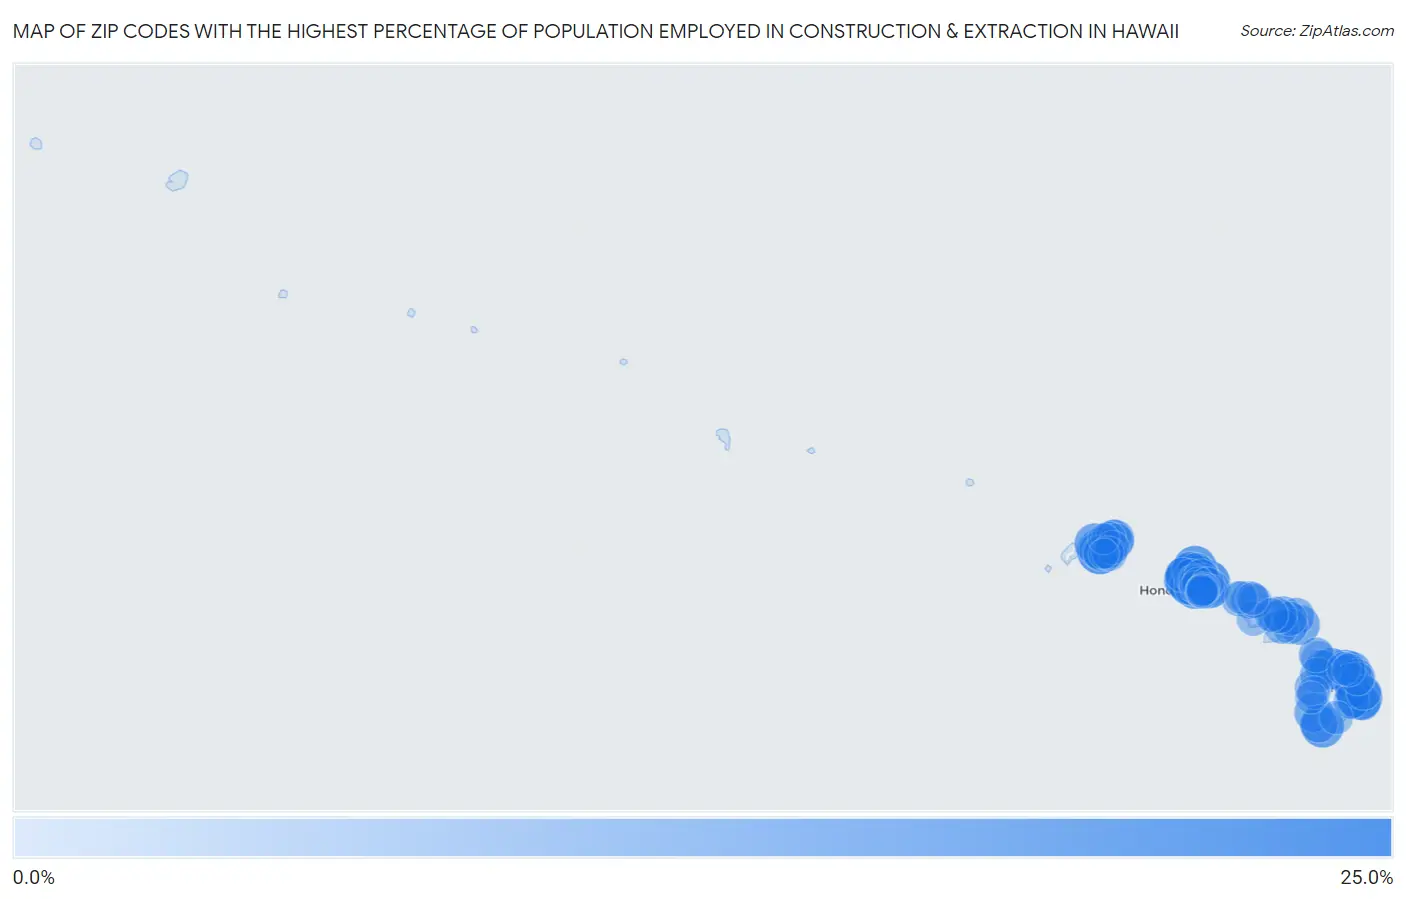
Map of Zip Codes with the Highest Percentage of Population Employed in Construction & Extraction in Hawaii
0.0%
25.0%
Zip Codes with the Highest Percentage of Population Employed in Construction & Extraction in Hawaii
| Zip Code | % Employed | vs State | vs National | |
| 1. | 96857 | 23.0% | 5.3%(+17.7)#1 | 5.0%(+18.0)#721 |
| 2. | 96769 | 18.5% | 5.3%(+13.2)#2 | 5.0%(+13.5)#1,223 |
| 3. | 96863 | 17.6% | 5.3%(+12.3)#3 | 5.0%(+12.7)#1,349 |
| 4. | 96760 | 17.1% | 5.3%(+11.8)#4 | 5.0%(+12.1)#1,451 |
| 5. | 96731 | 15.4% | 5.3%(+10.1)#5 | 5.0%(+10.4)#1,872 |
| 6. | 96774 | 15.2% | 5.3%(+9.93)#6 | 5.0%(+10.2)#1,934 |
| 7. | 96860 | 14.7% | 5.3%(+9.43)#7 | 5.0%(+9.74)#2,141 |
| 8. | 96772 | 14.7% | 5.3%(+9.38)#8 | 5.0%(+9.69)#2,163 |
| 9. | 96727 | 13.5% | 5.3%(+8.17)#9 | 5.0%(+8.48)#2,717 |
| 10. | 96752 | 12.5% | 5.3%(+7.21)#10 | 5.0%(+7.52)#3,238 |
| 11. | 96741 | 11.5% | 5.3%(+6.16)#11 | 5.0%(+6.47)#3,983 |
| 12. | 96780 | 11.1% | 5.3%(+5.80)#12 | 5.0%(+6.12)#4,274 |
| 13. | 96713 | 11.0% | 5.3%(+5.70)#13 | 5.0%(+6.01)#4,363 |
| 14. | 96771 | 10.8% | 5.3%(+5.48)#14 | 5.0%(+5.80)#4,569 |
| 15. | 96795 | 10.6% | 5.3%(+5.25)#15 | 5.0%(+5.56)#4,799 |
| 16. | 96717 | 10.2% | 5.3%(+4.85)#16 | 5.0%(+5.17)#5,214 |
| 17. | 96704 | 10.1% | 5.3%(+4.76)#17 | 5.0%(+5.07)#5,325 |
| 18. | 96703 | 9.5% | 5.3%(+4.23)#18 | 5.0%(+4.55)#5,982 |
| 19. | 96737 | 8.9% | 5.3%(+3.58)#19 | 5.0%(+3.90)#6,931 |
| 20. | 96728 | 8.6% | 5.3%(+3.31)#20 | 5.0%(+3.62)#7,400 |
| 21. | 96757 | 8.5% | 5.3%(+3.23)#21 | 5.0%(+3.54)#7,532 |
| 22. | 96792 | 8.4% | 5.3%(+3.07)#22 | 5.0%(+3.39)#7,800 |
| 23. | 96779 | 8.1% | 5.3%(+2.84)#23 | 5.0%(+3.15)#8,192 |
| 24. | 96708 | 7.7% | 5.3%(+2.37)#24 | 5.0%(+2.68)#9,152 |
| 25. | 96796 | 7.6% | 5.3%(+2.32)#25 | 5.0%(+2.63)#9,265 |
| 26. | 96793 | 7.4% | 5.3%(+2.11)#26 | 5.0%(+2.42)#9,723 |
| 27. | 96707 | 7.3% | 5.3%(+2.04)#27 | 5.0%(+2.35)#9,884 |
| 28. | 96712 | 7.2% | 5.3%(+1.92)#28 | 5.0%(+2.23)#10,181 |
| 29. | 96762 | 7.2% | 5.3%(+1.87)#29 | 5.0%(+2.19)#10,288 |
| 30. | 96781 | 7.1% | 5.3%(+1.75)#30 | 5.0%(+2.06)#10,603 |
| 31. | 96797 | 6.8% | 5.3%(+1.46)#31 | 5.0%(+1.78)#11,309 |
| 32. | 96706 | 6.8% | 5.3%(+1.46)#32 | 5.0%(+1.77)#11,322 |
| 33. | 96778 | 6.6% | 5.3%(+1.25)#33 | 5.0%(+1.56)#11,896 |
| 34. | 96754 | 6.4% | 5.3%(+1.07)#34 | 5.0%(+1.38)#12,380 |
| 35. | 96740 | 6.2% | 5.3%(+0.922)#35 | 5.0%(+1.23)#12,798 |
| 36. | 96819 | 6.2% | 5.3%(+0.872)#36 | 5.0%(+1.19)#12,971 |
| 37. | 96746 | 6.2% | 5.3%(+0.859)#37 | 5.0%(+1.17)#13,010 |
| 38. | 96755 | 6.1% | 5.3%(+0.786)#38 | 5.0%(+1.10)#13,222 |
| 39. | 96790 | 6.1% | 5.3%(+0.761)#39 | 5.0%(+1.07)#13,290 |
| 40. | 96744 | 5.9% | 5.3%(+0.578)#40 | 5.0%(+0.891)#13,807 |
| 41. | 96716 | 5.7% | 5.3%(+0.443)#41 | 5.0%(+0.756)#14,223 |
| 42. | 96720 | 5.7% | 5.3%(+0.439)#42 | 5.0%(+0.752)#14,239 |
| 43. | 96743 | 5.7% | 5.3%(+0.400)#43 | 5.0%(+0.713)#14,362 |
| 44. | 96785 | 5.7% | 5.3%(+0.363)#44 | 5.0%(+0.676)#14,479 |
| 45. | 96738 | 5.7% | 5.3%(+0.346)#45 | 5.0%(+0.659)#14,530 |
| 46. | 96770 | 5.6% | 5.3%(+0.249)#46 | 5.0%(+0.562)#14,858 |
| 47. | 96753 | 5.5% | 5.3%(+0.207)#47 | 5.0%(+0.520)#14,977 |
| 48. | 96719 | 5.4% | 5.3%(+0.132)#48 | 5.0%(+0.445)#15,262 |
| 49. | 96749 | 5.3% | 5.3%(-0.017)#49 | 5.0%(+0.296)#15,753 |
| 50. | 96817 | 5.2% | 5.3%(-0.128)#50 | 5.0%(+0.185)#16,124 |
| 51. | 96747 | 5.1% | 5.3%(-0.176)#51 | 5.0%(+0.137)#16,267 |
| 52. | 96786 | 5.0% | 5.3%(-0.316)#52 | 5.0%(-0.003)#16,789 |
| 53. | 96791 | 4.9% | 5.3%(-0.370)#53 | 5.0%(-0.058)#16,985 |
| 54. | 96789 | 4.9% | 5.3%(-0.384)#54 | 5.0%(-0.072)#17,029 |
| 55. | 96722 | 4.8% | 5.3%(-0.509)#55 | 5.0%(-0.196)#17,438 |
| 56. | 96768 | 4.7% | 5.3%(-0.608)#56 | 5.0%(-0.295)#17,793 |
| 57. | 96763 | 4.5% | 5.3%(-0.812)#57 | 5.0%(-0.500)#18,525 |
| 58. | 96782 | 4.5% | 5.3%(-0.820)#58 | 5.0%(-0.508)#18,565 |
| 59. | 96730 | 4.5% | 5.3%(-0.849)#59 | 5.0%(-0.536)#18,667 |
| 60. | 96756 | 4.5% | 5.3%(-0.849)#60 | 5.0%(-0.537)#18,669 |
| 61. | 96732 | 4.4% | 5.3%(-0.876)#61 | 5.0%(-0.563)#18,765 |
| 62. | 96821 | 4.3% | 5.3%(-0.994)#62 | 5.0%(-0.681)#19,169 |
| 63. | 96748 | 4.1% | 5.3%(-1.17)#63 | 5.0%(-0.857)#19,830 |
| 64. | 96761 | 4.1% | 5.3%(-1.25)#64 | 5.0%(-0.935)#20,117 |
| 65. | 96783 | 3.7% | 5.3%(-1.58)#65 | 5.0%(-1.27)#21,280 |
| 66. | 96776 | 3.7% | 5.3%(-1.61)#66 | 5.0%(-1.30)#21,361 |
| 67. | 96777 | 3.6% | 5.3%(-1.66)#67 | 5.0%(-1.35)#21,540 |
| 68. | 96766 | 3.6% | 5.3%(-1.70)#68 | 5.0%(-1.39)#21,669 |
| 69. | 96816 | 3.6% | 5.3%(-1.72)#69 | 5.0%(-1.41)#21,722 |
| 70. | 96818 | 3.5% | 5.3%(-1.86)#70 | 5.0%(-1.54)#22,156 |
| 71. | 96725 | 3.4% | 5.3%(-1.94)#71 | 5.0%(-1.62)#22,418 |
| 72. | 96701 | 3.3% | 5.3%(-1.96)#72 | 5.0%(-1.64)#22,481 |
| 73. | 96764 | 3.3% | 5.3%(-1.99)#73 | 5.0%(-1.68)#22,588 |
| 74. | 96825 | 3.3% | 5.3%(-2.03)#74 | 5.0%(-1.72)#22,715 |
| 75. | 96734 | 3.2% | 5.3%(-2.12)#75 | 5.0%(-1.81)#23,002 |
| 76. | 96826 | 3.1% | 5.3%(-2.23)#76 | 5.0%(-1.92)#23,344 |
| 77. | 96729 | 3.0% | 5.3%(-2.29)#77 | 5.0%(-1.98)#23,546 |
| 78. | 96822 | 2.9% | 5.3%(-2.37)#78 | 5.0%(-2.05)#23,764 |
| 79. | 96765 | 2.8% | 5.3%(-2.47)#79 | 5.0%(-2.16)#24,070 |
| 80. | 96742 | 2.8% | 5.3%(-2.53)#80 | 5.0%(-2.22)#24,257 |
| 81. | 96815 | 2.4% | 5.3%(-2.88)#81 | 5.0%(-2.57)#25,239 |
| 82. | 96750 | 2.3% | 5.3%(-3.02)#82 | 5.0%(-2.71)#25,590 |
| 83. | 96814 | 2.0% | 5.3%(-3.32)#83 | 5.0%(-3.01)#26,365 |
| 84. | 96813 | 2.0% | 5.3%(-3.35)#84 | 5.0%(-3.04)#26,451 |
| 85. | 96714 | 0.73% | 5.3%(-4.58)#85 | 5.0%(-4.26)#28,688 |
| 86. | 96705 | 0.083% | 5.3%(-5.22)#86 | 5.0%(-4.91)#29,149 |
1
Common Questions
What are the Top 10 Zip Codes with the Highest Percentage of Population Employed in Construction & Extraction in Hawaii?
Top 10 Zip Codes with the Highest Percentage of Population Employed in Construction & Extraction in Hawaii are:
What zip code has the Highest Percentage of Population Employed in Construction & Extraction in Hawaii?
96857 has the Highest Percentage of Population Employed in Construction & Extraction in Hawaii with 23.0%.
What is the Percentage of Population Employed in Construction & Extraction in the State of Hawaii?
Percentage of Population Employed in Construction & Extraction in Hawaii is 5.3%.
What is the Percentage of Population Employed in Construction & Extraction in the United States?
Percentage of Population Employed in Construction & Extraction in the United States is 5.0%.