Zip Codes with the Highest Percentage of Households Without a Vehicle in Hawaii
RELATED REPORTS & OPTIONS
Households without a Cars
Hawaii
Compare Zip Codes
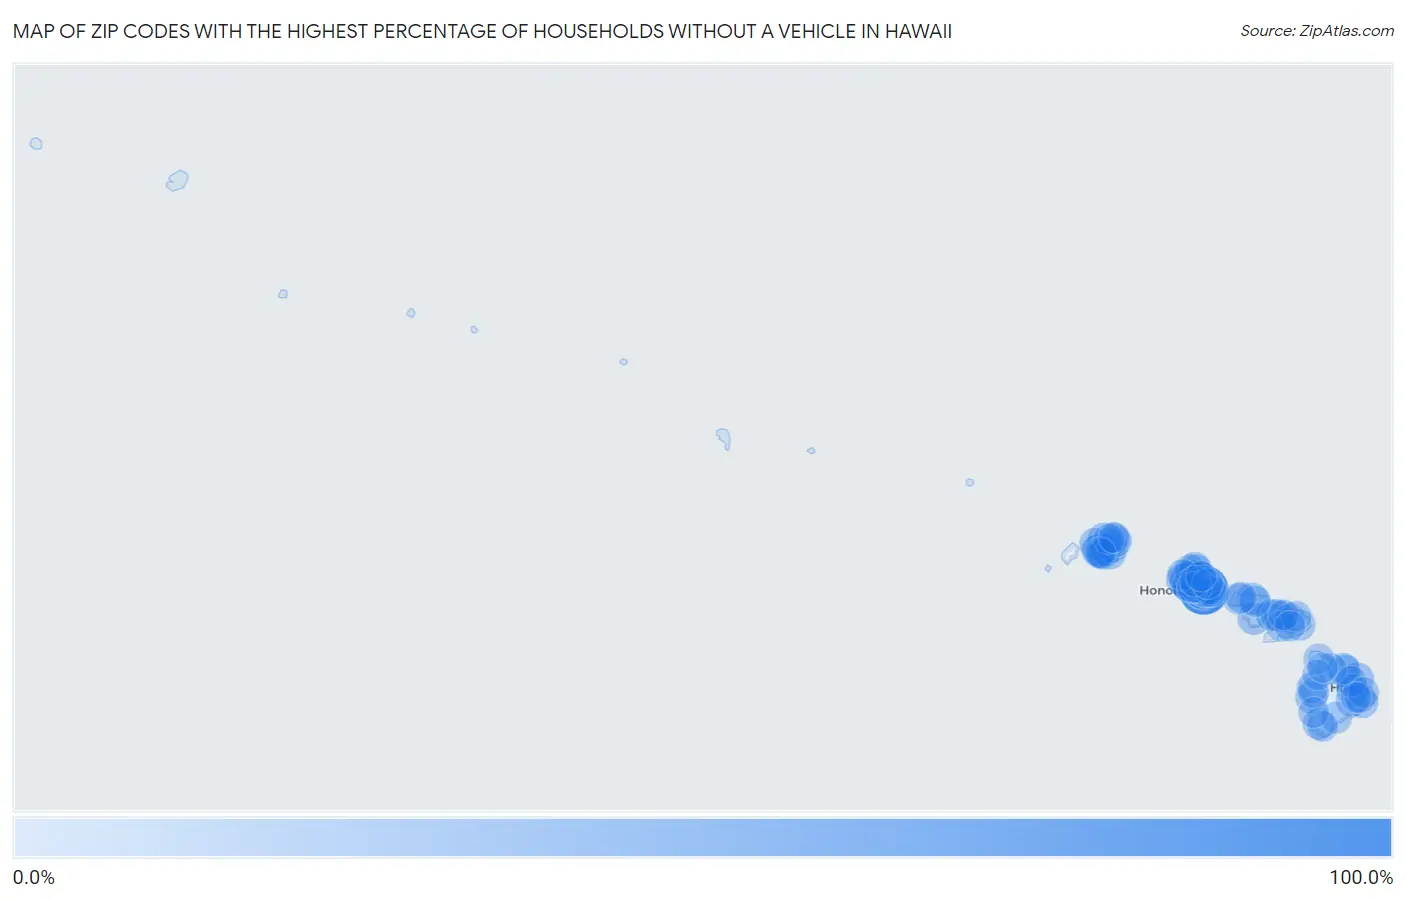
Map of Zip Codes with the Highest Percentage of Households Without a Vehicle in Hawaii
0.0%
100.0%
Zip Codes with the Highest Percentage of Households Without a Vehicle in Hawaii
| Zip Code | Housholds Without a Car | vs State | vs National | |
| 1. | 96848 | 100.0% | 8.1%(+91.9)#1 | 8.3%(+91.7)#16 |
| 2. | 96759 | 49.5% | 8.1%(+41.4)#2 | 8.3%(+41.2)#352 |
| 3. | 96815 | 27.2% | 8.1%(+19.1)#3 | 8.3%(+18.9)#926 |
| 4. | 96826 | 25.0% | 8.1%(+16.9)#4 | 8.3%(+16.7)#1,065 |
| 5. | 96814 | 23.2% | 8.1%(+15.1)#5 | 8.3%(+14.9)#1,194 |
| 6. | 96817 | 21.7% | 8.1%(+13.6)#6 | 8.3%(+13.4)#1,323 |
| 7. | 96769 | 21.3% | 8.1%(+13.2)#7 | 8.3%(+13.0)#1,361 |
| 8. | 96813 | 17.4% | 8.1%(+9.30)#8 | 8.3%(+9.10)#1,874 |
| 9. | 96819 | 12.8% | 8.1%(+4.70)#9 | 8.3%(+4.50)#3,174 |
| 10. | 96762 | 12.7% | 8.1%(+4.60)#10 | 8.3%(+4.40)#3,240 |
| 11. | 96792 | 11.9% | 8.1%(+3.80)#11 | 8.3%(+3.60)#3,599 |
| 12. | 96783 | 11.9% | 8.1%(+3.80)#12 | 8.3%(+3.60)#3,639 |
| 13. | 96763 | 11.4% | 8.1%(+3.30)#13 | 8.3%(+3.10)#3,910 |
| 14. | 96822 | 11.0% | 8.1%(+2.90)#14 | 8.3%(+2.70)#4,126 |
| 15. | 96774 | 10.4% | 8.1%(+2.30)#15 | 8.3%(+2.10)#4,613 |
| 16. | 96742 | 9.4% | 8.1%(+1.30)#16 | 8.3%(+1.10)#5,412 |
| 17. | 96714 | 8.8% | 8.1%(+0.700)#17 | 8.3%(+0.500)#6,026 |
| 18. | 96720 | 8.5% | 8.1%(+0.400)#18 | 8.3%(+0.200)#6,299 |
| 19. | 96750 | 8.4% | 8.1%(+0.300)#19 | 8.3%(+0.100)#6,481 |
| 20. | 96816 | 8.3% | 8.1%(+0.200)#20 | 8.3%(=0.000)#6,525 |
| 21. | 96737 | 8.2% | 8.1%(+0.100)#21 | 8.3%(-0.100)#6,711 |
| 22. | 96796 | 7.8% | 8.1%(-0.300)#22 | 8.3%(-0.500)#7,309 |
| 23. | 96797 | 7.2% | 8.1%(-0.900)#23 | 8.3%(-1.10)#8,183 |
| 24. | 96786 | 6.9% | 8.1%(-1.20)#24 | 8.3%(-1.40)#8,694 |
| 25. | 96732 | 6.9% | 8.1%(-1.20)#25 | 8.3%(-1.40)#8,713 |
| 26. | 96782 | 6.8% | 8.1%(-1.30)#26 | 8.3%(-1.50)#8,850 |
| 27. | 96717 | 6.7% | 8.1%(-1.40)#27 | 8.3%(-1.60)#9,099 |
| 28. | 96777 | 6.7% | 8.1%(-1.40)#28 | 8.3%(-1.60)#9,128 |
| 29. | 96776 | 6.7% | 8.1%(-1.40)#29 | 8.3%(-1.60)#9,132 |
| 30. | 96752 | 6.5% | 8.1%(-1.60)#30 | 8.3%(-1.80)#9,479 |
| 31. | 96761 | 6.4% | 8.1%(-1.70)#31 | 8.3%(-1.90)#9,589 |
| 32. | 96770 | 6.0% | 8.1%(-2.10)#32 | 8.3%(-2.30)#10,621 |
| 33. | 96740 | 5.5% | 8.1%(-2.60)#33 | 8.3%(-2.80)#11,596 |
| 34. | 96793 | 5.5% | 8.1%(-2.60)#34 | 8.3%(-2.80)#11,615 |
| 35. | 96756 | 5.5% | 8.1%(-2.60)#35 | 8.3%(-2.80)#11,707 |
| 36. | 96785 | 5.3% | 8.1%(-2.80)#36 | 8.3%(-3.00)#12,207 |
| 37. | 96778 | 5.2% | 8.1%(-2.90)#37 | 8.3%(-3.10)#12,390 |
| 38. | 96741 | 5.2% | 8.1%(-2.90)#38 | 8.3%(-3.10)#12,437 |
| 39. | 96701 | 4.9% | 8.1%(-3.20)#39 | 8.3%(-3.40)#13,082 |
| 40. | 96748 | 4.9% | 8.1%(-3.20)#40 | 8.3%(-3.40)#13,193 |
| 41. | 96727 | 4.8% | 8.1%(-3.30)#41 | 8.3%(-3.50)#13,492 |
| 42. | 96705 | 4.8% | 8.1%(-3.30)#42 | 8.3%(-3.50)#13,529 |
| 43. | 96766 | 4.7% | 8.1%(-3.40)#43 | 8.3%(-3.60)#13,691 |
| 44. | 96821 | 4.6% | 8.1%(-3.50)#44 | 8.3%(-3.70)#13,951 |
| 45. | 96712 | 4.6% | 8.1%(-3.50)#45 | 8.3%(-3.70)#14,007 |
| 46. | 96713 | 4.5% | 8.1%(-3.60)#46 | 8.3%(-3.80)#14,399 |
| 47. | 96731 | 4.4% | 8.1%(-3.70)#47 | 8.3%(-3.90)#14,644 |
| 48. | 96707 | 4.3% | 8.1%(-3.80)#48 | 8.3%(-4.00)#14,767 |
| 49. | 96795 | 4.3% | 8.1%(-3.80)#49 | 8.3%(-4.00)#14,864 |
| 50. | 96744 | 4.2% | 8.1%(-3.90)#50 | 8.3%(-4.10)#15,078 |
| 51. | 96760 | 4.2% | 8.1%(-3.90)#51 | 8.3%(-4.10)#15,224 |
| 52. | 96825 | 4.0% | 8.1%(-4.10)#52 | 8.3%(-4.30)#15,719 |
| 53. | 96818 | 3.7% | 8.1%(-4.40)#53 | 8.3%(-4.60)#16,627 |
| 54. | 96791 | 3.7% | 8.1%(-4.40)#54 | 8.3%(-4.60)#16,776 |
| 55. | 96703 | 3.7% | 8.1%(-4.40)#55 | 8.3%(-4.60)#16,826 |
| 56. | 96781 | 3.5% | 8.1%(-4.60)#56 | 8.3%(-4.80)#17,535 |
| 57. | 96746 | 3.3% | 8.1%(-4.80)#57 | 8.3%(-5.00)#18,029 |
| 58. | 96729 | 3.2% | 8.1%(-4.90)#58 | 8.3%(-5.10)#18,565 |
| 59. | 96768 | 2.9% | 8.1%(-5.20)#59 | 8.3%(-5.40)#19,444 |
| 60. | 96772 | 2.8% | 8.1%(-5.30)#60 | 8.3%(-5.50)#19,914 |
| 61. | 96753 | 2.7% | 8.1%(-5.40)#61 | 8.3%(-5.60)#20,100 |
| 62. | 96725 | 2.5% | 8.1%(-5.60)#62 | 8.3%(-5.80)#20,861 |
| 63. | 96706 | 2.4% | 8.1%(-5.70)#63 | 8.3%(-5.90)#21,022 |
| 64. | 96716 | 2.4% | 8.1%(-5.70)#64 | 8.3%(-5.90)#21,216 |
| 65. | 96722 | 2.4% | 8.1%(-5.70)#65 | 8.3%(-5.90)#21,220 |
| 66. | 96789 | 2.3% | 8.1%(-5.80)#66 | 8.3%(-6.00)#21,351 |
| 67. | 96734 | 2.0% | 8.1%(-6.10)#67 | 8.3%(-6.30)#22,420 |
| 68. | 96708 | 2.0% | 8.1%(-6.10)#68 | 8.3%(-6.30)#22,494 |
| 69. | 96704 | 2.0% | 8.1%(-6.10)#69 | 8.3%(-6.30)#22,507 |
| 70. | 96747 | 2.0% | 8.1%(-6.10)#70 | 8.3%(-6.30)#22,637 |
| 71. | 96749 | 1.9% | 8.1%(-6.20)#71 | 8.3%(-6.40)#22,800 |
| 72. | 96771 | 1.9% | 8.1%(-6.20)#72 | 8.3%(-6.40)#22,852 |
| 73. | 96754 | 1.9% | 8.1%(-6.20)#73 | 8.3%(-6.40)#22,891 |
| 74. | 96755 | 1.6% | 8.1%(-6.50)#74 | 8.3%(-6.70)#23,887 |
| 75. | 96779 | 1.5% | 8.1%(-6.60)#75 | 8.3%(-6.80)#24,243 |
| 76. | 96738 | 1.4% | 8.1%(-6.70)#76 | 8.3%(-6.90)#24,483 |
| 77. | 96743 | 0.80% | 8.1%(-7.30)#77 | 8.3%(-7.50)#26,113 |
| 78. | 96730 | 0.60% | 8.1%(-7.50)#78 | 8.3%(-7.70)#26,677 |
| 79. | 96790 | 0.50% | 8.1%(-7.60)#79 | 8.3%(-7.80)#26,813 |
1
Common Questions
What are the Top 10 Zip Codes with the Highest Percentage of Households Without a Vehicle in Hawaii?
Top 10 Zip Codes with the Highest Percentage of Households Without a Vehicle in Hawaii are:
What zip code has the Highest Percentage of Households Without a Vehicle in Hawaii?
96848 has the Highest Percentage of Households Without a Vehicle in Hawaii with 100.0%.
What is the Percentage of Households Without a Vehicle in the State of Hawaii?
Percentage of Households Without a Vehicle in Hawaii is 8.1%.
What is the Percentage of Households Without a Vehicle in the United States?
Percentage of Households Without a Vehicle in the United States is 8.3%.