Wilkinson County, GA Map & Demographics
Wilkinson County Map
Wilkinson County Overview
$24,070
PER CAPITA INCOME
$56,607
AVG FAMILY INCOME
$40,757
AVG HOUSEHOLD INCOME
19.6%
WAGE / INCOME GAP [ % ]
80.4¢/ $1
WAGE / INCOME GAP [ $ ]
$13,286
FAMILY INCOME DEFICIT
0.49
INEQUALITY / GINI INDEX
8,852
TOTAL POPULATION
4,233
MALE POPULATION
4,619
FEMALE POPULATION
91.64
MALES / 100 FEMALES
109.12
FEMALES / 100 MALES
42.2
MEDIAN AGE
3.5
AVG FAMILY SIZE
2.6
AVG HOUSEHOLD SIZE
3,454
LABOR FORCE [ PEOPLE ]
48.9%
PERCENT IN LABOR FORCE
5.8%
UNEMPLOYMENT RATE
Wilkinson County Area Codes
Income in Wilkinson County
Income Overview in Wilkinson County
Per Capita Income in Wilkinson County is $24,070, while median incomes of families and households are $56,607 and $40,757 respectively.
| Characteristic | Number | Measure |
| Per Capita Income | 8,852 | $24,070 |
| Median Family Income | 2,011 | $56,607 |
| Mean Family Income | 2,011 | $69,969 |
| Median Household Income | 3,313 | $40,757 |
| Mean Household Income | 3,313 | $57,529 |
| Income Deficit | 2,011 | $13,286 |
| Wage / Income Gap (%) | 8,852 | 19.61% |
| Wage / Income Gap ($) | 8,852 | 80.39¢ per $1 |
| Gini / Inequality Index | 8,852 | 0.49 |
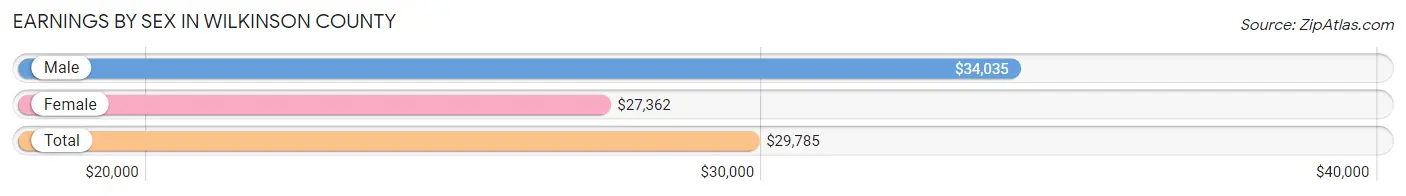
Earnings by Sex in Wilkinson County
Average Earnings in Wilkinson County are $29,785, $34,035 for men and $27,362 for women, a difference of 19.6%.
| Sex | Number | Average Earnings |
| Male | 1,885 (50.1%) | $34,035 |
| Female | 1,879 (49.9%) | $27,362 |
| Total | 3,764 (100.0%) | $29,785 |
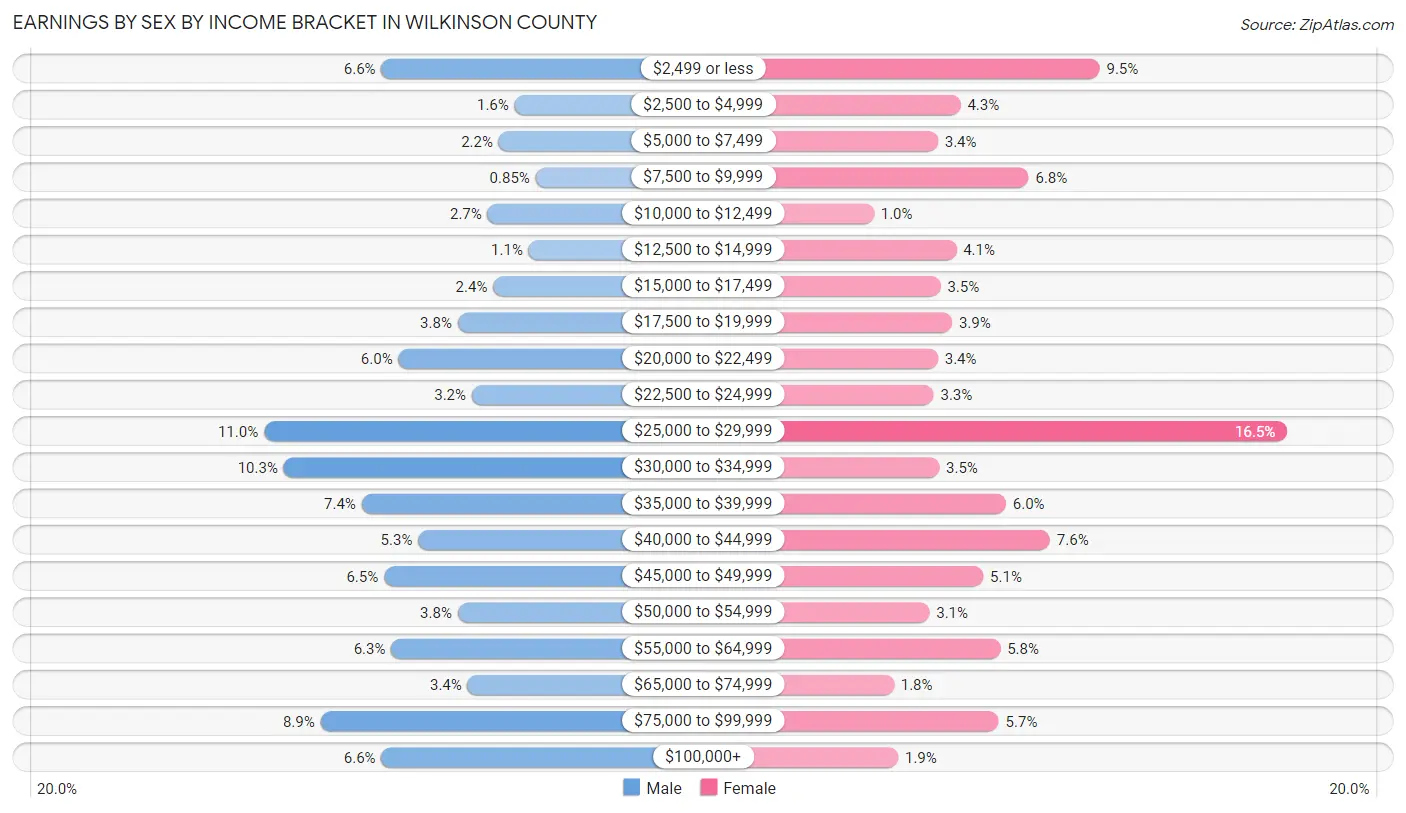
Earnings by Sex by Income Bracket in Wilkinson County
The most common earnings brackets in Wilkinson County are $25,000 to $29,999 for men (208 | 11.0%) and $25,000 to $29,999 for women (310 | 16.5%).
| Income | Male | Female |
| $2,499 or less | 125 (6.6%) | 178 (9.5%) |
| $2,500 to $4,999 | 31 (1.6%) | 80 (4.3%) |
| $5,000 to $7,499 | 42 (2.2%) | 64 (3.4%) |
| $7,500 to $9,999 | 16 (0.9%) | 128 (6.8%) |
| $10,000 to $12,499 | 50 (2.6%) | 19 (1.0%) |
| $12,500 to $14,999 | 21 (1.1%) | 77 (4.1%) |
| $15,000 to $17,499 | 46 (2.4%) | 66 (3.5%) |
| $17,500 to $19,999 | 71 (3.8%) | 74 (3.9%) |
| $20,000 to $22,499 | 113 (6.0%) | 64 (3.4%) |
| $22,500 to $24,999 | 61 (3.2%) | 61 (3.3%) |
| $25,000 to $29,999 | 208 (11.0%) | 310 (16.5%) |
| $30,000 to $34,999 | 194 (10.3%) | 65 (3.5%) |
| $35,000 to $39,999 | 139 (7.4%) | 112 (6.0%) |
| $40,000 to $44,999 | 99 (5.2%) | 143 (7.6%) |
| $45,000 to $49,999 | 123 (6.5%) | 96 (5.1%) |
| $50,000 to $54,999 | 71 (3.8%) | 58 (3.1%) |
| $55,000 to $64,999 | 118 (6.3%) | 108 (5.8%) |
| $65,000 to $74,999 | 64 (3.4%) | 33 (1.8%) |
| $75,000 to $99,999 | 168 (8.9%) | 107 (5.7%) |
| $100,000+ | 125 (6.6%) | 36 (1.9%) |
| Total | 1,885 (100.0%) | 1,879 (100.0%) |
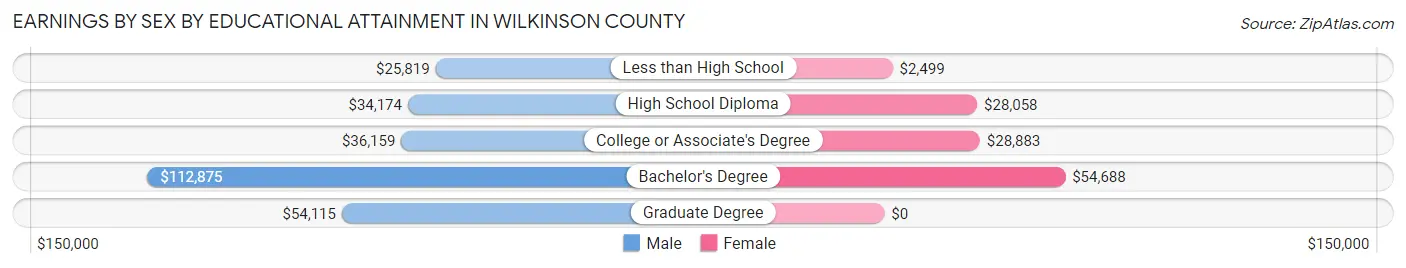
Earnings by Sex by Educational Attainment in Wilkinson County
Average earnings in Wilkinson County are $35,408 for men and $28,808 for women, a difference of 18.6%. Men with an educational attainment of bachelor's degree enjoy the highest average annual earnings of $112,875, while those with less than high school education earn the least with $25,819. Women with an educational attainment of bachelor's degree earn the most with the average annual earnings of $54,688, while those with less than high school education have the smallest earnings of $2,499.
| Educational Attainment | Male Income | Female Income |
| Less than High School | $25,819 | $2,499 |
| High School Diploma | $34,174 | $28,058 |
| College or Associate's Degree | $36,159 | $28,883 |
| Bachelor's Degree | $112,875 | $54,688 |
| Graduate Degree | $54,115 | $0 |
| Total | $35,408 | $28,808 |
Family Income in Wilkinson County
Family Income Brackets in Wilkinson County
According to the Wilkinson County family income data, there are 424 families falling into the $50,000 to $74,999 income range, which is the most common income bracket and makes up 21.1% of all families. Conversely, the $200,000+ income bracket is the least frequent group with only 84 families (4.2%) belonging to this category.
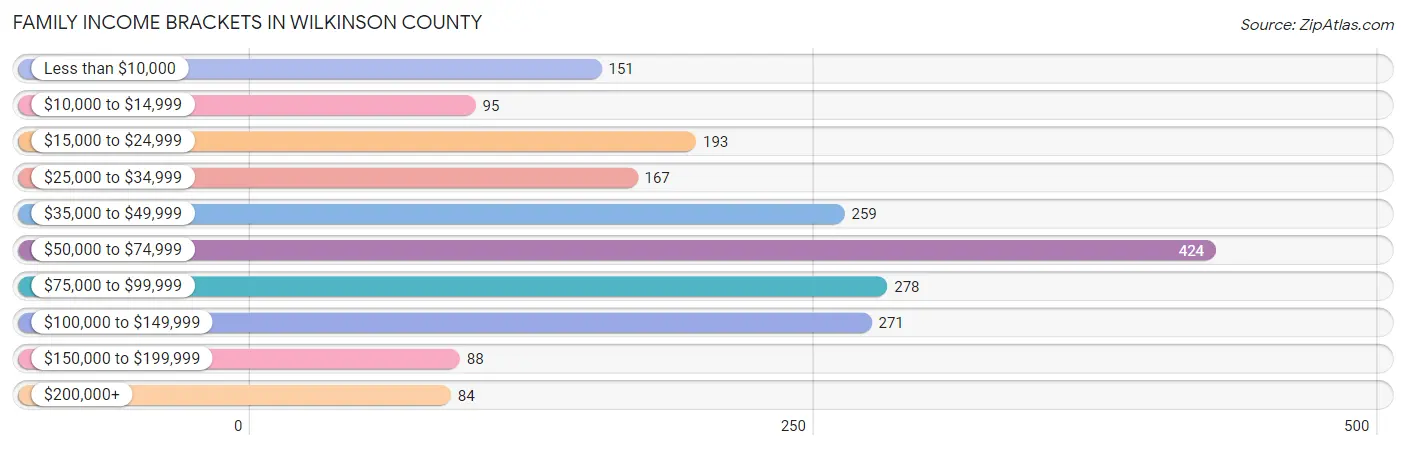
| Income Bracket | # Families | % Families |
| Less than $10,000 | 151 | 7.5% |
| $10,000 to $14,999 | 95 | 4.7% |
| $15,000 to $24,999 | 193 | 9.6% |
| $25,000 to $34,999 | 167 | 8.3% |
| $35,000 to $49,999 | 259 | 12.9% |
| $50,000 to $74,999 | 424 | 21.1% |
| $75,000 to $99,999 | 278 | 13.8% |
| $100,000 to $149,999 | 271 | 13.5% |
| $150,000 to $199,999 | 88 | 4.4% |
| $200,000+ | 84 | 4.2% |
Family Income by Famaliy Size in Wilkinson County
5-person families (156 | 7.8%) account for the highest median family income in Wilkinson County with $73,807 per family, while 2-person families (1,099 | 54.6%) have the highest median income of $25,548 per family member.
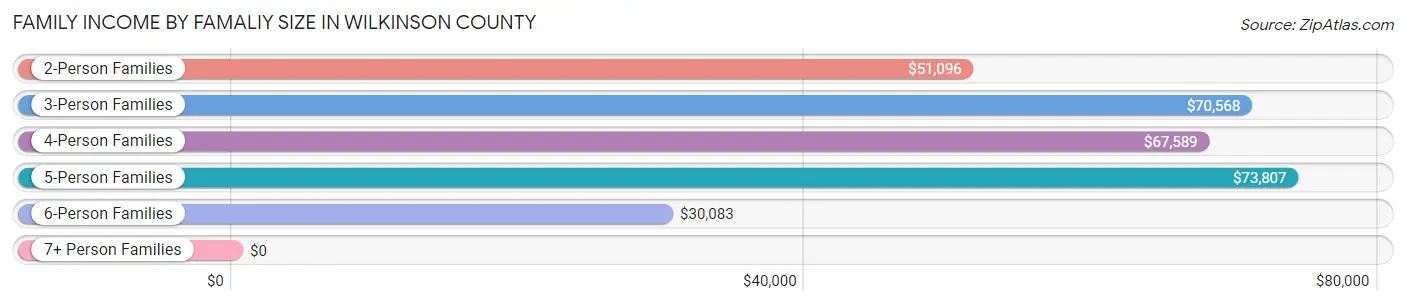
| Income Bracket | # Families | Median Income |
| 2-Person Families | 1,099 (54.6%) | $51,096 |
| 3-Person Families | 411 (20.4%) | $70,568 |
| 4-Person Families | 275 (13.7%) | $67,589 |
| 5-Person Families | 156 (7.8%) | $73,807 |
| 6-Person Families | 70 (3.5%) | $30,083 |
| 7+ Person Families | 0 (0.0%) | $0 |
| Total | 2,011 (100.0%) | $56,607 |
Family Income by Number of Earners in Wilkinson County
The median family income in Wilkinson County is $56,607, with families comprising 3+ earners (143) having the highest median family income of $97,708, while families with no earners (503) have the lowest median family income of $28,977, accounting for 7.1% and 25.0% of families, respectively.
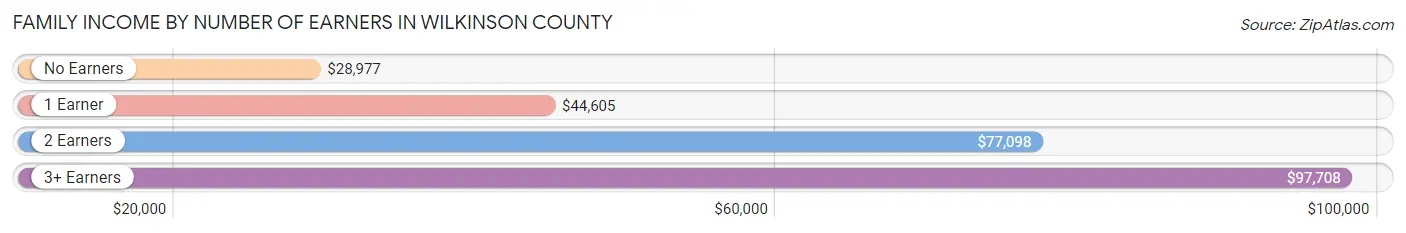
| Number of Earners | # Families | Median Income |
| No Earners | 503 (25.0%) | $28,977 |
| 1 Earner | 680 (33.8%) | $44,605 |
| 2 Earners | 685 (34.1%) | $77,098 |
| 3+ Earners | 143 (7.1%) | $97,708 |
| Total | 2,011 (100.0%) | $56,607 |
Household Income in Wilkinson County
Household Income Brackets in Wilkinson County
With 586 households falling in the category, the $50,000 to $74,999 income range is the most frequent in Wilkinson County, accounting for 17.7% of all households. In contrast, only 89 households (2.7%) fall into the $150,000 to $199,999 income bracket, making it the least populous group.
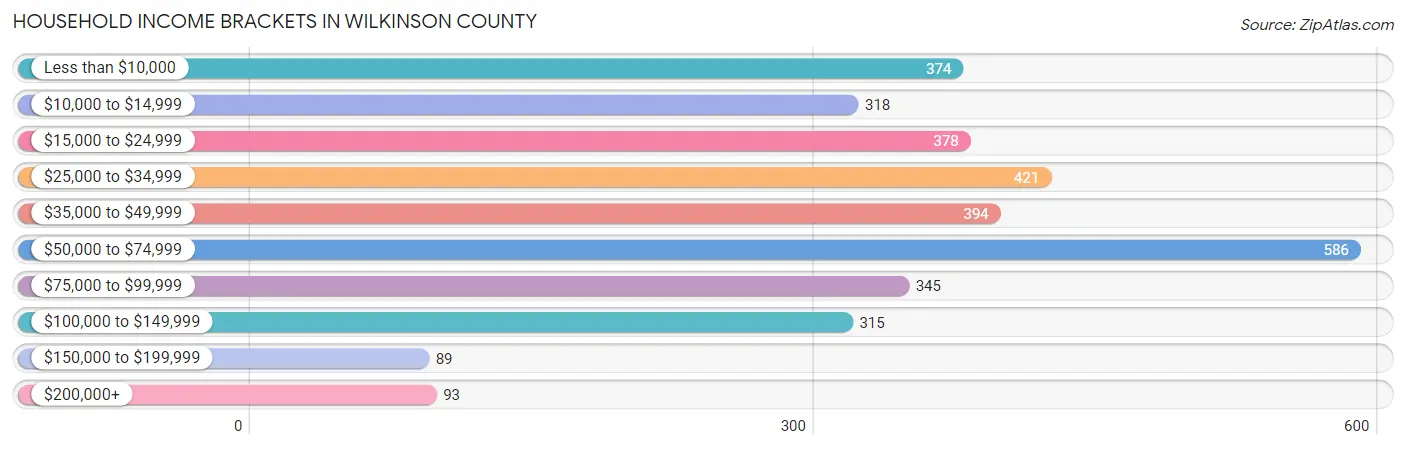
| Income Bracket | # Households | % Households |
| Less than $10,000 | 374 | 11.3% |
| $10,000 to $14,999 | 318 | 9.6% |
| $15,000 to $24,999 | 378 | 11.4% |
| $25,000 to $34,999 | 421 | 12.7% |
| $35,000 to $49,999 | 394 | 11.9% |
| $50,000 to $74,999 | 586 | 17.7% |
| $75,000 to $99,999 | 345 | 10.4% |
| $100,000 to $149,999 | 315 | 9.5% |
| $150,000 to $199,999 | 89 | 2.7% |
| $200,000+ | 93 | 2.8% |
Household Income by Householder Age in Wilkinson County
The median household income in Wilkinson County is $40,757, with the highest median household income of $57,589 found in the 25 to 44 years age bracket for the primary householder. A total of 887 households (26.8%) fall into this category. Meanwhile, the 15 to 24 years age bracket for the primary householder has the lowest median household income of $0, with 57 households (1.7%) in this group.
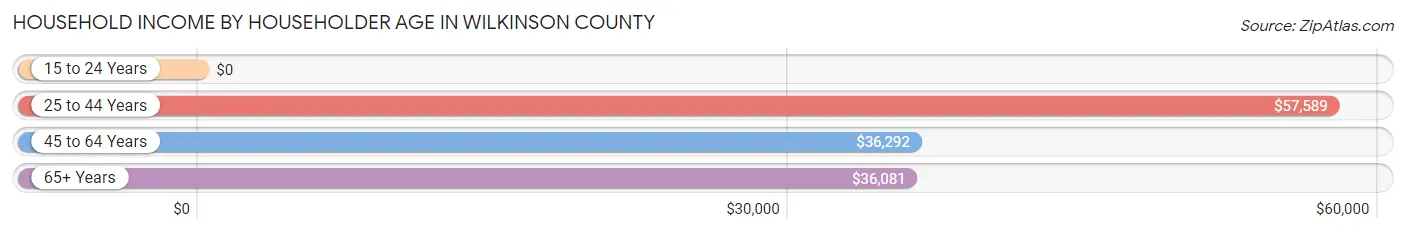
| Income Bracket | # Households | Median Income |
| 15 to 24 Years | 57 (1.7%) | $0 |
| 25 to 44 Years | 887 (26.8%) | $57,589 |
| 45 to 64 Years | 1,315 (39.7%) | $36,292 |
| 65+ Years | 1,054 (31.8%) | $36,081 |
| Total | 3,313 (100.0%) | $40,757 |
Poverty in Wilkinson County
Income Below Poverty by Sex and Age in Wilkinson County
With 19.3% poverty level for males and 24.1% for females among the residents of Wilkinson County, under 5 year old males and 5 year old females are the most vulnerable to poverty, with 100 males (48.1%) and 11 females (61.1%) in their respective age groups living below the poverty level.
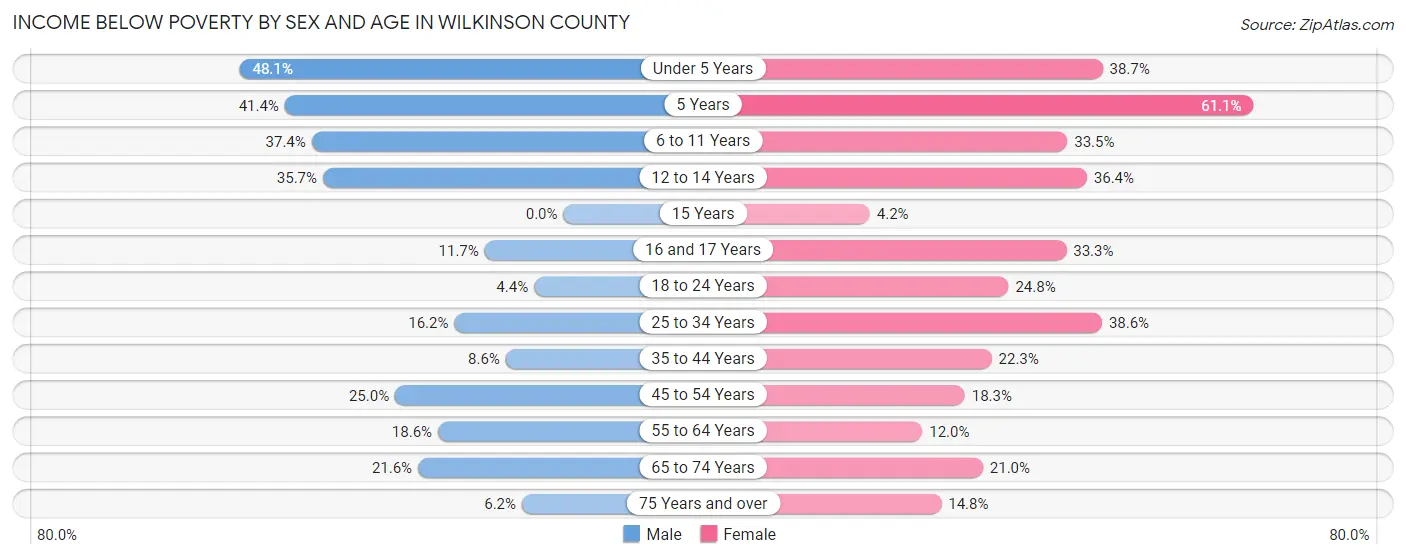
| Age Bracket | Male | Female |
| Under 5 Years | 100 (48.1%) | 103 (38.7%) |
| 5 Years | 24 (41.4%) | 11 (61.1%) |
| 6 to 11 Years | 117 (37.4%) | 72 (33.5%) |
| 12 to 14 Years | 65 (35.7%) | 111 (36.4%) |
| 15 Years | 0 (0.0%) | 2 (4.2%) |
| 16 and 17 Years | 9 (11.7%) | 41 (33.3%) |
| 18 to 24 Years | 15 (4.4%) | 98 (24.7%) |
| 25 to 34 Years | 70 (16.2%) | 192 (38.6%) |
| 35 to 44 Years | 48 (8.6%) | 107 (22.3%) |
| 45 to 54 Years | 111 (25.0%) | 99 (18.3%) |
| 55 to 64 Years | 128 (18.6%) | 81 (11.9%) |
| 65 to 74 Years | 98 (21.6%) | 115 (20.9%) |
| 75 Years and over | 18 (6.2%) | 61 (14.8%) |
| Total | 803 (19.3%) | 1,093 (24.1%) |
Income Above Poverty by Sex and Age in Wilkinson County
According to the poverty statistics in Wilkinson County, males aged 15 years and females aged 15 years are the age groups that are most secure financially, with 100.0% of males and 95.8% of females in these age groups living above the poverty line.
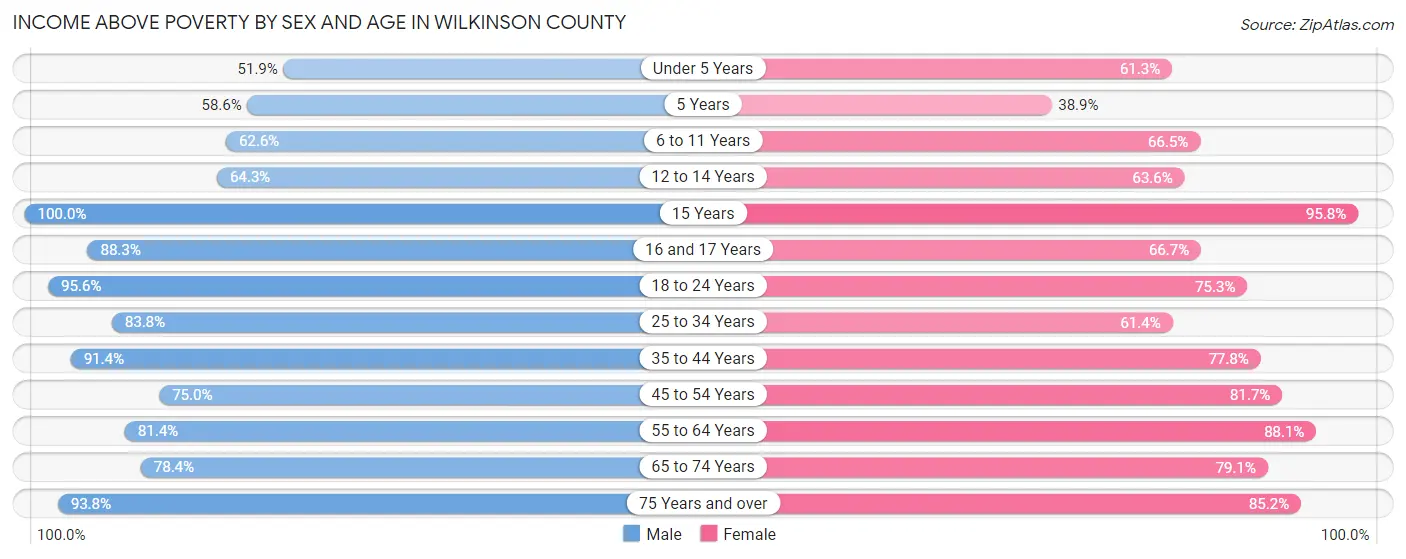
| Age Bracket | Male | Female |
| Under 5 Years | 108 (51.9%) | 163 (61.3%) |
| 5 Years | 34 (58.6%) | 7 (38.9%) |
| 6 to 11 Years | 196 (62.6%) | 143 (66.5%) |
| 12 to 14 Years | 117 (64.3%) | 194 (63.6%) |
| 15 Years | 107 (100.0%) | 46 (95.8%) |
| 16 and 17 Years | 68 (88.3%) | 82 (66.7%) |
| 18 to 24 Years | 329 (95.6%) | 298 (75.2%) |
| 25 to 34 Years | 362 (83.8%) | 305 (61.4%) |
| 35 to 44 Years | 512 (91.4%) | 374 (77.7%) |
| 45 to 54 Years | 333 (75.0%) | 443 (81.7%) |
| 55 to 64 Years | 559 (81.4%) | 597 (88.0%) |
| 65 to 74 Years | 356 (78.4%) | 434 (79.0%) |
| 75 Years and over | 274 (93.8%) | 352 (85.2%) |
| Total | 3,355 (80.7%) | 3,438 (75.9%) |
Income Below Poverty Among Married-Couple Families in Wilkinson County
The poverty statistics for married-couple families in Wilkinson County show that 5.6% or 72 of the total 1,283 families live below the poverty line. Families with 3 or 4 children have the highest poverty rate of 34.7%, comprising of 25 families. On the other hand, families with 1 or 2 children have the lowest poverty rate of 1.4%, which includes 4 families.
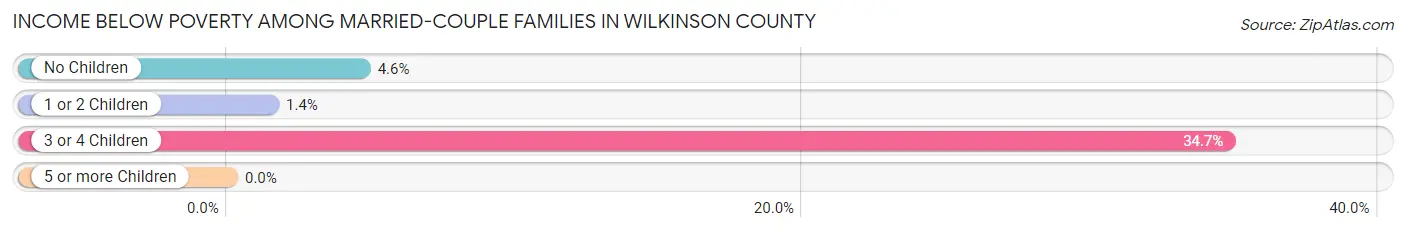
| Children | Above Poverty | Below Poverty |
| No Children | 888 (95.4%) | 43 (4.6%) |
| 1 or 2 Children | 276 (98.6%) | 4 (1.4%) |
| 3 or 4 Children | 47 (65.3%) | 25 (34.7%) |
| 5 or more Children | 0 (0.0%) | 0 (0.0%) |
| Total | 1,211 (94.4%) | 72 (5.6%) |
Income Below Poverty Among Single-Parent Households in Wilkinson County
According to the poverty data in Wilkinson County, 13.5% or 20 single-father households and 42.8% or 248 single-mother households are living below the poverty line. Among single-father households, those with 1 or 2 children have the highest poverty rate, with 20 households (26.0%) experiencing poverty. Likewise, among single-mother households, those with 5 or more children have the highest poverty rate, with 43 households (100.0%) falling below the poverty line.
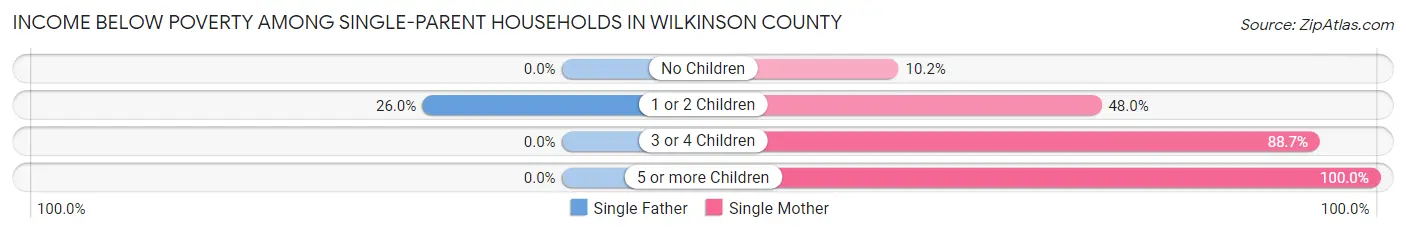
| Children | Single Father | Single Mother |
| No Children | 0 (0.0%) | 26 (10.2%) |
| 1 or 2 Children | 20 (26.0%) | 85 (48.0%) |
| 3 or 4 Children | 0 (0.0%) | 94 (88.7%) |
| 5 or more Children | 0 (0.0%) | 43 (100.0%) |
| Total | 20 (13.5%) | 248 (42.8%) |
Income Below Poverty Among Married-Couple vs Single-Parent Households in Wilkinson County
The poverty data for Wilkinson County shows that 72 of the married-couple family households (5.6%) and 268 of the single-parent households (36.8%) are living below the poverty level. Within the married-couple family households, those with 3 or 4 children have the highest poverty rate, with 25 households (34.7%) falling below the poverty line. Among the single-parent households, those with 5 or more children have the highest poverty rate, with 43 household (100.0%) living below poverty.
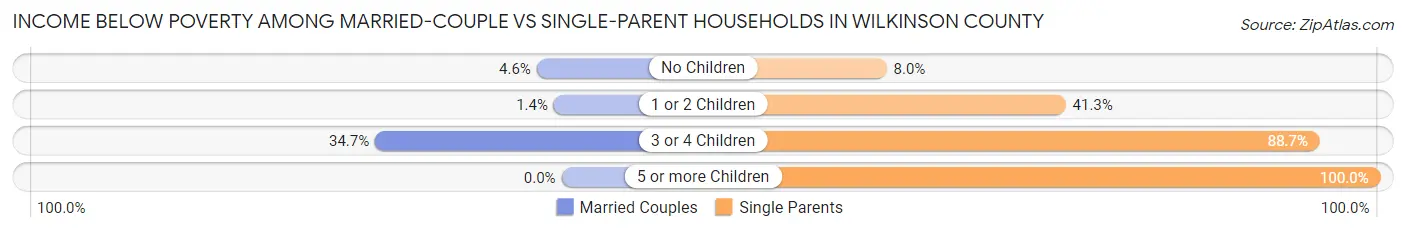
| Children | Married-Couple Families | Single-Parent Households |
| No Children | 43 (4.6%) | 26 (8.0%) |
| 1 or 2 Children | 4 (1.4%) | 105 (41.3%) |
| 3 or 4 Children | 25 (34.7%) | 94 (88.7%) |
| 5 or more Children | 0 (0.0%) | 43 (100.0%) |
| Total | 72 (5.6%) | 268 (36.8%) |
Race in Wilkinson County
The most populous races in Wilkinson County are White / Caucasian (5,096 | 57.6%), Black / African American (3,387 | 38.3%), and Hispanic or Latino (278 | 3.1%).
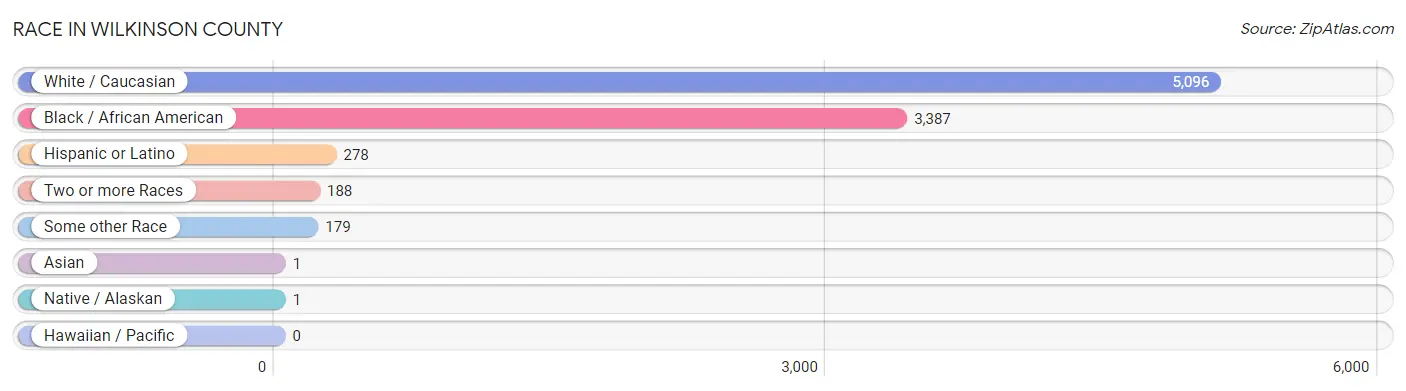
| Race | # Population | % Population |
| Asian | 1 | 0.0% |
| Black / African American | 3,387 | 38.3% |
| Hawaiian / Pacific | 0 | 0.0% |
| Hispanic or Latino | 278 | 3.1% |
| Native / Alaskan | 1 | 0.0% |
| White / Caucasian | 5,096 | 57.6% |
| Two or more Races | 188 | 2.1% |
| Some other Race | 179 | 2.0% |
| Total | 8,852 | 100.0% |
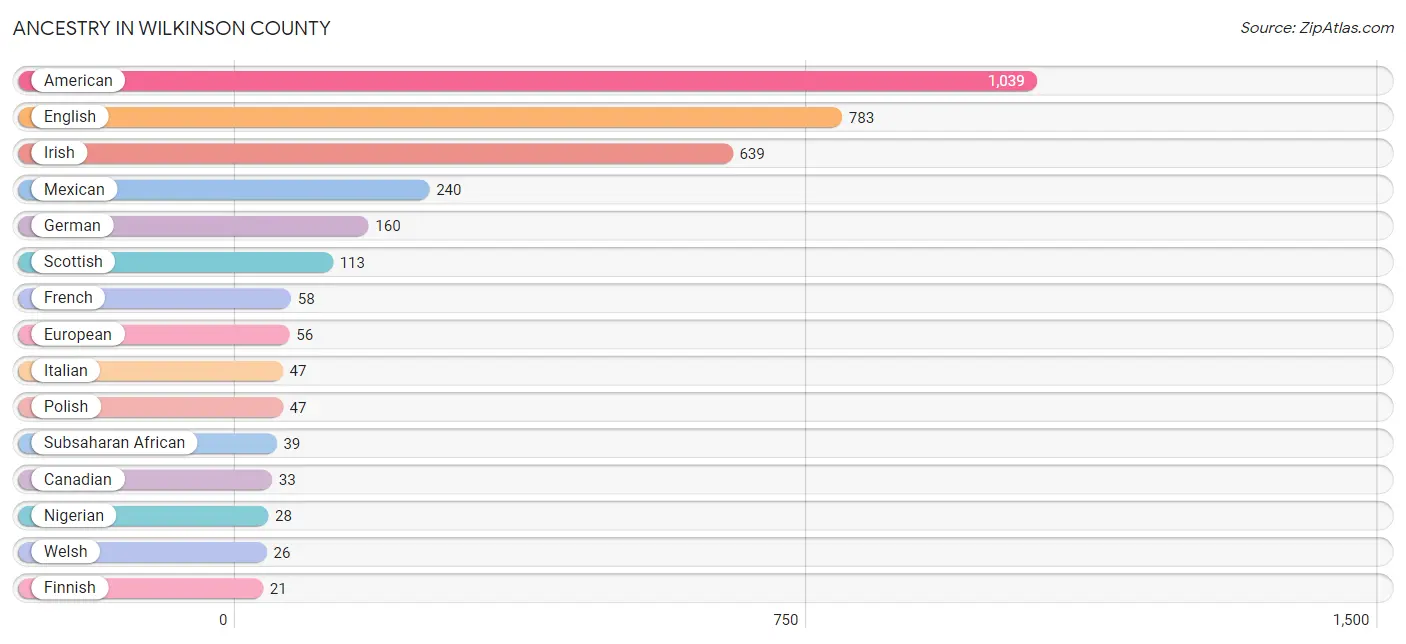
Ancestry in Wilkinson County
The most populous ancestries reported in Wilkinson County are American (1,039 | 11.7%), English (783 | 8.8%), Irish (639 | 7.2%), Mexican (240 | 2.7%), and German (160 | 1.8%), together accounting for 32.3% of all Wilkinson County residents.
| Ancestry | # Population | % Population |
| African | 11 | 0.1% |
| American | 1,039 | 11.7% |
| Belgian | 1 | 0.0% |
| British | 11 | 0.1% |
| Canadian | 33 | 0.4% |
| Central American | 18 | 0.2% |
| Central American Indian | 1 | 0.0% |
| Cherokee | 2 | 0.0% |
| Choctaw | 5 | 0.1% |
| Danish | 5 | 0.1% |
| Dutch | 20 | 0.2% |
| Eastern European | 1 | 0.0% |
| English | 783 | 8.8% |
| European | 56 | 0.6% |
| Finnish | 21 | 0.2% |
| French | 58 | 0.7% |
| French American Indian | 3 | 0.0% |
| French Canadian | 3 | 0.0% |
| German | 160 | 1.8% |
| Guatemalan | 18 | 0.2% |
| Hungarian | 17 | 0.2% |
| Irish | 639 | 7.2% |
| Iroquois | 18 | 0.2% |
| Italian | 47 | 0.5% |
| Jamaican | 16 | 0.2% |
| Mexican | 240 | 2.7% |
| Nigerian | 28 | 0.3% |
| Norwegian | 21 | 0.2% |
| Pennsylvania German | 10 | 0.1% |
| Polish | 47 | 0.5% |
| Portuguese | 6 | 0.1% |
| Puerto Rican | 16 | 0.2% |
| Russian | 18 | 0.2% |
| Scandinavian | 10 | 0.1% |
| Scotch-Irish | 16 | 0.2% |
| Scottish | 113 | 1.3% |
| Slovak | 2 | 0.0% |
| Sri Lankan | 1 | 0.0% |
| Subsaharan African | 39 | 0.4% |
| Welsh | 26 | 0.3% | View All 40 Rows |
Immigrants in Wilkinson County
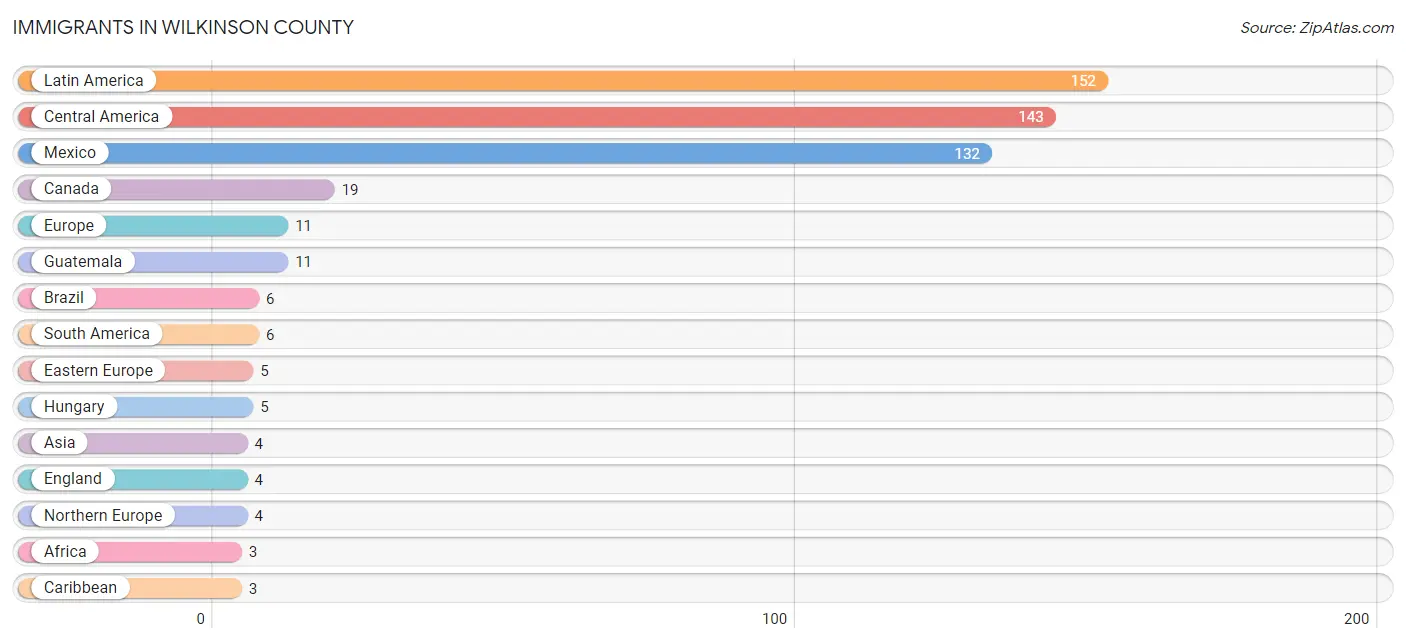
The most numerous immigrant groups reported in Wilkinson County came from Latin America (152 | 1.7%), Central America (143 | 1.6%), Mexico (132 | 1.5%), Canada (19 | 0.2%), and Europe (11 | 0.1%), together accounting for 5.2% of all Wilkinson County residents.
| Immigration Origin | # Population | % Population |
| Africa | 3 | 0.0% |
| Asia | 4 | 0.1% |
| Brazil | 6 | 0.1% |
| Canada | 19 | 0.2% |
| Caribbean | 3 | 0.0% |
| Central America | 143 | 1.6% |
| Eastern Africa | 1 | 0.0% |
| Eastern Europe | 5 | 0.1% |
| England | 4 | 0.1% |
| Europe | 11 | 0.1% |
| Germany | 2 | 0.0% |
| Guatemala | 11 | 0.1% |
| Haiti | 3 | 0.0% |
| Hungary | 5 | 0.1% |
| Kazakhstan | 3 | 0.0% |
| Latin America | 152 | 1.7% |
| Liberia | 2 | 0.0% |
| Mexico | 132 | 1.5% |
| Northern Europe | 4 | 0.1% |
| South America | 6 | 0.1% |
| South Central Asia | 3 | 0.0% |
| South Eastern Asia | 1 | 0.0% |
| Vietnam | 1 | 0.0% |
| Western Africa | 2 | 0.0% |
| Western Europe | 2 | 0.0% | View All 25 Rows |
Sex and Age in Wilkinson County
Sex and Age in Wilkinson County
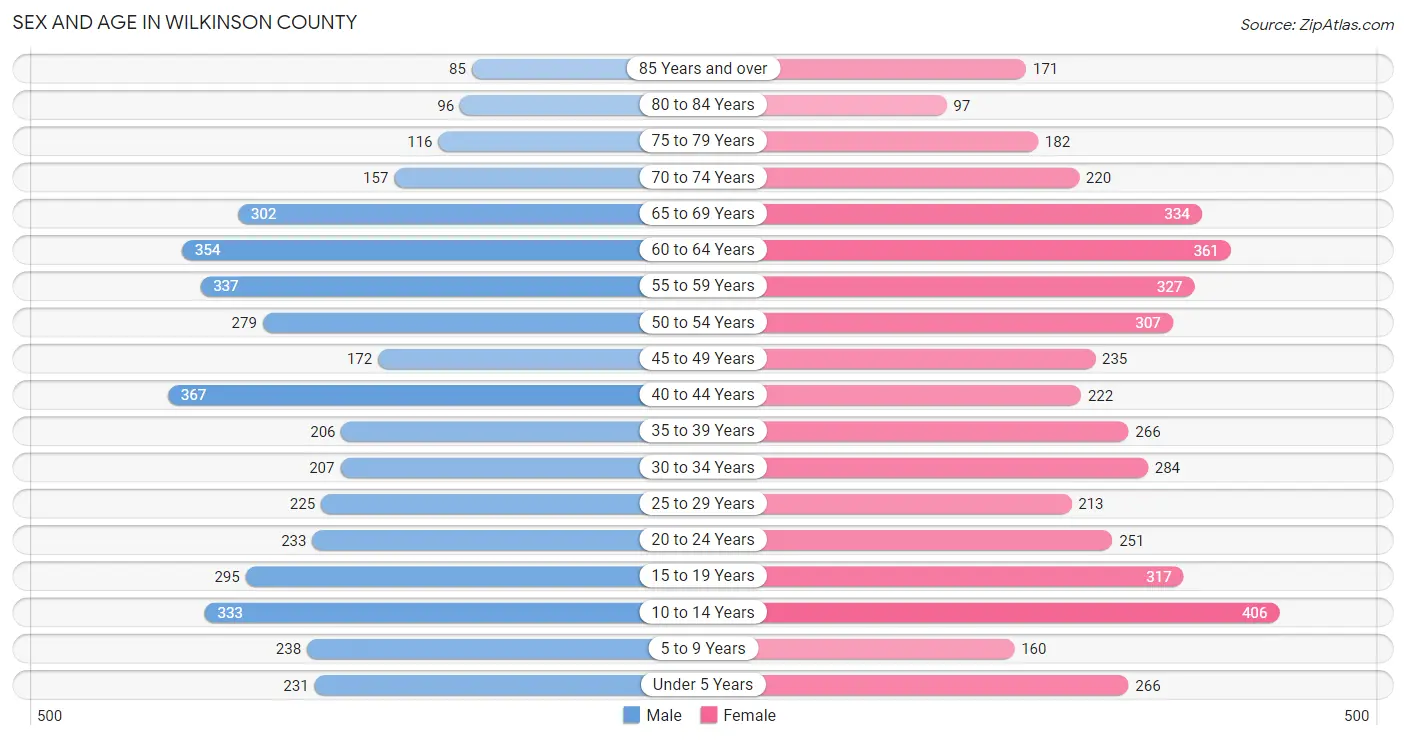
The most populous age groups in Wilkinson County are 40 to 44 Years (367 | 8.7%) for men and 10 to 14 Years (406 | 8.8%) for women.
| Age Bracket | Male | Female |
| Under 5 Years | 231 (5.5%) | 266 (5.8%) |
| 5 to 9 Years | 238 (5.6%) | 160 (3.5%) |
| 10 to 14 Years | 333 (7.9%) | 406 (8.8%) |
| 15 to 19 Years | 295 (7.0%) | 317 (6.9%) |
| 20 to 24 Years | 233 (5.5%) | 251 (5.4%) |
| 25 to 29 Years | 225 (5.3%) | 213 (4.6%) |
| 30 to 34 Years | 207 (4.9%) | 284 (6.1%) |
| 35 to 39 Years | 206 (4.9%) | 266 (5.8%) |
| 40 to 44 Years | 367 (8.7%) | 222 (4.8%) |
| 45 to 49 Years | 172 (4.1%) | 235 (5.1%) |
| 50 to 54 Years | 279 (6.6%) | 307 (6.7%) |
| 55 to 59 Years | 337 (8.0%) | 327 (7.1%) |
| 60 to 64 Years | 354 (8.4%) | 361 (7.8%) |
| 65 to 69 Years | 302 (7.1%) | 334 (7.2%) |
| 70 to 74 Years | 157 (3.7%) | 220 (4.8%) |
| 75 to 79 Years | 116 (2.7%) | 182 (3.9%) |
| 80 to 84 Years | 96 (2.3%) | 97 (2.1%) |
| 85 Years and over | 85 (2.0%) | 171 (3.7%) |
| Total | 4,233 (100.0%) | 4,619 (100.0%) |
Families and Households in Wilkinson County
Median Family Size in Wilkinson County
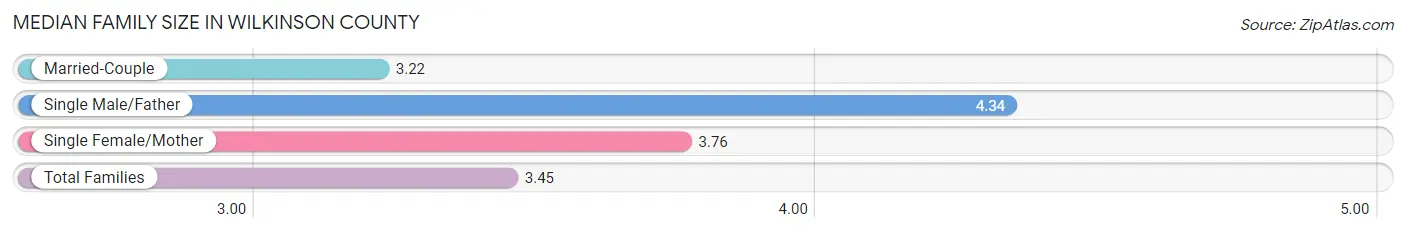
The median family size in Wilkinson County is 3.45 persons per family, with single male/father families (148 | 7.4%) accounting for the largest median family size of 4.34 persons per family. On the other hand, married-couple families (1,283 | 63.8%) represent the smallest median family size with 3.22 persons per family.
| Family Type | # Families | Family Size |
| Married-Couple | 1,283 (63.8%) | 3.22 |
| Single Male/Father | 148 (7.4%) | 4.34 |
| Single Female/Mother | 580 (28.8%) | 3.76 |
| Total Families | 2,011 (100.0%) | 3.45 |
Median Household Size in Wilkinson County
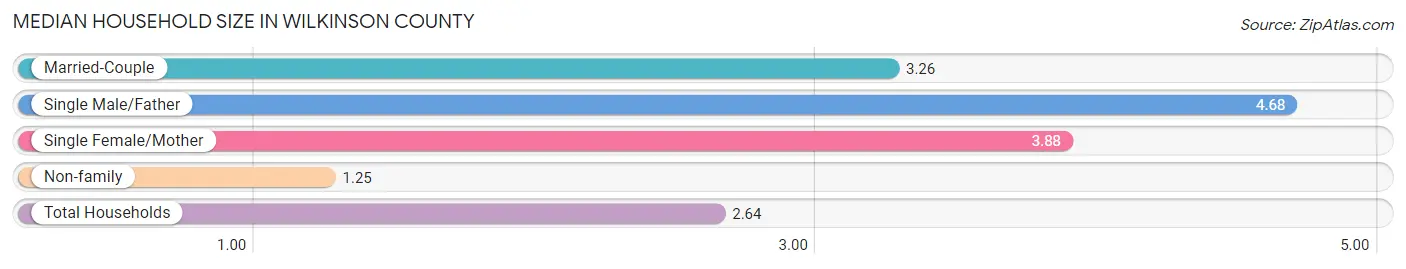
The median household size in Wilkinson County is 2.64 persons per household, with single male/father households (148 | 4.5%) accounting for the largest median household size of 4.68 persons per household. non-family households (1,302 | 39.3%) represent the smallest median household size with 1.25 persons per household.
| Household Type | # Households | Household Size |
| Married-Couple | 1,283 (38.7%) | 3.26 |
| Single Male/Father | 148 (4.5%) | 4.68 |
| Single Female/Mother | 580 (17.5%) | 3.88 |
| Non-family | 1,302 (39.3%) | 1.25 |
| Total Households | 3,313 (100.0%) | 2.64 |
Household Size by Marriage Status in Wilkinson County
Out of a total of 3,313 households in Wilkinson County, 2,011 (60.7%) are family households, while 1,302 (39.3%) are nonfamily households. The most numerous type of family households are 2-person households, comprising 1,057, and the most common type of nonfamily households are 1-person households, comprising 1,133.
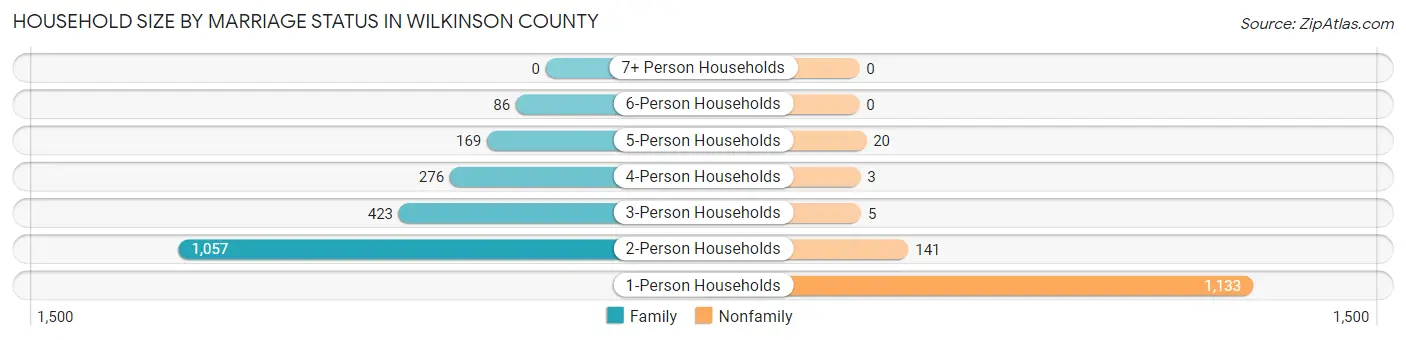
| Household Size | Family Households | Nonfamily Households |
| 1-Person Households | - | 1,133 (34.2%) |
| 2-Person Households | 1,057 (31.9%) | 141 (4.3%) |
| 3-Person Households | 423 (12.8%) | 5 (0.2%) |
| 4-Person Households | 276 (8.3%) | 3 (0.1%) |
| 5-Person Households | 169 (5.1%) | 20 (0.6%) |
| 6-Person Households | 86 (2.6%) | 0 (0.0%) |
| 7+ Person Households | 0 (0.0%) | 0 (0.0%) |
| Total | 2,011 (60.7%) | 1,302 (39.3%) |
Female Fertility in Wilkinson County
Fertility by Age in Wilkinson County
Average fertility rate in Wilkinson County is 55.0 births per 1,000 women. Women in the age bracket of 15 to 19 years have the highest fertility rate with 199.0 births per 1,000 women. Women in the age bracket of 15 to 19 years acount for 61.8% of all women with births.
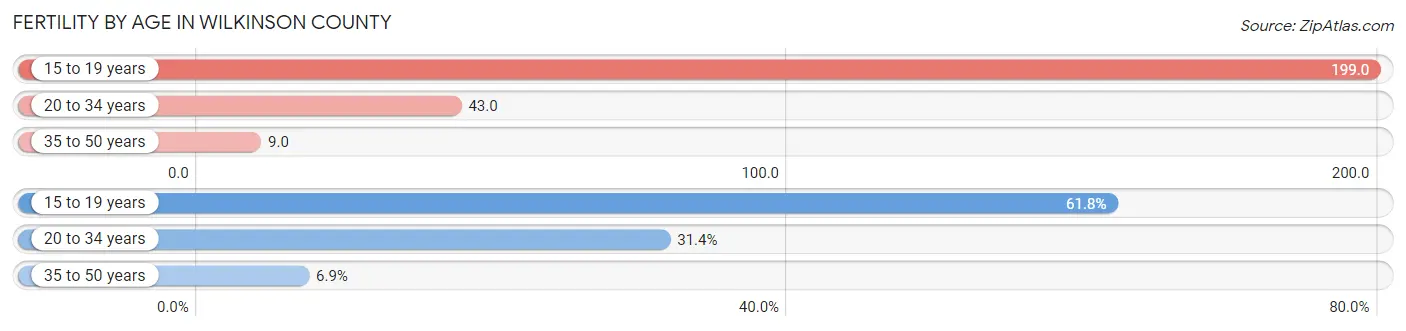
| Age Bracket | Women with Births | Births / 1,000 Women |
| 15 to 19 years | 63 (61.8%) | 199.0 |
| 20 to 34 years | 32 (31.4%) | 43.0 |
| 35 to 50 years | 7 (6.9%) | 9.0 |
| Total | 102 (100.0%) | 55.0 |
Fertility by Age by Marriage Status in Wilkinson County
30.4% of women with births (102) in Wilkinson County are married. The highest percentage of unmarried women with births falls into 15 to 19 years age bracket with 100.0% of them unmarried at the time of birth, while the lowest percentage of unmarried women with births belong to 35 to 50 years age bracket with 0.0% of them unmarried.
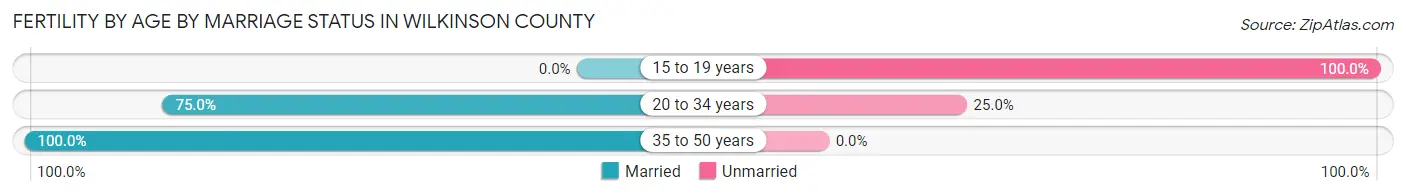
| Age Bracket | Married | Unmarried |
| 15 to 19 years | 0 (0.0%) | 63 (100.0%) |
| 20 to 34 years | 24 (75.0%) | 8 (25.0%) |
| 35 to 50 years | 7 (100.0%) | 0 (0.0%) |
| Total | 31 (30.4%) | 71 (69.6%) |
Fertility by Education in Wilkinson County
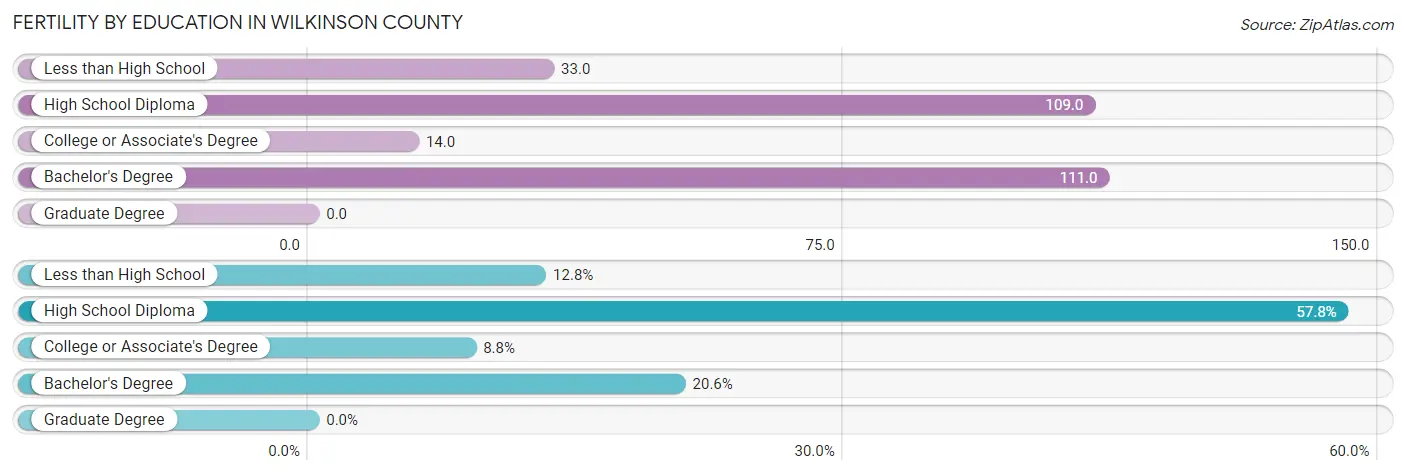
| Educational Attainment | Women with Births | Births / 1,000 Women |
| Less than High School | 13 (12.8%) | 33.0 |
| High School Diploma | 59 (57.8%) | 109.0 |
| College or Associate's Degree | 9 (8.8%) | 14.0 |
| Bachelor's Degree | 21 (20.6%) | 111.0 |
| Graduate Degree | 0 (0.0%) | 0.0 |
| Total | 102 (100.0%) | 55.0 |
Fertility by Education by Marriage Status in Wilkinson County
69.6% of women with births in Wilkinson County are unmarried. Women with the educational attainment of college or associate's degree are most likely to be married with 88.9% of them married at childbirth, while women with the educational attainment of less than high school are least likely to be married with 100.0% of them unmarried at childbirth.
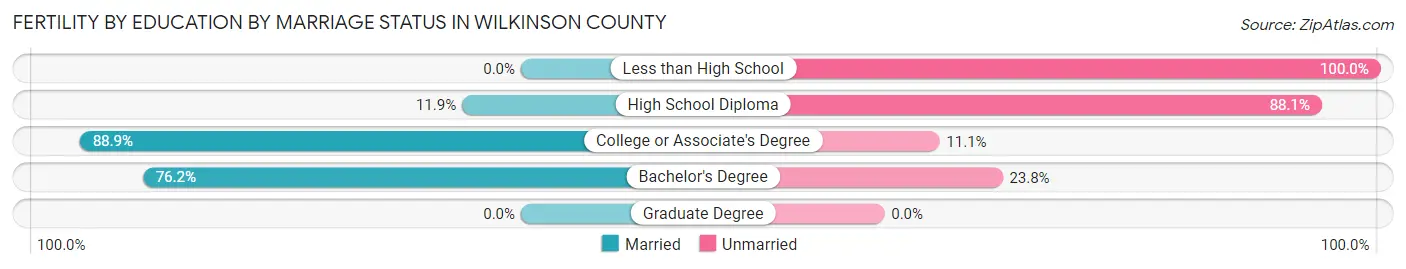
| Educational Attainment | Married | Unmarried |
| Less than High School | 0 (0.0%) | 13 (100.0%) |
| High School Diploma | 7 (11.9%) | 52 (88.1%) |
| College or Associate's Degree | 8 (88.9%) | 1 (11.1%) |
| Bachelor's Degree | 16 (76.2%) | 5 (23.8%) |
| Graduate Degree | 0 (0.0%) | 0 (0.0%) |
| Total | 31 (30.4%) | 71 (69.6%) |
Employment Characteristics in Wilkinson County
Employment by Class of Employer in Wilkinson County
Among the 3,231 employed individuals in Wilkinson County, private company employees (2,269 | 70.2%), local government employees (325 | 10.1%), and not-for-profit organizations (189 | 5.9%) make up the most common classes of employment.
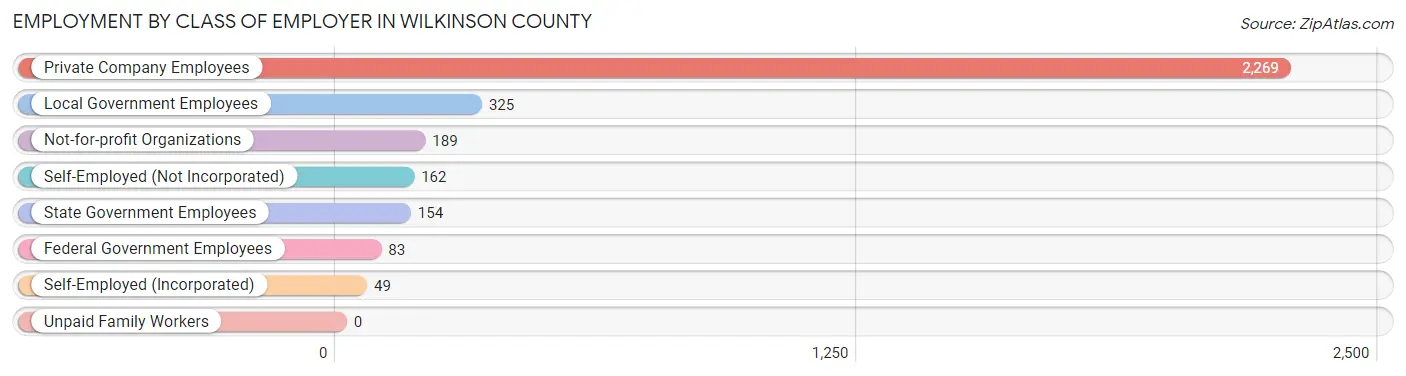
| Employer Class | # Employees | % Employees |
| Private Company Employees | 2,269 | 70.2% |
| Self-Employed (Incorporated) | 49 | 1.5% |
| Self-Employed (Not Incorporated) | 162 | 5.0% |
| Not-for-profit Organizations | 189 | 5.9% |
| Local Government Employees | 325 | 10.1% |
| State Government Employees | 154 | 4.8% |
| Federal Government Employees | 83 | 2.6% |
| Unpaid Family Workers | 0 | 0.0% |
| Total | 3,231 | 100.0% |
Employment Status by Age in Wilkinson County
According to the labor force statistics for Wilkinson County, out of the total population over 16 years of age (7,063), 48.9% or 3,454 individuals are in the labor force, with 5.8% or 200 of them unemployed. The age group with the highest labor force participation rate is 35 to 44 years, with 87.9% or 933 individuals in the labor force. Within the labor force, the 16 to 19 years age range has the highest percentage of unemployed individuals, with 24.3% or 18 of them being unemployed.
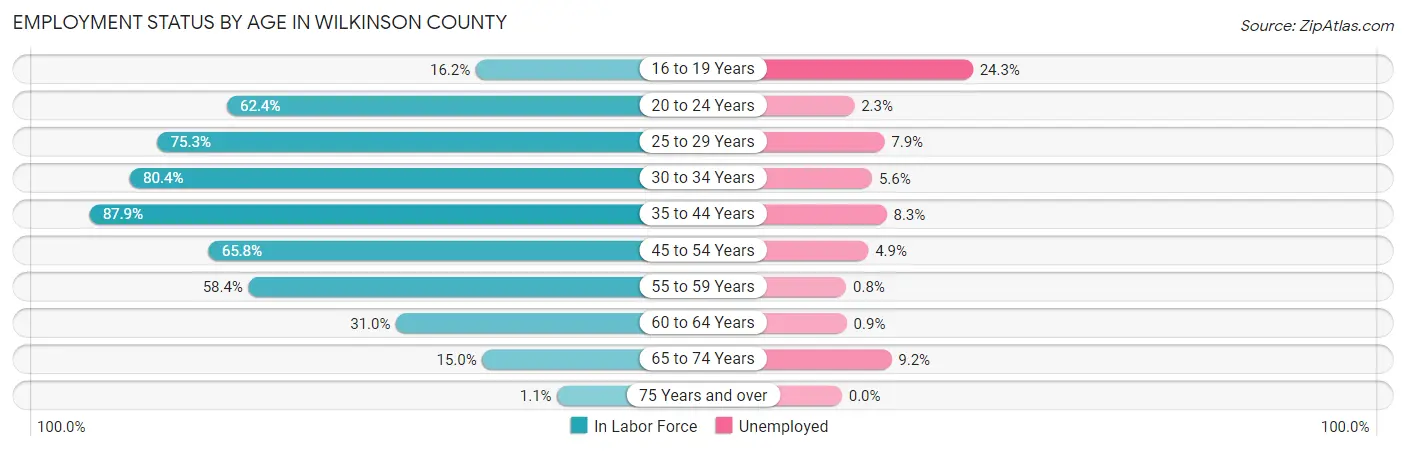
| Age Bracket | In Labor Force | Unemployed |
| 16 to 19 Years | 74 (16.2%) | 18 (24.3%) |
| 20 to 24 Years | 302 (62.4%) | 7 (2.3%) |
| 25 to 29 Years | 330 (75.3%) | 26 (7.9%) |
| 30 to 34 Years | 395 (80.4%) | 22 (5.6%) |
| 35 to 44 Years | 933 (87.9%) | 77 (8.3%) |
| 45 to 54 Years | 653 (65.8%) | 32 (4.9%) |
| 55 to 59 Years | 388 (58.4%) | 3 (0.8%) |
| 60 to 64 Years | 222 (31.0%) | 2 (0.9%) |
| 65 to 74 Years | 152 (15.0%) | 14 (9.2%) |
| 75 Years and over | 8 (1.1%) | 0 (0.0%) |
| Total | 3,454 (48.9%) | 200 (5.8%) |
Employment Status by Educational Attainment in Wilkinson County
According to labor force statistics for Wilkinson County, 67.0% of individuals (2,923) out of the total population between 25 and 64 years of age (4,362) are in the labor force, with 5.5% or 161 of them being unemployed. The group with the highest labor force participation rate are those with the educational attainment of bachelor's degree or higher, with 73.1% or 397 individuals in the labor force. Within the labor force, individuals with less than high school education have the highest percentage of unemployment, with 11.5% or 24 of them being unemployed.
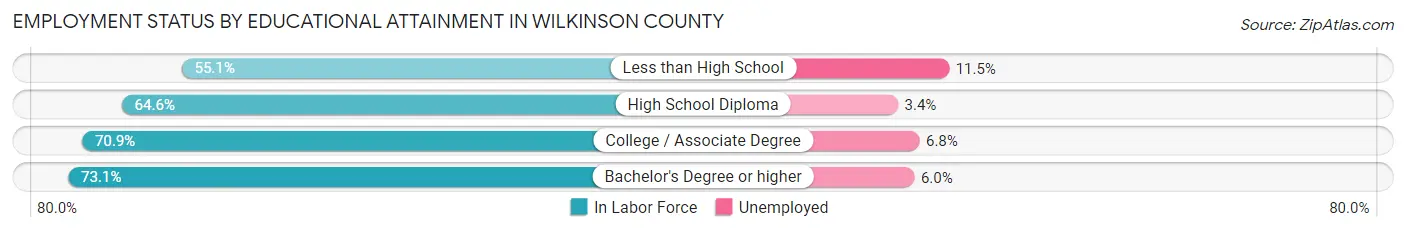
| Educational Attainment | In Labor Force | Unemployed |
| Less than High School | 209 (55.1%) | 44 (11.5%) |
| High School Diploma | 1,265 (64.6%) | 67 (3.4%) |
| College / Associate Degree | 1,051 (70.9%) | 101 (6.8%) |
| Bachelor's Degree or higher | 397 (73.1%) | 33 (6.0%) |
| Total | 2,923 (67.0%) | 240 (5.5%) |
Employment Occupations by Sex in Wilkinson County
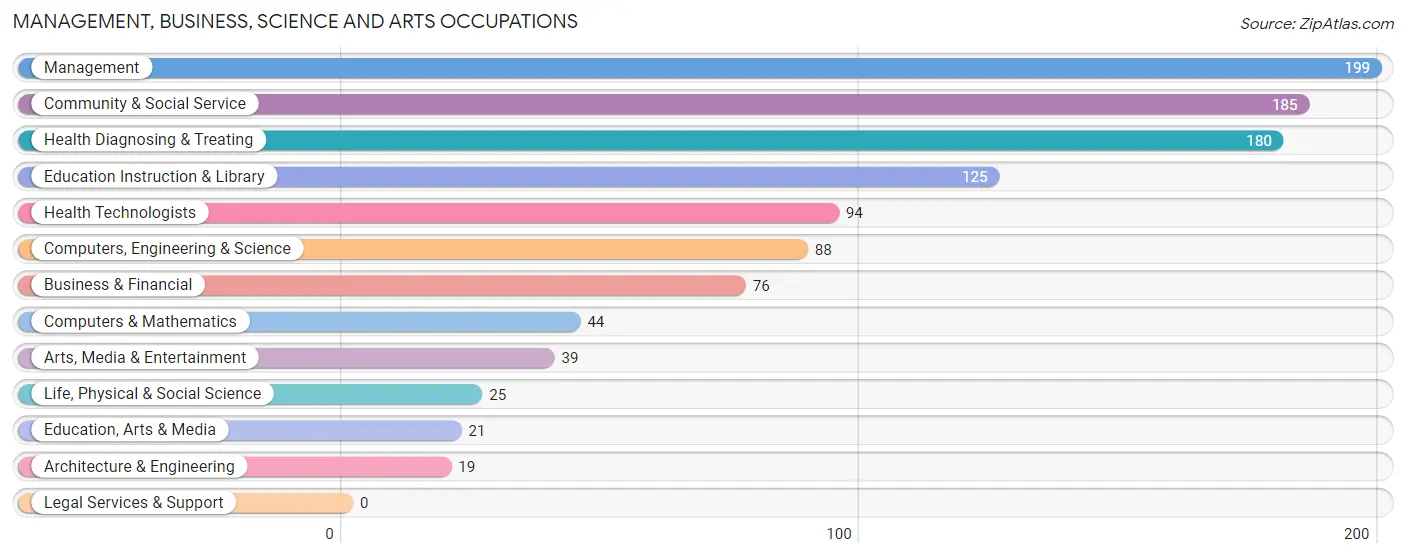
Management, Business, Science and Arts Occupations
The most common Management, Business, Science and Arts occupations in Wilkinson County are Management (199 | 6.1%), Community & Social Service (185 | 5.7%), Health Diagnosing & Treating (180 | 5.5%), Education Instruction & Library (125 | 3.8%), and Health Technologists (94 | 2.9%).
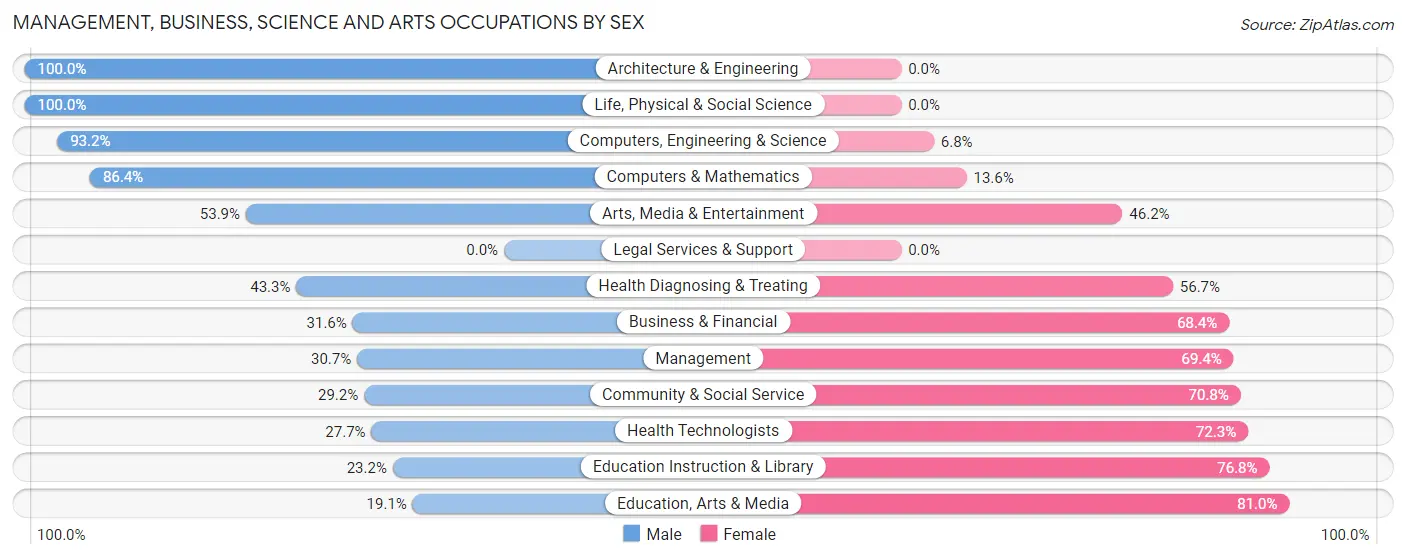
Management, Business, Science and Arts Occupations by Sex
Within the Management, Business, Science and Arts occupations in Wilkinson County, the most male-oriented occupations are Architecture & Engineering (100.0%), Life, Physical & Social Science (100.0%), and Computers, Engineering & Science (93.2%), while the most female-oriented occupations are Education, Arts & Media (80.9%), Education Instruction & Library (76.8%), and Health Technologists (72.3%).
| Occupation | Male | Female |
| Management | 61 (30.6%) | 138 (69.4%) |
| Business & Financial | 24 (31.6%) | 52 (68.4%) |
| Computers, Engineering & Science | 82 (93.2%) | 6 (6.8%) |
| Computers & Mathematics | 38 (86.4%) | 6 (13.6%) |
| Architecture & Engineering | 19 (100.0%) | 0 (0.0%) |
| Life, Physical & Social Science | 25 (100.0%) | 0 (0.0%) |
| Community & Social Service | 54 (29.2%) | 131 (70.8%) |
| Education, Arts & Media | 4 (19.1%) | 17 (80.9%) |
| Legal Services & Support | 0 (0.0%) | 0 (0.0%) |
| Education Instruction & Library | 29 (23.2%) | 96 (76.8%) |
| Arts, Media & Entertainment | 21 (53.8%) | 18 (46.2%) |
| Health Diagnosing & Treating | 78 (43.3%) | 102 (56.7%) |
| Health Technologists | 26 (27.7%) | 68 (72.3%) |
| Total (Category) | 299 (41.1%) | 429 (58.9%) |
| Total (Overall) | 1,669 (51.3%) | 1,587 (48.7%) |
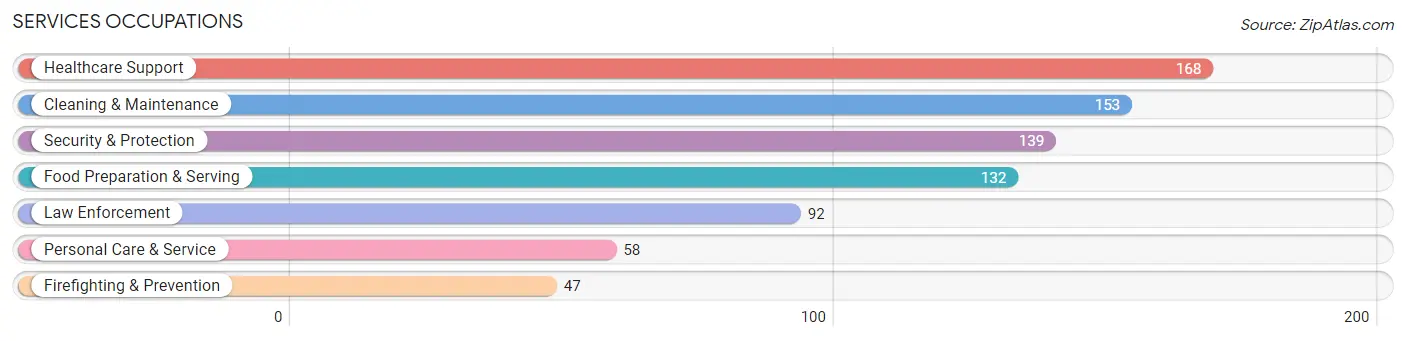
Services Occupations
The most common Services occupations in Wilkinson County are Healthcare Support (168 | 5.2%), Cleaning & Maintenance (153 | 4.7%), Security & Protection (139 | 4.3%), Food Preparation & Serving (132 | 4.1%), and Law Enforcement (92 | 2.8%).
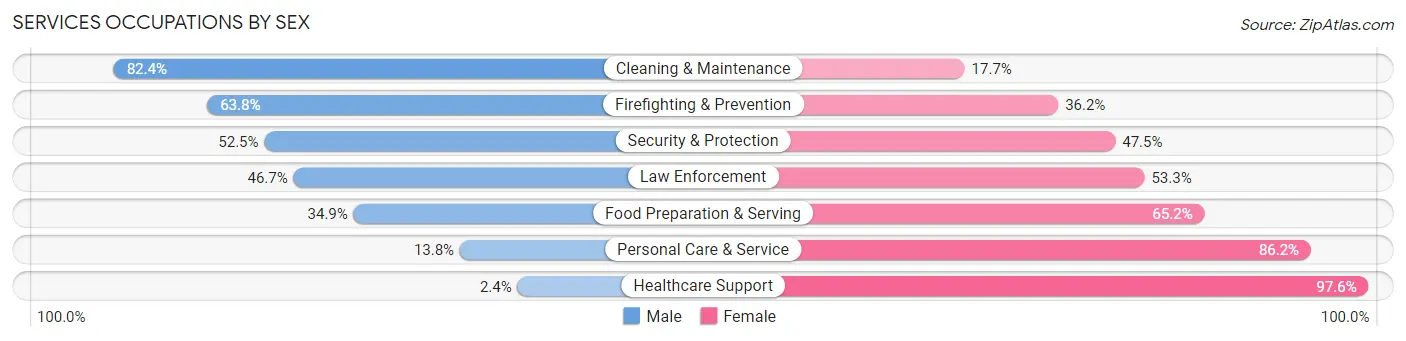
Services Occupations by Sex
Within the Services occupations in Wilkinson County, the most male-oriented occupations are Cleaning & Maintenance (82.4%), Firefighting & Prevention (63.8%), and Security & Protection (52.5%), while the most female-oriented occupations are Healthcare Support (97.6%), Personal Care & Service (86.2%), and Food Preparation & Serving (65.1%).
| Occupation | Male | Female |
| Healthcare Support | 4 (2.4%) | 164 (97.6%) |
| Security & Protection | 73 (52.5%) | 66 (47.5%) |
| Firefighting & Prevention | 30 (63.8%) | 17 (36.2%) |
| Law Enforcement | 43 (46.7%) | 49 (53.3%) |
| Food Preparation & Serving | 46 (34.8%) | 86 (65.1%) |
| Cleaning & Maintenance | 126 (82.4%) | 27 (17.6%) |
| Personal Care & Service | 8 (13.8%) | 50 (86.2%) |
| Total (Category) | 257 (39.5%) | 393 (60.5%) |
| Total (Overall) | 1,669 (51.3%) | 1,587 (48.7%) |
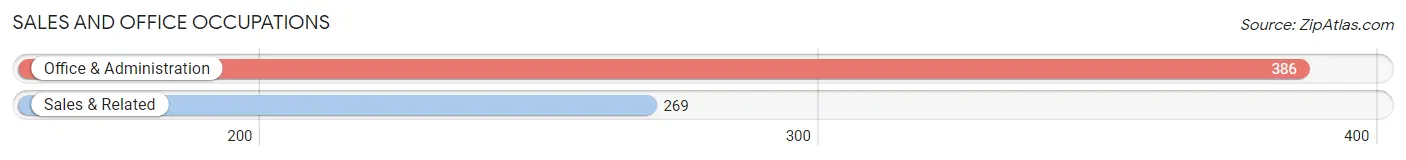
Sales and Office Occupations
The most common Sales and Office occupations in Wilkinson County are Office & Administration (386 | 11.9%), and Sales & Related (269 | 8.3%).
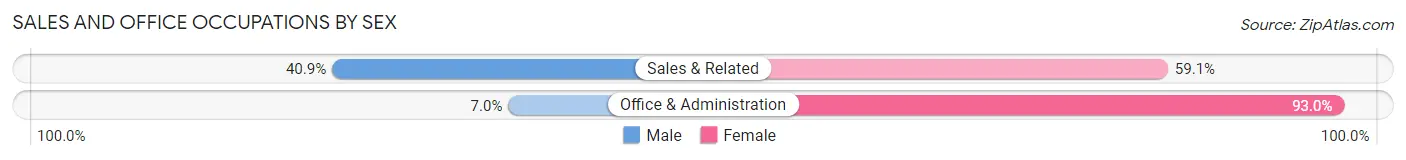
Sales and Office Occupations by Sex
| Occupation | Male | Female |
| Sales & Related | 110 (40.9%) | 159 (59.1%) |
| Office & Administration | 27 (7.0%) | 359 (93.0%) |
| Total (Category) | 137 (20.9%) | 518 (79.1%) |
| Total (Overall) | 1,669 (51.3%) | 1,587 (48.7%) |
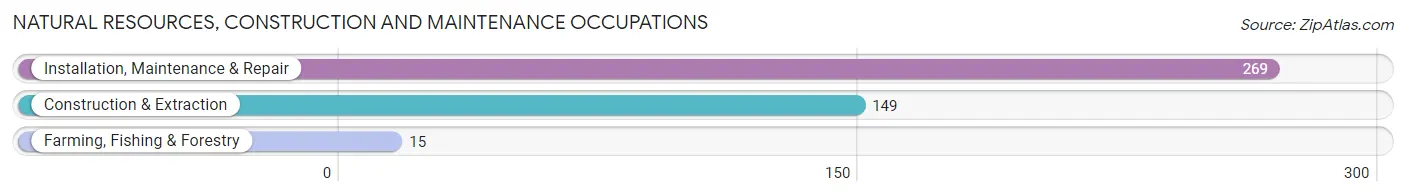
Natural Resources, Construction and Maintenance Occupations
The most common Natural Resources, Construction and Maintenance occupations in Wilkinson County are Installation, Maintenance & Repair (269 | 8.3%), Construction & Extraction (149 | 4.6%), and Farming, Fishing & Forestry (15 | 0.5%).
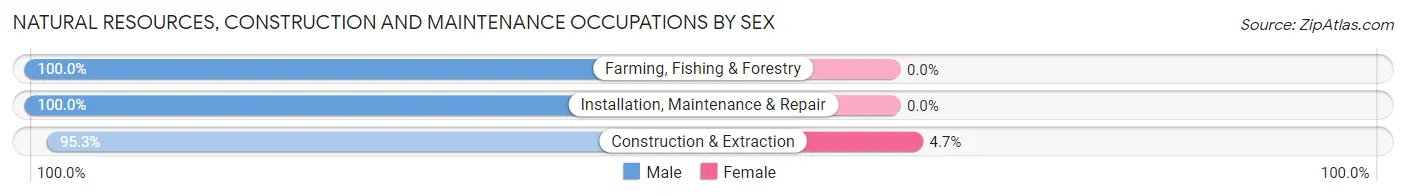
Natural Resources, Construction and Maintenance Occupations by Sex
| Occupation | Male | Female |
| Farming, Fishing & Forestry | 15 (100.0%) | 0 (0.0%) |
| Construction & Extraction | 142 (95.3%) | 7 (4.7%) |
| Installation, Maintenance & Repair | 269 (100.0%) | 0 (0.0%) |
| Total (Category) | 426 (98.4%) | 7 (1.6%) |
| Total (Overall) | 1,669 (51.3%) | 1,587 (48.7%) |
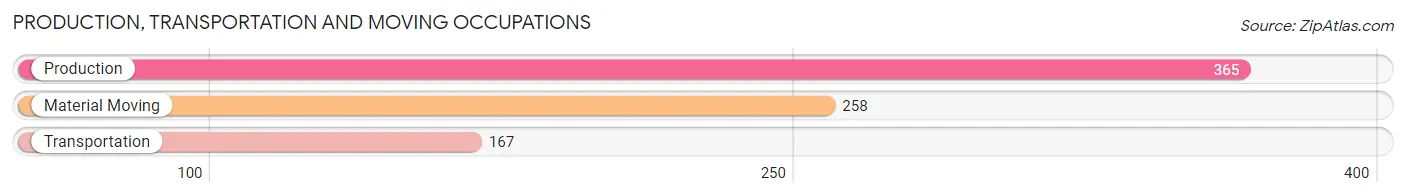
Production, Transportation and Moving Occupations
The most common Production, Transportation and Moving occupations in Wilkinson County are Production (365 | 11.2%), Material Moving (258 | 7.9%), and Transportation (167 | 5.1%).
Production, Transportation and Moving Occupations by Sex
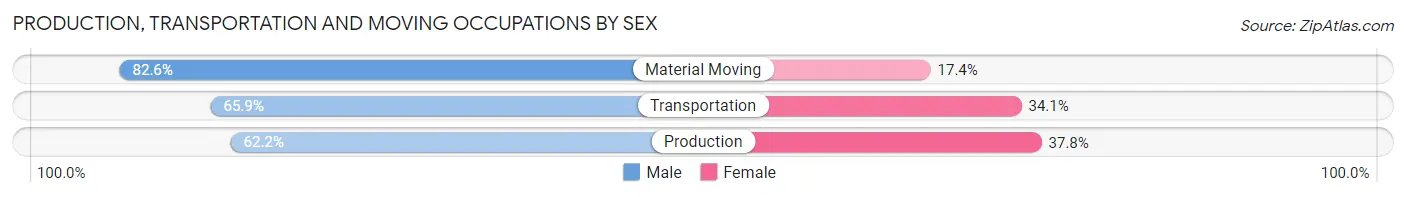
| Occupation | Male | Female |
| Production | 227 (62.2%) | 138 (37.8%) |
| Transportation | 110 (65.9%) | 57 (34.1%) |
| Material Moving | 213 (82.6%) | 45 (17.4%) |
| Total (Category) | 550 (69.6%) | 240 (30.4%) |
| Total (Overall) | 1,669 (51.3%) | 1,587 (48.7%) |
Employment Industries by Sex in Wilkinson County
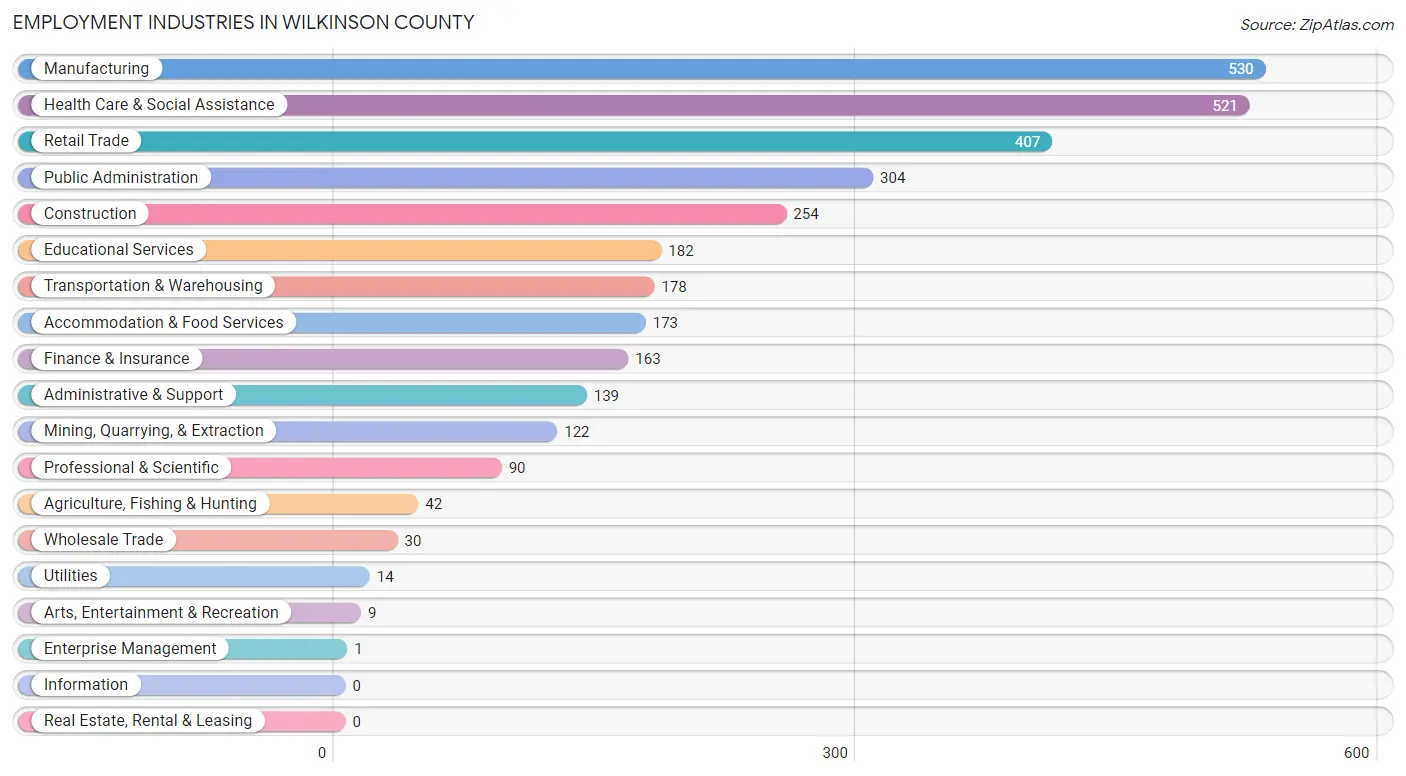
Employment Industries in Wilkinson County
The major employment industries in Wilkinson County include Manufacturing (530 | 16.3%), Health Care & Social Assistance (521 | 16.0%), Retail Trade (407 | 12.5%), Public Administration (304 | 9.3%), and Construction (254 | 7.8%).
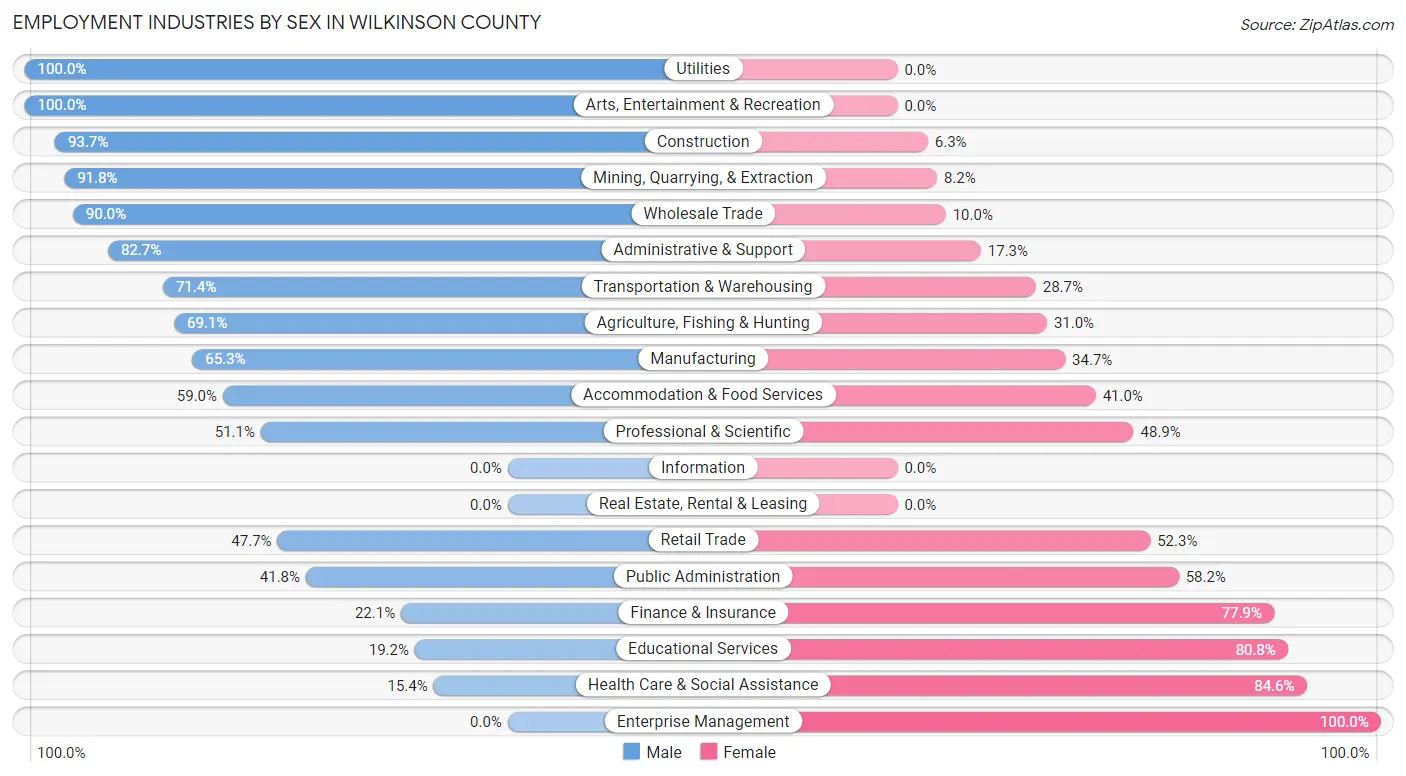
Employment Industries by Sex in Wilkinson County
The Wilkinson County industries that see more men than women are Utilities (100.0%), Arts, Entertainment & Recreation (100.0%), and Construction (93.7%), whereas the industries that tend to have a higher number of women are Enterprise Management (100.0%), Health Care & Social Assistance (84.6%), and Educational Services (80.8%).
| Industry | Male | Female |
| Agriculture, Fishing & Hunting | 29 (69.1%) | 13 (30.9%) |
| Mining, Quarrying, & Extraction | 112 (91.8%) | 10 (8.2%) |
| Construction | 238 (93.7%) | 16 (6.3%) |
| Manufacturing | 346 (65.3%) | 184 (34.7%) |
| Wholesale Trade | 27 (90.0%) | 3 (10.0%) |
| Retail Trade | 194 (47.7%) | 213 (52.3%) |
| Transportation & Warehousing | 127 (71.4%) | 51 (28.6%) |
| Utilities | 14 (100.0%) | 0 (0.0%) |
| Information | 0 (0.0%) | 0 (0.0%) |
| Finance & Insurance | 36 (22.1%) | 127 (77.9%) |
| Real Estate, Rental & Leasing | 0 (0.0%) | 0 (0.0%) |
| Professional & Scientific | 46 (51.1%) | 44 (48.9%) |
| Enterprise Management | 0 (0.0%) | 1 (100.0%) |
| Administrative & Support | 115 (82.7%) | 24 (17.3%) |
| Educational Services | 35 (19.2%) | 147 (80.8%) |
| Health Care & Social Assistance | 80 (15.4%) | 441 (84.6%) |
| Arts, Entertainment & Recreation | 9 (100.0%) | 0 (0.0%) |
| Accommodation & Food Services | 102 (59.0%) | 71 (41.0%) |
| Public Administration | 127 (41.8%) | 177 (58.2%) |
| Total | 1,669 (51.3%) | 1,587 (48.7%) |
Education in Wilkinson County
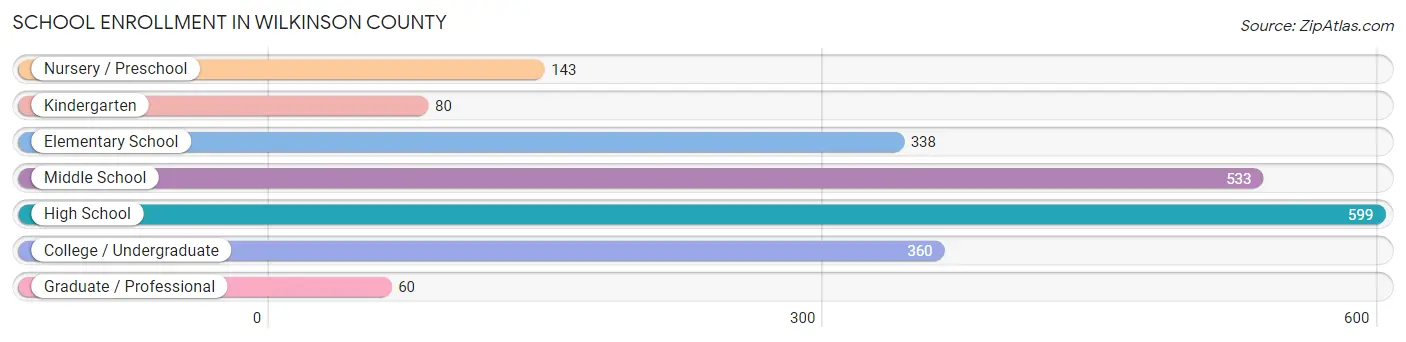
School Enrollment in Wilkinson County
The most common levels of schooling among the 2,113 students in Wilkinson County are high school (599 | 28.3%), middle school (533 | 25.2%), and college / undergraduate (360 | 17.0%).
| School Level | # Students | % Students |
| Nursery / Preschool | 143 | 6.8% |
| Kindergarten | 80 | 3.8% |
| Elementary School | 338 | 16.0% |
| Middle School | 533 | 25.2% |
| High School | 599 | 28.3% |
| College / Undergraduate | 360 | 17.0% |
| Graduate / Professional | 60 | 2.8% |
| Total | 2,113 | 100.0% |
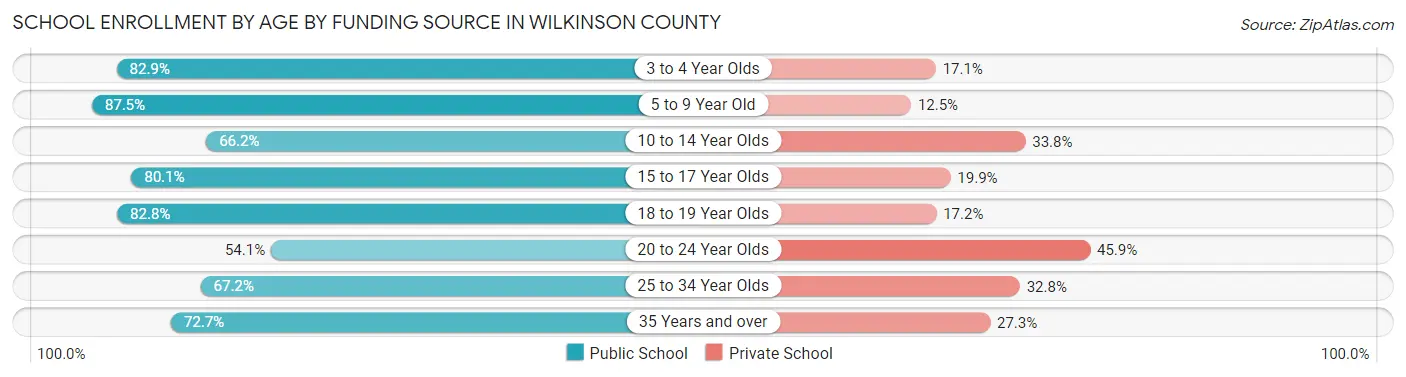
School Enrollment by Age by Funding Source in Wilkinson County
Out of a total of 2,113 students who are enrolled in schools in Wilkinson County, 558 (26.4%) attend a private institution, while the remaining 1,555 (73.6%) are enrolled in public schools. The age group of 20 to 24 year olds has the highest likelihood of being enrolled in private schools, with 95 (45.9% in the age bracket) enrolled. Conversely, the age group of 5 to 9 year old has the lowest likelihood of being enrolled in a private school, with 335 (87.5% in the age bracket) attending a public institution.
| Age Bracket | Public School | Private School |
| 3 to 4 Year Olds | 87 (82.9%) | 18 (17.1%) |
| 5 to 9 Year Old | 335 (87.5%) | 48 (12.5%) |
| 10 to 14 Year Olds | 489 (66.2%) | 250 (33.8%) |
| 15 to 17 Year Olds | 266 (80.1%) | 66 (19.9%) |
| 18 to 19 Year Olds | 168 (82.8%) | 35 (17.2%) |
| 20 to 24 Year Olds | 112 (54.1%) | 95 (45.9%) |
| 25 to 34 Year Olds | 82 (67.2%) | 40 (32.8%) |
| 35 Years and over | 16 (72.7%) | 6 (27.3%) |
| Total | 1,555 (73.6%) | 558 (26.4%) |
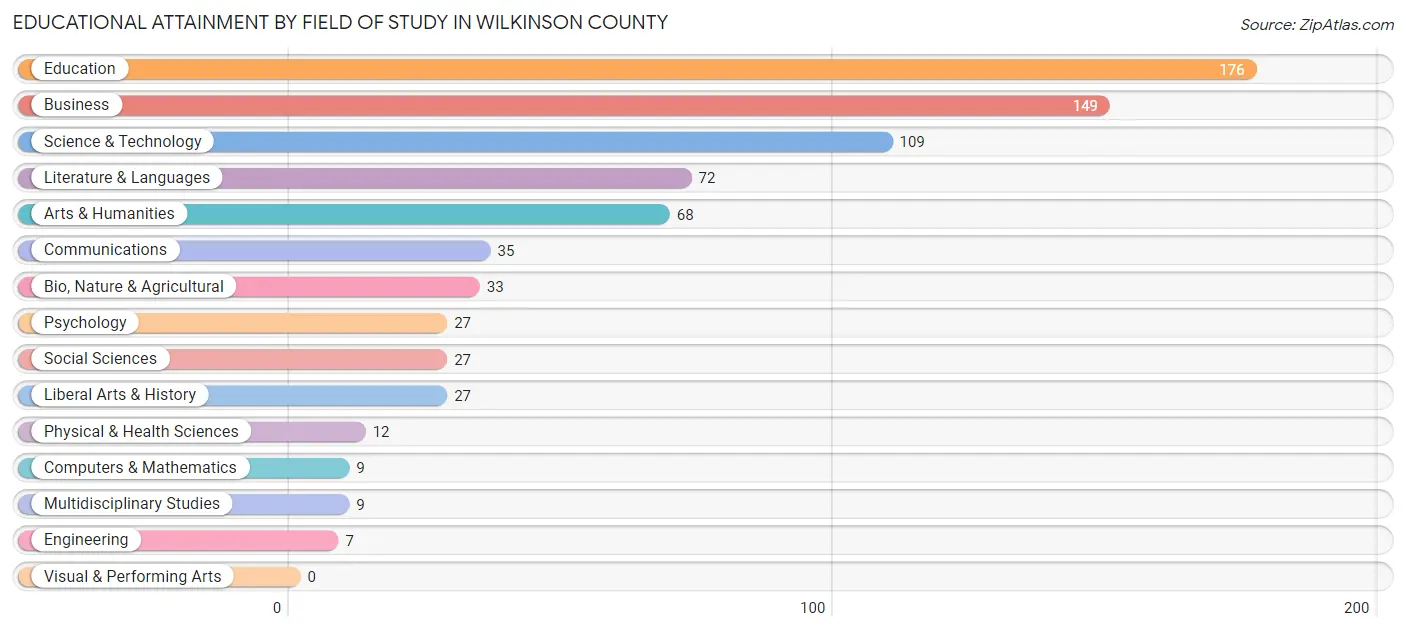
Educational Attainment by Field of Study in Wilkinson County
Education (176 | 23.2%), business (149 | 19.6%), science & technology (109 | 14.3%), literature & languages (72 | 9.5%), and arts & humanities (68 | 8.9%) are the most common fields of study among 760 individuals in Wilkinson County who have obtained a bachelor's degree or higher.
| Field of Study | # Graduates | % Graduates |
| Computers & Mathematics | 9 | 1.2% |
| Bio, Nature & Agricultural | 33 | 4.3% |
| Physical & Health Sciences | 12 | 1.6% |
| Psychology | 27 | 3.5% |
| Social Sciences | 27 | 3.5% |
| Engineering | 7 | 0.9% |
| Multidisciplinary Studies | 9 | 1.2% |
| Science & Technology | 109 | 14.3% |
| Business | 149 | 19.6% |
| Education | 176 | 23.2% |
| Literature & Languages | 72 | 9.5% |
| Liberal Arts & History | 27 | 3.5% |
| Visual & Performing Arts | 0 | 0.0% |
| Communications | 35 | 4.6% |
| Arts & Humanities | 68 | 8.9% |
| Total | 760 | 100.0% |
Transportation & Commute in Wilkinson County
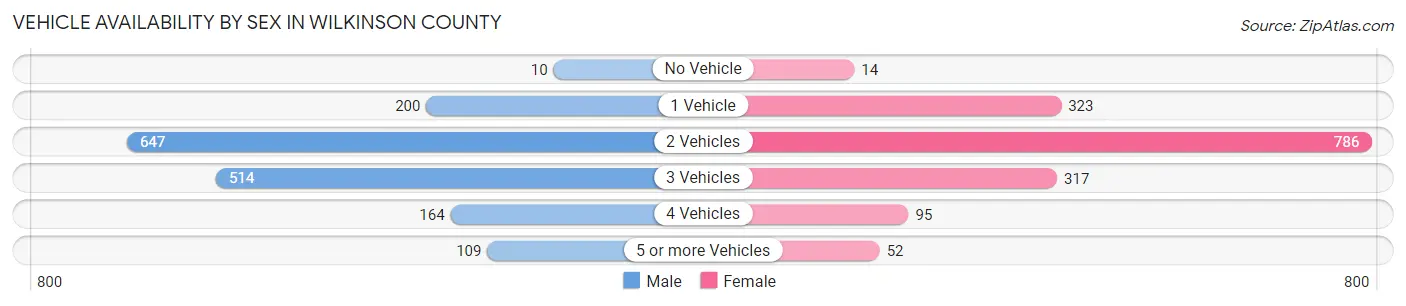
Vehicle Availability by Sex in Wilkinson County
The most prevalent vehicle ownership categories in Wilkinson County are males with 2 vehicles (647, accounting for 39.4%) and females with 2 vehicles (786, making up 40.8%).
| Vehicles Available | Male | Female |
| No Vehicle | 10 (0.6%) | 14 (0.9%) |
| 1 Vehicle | 200 (12.2%) | 323 (20.3%) |
| 2 Vehicles | 647 (39.4%) | 786 (49.5%) |
| 3 Vehicles | 514 (31.3%) | 317 (20.0%) |
| 4 Vehicles | 164 (10.0%) | 95 (6.0%) |
| 5 or more Vehicles | 109 (6.6%) | 52 (3.3%) |
| Total | 1,644 (100.0%) | 1,587 (100.0%) |
Commute Time in Wilkinson County
The most frequently occuring commute durations in Wilkinson County are 5 to 9 minutes (560 commuters, 18.0%), 30 to 34 minutes (456 commuters, 14.6%), and 20 to 24 minutes (335 commuters, 10.7%).
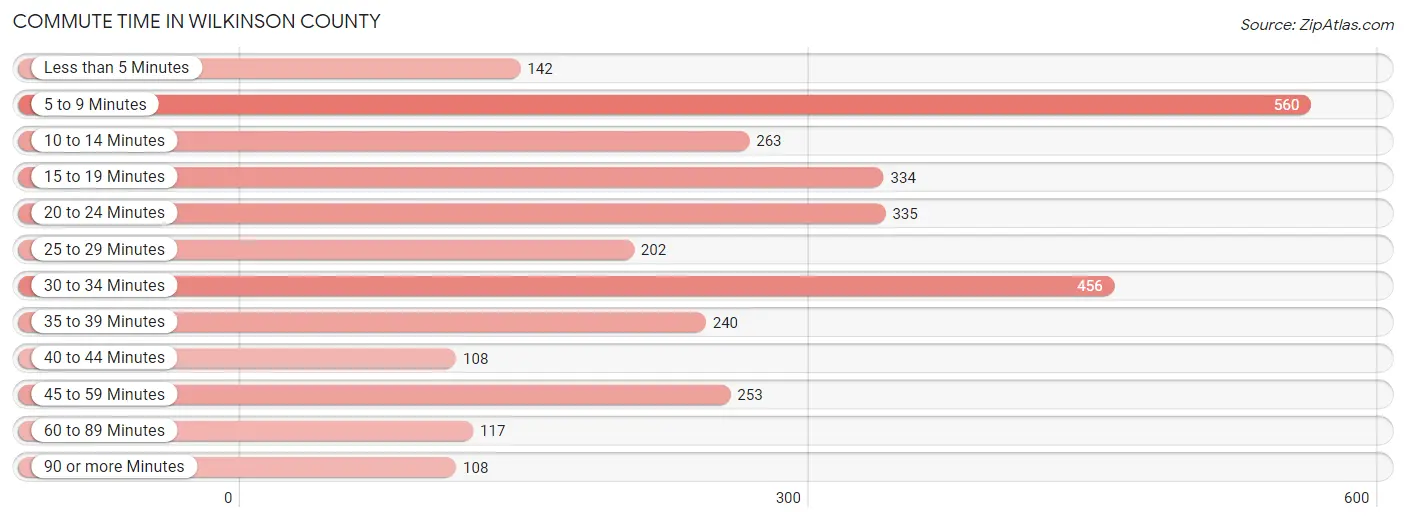
| Commute Time | # Commuters | % Commuters |
| Less than 5 Minutes | 142 | 4.5% |
| 5 to 9 Minutes | 560 | 18.0% |
| 10 to 14 Minutes | 263 | 8.4% |
| 15 to 19 Minutes | 334 | 10.7% |
| 20 to 24 Minutes | 335 | 10.7% |
| 25 to 29 Minutes | 202 | 6.5% |
| 30 to 34 Minutes | 456 | 14.6% |
| 35 to 39 Minutes | 240 | 7.7% |
| 40 to 44 Minutes | 108 | 3.5% |
| 45 to 59 Minutes | 253 | 8.1% |
| 60 to 89 Minutes | 117 | 3.7% |
| 90 or more Minutes | 108 | 3.5% |
Commute Time by Sex in Wilkinson County
The most common commute times in Wilkinson County are 30 to 34 minutes (293 commuters, 18.3%) for males and 5 to 9 minutes (288 commuters, 19.0%) for females.
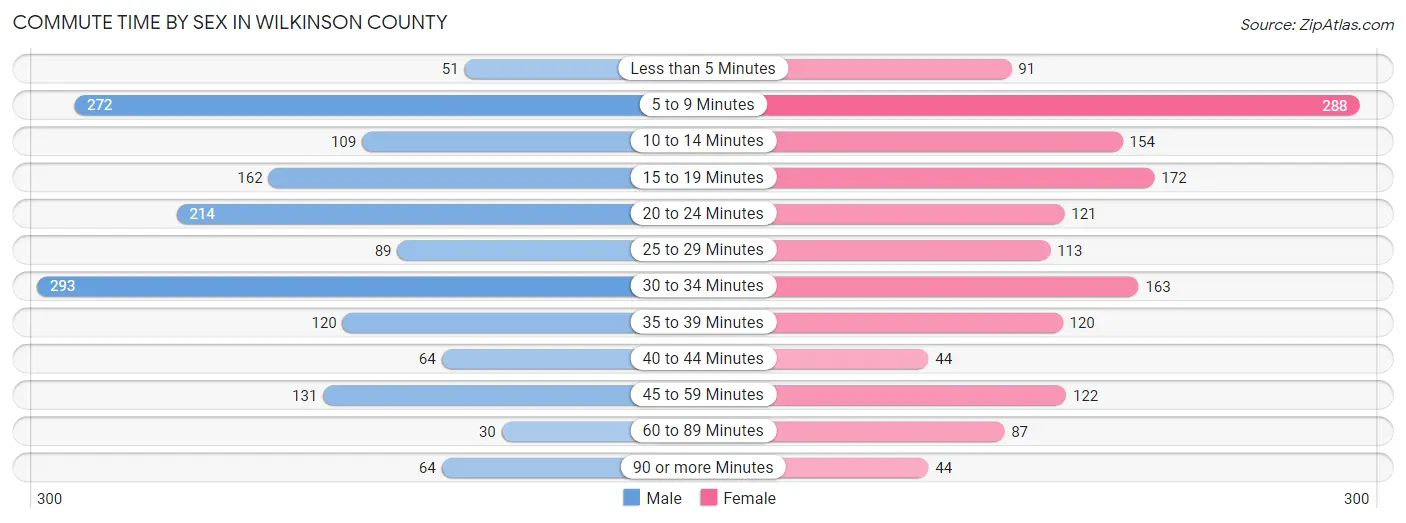
| Commute Time | Male | Female |
| Less than 5 Minutes | 51 (3.2%) | 91 (6.0%) |
| 5 to 9 Minutes | 272 (17.0%) | 288 (19.0%) |
| 10 to 14 Minutes | 109 (6.8%) | 154 (10.1%) |
| 15 to 19 Minutes | 162 (10.1%) | 172 (11.3%) |
| 20 to 24 Minutes | 214 (13.4%) | 121 (8.0%) |
| 25 to 29 Minutes | 89 (5.6%) | 113 (7.4%) |
| 30 to 34 Minutes | 293 (18.3%) | 163 (10.7%) |
| 35 to 39 Minutes | 120 (7.5%) | 120 (7.9%) |
| 40 to 44 Minutes | 64 (4.0%) | 44 (2.9%) |
| 45 to 59 Minutes | 131 (8.2%) | 122 (8.0%) |
| 60 to 89 Minutes | 30 (1.9%) | 87 (5.7%) |
| 90 or more Minutes | 64 (4.0%) | 44 (2.9%) |
Time of Departure to Work by Sex in Wilkinson County
The most frequent times of departure to work in Wilkinson County are 7:00 AM to 7:29 AM (306, 19.1%) for males and 7:00 AM to 7:29 AM (297, 19.6%) for females.
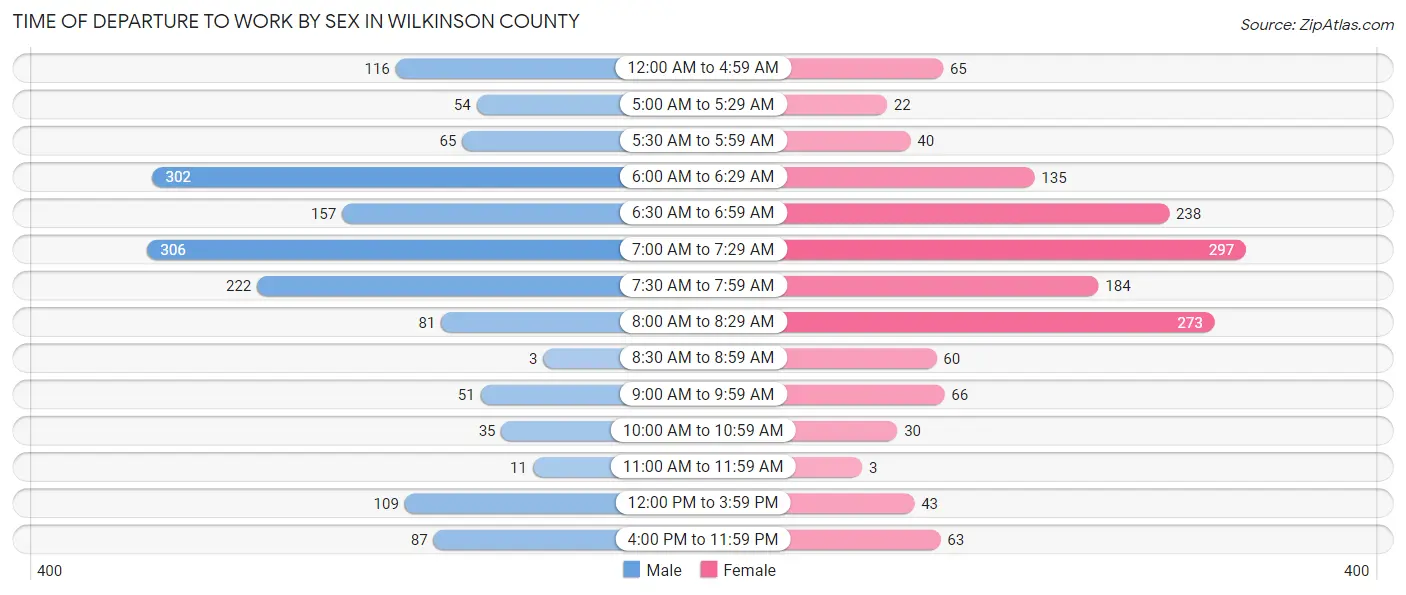
| Time of Departure | Male | Female |
| 12:00 AM to 4:59 AM | 116 (7.2%) | 65 (4.3%) |
| 5:00 AM to 5:29 AM | 54 (3.4%) | 22 (1.5%) |
| 5:30 AM to 5:59 AM | 65 (4.1%) | 40 (2.6%) |
| 6:00 AM to 6:29 AM | 302 (18.9%) | 135 (8.9%) |
| 6:30 AM to 6:59 AM | 157 (9.8%) | 238 (15.7%) |
| 7:00 AM to 7:29 AM | 306 (19.1%) | 297 (19.6%) |
| 7:30 AM to 7:59 AM | 222 (13.9%) | 184 (12.1%) |
| 8:00 AM to 8:29 AM | 81 (5.1%) | 273 (18.0%) |
| 8:30 AM to 8:59 AM | 3 (0.2%) | 60 (4.0%) |
| 9:00 AM to 9:59 AM | 51 (3.2%) | 66 (4.3%) |
| 10:00 AM to 10:59 AM | 35 (2.2%) | 30 (2.0%) |
| 11:00 AM to 11:59 AM | 11 (0.7%) | 3 (0.2%) |
| 12:00 PM to 3:59 PM | 109 (6.8%) | 43 (2.8%) |
| 4:00 PM to 11:59 PM | 87 (5.4%) | 63 (4.2%) |
| Total | 1,599 (100.0%) | 1,519 (100.0%) |
Housing Occupancy in Wilkinson County
Occupancy by Ownership in Wilkinson County
Of the total 3,313 dwellings in Wilkinson County, owner-occupied units account for 2,661 (80.3%), while renter-occupied units make up 652 (19.7%).
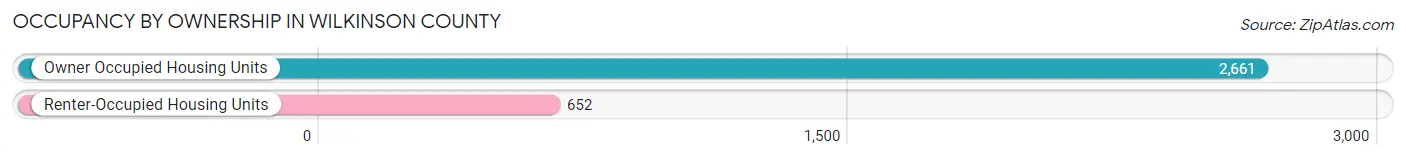
| Occupancy | # Housing Units | % Housing Units |
| Owner Occupied Housing Units | 2,661 | 80.3% |
| Renter-Occupied Housing Units | 652 | 19.7% |
| Total Occupied Housing Units | 3,313 | 100.0% |
Occupancy by Household Size in Wilkinson County
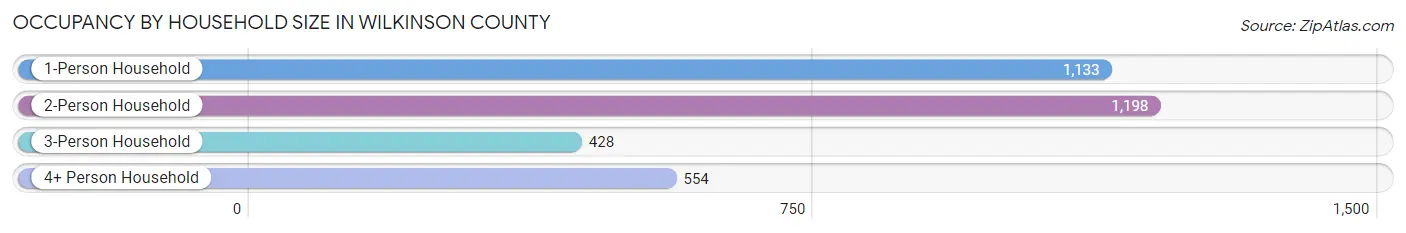
| Household Size | # Housing Units | % Housing Units |
| 1-Person Household | 1,133 | 34.2% |
| 2-Person Household | 1,198 | 36.2% |
| 3-Person Household | 428 | 12.9% |
| 4+ Person Household | 554 | 16.7% |
| Total Housing Units | 3,313 | 100.0% |
Occupancy by Ownership by Household Size in Wilkinson County
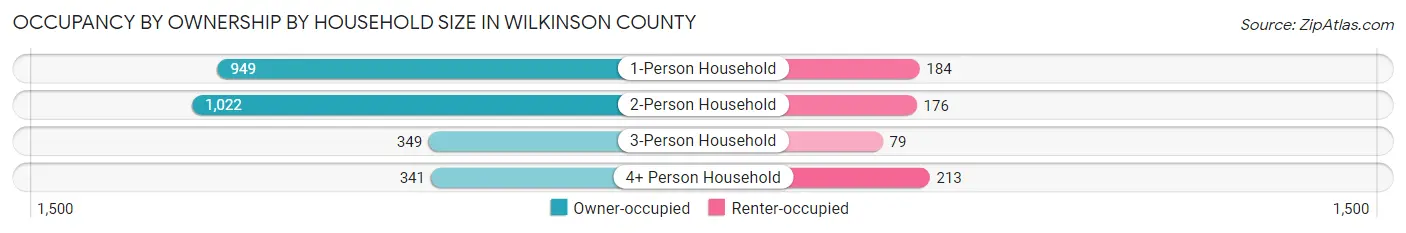
| Household Size | Owner-occupied | Renter-occupied |
| 1-Person Household | 949 (83.8%) | 184 (16.2%) |
| 2-Person Household | 1,022 (85.3%) | 176 (14.7%) |
| 3-Person Household | 349 (81.5%) | 79 (18.5%) |
| 4+ Person Household | 341 (61.6%) | 213 (38.5%) |
| Total Housing Units | 2,661 (80.3%) | 652 (19.7%) |
Occupancy by Educational Attainment in Wilkinson County
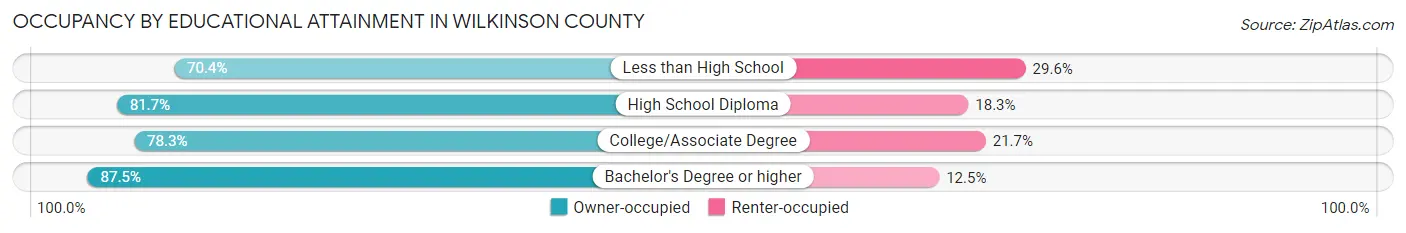
| Household Size | Owner-occupied | Renter-occupied |
| Less than High School | 235 (70.4%) | 99 (29.6%) |
| High School Diploma | 1,270 (81.7%) | 284 (18.3%) |
| College/Associate Degree | 771 (78.3%) | 214 (21.7%) |
| Bachelor's Degree or higher | 385 (87.5%) | 55 (12.5%) |
Occupancy by Age of Householder in Wilkinson County
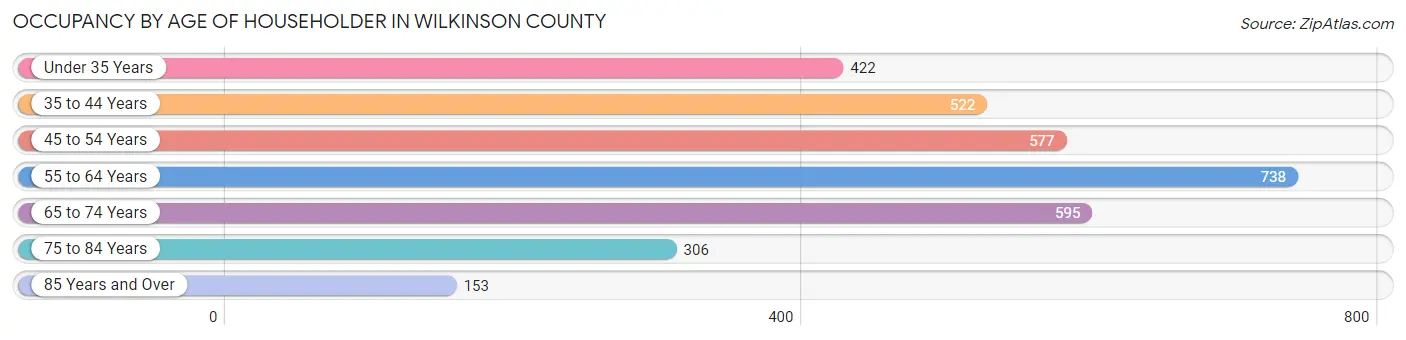
| Age Bracket | # Households | % Households |
| Under 35 Years | 422 | 12.7% |
| 35 to 44 Years | 522 | 15.8% |
| 45 to 54 Years | 577 | 17.4% |
| 55 to 64 Years | 738 | 22.3% |
| 65 to 74 Years | 595 | 18.0% |
| 75 to 84 Years | 306 | 9.2% |
| 85 Years and Over | 153 | 4.6% |
| Total | 3,313 | 100.0% |
Housing Finances in Wilkinson County
Median Income by Occupancy in Wilkinson County
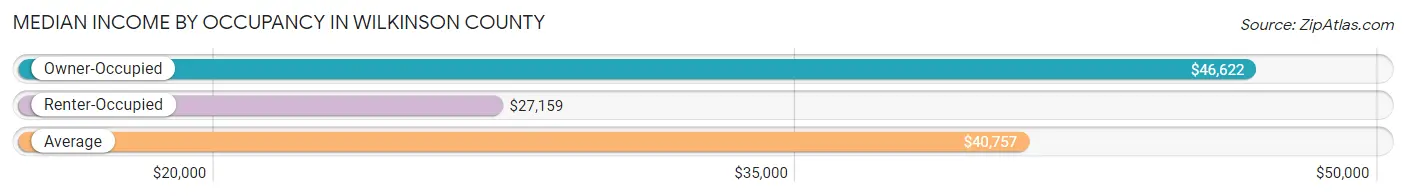
| Occupancy Type | # Households | Median Income |
| Owner-Occupied | 2,661 (80.3%) | $46,622 |
| Renter-Occupied | 652 (19.7%) | $27,159 |
| Average | 3,313 (100.0%) | $40,757 |
Occupancy by Householder Income Bracket in Wilkinson County
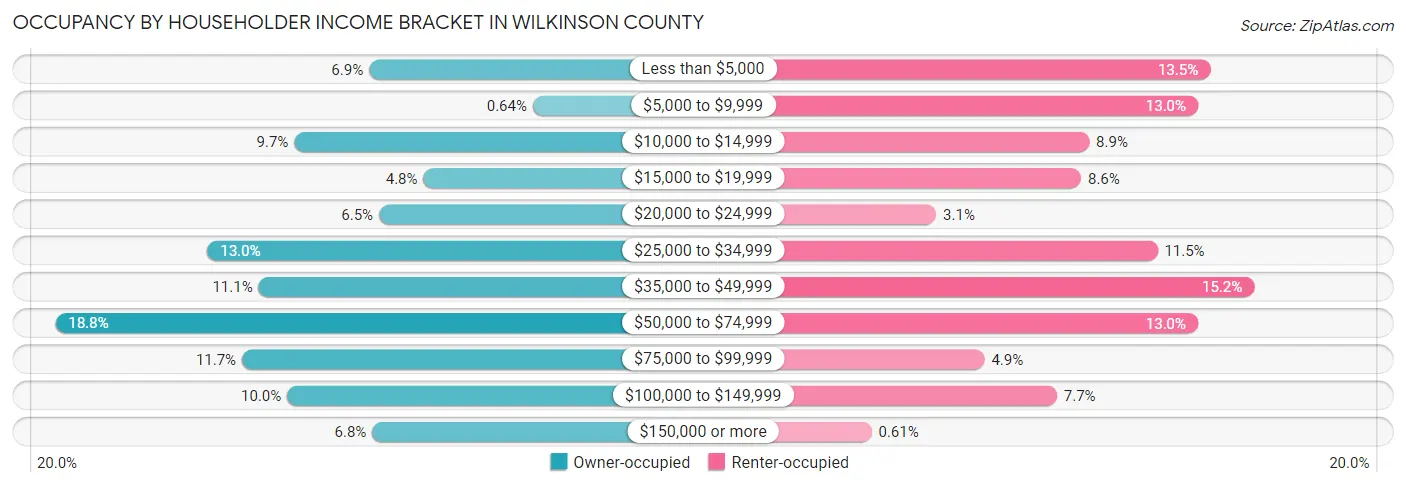
| Income Bracket | Owner-occupied | Renter-occupied |
| Less than $5,000 | 183 (6.9%) | 88 (13.5%) |
| $5,000 to $9,999 | 17 (0.6%) | 85 (13.0%) |
| $10,000 to $14,999 | 259 (9.7%) | 58 (8.9%) |
| $15,000 to $19,999 | 128 (4.8%) | 56 (8.6%) |
| $20,000 to $24,999 | 173 (6.5%) | 20 (3.1%) |
| $25,000 to $34,999 | 347 (13.0%) | 75 (11.5%) |
| $35,000 to $49,999 | 295 (11.1%) | 99 (15.2%) |
| $50,000 to $74,999 | 501 (18.8%) | 85 (13.0%) |
| $75,000 to $99,999 | 312 (11.7%) | 32 (4.9%) |
| $100,000 to $149,999 | 266 (10.0%) | 50 (7.7%) |
| $150,000 or more | 180 (6.8%) | 4 (0.6%) |
| Total | 2,661 (100.0%) | 652 (100.0%) |
Monthly Housing Cost Tiers in Wilkinson County
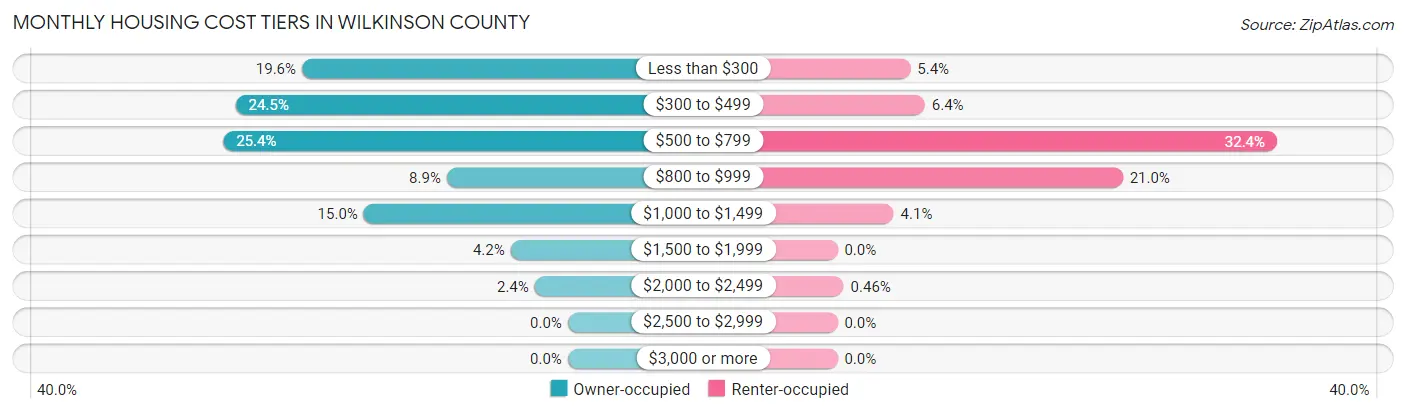
| Monthly Cost | Owner-occupied | Renter-occupied |
| Less than $300 | 521 (19.6%) | 35 (5.4%) |
| $300 to $499 | 651 (24.5%) | 42 (6.4%) |
| $500 to $799 | 675 (25.4%) | 211 (32.4%) |
| $800 to $999 | 237 (8.9%) | 137 (21.0%) |
| $1,000 to $1,499 | 400 (15.0%) | 27 (4.1%) |
| $1,500 to $1,999 | 112 (4.2%) | 0 (0.0%) |
| $2,000 to $2,499 | 65 (2.4%) | 3 (0.5%) |
| $2,500 to $2,999 | 0 (0.0%) | 0 (0.0%) |
| $3,000 or more | 0 (0.0%) | 0 (0.0%) |
| Total | 2,661 (100.0%) | 652 (100.0%) |
Physical Housing Characteristics in Wilkinson County
Housing Structures in Wilkinson County
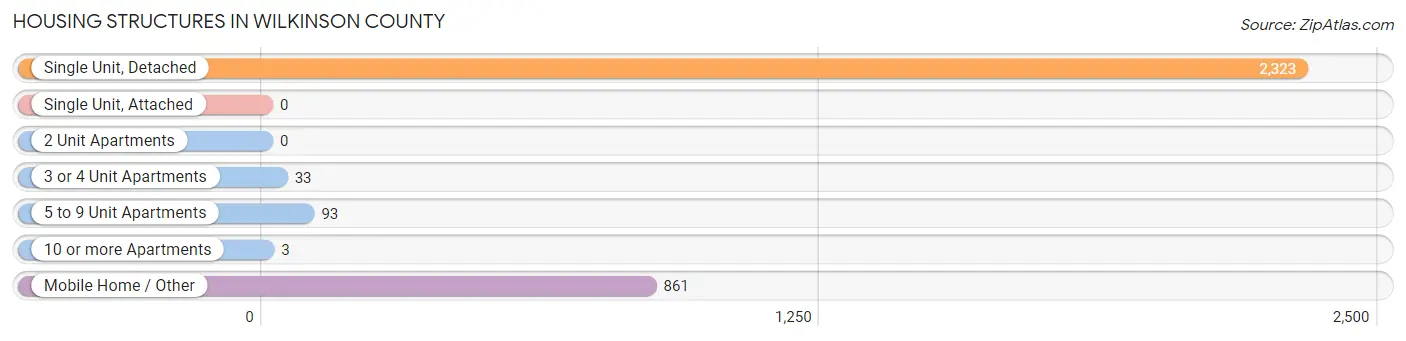
| Structure Type | # Housing Units | % Housing Units |
| Single Unit, Detached | 2,323 | 70.1% |
| Single Unit, Attached | 0 | 0.0% |
| 2 Unit Apartments | 0 | 0.0% |
| 3 or 4 Unit Apartments | 33 | 1.0% |
| 5 to 9 Unit Apartments | 93 | 2.8% |
| 10 or more Apartments | 3 | 0.1% |
| Mobile Home / Other | 861 | 26.0% |
| Total | 3,313 | 100.0% |
Housing Structures by Occupancy in Wilkinson County
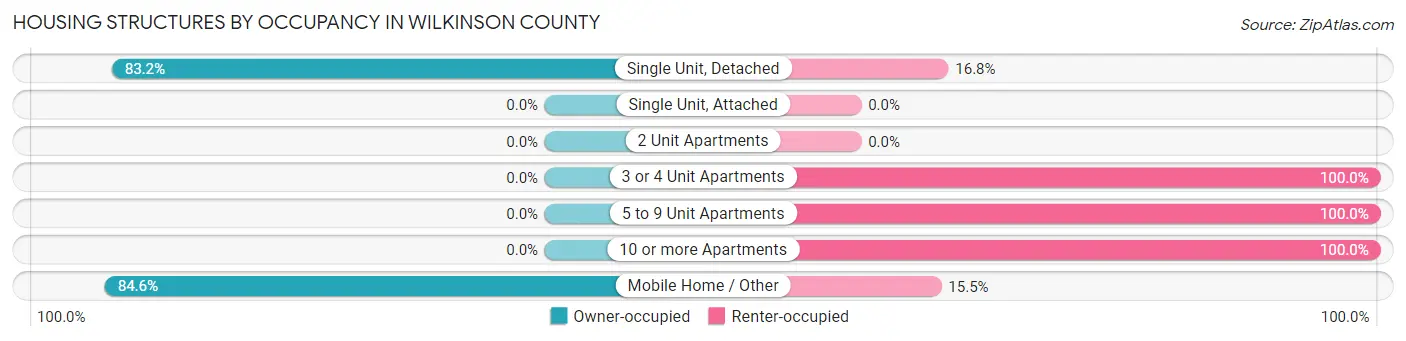
| Structure Type | Owner-occupied | Renter-occupied |
| Single Unit, Detached | 1,933 (83.2%) | 390 (16.8%) |
| Single Unit, Attached | 0 (0.0%) | 0 (0.0%) |
| 2 Unit Apartments | 0 (0.0%) | 0 (0.0%) |
| 3 or 4 Unit Apartments | 0 (0.0%) | 33 (100.0%) |
| 5 to 9 Unit Apartments | 0 (0.0%) | 93 (100.0%) |
| 10 or more Apartments | 0 (0.0%) | 3 (100.0%) |
| Mobile Home / Other | 728 (84.6%) | 133 (15.4%) |
| Total | 2,661 (80.3%) | 652 (19.7%) |
Housing Structures by Number of Rooms in Wilkinson County
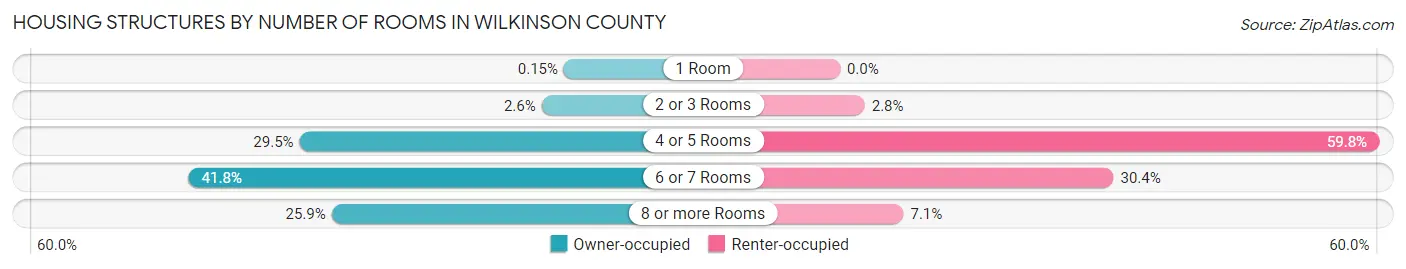
| Number of Rooms | Owner-occupied | Renter-occupied |
| 1 Room | 4 (0.2%) | 0 (0.0%) |
| 2 or 3 Rooms | 70 (2.6%) | 18 (2.8%) |
| 4 or 5 Rooms | 785 (29.5%) | 390 (59.8%) |
| 6 or 7 Rooms | 1,112 (41.8%) | 198 (30.4%) |
| 8 or more Rooms | 690 (25.9%) | 46 (7.1%) |
| Total | 2,661 (100.0%) | 652 (100.0%) |
Housing Structure by Heating Type in Wilkinson County
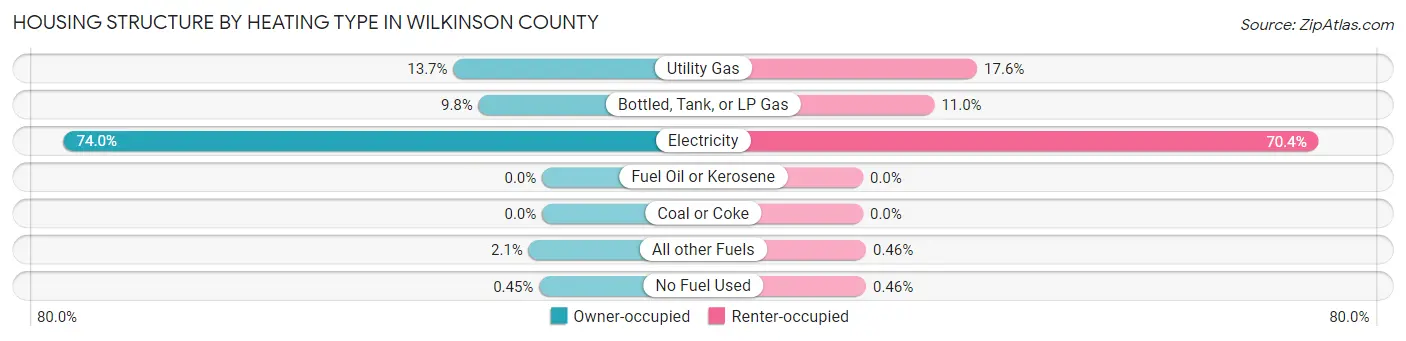
| Heating Type | Owner-occupied | Renter-occupied |
| Utility Gas | 365 (13.7%) | 115 (17.6%) |
| Bottled, Tank, or LP Gas | 261 (9.8%) | 72 (11.0%) |
| Electricity | 1,968 (74.0%) | 459 (70.4%) |
| Fuel Oil or Kerosene | 0 (0.0%) | 0 (0.0%) |
| Coal or Coke | 0 (0.0%) | 0 (0.0%) |
| All other Fuels | 55 (2.1%) | 3 (0.5%) |
| No Fuel Used | 12 (0.4%) | 3 (0.5%) |
| Total | 2,661 (100.0%) | 652 (100.0%) |
Household Vehicle Usage in Wilkinson County
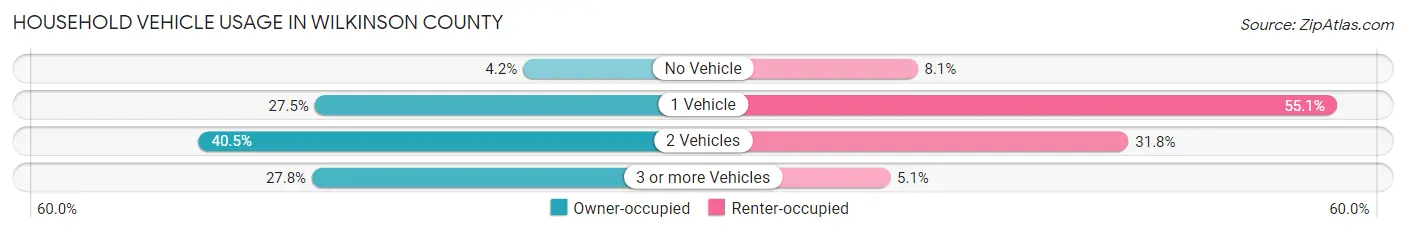
| Vehicles per Household | Owner-occupied | Renter-occupied |
| No Vehicle | 111 (4.2%) | 53 (8.1%) |
| 1 Vehicle | 732 (27.5%) | 359 (55.1%) |
| 2 Vehicles | 1,078 (40.5%) | 207 (31.8%) |
| 3 or more Vehicles | 740 (27.8%) | 33 (5.1%) |
| Total | 2,661 (100.0%) | 652 (100.0%) |
Real Estate & Mortgages in Wilkinson County
Real Estate and Mortgage Overview in Wilkinson County
| Characteristic | Without Mortgage | With Mortgage |
| Housing Units | 1,745 | 916 |
| Median Property Value | $81,600 | $100,000 |
| Median Household Income | $39,148 | $115 |
| Monthly Housing Costs | $390 | $0 |
| Real Estate Taxes | $713 | $12 |
Property Value by Mortgage Status in Wilkinson County
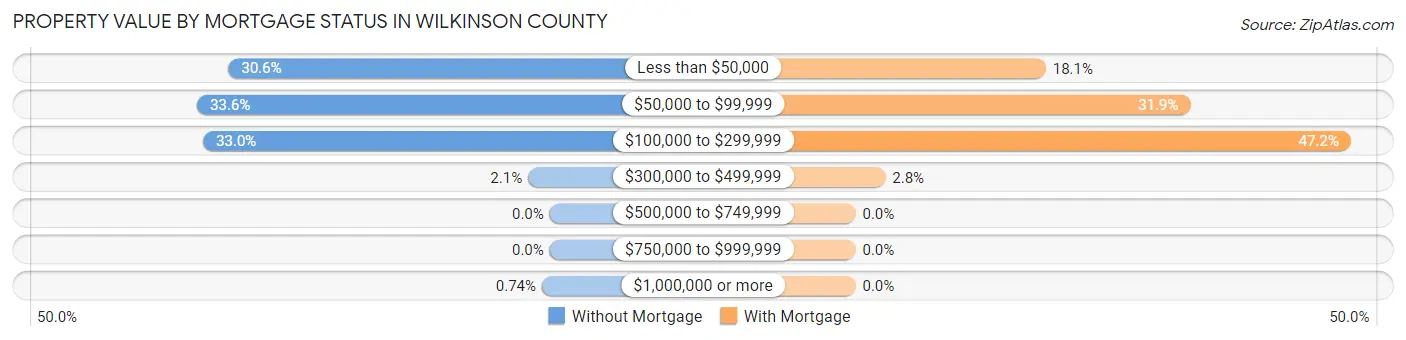
| Property Value | Without Mortgage | With Mortgage |
| Less than $50,000 | 534 (30.6%) | 166 (18.1%) |
| $50,000 to $99,999 | 586 (33.6%) | 292 (31.9%) |
| $100,000 to $299,999 | 576 (33.0%) | 432 (47.2%) |
| $300,000 to $499,999 | 36 (2.1%) | 26 (2.8%) |
| $500,000 to $749,999 | 0 (0.0%) | 0 (0.0%) |
| $750,000 to $999,999 | 0 (0.0%) | 0 (0.0%) |
| $1,000,000 or more | 13 (0.7%) | 0 (0.0%) |
| Total | 1,745 (100.0%) | 916 (100.0%) |
Household Income by Mortgage Status in Wilkinson County
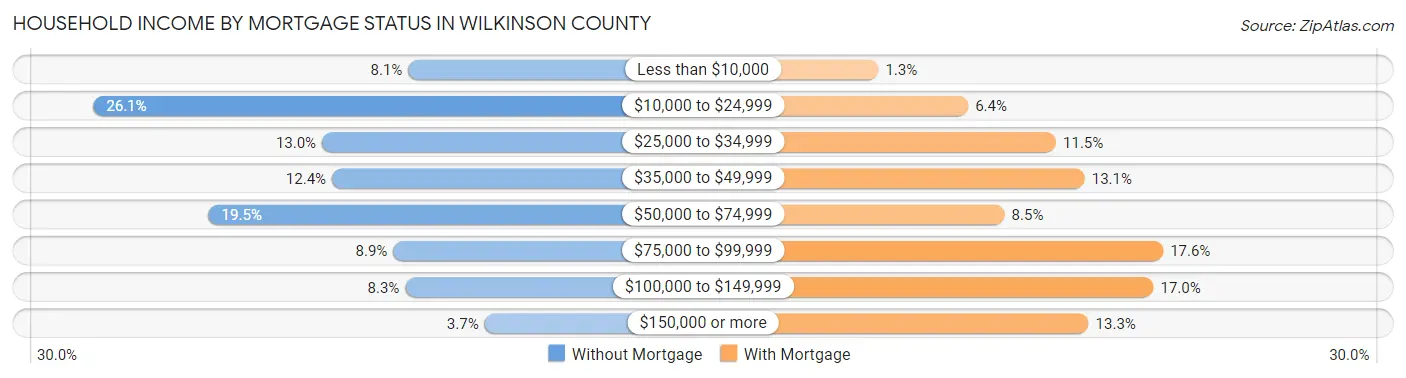
| Household Income | Without Mortgage | With Mortgage |
| Less than $10,000 | 141 (8.1%) | 12 (1.3%) |
| $10,000 to $24,999 | 455 (26.1%) | 59 (6.4%) |
| $25,000 to $34,999 | 227 (13.0%) | 105 (11.5%) |
| $35,000 to $49,999 | 217 (12.4%) | 120 (13.1%) |
| $50,000 to $74,999 | 340 (19.5%) | 78 (8.5%) |
| $75,000 to $99,999 | 156 (8.9%) | 161 (17.6%) |
| $100,000 to $149,999 | 144 (8.3%) | 156 (17.0%) |
| $150,000 or more | 65 (3.7%) | 122 (13.3%) |
| Total | 1,745 (100.0%) | 916 (100.0%) |
Property Value to Household Income Ratio in Wilkinson County
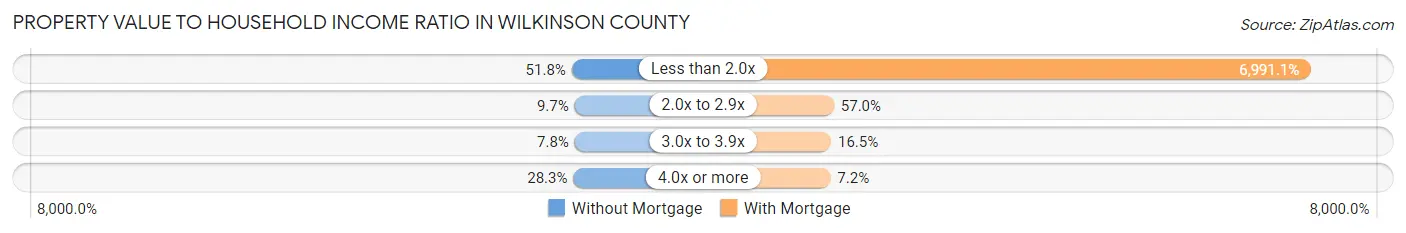
| Value-to-Income Ratio | Without Mortgage | With Mortgage |
| Less than 2.0x | 904 (51.8%) | 64,038 (6,991.0%) |
| 2.0x to 2.9x | 169 (9.7%) | 522 (57.0%) |
| 3.0x to 3.9x | 136 (7.8%) | 151 (16.5%) |
| 4.0x or more | 493 (28.2%) | 66 (7.2%) |
| Total | 1,745 (100.0%) | 916 (100.0%) |
Real Estate Taxes by Mortgage Status in Wilkinson County
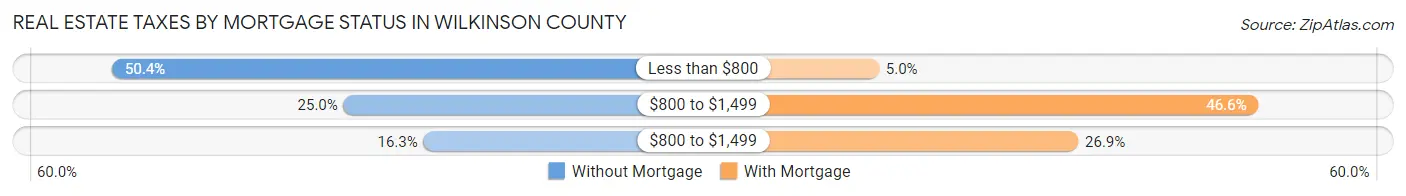
| Property Taxes | Without Mortgage | With Mortgage |
| Less than $800 | 880 (50.4%) | 46 (5.0%) |
| $800 to $1,499 | 437 (25.0%) | 427 (46.6%) |
| $800 to $1,499 | 284 (16.3%) | 246 (26.9%) |
| Total | 1,745 (100.0%) | 916 (100.0%) |
Health & Disability in Wilkinson County
Health Insurance Coverage by Age in Wilkinson County
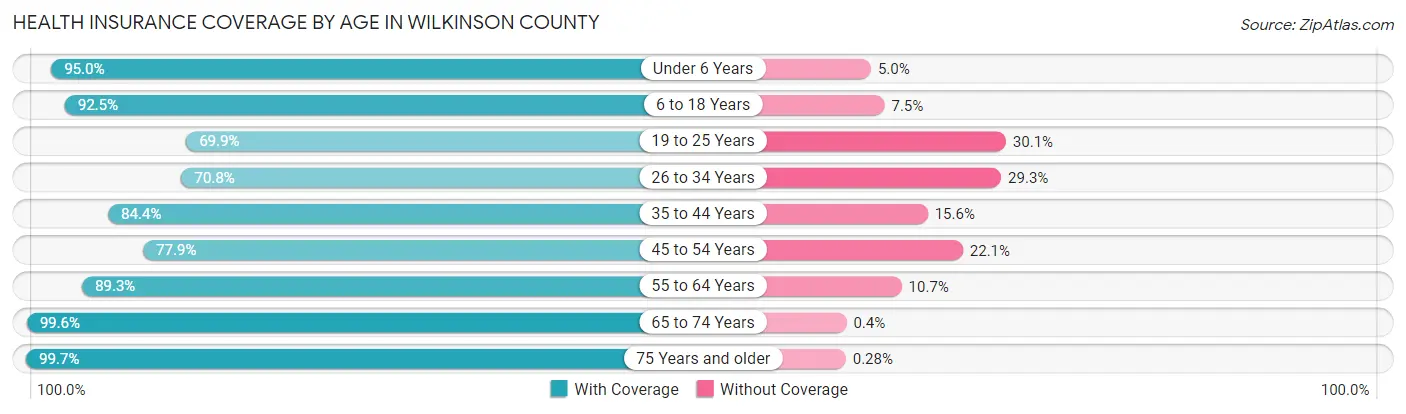
| Age Bracket | With Coverage | Without Coverage |
| Under 6 Years | 554 (95.0%) | 29 (5.0%) |
| 6 to 18 Years | 1,480 (92.5%) | 120 (7.5%) |
| 19 to 25 Years | 438 (69.9%) | 189 (30.1%) |
| 26 to 34 Years | 600 (70.8%) | 248 (29.2%) |
| 35 to 44 Years | 879 (84.4%) | 162 (15.6%) |
| 45 to 54 Years | 768 (77.9%) | 218 (22.1%) |
| 55 to 64 Years | 1,219 (89.3%) | 146 (10.7%) |
| 65 to 74 Years | 999 (99.6%) | 4 (0.4%) |
| 75 Years and older | 703 (99.7%) | 2 (0.3%) |
| Total | 7,640 (87.2%) | 1,118 (12.8%) |
Health Insurance Coverage by Citizenship Status in Wilkinson County
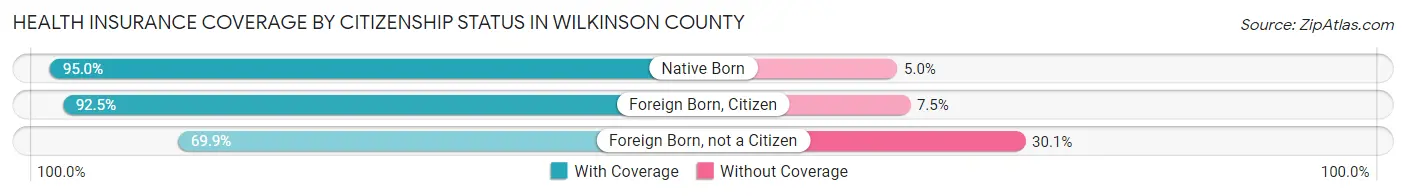
| Citizenship Status | With Coverage | Without Coverage |
| Native Born | 554 (95.0%) | 29 (5.0%) |
| Foreign Born, Citizen | 1,480 (92.5%) | 120 (7.5%) |
| Foreign Born, not a Citizen | 438 (69.9%) | 189 (30.1%) |
Health Insurance Coverage by Household Income in Wilkinson County
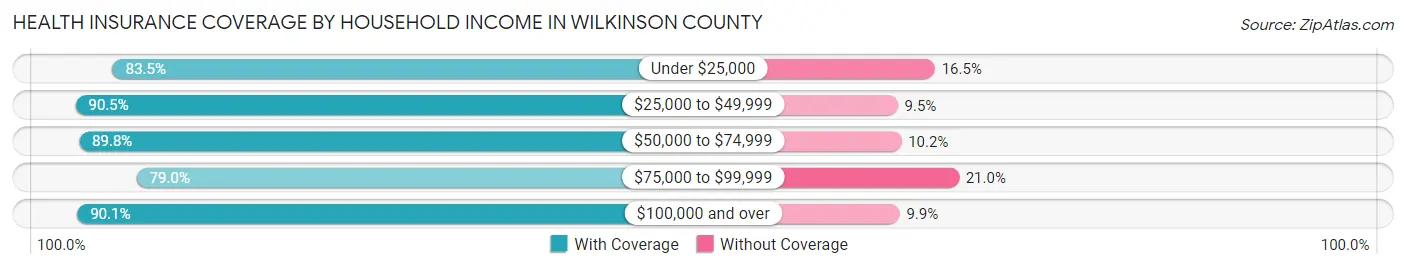
| Household Income | With Coverage | Without Coverage |
| Under $25,000 | 1,713 (83.5%) | 338 (16.5%) |
| $25,000 to $49,999 | 1,758 (90.5%) | 185 (9.5%) |
| $50,000 to $74,999 | 1,586 (89.8%) | 180 (10.2%) |
| $75,000 to $99,999 | 844 (79.0%) | 224 (21.0%) |
| $100,000 and over | 1,726 (90.1%) | 189 (9.9%) |
Public vs Private Health Insurance Coverage by Age in Wilkinson County
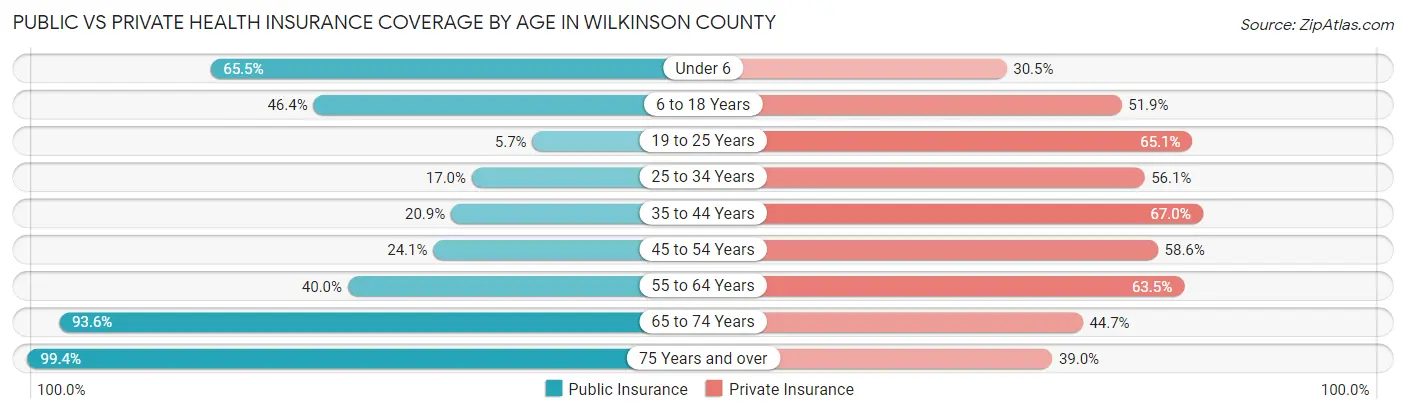
| Age Bracket | Public Insurance | Private Insurance |
| Under 6 | 382 (65.5%) | 178 (30.5%) |
| 6 to 18 Years | 742 (46.4%) | 830 (51.9%) |
| 19 to 25 Years | 36 (5.7%) | 408 (65.1%) |
| 25 to 34 Years | 144 (17.0%) | 476 (56.1%) |
| 35 to 44 Years | 217 (20.8%) | 697 (66.9%) |
| 45 to 54 Years | 238 (24.1%) | 578 (58.6%) |
| 55 to 64 Years | 546 (40.0%) | 867 (63.5%) |
| 65 to 74 Years | 939 (93.6%) | 448 (44.7%) |
| 75 Years and over | 701 (99.4%) | 275 (39.0%) |
| Total | 3,945 (45.0%) | 4,757 (54.3%) |
Disability Status by Sex by Age in Wilkinson County
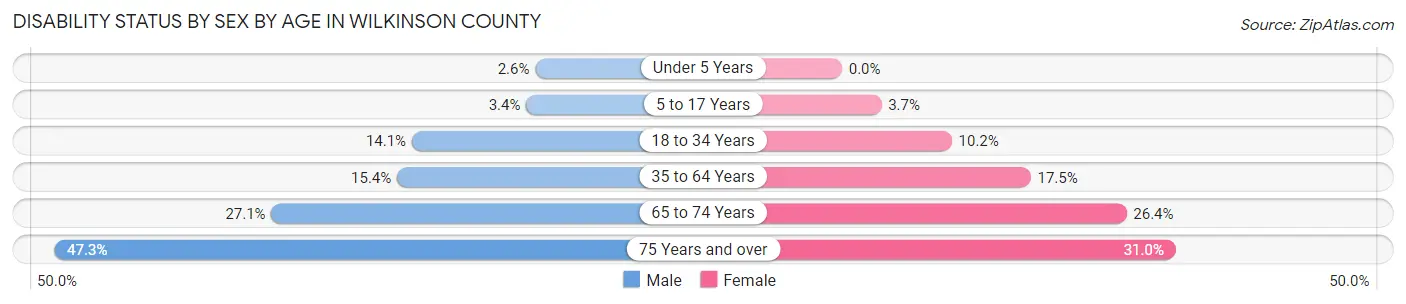
| Age Bracket | Male | Female |
| Under 5 Years | 6 (2.6%) | 0 (0.0%) |
| 5 to 17 Years | 26 (3.4%) | 27 (3.7%) |
| 18 to 34 Years | 109 (14.1%) | 91 (10.2%) |
| 35 to 64 Years | 261 (15.4%) | 298 (17.5%) |
| 65 to 74 Years | 123 (27.1%) | 145 (26.4%) |
| 75 Years and over | 138 (47.3%) | 128 (31.0%) |
Disability Class by Sex by Age in Wilkinson County
Disability Class: Hearing Difficulty
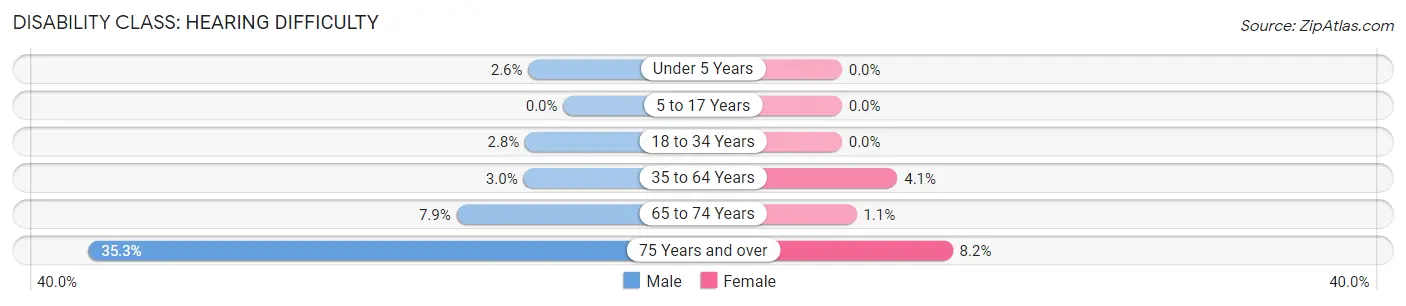
| Age Bracket | Male | Female |
| Under 5 Years | 6 (2.6%) | 0 (0.0%) |
| 5 to 17 Years | 0 (0.0%) | 0 (0.0%) |
| 18 to 34 Years | 22 (2.8%) | 0 (0.0%) |
| 35 to 64 Years | 50 (3.0%) | 70 (4.1%) |
| 65 to 74 Years | 36 (7.9%) | 6 (1.1%) |
| 75 Years and over | 103 (35.3%) | 34 (8.2%) |
Disability Class: Vision Difficulty
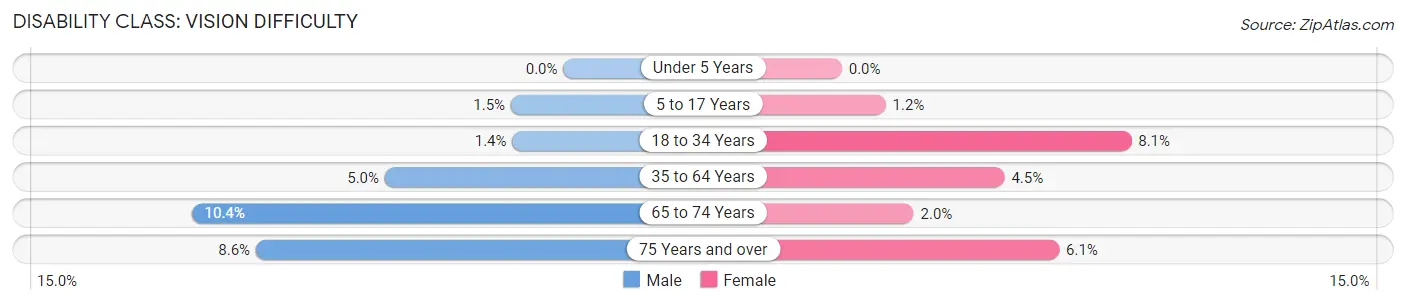
| Age Bracket | Male | Female |
| Under 5 Years | 0 (0.0%) | 0 (0.0%) |
| 5 to 17 Years | 11 (1.5%) | 9 (1.2%) |
| 18 to 34 Years | 11 (1.4%) | 72 (8.1%) |
| 35 to 64 Years | 84 (5.0%) | 77 (4.5%) |
| 65 to 74 Years | 47 (10.3%) | 11 (2.0%) |
| 75 Years and over | 25 (8.6%) | 25 (6.0%) |
Disability Class: Cognitive Difficulty
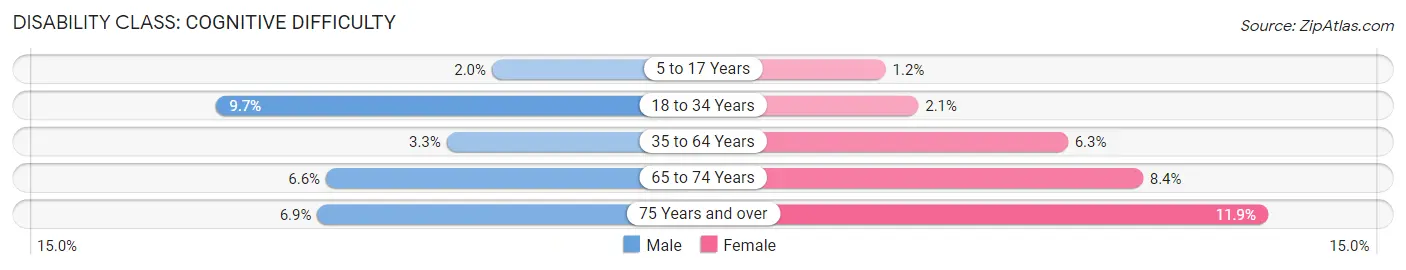
| Age Bracket | Male | Female |
| 5 to 17 Years | 15 (2.0%) | 9 (1.2%) |
| 18 to 34 Years | 75 (9.7%) | 19 (2.1%) |
| 35 to 64 Years | 55 (3.3%) | 107 (6.3%) |
| 65 to 74 Years | 30 (6.6%) | 46 (8.4%) |
| 75 Years and over | 20 (6.9%) | 49 (11.9%) |
Disability Class: Ambulatory Difficulty
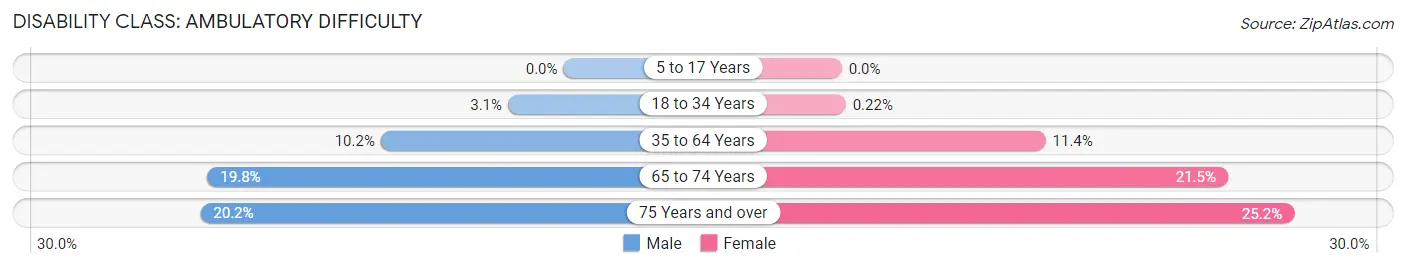
| Age Bracket | Male | Female |
| 5 to 17 Years | 0 (0.0%) | 0 (0.0%) |
| 18 to 34 Years | 24 (3.1%) | 2 (0.2%) |
| 35 to 64 Years | 172 (10.2%) | 193 (11.4%) |
| 65 to 74 Years | 90 (19.8%) | 118 (21.5%) |
| 75 Years and over | 59 (20.2%) | 104 (25.2%) |
Disability Class: Self-Care Difficulty
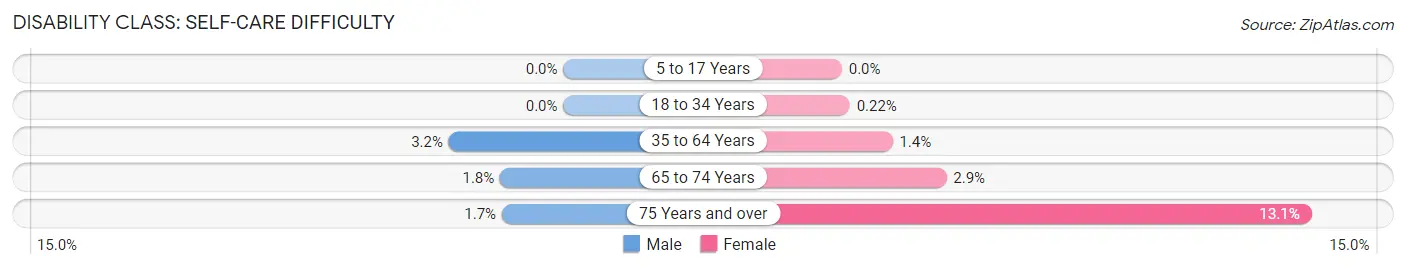
| Age Bracket | Male | Female |
| 5 to 17 Years | 0 (0.0%) | 0 (0.0%) |
| 18 to 34 Years | 0 (0.0%) | 2 (0.2%) |
| 35 to 64 Years | 54 (3.2%) | 24 (1.4%) |
| 65 to 74 Years | 8 (1.8%) | 16 (2.9%) |
| 75 Years and over | 5 (1.7%) | 54 (13.1%) |
Technology Access in Wilkinson County
Computing Device Access in Wilkinson County
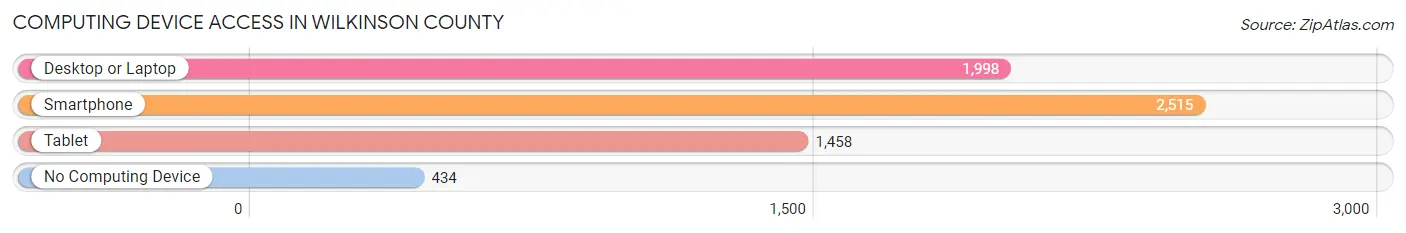
| Device Type | # Households | % Households |
| Desktop or Laptop | 1,998 | 60.3% |
| Smartphone | 2,515 | 75.9% |
| Tablet | 1,458 | 44.0% |
| No Computing Device | 434 | 13.1% |
| Total | 3,313 | 100.0% |
Internet Access in Wilkinson County
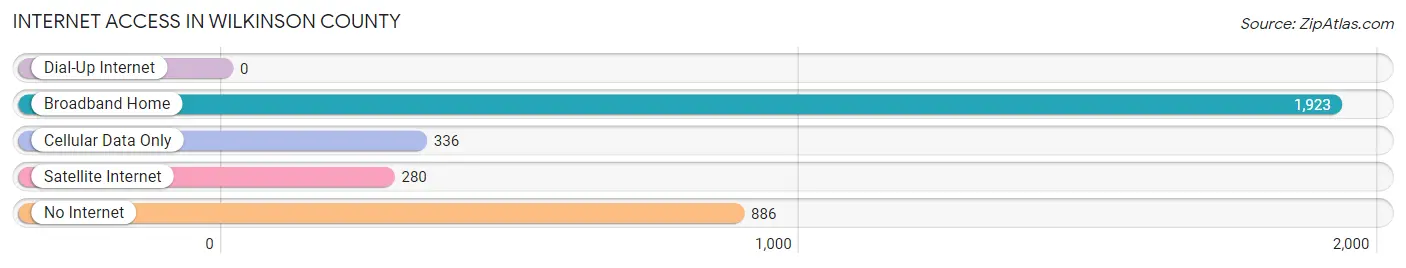
| Internet Type | # Households | % Households |
| Dial-Up Internet | 0 | 0.0% |
| Broadband Home | 1,923 | 58.0% |
| Cellular Data Only | 336 | 10.1% |
| Satellite Internet | 280 | 8.5% |
| No Internet | 886 | 26.7% |
| Total | 3,313 | 100.0% |
Wilkinson County Summary
Wilkinson County is located in the east-central part of the state of Georgia, in the United States. It is bordered by Twiggs County to the north, Laurens County to the east, Washington County to the south, and Baldwin County to the west. The county seat is Irwinton, and the county has a total area of 441 square miles.
History
Wilkinson County was created in 1803 from parts of Baldwin and Washington counties. It was named for General James Wilkinson, who was a Revolutionary War hero and the first Governor of the Louisiana Territory. The county was originally part of the Creek Nation, and the first settlers arrived in the early 1800s.
The county was home to several plantations, and the economy was largely based on cotton production. The county was also home to several Native American tribes, including the Creek, Choctaw, and Chickasaw.
During the Civil War, Wilkinson County was a major site of the Battle of Griswoldville, which was fought in November 1864. The battle was a Confederate victory, and it was the last major battle of the war in Georgia.
Geography
Wilkinson County is located in the east-central part of the state of Georgia. It is bordered by Twiggs County to the north, Laurens County to the east, Washington County to the south, and Baldwin County to the west. The county has a total area of 441 square miles, and it is mostly rural.
The terrain of the county is mostly flat, with some rolling hills in the northern part of the county. The county is drained by the Oconee River, which flows through the western part of the county. The county is also home to several small lakes, including Lake Sinclair and Lake Oconee.
Economy
The economy of Wilkinson County is largely based on agriculture. The county is home to several large farms, and the main crops grown in the county are cotton, corn, soybeans, and peanuts. The county is also home to several timber companies, and forestry is an important part of the local economy.
The county is also home to several manufacturing companies, including a paper mill and a furniture factory. The county is also home to several small businesses, including restaurants, retail stores, and service providers.
Demographics
As of the 2010 census, Wilkinson County had a population of 9,563. The racial makeup of the county was 68.3% White, 28.2% African American, 0.4% Native American, 0.3% Asian, 0.1% Pacific Islander, 0.7% from other races, and 1.9% from two or more races. Hispanic or Latino of any race were 2.2% of the population.
The median income for a household in the county was $31,945, and the median income for a family was $39,945. The per capita income for the county was $17,845. About 17.3% of the population was below the poverty line.
Common Questions
What is Per Capita Income in Wilkinson County?
Per Capita income in Wilkinson County is $24,070.
What is the Median Family Income in Wilkinson County?
Median Family Income in Wilkinson County is $56,607.
What is the Median Household income in Wilkinson County?
Median Household Income in Wilkinson County is $40,757.
What is Income or Wage Gap in Wilkinson County?
Income or Wage Gap in Wilkinson County is 19.6%.
Women in Wilkinson County earn 80.4 cents for every dollar earned by a man.
What is Family Income Deficit in Wilkinson County?
Family Income Deficit in Wilkinson County is $13,286.
Families that are below poverty line in Wilkinson County earn $13,286 less on average than the poverty threshold level.
What is Inequality or Gini Index in Wilkinson County?
Inequality or Gini Index in Wilkinson County is 0.49.
What is the Total Population of Wilkinson County?
Total Population of Wilkinson County is 8,852.
What is the Total Male Population of Wilkinson County?
Total Male Population of Wilkinson County is 4,233.
What is the Total Female Population of Wilkinson County?
Total Female Population of Wilkinson County is 4,619.
What is the Ratio of Males per 100 Females in Wilkinson County?
There are 91.64 Males per 100 Females in Wilkinson County.
What is the Ratio of Females per 100 Males in Wilkinson County?
There are 109.12 Females per 100 Males in Wilkinson County.
What is the Median Population Age in Wilkinson County?
Median Population Age in Wilkinson County is 42.2 Years.
What is the Average Family Size in Wilkinson County
Average Family Size in Wilkinson County is 3.5 People.
What is the Average Household Size in Wilkinson County
Average Household Size in Wilkinson County is 2.6 People.
How Large is the Labor Force in Wilkinson County?
There are 3,454 People in the Labor Forcein in Wilkinson County.
What is the Percentage of People in the Labor Force in Wilkinson County?
48.9% of People are in the Labor Force in Wilkinson County.
What is the Unemployment Rate in Wilkinson County?
Unemployment Rate in Wilkinson County is 5.8%.