Upson County, GA Map & Demographics
Upson County Map
Upson County Overview
$27,906
PER CAPITA INCOME
$61,466
AVG FAMILY INCOME
$48,740
AVG HOUSEHOLD INCOME
41.9%
WAGE / INCOME GAP [ % ]
58.1¢/ $1
WAGE / INCOME GAP [ $ ]
$10,618
FAMILY INCOME DEFICIT
0.49
INEQUALITY / GINI INDEX
27,638
TOTAL POPULATION
13,285
MALE POPULATION
14,353
FEMALE POPULATION
92.56
MALES / 100 FEMALES
108.04
FEMALES / 100 MALES
41.5
MEDIAN AGE
3.2
AVG FAMILY SIZE
2.6
AVG HOUSEHOLD SIZE
11,713
LABOR FORCE [ PEOPLE ]
52.9%
PERCENT IN LABOR FORCE
3.1%
UNEMPLOYMENT RATE
Income in Upson County
Income Overview in Upson County
Per Capita Income in Upson County is $27,906, while median incomes of families and households are $61,466 and $48,740 respectively.
| Characteristic | Number | Measure |
| Per Capita Income | 27,638 | $27,906 |
| Median Family Income | 6,725 | $61,466 |
| Mean Family Income | 6,725 | $83,793 |
| Median Household Income | 10,412 | $48,740 |
| Mean Household Income | 10,412 | $69,603 |
| Income Deficit | 6,725 | $10,618 |
| Wage / Income Gap (%) | 27,638 | 41.88% |
| Wage / Income Gap ($) | 27,638 | 58.12¢ per $1 |
| Gini / Inequality Index | 27,638 | 0.49 |
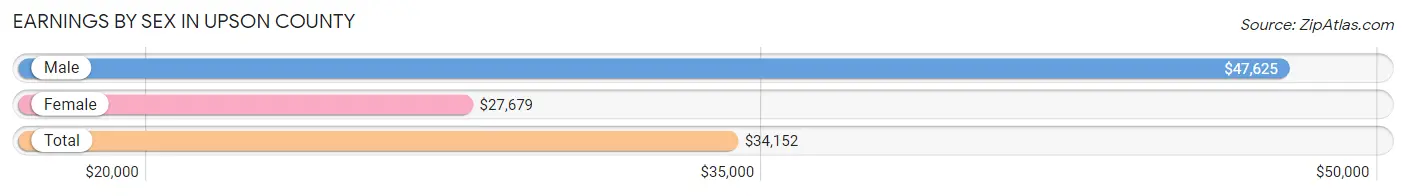
Earnings by Sex in Upson County
Average Earnings in Upson County are $34,152, $47,625 for men and $27,679 for women, a difference of 41.9%.
| Sex | Number | Average Earnings |
| Male | 6,204 (51.8%) | $47,625 |
| Female | 5,762 (48.1%) | $27,679 |
| Total | 11,966 (100.0%) | $34,152 |
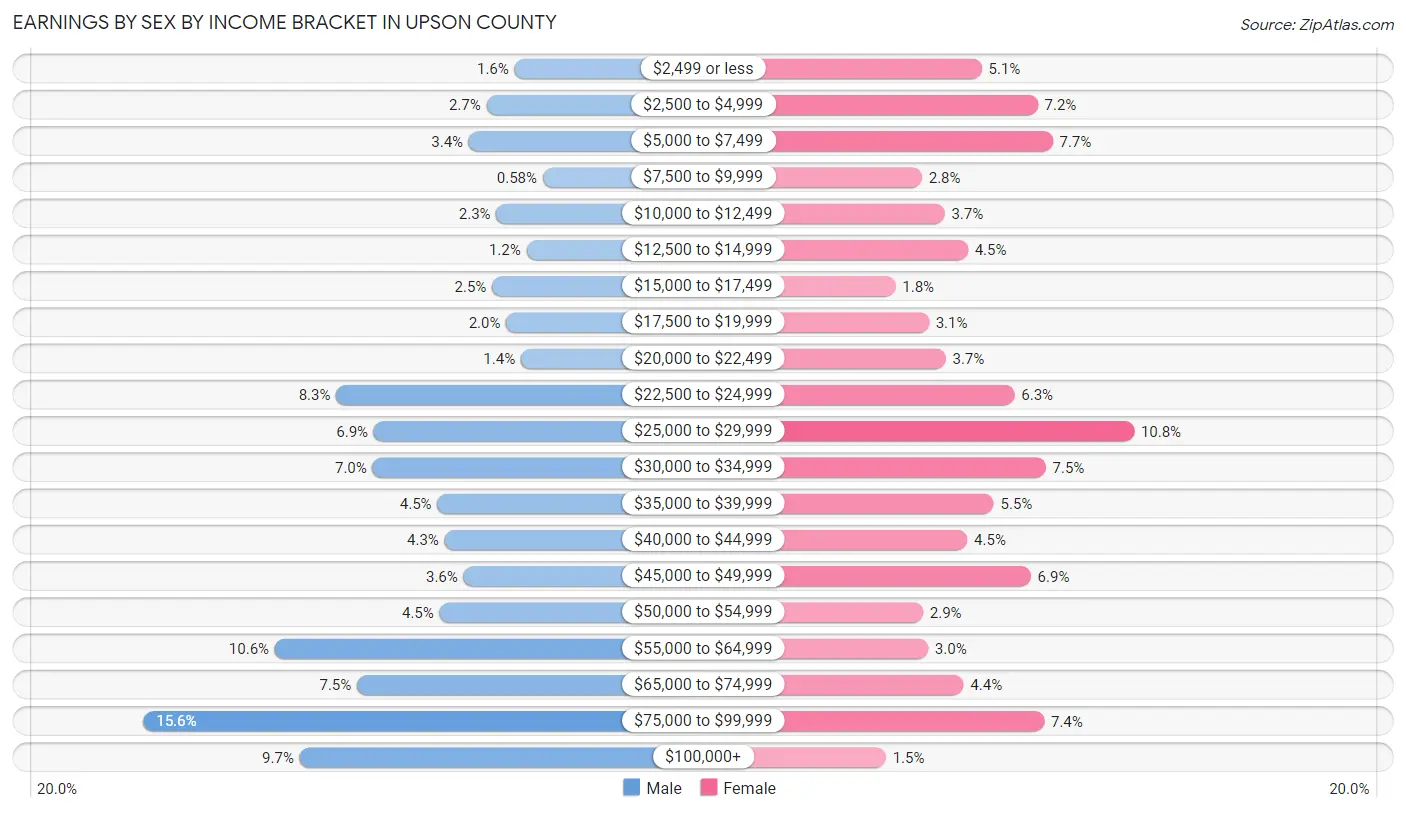
Earnings by Sex by Income Bracket in Upson County
The most common earnings brackets in Upson County are $75,000 to $99,999 for men (965 | 15.5%) and $25,000 to $29,999 for women (620 | 10.8%).
| Income | Male | Female |
| $2,499 or less | 102 (1.6%) | 291 (5.1%) |
| $2,500 to $4,999 | 167 (2.7%) | 412 (7.1%) |
| $5,000 to $7,499 | 208 (3.4%) | 444 (7.7%) |
| $7,500 to $9,999 | 36 (0.6%) | 162 (2.8%) |
| $10,000 to $12,499 | 144 (2.3%) | 211 (3.7%) |
| $12,500 to $14,999 | 74 (1.2%) | 261 (4.5%) |
| $15,000 to $17,499 | 154 (2.5%) | 105 (1.8%) |
| $17,500 to $19,999 | 121 (1.9%) | 177 (3.1%) |
| $20,000 to $22,499 | 87 (1.4%) | 213 (3.7%) |
| $22,500 to $24,999 | 516 (8.3%) | 362 (6.3%) |
| $25,000 to $29,999 | 429 (6.9%) | 620 (10.8%) |
| $30,000 to $34,999 | 432 (7.0%) | 429 (7.4%) |
| $35,000 to $39,999 | 281 (4.5%) | 317 (5.5%) |
| $40,000 to $44,999 | 264 (4.3%) | 260 (4.5%) |
| $45,000 to $49,999 | 220 (3.5%) | 397 (6.9%) |
| $50,000 to $54,999 | 276 (4.4%) | 164 (2.9%) |
| $55,000 to $64,999 | 659 (10.6%) | 175 (3.0%) |
| $65,000 to $74,999 | 468 (7.5%) | 252 (4.4%) |
| $75,000 to $99,999 | 965 (15.5%) | 426 (7.4%) |
| $100,000+ | 601 (9.7%) | 84 (1.5%) |
| Total | 6,204 (100.0%) | 5,762 (100.0%) |
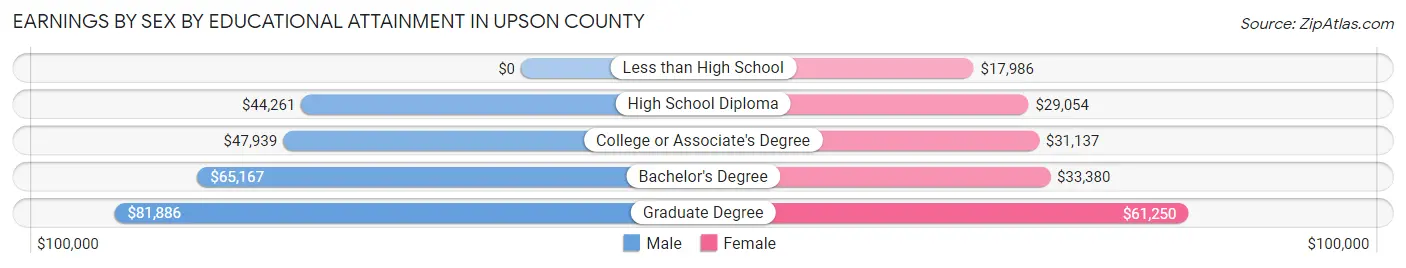
Earnings by Sex by Educational Attainment in Upson County
Average earnings in Upson County are $51,356 for men and $30,760 for women, a difference of 40.1%. Men with an educational attainment of graduate degree enjoy the highest average annual earnings of $81,886, while those with high school diploma education earn the least with $44,261. Women with an educational attainment of graduate degree earn the most with the average annual earnings of $61,250, while those with less than high school education have the smallest earnings of $17,986.
| Educational Attainment | Male Income | Female Income |
| Less than High School | - | - |
| High School Diploma | $44,261 | $29,054 |
| College or Associate's Degree | $47,939 | $31,137 |
| Bachelor's Degree | $65,167 | $33,380 |
| Graduate Degree | $81,886 | $61,250 |
| Total | $51,356 | $30,760 |
Family Income in Upson County
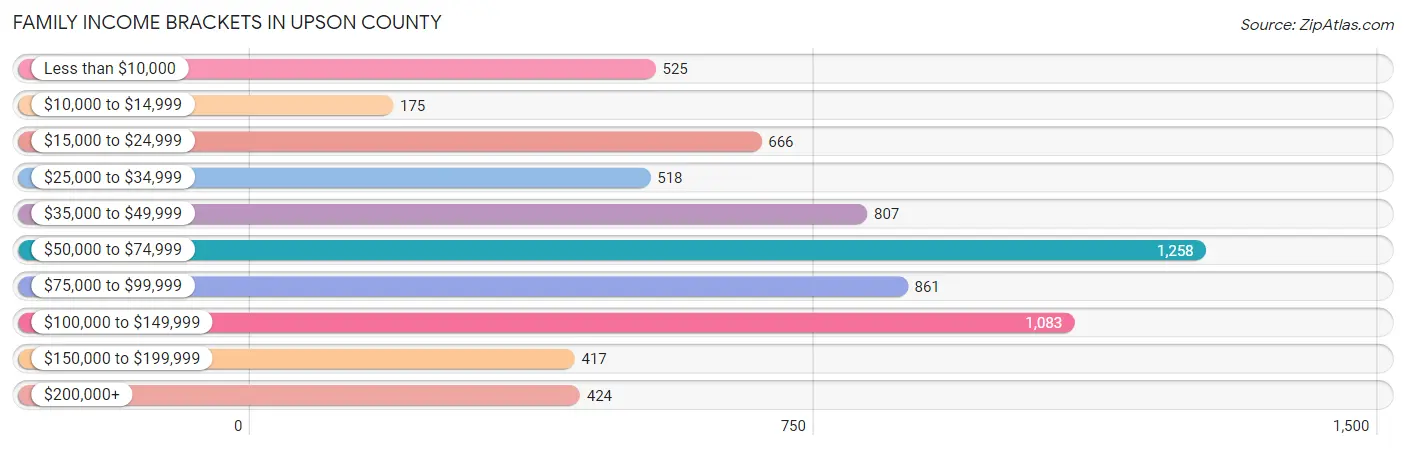
Family Income Brackets in Upson County
According to the Upson County family income data, there are 1,258 families falling into the $50,000 to $74,999 income range, which is the most common income bracket and makes up 18.7% of all families. Conversely, the $10,000 to $14,999 income bracket is the least frequent group with only 175 families (2.6%) belonging to this category.
| Income Bracket | # Families | % Families |
| Less than $10,000 | 525 | 7.8% |
| $10,000 to $14,999 | 175 | 2.6% |
| $15,000 to $24,999 | 666 | 9.9% |
| $25,000 to $34,999 | 518 | 7.7% |
| $35,000 to $49,999 | 807 | 12.0% |
| $50,000 to $74,999 | 1,258 | 18.7% |
| $75,000 to $99,999 | 861 | 12.8% |
| $100,000 to $149,999 | 1,083 | 16.1% |
| $150,000 to $199,999 | 417 | 6.2% |
| $200,000+ | 424 | 6.3% |
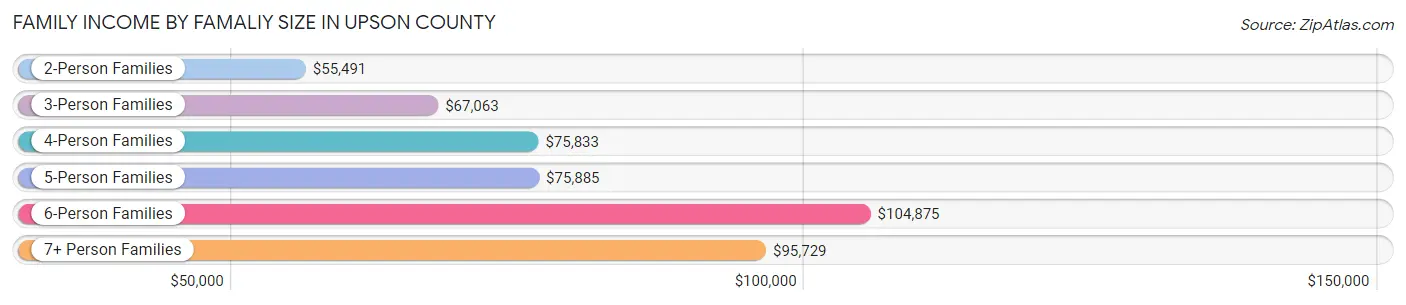
Family Income by Famaliy Size in Upson County
6-person families (39 | 0.6%) account for the highest median family income in Upson County with $104,875 per family, while 2-person families (3,390 | 50.4%) have the highest median income of $27,746 per family member.
| Income Bracket | # Families | Median Income |
| 2-Person Families | 3,390 (50.4%) | $55,491 |
| 3-Person Families | 1,807 (26.9%) | $67,063 |
| 4-Person Families | 1,058 (15.7%) | $75,833 |
| 5-Person Families | 402 (6.0%) | $75,885 |
| 6-Person Families | 39 (0.6%) | $104,875 |
| 7+ Person Families | 29 (0.4%) | $95,729 |
| Total | 6,725 (100.0%) | $61,466 |
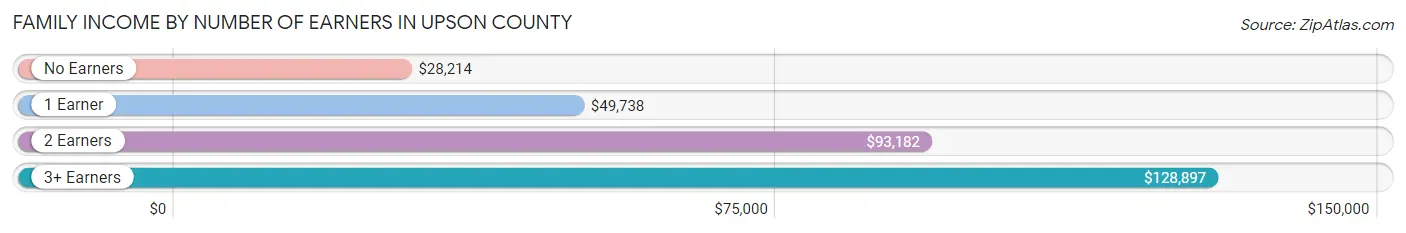
Family Income by Number of Earners in Upson County
The median family income in Upson County is $61,466, with families comprising 3+ earners (524) having the highest median family income of $128,897, while families with no earners (1,620) have the lowest median family income of $28,214, accounting for 7.8% and 24.1% of families, respectively.
| Number of Earners | # Families | Median Income |
| No Earners | 1,620 (24.1%) | $28,214 |
| 1 Earner | 2,527 (37.6%) | $49,738 |
| 2 Earners | 2,054 (30.5%) | $93,182 |
| 3+ Earners | 524 (7.8%) | $128,897 |
| Total | 6,725 (100.0%) | $61,466 |
Household Income in Upson County
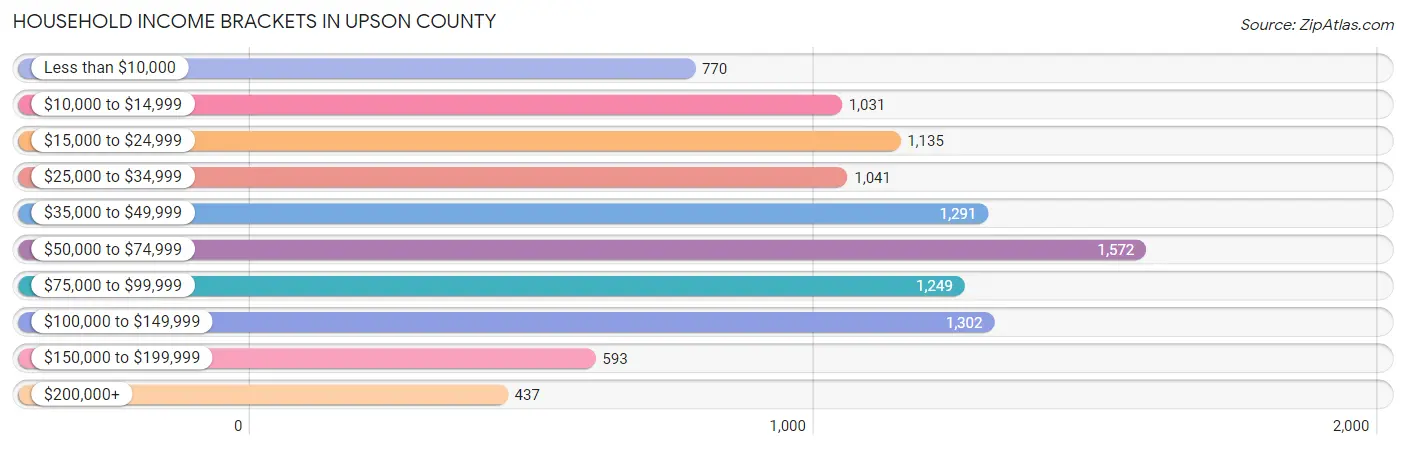
Household Income Brackets in Upson County
With 1,572 households falling in the category, the $50,000 to $74,999 income range is the most frequent in Upson County, accounting for 15.1% of all households. In contrast, only 437 households (4.2%) fall into the $200,000+ income bracket, making it the least populous group.
| Income Bracket | # Households | % Households |
| Less than $10,000 | 770 | 7.4% |
| $10,000 to $14,999 | 1,031 | 9.9% |
| $15,000 to $24,999 | 1,135 | 10.9% |
| $25,000 to $34,999 | 1,041 | 10.0% |
| $35,000 to $49,999 | 1,291 | 12.4% |
| $50,000 to $74,999 | 1,572 | 15.1% |
| $75,000 to $99,999 | 1,249 | 12.0% |
| $100,000 to $149,999 | 1,302 | 12.5% |
| $150,000 to $199,999 | 593 | 5.7% |
| $200,000+ | 437 | 4.2% |
Household Income by Householder Age in Upson County
The median household income in Upson County is $48,740, with the highest median household income of $60,030 found in the 25 to 44 years age bracket for the primary householder. A total of 3,030 households (29.1%) fall into this category. Meanwhile, the 65+ years age bracket for the primary householder has the lowest median household income of $37,835, with 3,035 households (29.1%) in this group.
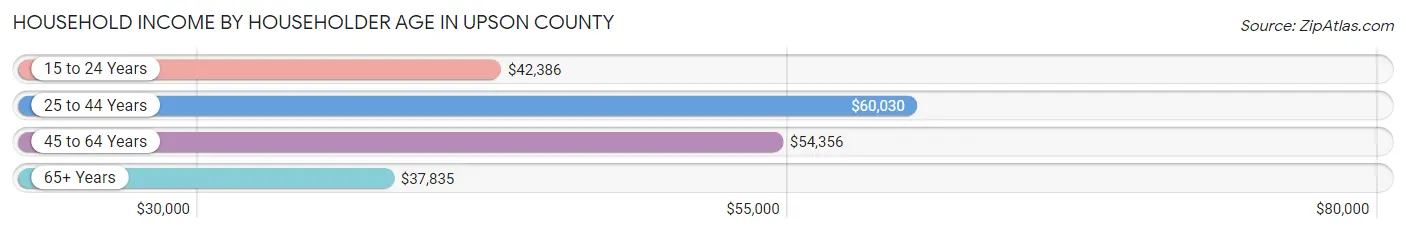
| Income Bracket | # Households | Median Income |
| 15 to 24 Years | 272 (2.6%) | $42,386 |
| 25 to 44 Years | 3,030 (29.1%) | $60,030 |
| 45 to 64 Years | 4,075 (39.1%) | $54,356 |
| 65+ Years | 3,035 (29.1%) | $37,835 |
| Total | 10,412 (100.0%) | $48,740 |
Poverty in Upson County
Income Below Poverty by Sex and Age in Upson County
With 17.6% poverty level for males and 26.9% for females among the residents of Upson County, 16 and 17 year old males and 15 year old females are the most vulnerable to poverty, with 196 males (44.3%) and 125 females (59.5%) in their respective age groups living below the poverty level.
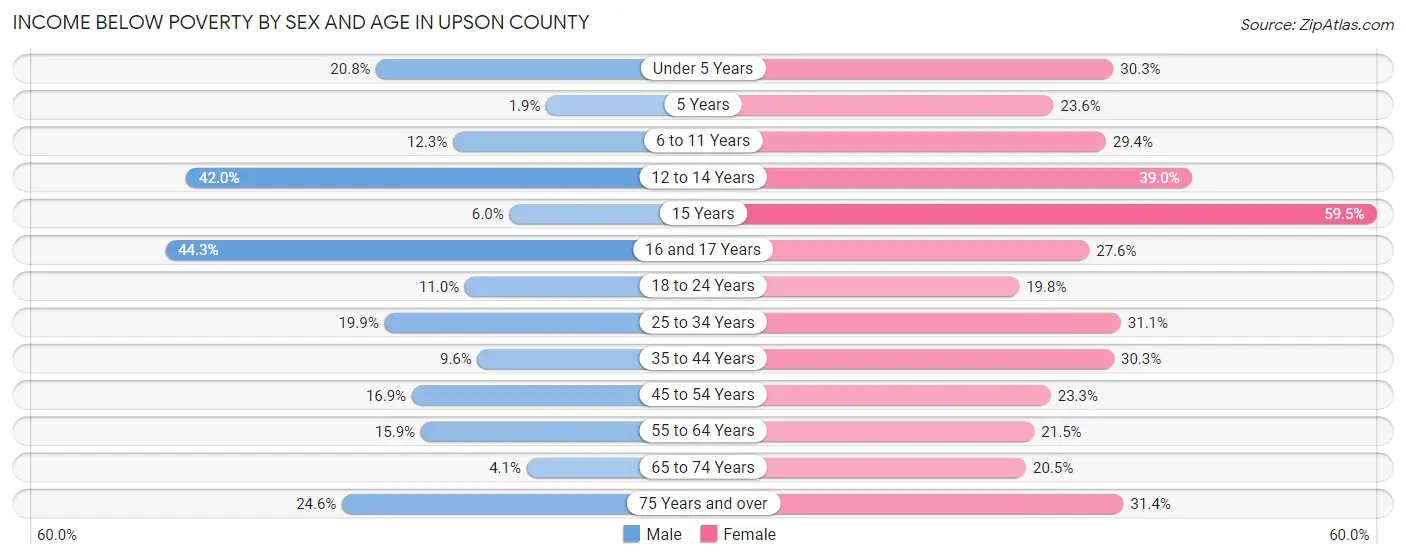
| Age Bracket | Male | Female |
| Under 5 Years | 152 (20.8%) | 196 (30.2%) |
| 5 Years | 2 (1.9%) | 29 (23.6%) |
| 6 to 11 Years | 102 (12.3%) | 222 (29.4%) |
| 12 to 14 Years | 426 (42.0%) | 245 (39.0%) |
| 15 Years | 3 (6.0%) | 125 (59.5%) |
| 16 and 17 Years | 196 (44.3%) | 94 (27.6%) |
| 18 to 24 Years | 110 (11.0%) | 247 (19.8%) |
| 25 to 34 Years | 331 (19.9%) | 551 (31.1%) |
| 35 to 44 Years | 139 (9.6%) | 525 (30.3%) |
| 45 to 54 Years | 280 (16.9%) | 369 (23.3%) |
| 55 to 64 Years | 290 (15.9%) | 460 (21.4%) |
| 65 to 74 Years | 55 (4.1%) | 323 (20.5%) |
| 75 Years and over | 185 (24.6%) | 350 (31.4%) |
| Total | 2,271 (17.6%) | 3,736 (26.9%) |
Income Above Poverty by Sex and Age in Upson County
According to the poverty statistics in Upson County, males aged 5 years and females aged 18 to 24 years are the age groups that are most secure financially, with 98.1% of males and 80.2% of females in these age groups living above the poverty line.
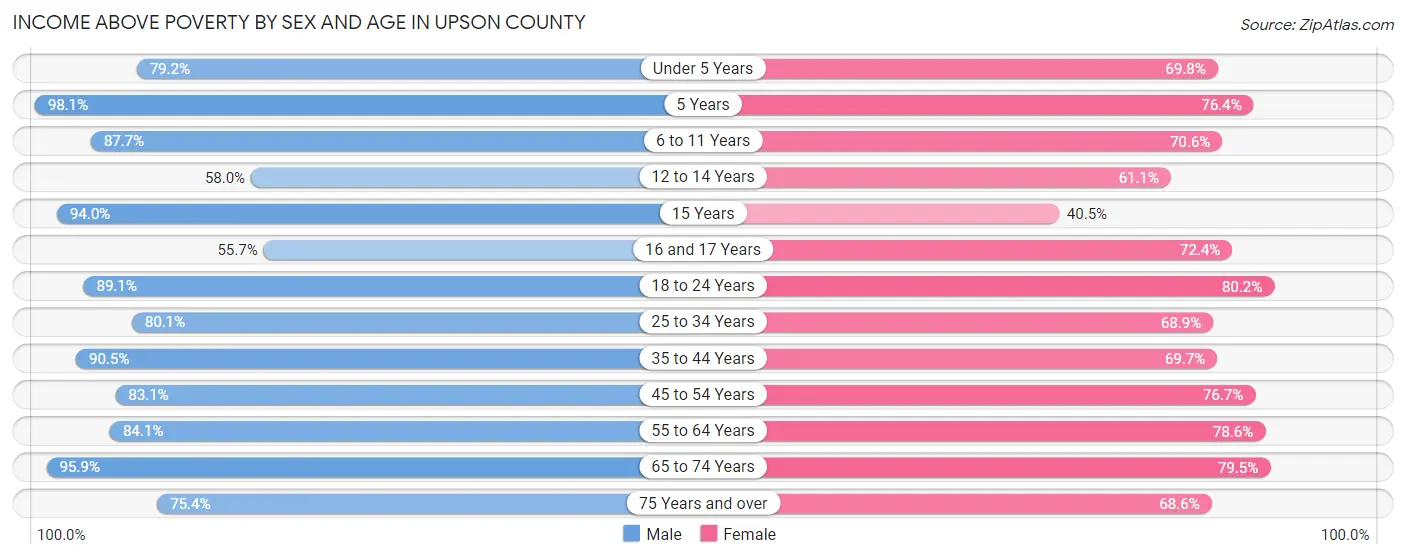
| Age Bracket | Male | Female |
| Under 5 Years | 578 (79.2%) | 452 (69.8%) |
| 5 Years | 103 (98.1%) | 94 (76.4%) |
| 6 to 11 Years | 728 (87.7%) | 533 (70.6%) |
| 12 to 14 Years | 588 (58.0%) | 384 (61.1%) |
| 15 Years | 47 (94.0%) | 85 (40.5%) |
| 16 and 17 Years | 246 (55.7%) | 247 (72.4%) |
| 18 to 24 Years | 895 (89.0%) | 1,003 (80.2%) |
| 25 to 34 Years | 1,331 (80.1%) | 1,222 (68.9%) |
| 35 to 44 Years | 1,317 (90.4%) | 1,206 (69.7%) |
| 45 to 54 Years | 1,381 (83.1%) | 1,216 (76.7%) |
| 55 to 64 Years | 1,538 (84.1%) | 1,685 (78.5%) |
| 65 to 74 Years | 1,297 (95.9%) | 1,251 (79.5%) |
| 75 Years and over | 566 (75.4%) | 765 (68.6%) |
| Total | 10,615 (82.4%) | 10,143 (73.1%) |
Income Below Poverty Among Married-Couple Families in Upson County
The poverty statistics for married-couple families in Upson County show that 8.9% or 406 of the total 4,581 families live below the poverty line. Families with 1 or 2 children have the highest poverty rate of 12.3%, comprising of 157 families. On the other hand, families with 5 or more children have the lowest poverty rate of 4.3%, which includes 1 families.
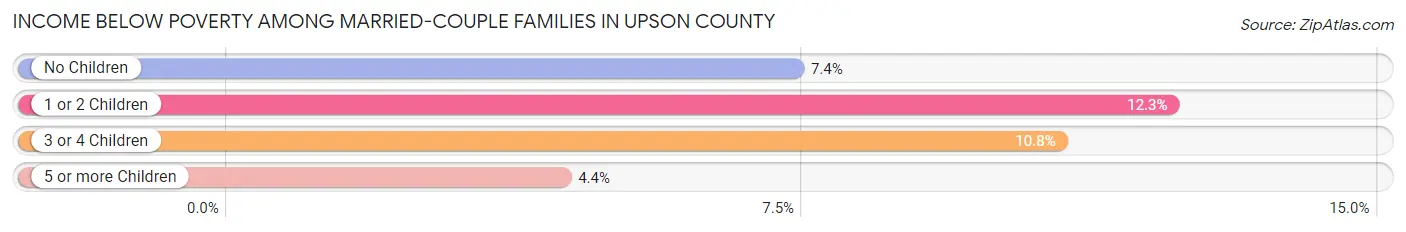
| Children | Above Poverty | Below Poverty |
| No Children | 2,893 (92.6%) | 231 (7.4%) |
| 1 or 2 Children | 1,120 (87.7%) | 157 (12.3%) |
| 3 or 4 Children | 140 (89.2%) | 17 (10.8%) |
| 5 or more Children | 22 (95.7%) | 1 (4.3%) |
| Total | 4,175 (91.1%) | 406 (8.9%) |
Income Below Poverty Among Single-Parent Households in Upson County
According to the poverty data in Upson County, 20.7% or 114 single-father households and 41.6% or 663 single-mother households are living below the poverty line. Among single-father households, those with 1 or 2 children have the highest poverty rate, with 96 households (30.1%) experiencing poverty. Likewise, among single-mother households, those with 3 or 4 children have the highest poverty rate, with 104 households (62.6%) falling below the poverty line.
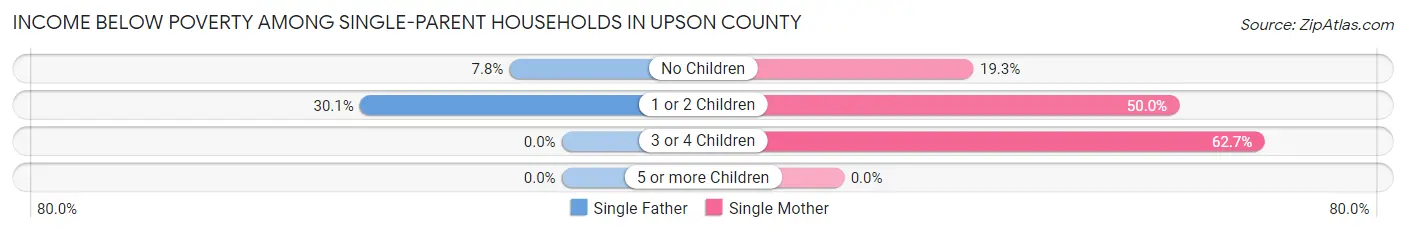
| Children | Single Father | Single Mother |
| No Children | 18 (7.8%) | 97 (19.3%) |
| 1 or 2 Children | 96 (30.1%) | 462 (49.9%) |
| 3 or 4 Children | 0 (0.0%) | 104 (62.6%) |
| 5 or more Children | 0 (0.0%) | 0 (0.0%) |
| Total | 114 (20.7%) | 663 (41.6%) |
Income Below Poverty Among Married-Couple vs Single-Parent Households in Upson County
The poverty data for Upson County shows that 406 of the married-couple family households (8.9%) and 777 of the single-parent households (36.2%) are living below the poverty level. Within the married-couple family households, those with 1 or 2 children have the highest poverty rate, with 157 households (12.3%) falling below the poverty line. Among the single-parent households, those with 3 or 4 children have the highest poverty rate, with 104 household (62.6%) living below poverty.
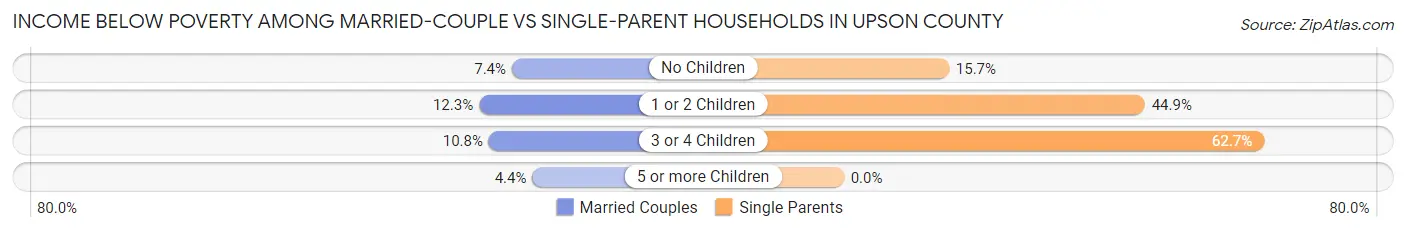
| Children | Married-Couple Families | Single-Parent Households |
| No Children | 231 (7.4%) | 115 (15.7%) |
| 1 or 2 Children | 157 (12.3%) | 558 (44.9%) |
| 3 or 4 Children | 17 (10.8%) | 104 (62.6%) |
| 5 or more Children | 1 (4.3%) | 0 (0.0%) |
| Total | 406 (8.9%) | 777 (36.2%) |
Race in Upson County
The most populous races in Upson County are White / Caucasian (18,652 | 67.5%), Black / African American (7,564 | 27.4%), and Two or more Races (774 | 2.8%).
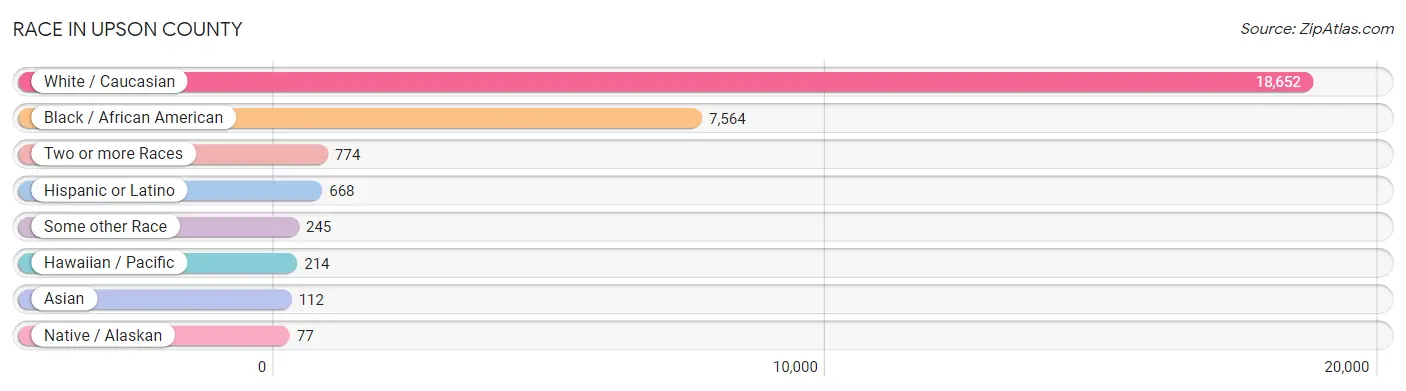
| Race | # Population | % Population |
| Asian | 112 | 0.4% |
| Black / African American | 7,564 | 27.4% |
| Hawaiian / Pacific | 214 | 0.8% |
| Hispanic or Latino | 668 | 2.4% |
| Native / Alaskan | 77 | 0.3% |
| White / Caucasian | 18,652 | 67.5% |
| Two or more Races | 774 | 2.8% |
| Some other Race | 245 | 0.9% |
| Total | 27,638 | 100.0% |
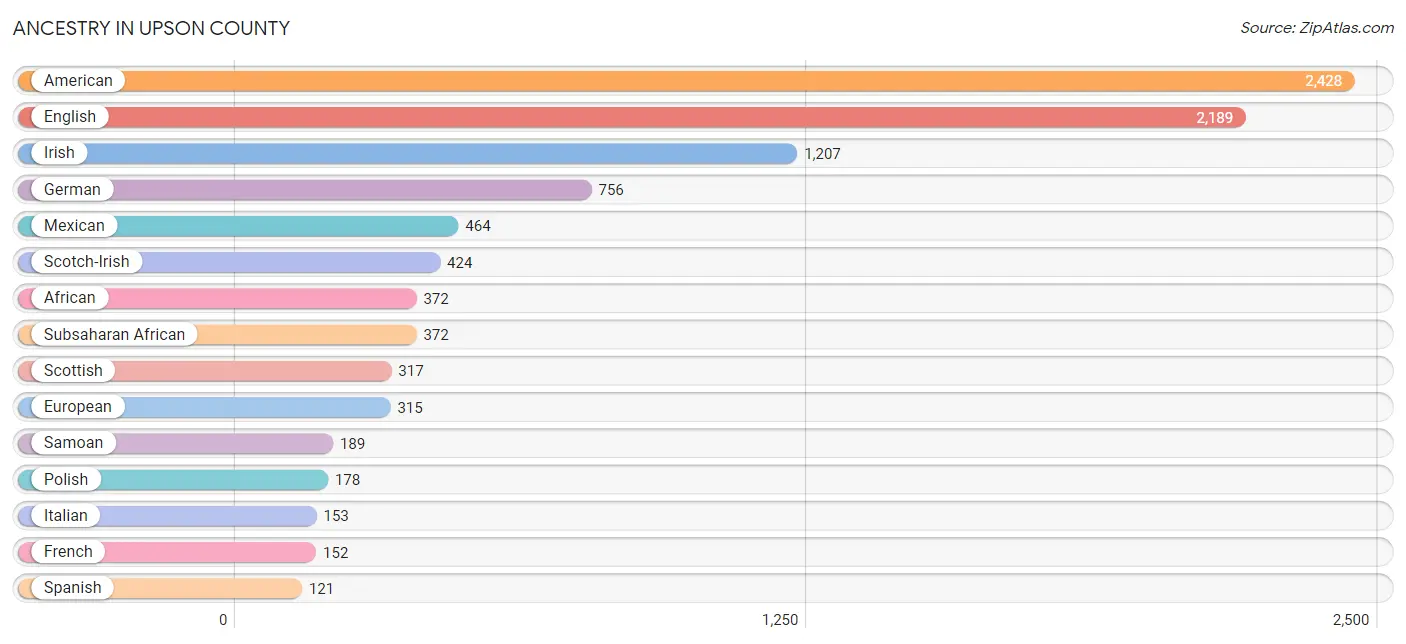
Ancestry in Upson County
The most populous ancestries reported in Upson County are American (2,428 | 8.8%), English (2,189 | 7.9%), Irish (1,207 | 4.4%), German (756 | 2.7%), and Mexican (464 | 1.7%), together accounting for 25.5% of all Upson County residents.
| Ancestry | # Population | % Population |
| African | 372 | 1.3% |
| Albanian | 11 | 0.0% |
| American | 2,428 | 8.8% |
| Arab | 12 | 0.0% |
| Austrian | 7 | 0.0% |
| Bhutanese | 73 | 0.3% |
| British | 24 | 0.1% |
| Burmese | 47 | 0.2% |
| Cherokee | 55 | 0.2% |
| Colombian | 15 | 0.1% |
| Creek | 12 | 0.0% |
| Cuban | 27 | 0.1% |
| Czech | 49 | 0.2% |
| Delaware | 65 | 0.2% |
| Dutch | 18 | 0.1% |
| Eastern European | 32 | 0.1% |
| English | 2,189 | 7.9% |
| European | 315 | 1.1% |
| French | 152 | 0.5% |
| French Canadian | 81 | 0.3% |
| German | 756 | 2.7% |
| Guamanian / Chamorro | 74 | 0.3% |
| Hungarian | 90 | 0.3% |
| Indian (Asian) | 5 | 0.0% |
| Irish | 1,207 | 4.4% |
| Italian | 153 | 0.5% |
| Korean | 32 | 0.1% |
| Mexican | 464 | 1.7% |
| Native Hawaiian | 19 | 0.1% |
| Northern European | 1 | 0.0% |
| Norwegian | 70 | 0.3% |
| Pakistani | 41 | 0.2% |
| Polish | 178 | 0.6% |
| Portuguese | 57 | 0.2% |
| Puerto Rican | 41 | 0.2% |
| Samoan | 189 | 0.7% |
| Scandinavian | 44 | 0.2% |
| Scotch-Irish | 424 | 1.5% |
| Scottish | 317 | 1.1% |
| Slovak | 6 | 0.0% |
| South American | 15 | 0.1% |
| Spanish | 121 | 0.4% |
| Subsaharan African | 372 | 1.3% |
| Swedish | 2 | 0.0% |
| Swiss | 4 | 0.0% |
| Thai | 9 | 0.0% |
| Welsh | 40 | 0.1% | View All 47 Rows |
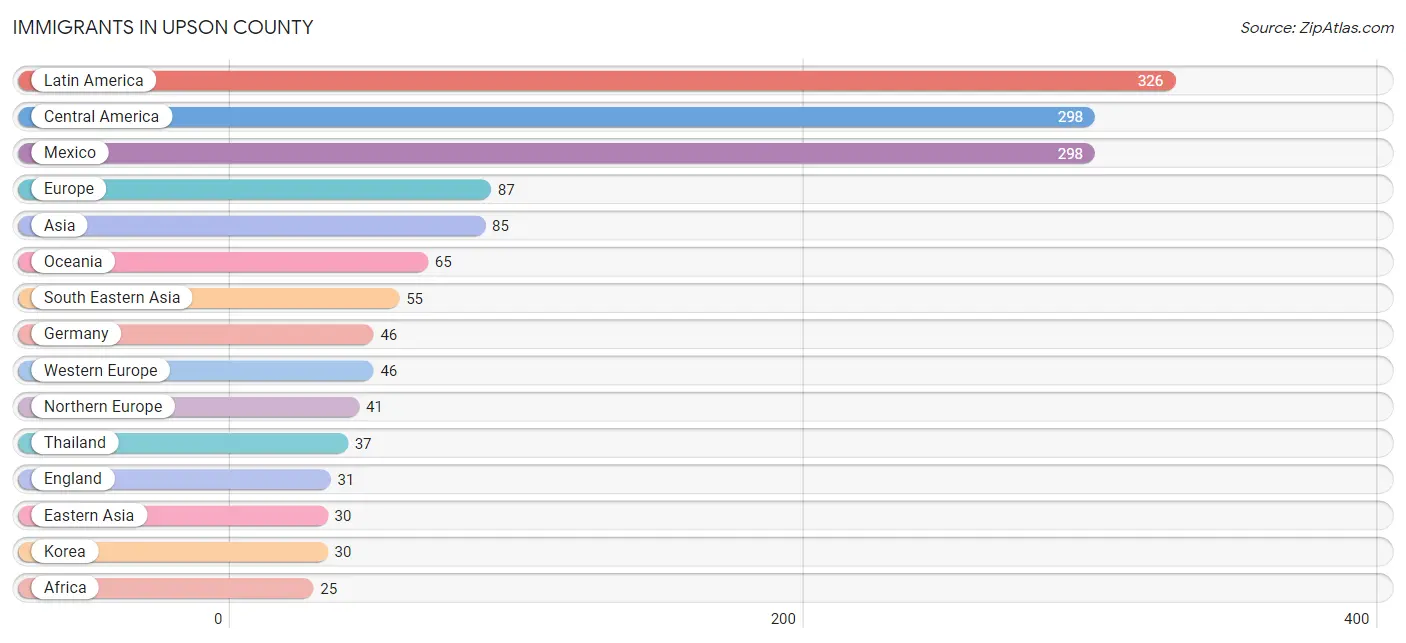
Immigrants in Upson County
The most numerous immigrant groups reported in Upson County came from Latin America (326 | 1.2%), Central America (298 | 1.1%), Mexico (298 | 1.1%), Europe (87 | 0.3%), and Asia (85 | 0.3%), together accounting for 4.0% of all Upson County residents.
| Immigration Origin | # Population | % Population |
| Africa | 25 | 0.1% |
| Asia | 85 | 0.3% |
| Caribbean | 13 | 0.1% |
| Central America | 298 | 1.1% |
| Colombia | 15 | 0.1% |
| Congo | 25 | 0.1% |
| Cuba | 13 | 0.1% |
| Eastern Asia | 30 | 0.1% |
| England | 31 | 0.1% |
| Europe | 87 | 0.3% |
| Germany | 46 | 0.2% |
| Korea | 30 | 0.1% |
| Latin America | 326 | 1.2% |
| Mexico | 298 | 1.1% |
| Middle Africa | 25 | 0.1% |
| Northern Europe | 41 | 0.2% |
| Oceania | 65 | 0.2% |
| Philippines | 18 | 0.1% |
| South America | 15 | 0.1% |
| South Eastern Asia | 55 | 0.2% |
| Thailand | 37 | 0.1% |
| Western Europe | 46 | 0.2% | View All 22 Rows |
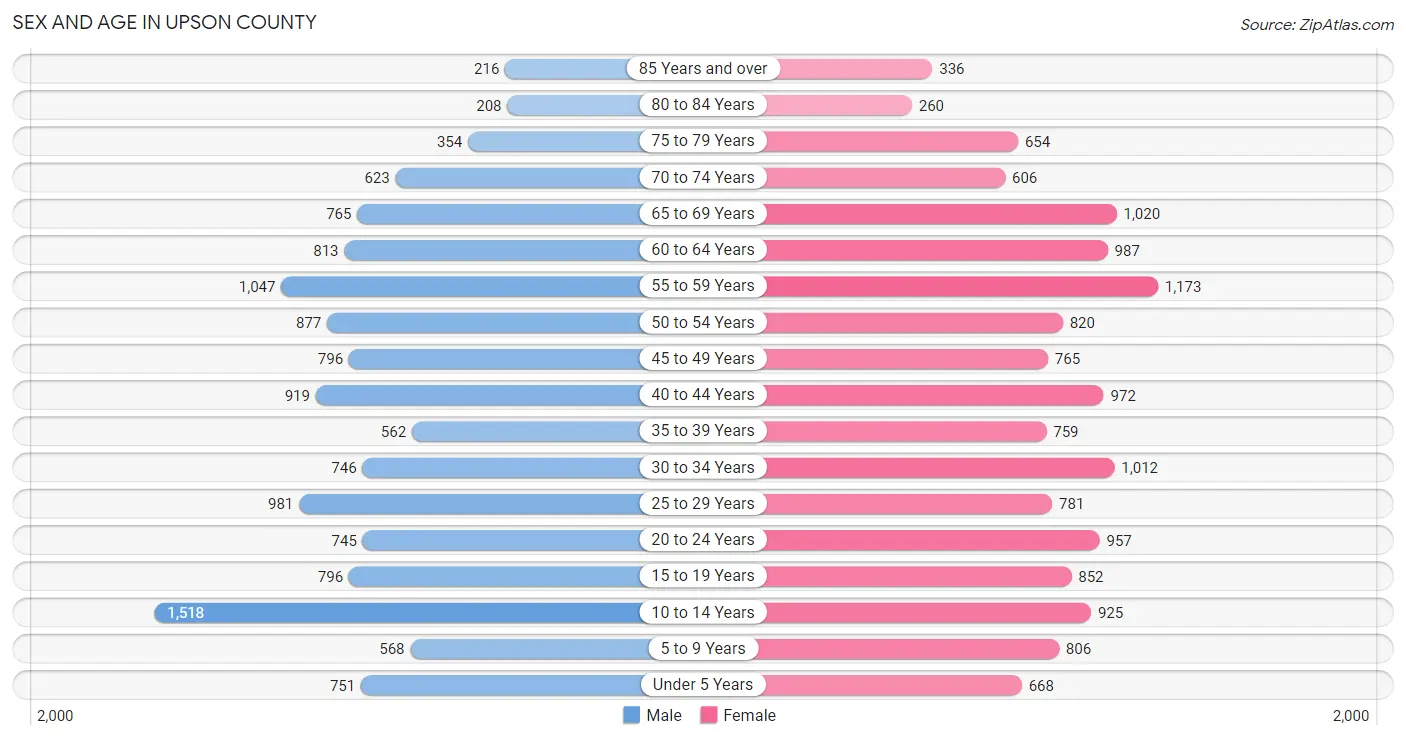
Sex and Age in Upson County
Sex and Age in Upson County
The most populous age groups in Upson County are 10 to 14 Years (1,518 | 11.4%) for men and 55 to 59 Years (1,173 | 8.2%) for women.
| Age Bracket | Male | Female |
| Under 5 Years | 751 (5.7%) | 668 (4.6%) |
| 5 to 9 Years | 568 (4.3%) | 806 (5.6%) |
| 10 to 14 Years | 1,518 (11.4%) | 925 (6.4%) |
| 15 to 19 Years | 796 (6.0%) | 852 (5.9%) |
| 20 to 24 Years | 745 (5.6%) | 957 (6.7%) |
| 25 to 29 Years | 981 (7.4%) | 781 (5.4%) |
| 30 to 34 Years | 746 (5.6%) | 1,012 (7.0%) |
| 35 to 39 Years | 562 (4.2%) | 759 (5.3%) |
| 40 to 44 Years | 919 (6.9%) | 972 (6.8%) |
| 45 to 49 Years | 796 (6.0%) | 765 (5.3%) |
| 50 to 54 Years | 877 (6.6%) | 820 (5.7%) |
| 55 to 59 Years | 1,047 (7.9%) | 1,173 (8.2%) |
| 60 to 64 Years | 813 (6.1%) | 987 (6.9%) |
| 65 to 69 Years | 765 (5.8%) | 1,020 (7.1%) |
| 70 to 74 Years | 623 (4.7%) | 606 (4.2%) |
| 75 to 79 Years | 354 (2.7%) | 654 (4.6%) |
| 80 to 84 Years | 208 (1.6%) | 260 (1.8%) |
| 85 Years and over | 216 (1.6%) | 336 (2.3%) |
| Total | 13,285 (100.0%) | 14,353 (100.0%) |
Families and Households in Upson County
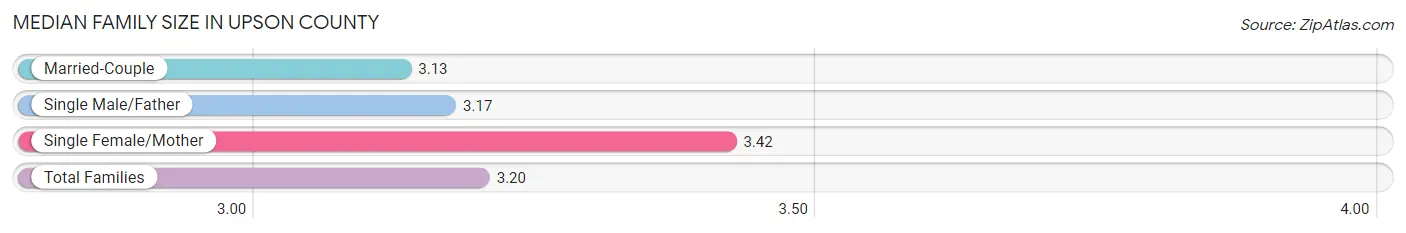
Median Family Size in Upson County
The median family size in Upson County is 3.20 persons per family, with single female/mother families (1,594 | 23.7%) accounting for the largest median family size of 3.42 persons per family. On the other hand, married-couple families (4,581 | 68.1%) represent the smallest median family size with 3.13 persons per family.
| Family Type | # Families | Family Size |
| Married-Couple | 4,581 (68.1%) | 3.13 |
| Single Male/Father | 550 (8.2%) | 3.17 |
| Single Female/Mother | 1,594 (23.7%) | 3.42 |
| Total Families | 6,725 (100.0%) | 3.20 |
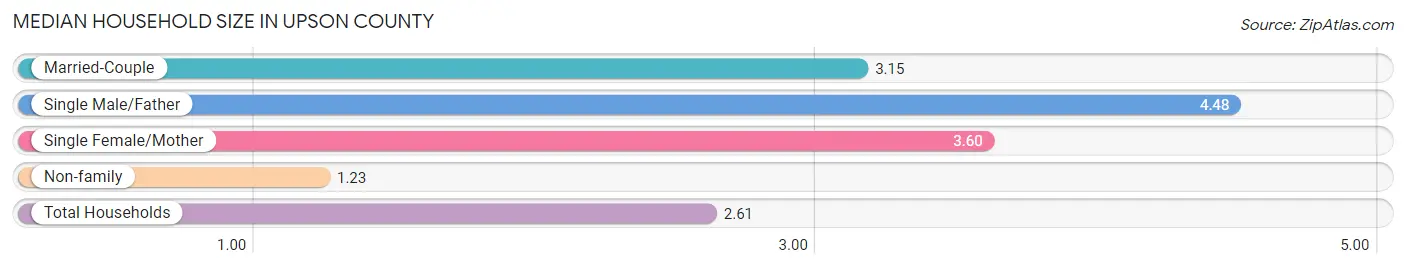
Median Household Size in Upson County
The median household size in Upson County is 2.61 persons per household, with single male/father households (550 | 5.3%) accounting for the largest median household size of 4.48 persons per household. non-family households (3,687 | 35.4%) represent the smallest median household size with 1.23 persons per household.
| Household Type | # Households | Household Size |
| Married-Couple | 4,581 (44.0%) | 3.15 |
| Single Male/Father | 550 (5.3%) | 4.48 |
| Single Female/Mother | 1,594 (15.3%) | 3.60 |
| Non-family | 3,687 (35.4%) | 1.23 |
| Total Households | 10,412 (100.0%) | 2.61 |
Household Size by Marriage Status in Upson County
Out of a total of 10,412 households in Upson County, 6,725 (64.6%) are family households, while 3,687 (35.4%) are nonfamily households. The most numerous type of family households are 2-person households, comprising 3,008, and the most common type of nonfamily households are 1-person households, comprising 3,131.
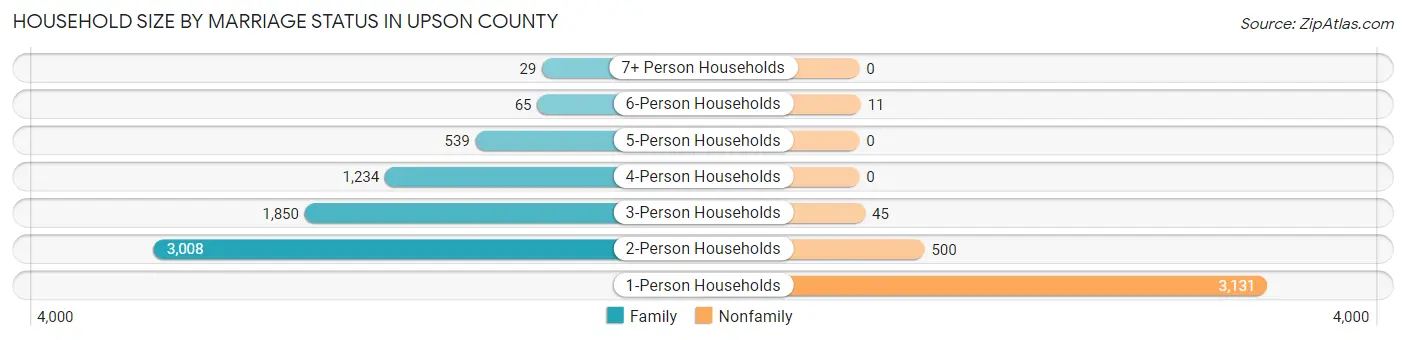
| Household Size | Family Households | Nonfamily Households |
| 1-Person Households | - | 3,131 (30.1%) |
| 2-Person Households | 3,008 (28.9%) | 500 (4.8%) |
| 3-Person Households | 1,850 (17.8%) | 45 (0.4%) |
| 4-Person Households | 1,234 (11.8%) | 0 (0.0%) |
| 5-Person Households | 539 (5.2%) | 0 (0.0%) |
| 6-Person Households | 65 (0.6%) | 11 (0.1%) |
| 7+ Person Households | 29 (0.3%) | 0 (0.0%) |
| Total | 6,725 (64.6%) | 3,687 (35.4%) |
Female Fertility in Upson County
Fertility by Age in Upson County
Average fertility rate in Upson County is 30.0 births per 1,000 women. Women in the age bracket of 20 to 34 years have the highest fertility rate with 46.0 births per 1,000 women. Women in the age bracket of 20 to 34 years acount for 68.1% of all women with births.
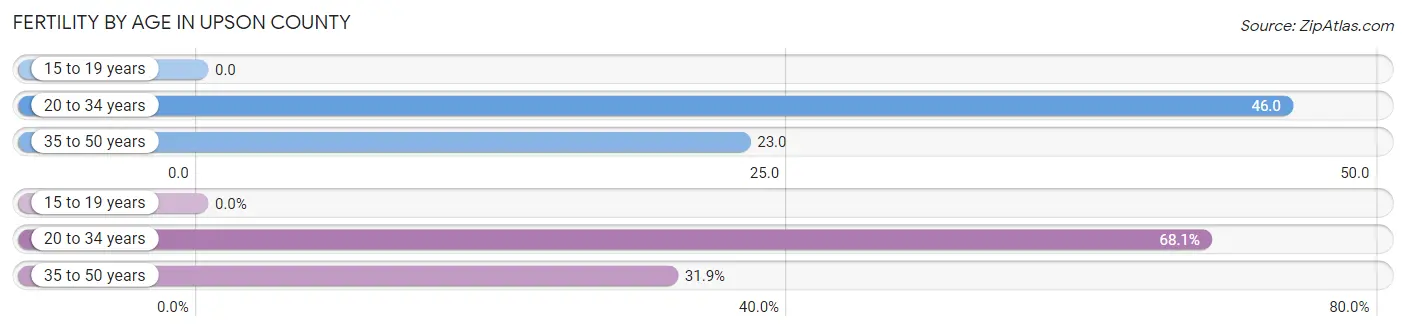
| Age Bracket | Women with Births | Births / 1,000 Women |
| 15 to 19 years | 0 (0.0%) | 0.0 |
| 20 to 34 years | 126 (68.1%) | 46.0 |
| 35 to 50 years | 59 (31.9%) | 23.0 |
| Total | 185 (100.0%) | 30.0 |
Fertility by Age by Marriage Status in Upson County
34.6% of women with births (185) in Upson County are married. The highest percentage of unmarried women with births falls into 35 to 50 years age bracket with 84.8% of them unmarried at the time of birth, while the lowest percentage of unmarried women with births belong to 20 to 34 years age bracket with 56.4% of them unmarried.
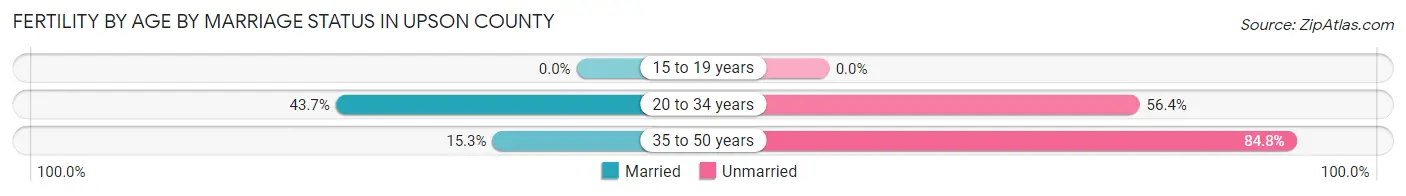
| Age Bracket | Married | Unmarried |
| 15 to 19 years | 0 (0.0%) | 0 (0.0%) |
| 20 to 34 years | 55 (43.6%) | 71 (56.4%) |
| 35 to 50 years | 9 (15.2%) | 50 (84.8%) |
| Total | 64 (34.6%) | 121 (65.4%) |
Fertility by Education in Upson County
Average fertility rate in Upson County is 30.0 births per 1,000 women. Women with the education attainment of less than high school have the highest fertility rate of 69.0 births per 1,000 women, while women with the education attainment of bachelor's degree have the lowest fertility at 17.0 births per 1,000 women. Women with the education attainment of college or associate's degree represent 35.1% of all women with births.
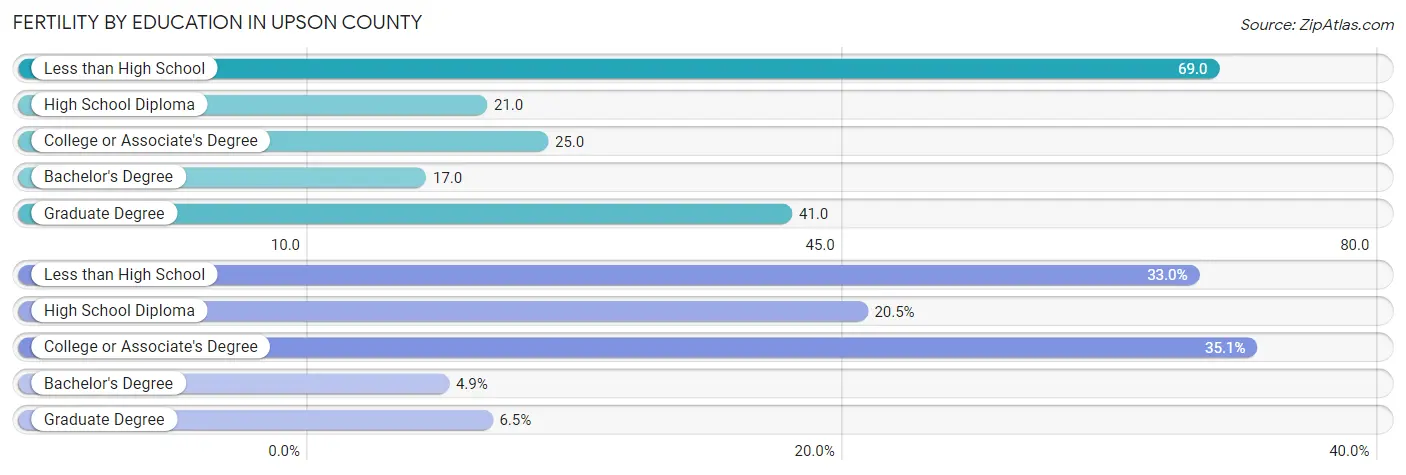
| Educational Attainment | Women with Births | Births / 1,000 Women |
| Less than High School | 61 (33.0%) | 69.0 |
| High School Diploma | 38 (20.5%) | 21.0 |
| College or Associate's Degree | 65 (35.1%) | 25.0 |
| Bachelor's Degree | 9 (4.9%) | 17.0 |
| Graduate Degree | 12 (6.5%) | 41.0 |
| Total | 185 (100.0%) | 30.0 |
Fertility by Education by Marriage Status in Upson County
65.4% of women with births in Upson County are unmarried. Women with the educational attainment of bachelor's degree are most likely to be married with 100.0% of them married at childbirth, while women with the educational attainment of less than high school are least likely to be married with 100.0% of them unmarried at childbirth.
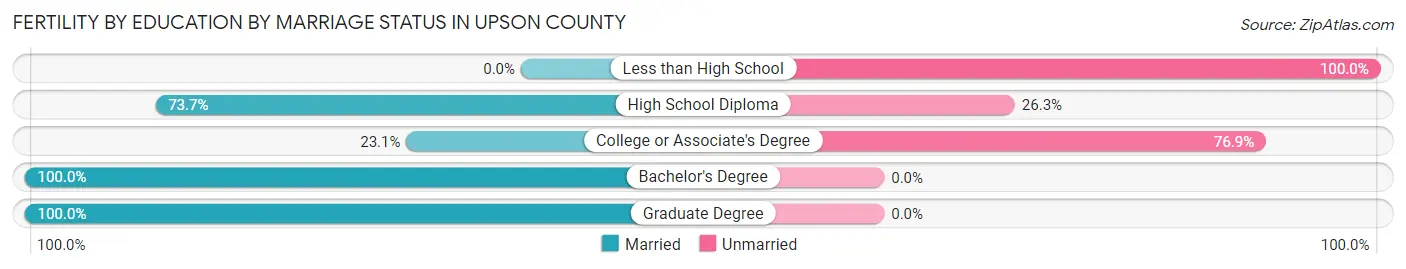
| Educational Attainment | Married | Unmarried |
| Less than High School | 0 (0.0%) | 61 (100.0%) |
| High School Diploma | 28 (73.7%) | 10 (26.3%) |
| College or Associate's Degree | 15 (23.1%) | 50 (76.9%) |
| Bachelor's Degree | 9 (100.0%) | 0 (0.0%) |
| Graduate Degree | 12 (100.0%) | 0 (0.0%) |
| Total | 64 (34.6%) | 121 (65.4%) |
Employment Characteristics in Upson County
Employment by Class of Employer in Upson County
Among the 11,247 employed individuals in Upson County, private company employees (7,948 | 70.7%), local government employees (1,051 | 9.3%), and state government employees (689 | 6.1%) make up the most common classes of employment.
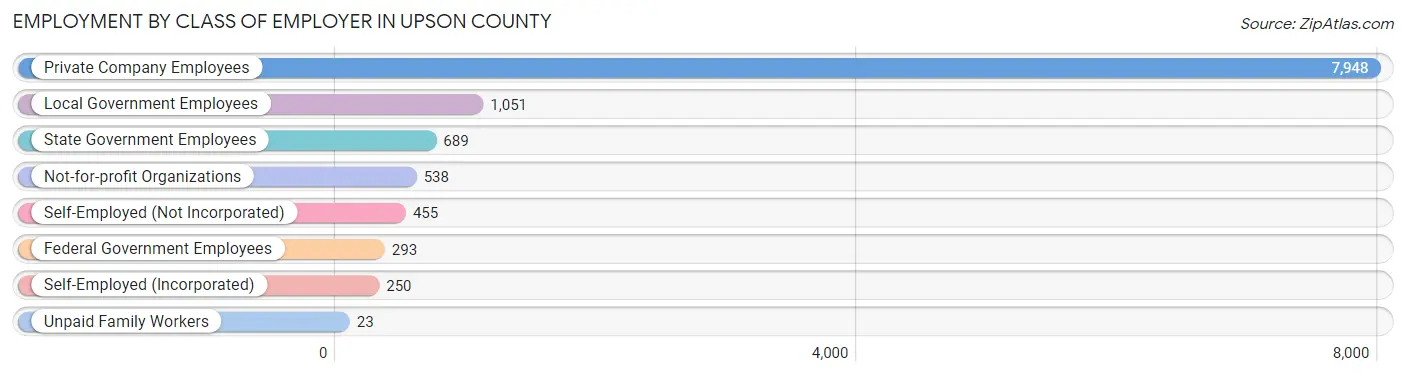
| Employer Class | # Employees | % Employees |
| Private Company Employees | 7,948 | 70.7% |
| Self-Employed (Incorporated) | 250 | 2.2% |
| Self-Employed (Not Incorporated) | 455 | 4.1% |
| Not-for-profit Organizations | 538 | 4.8% |
| Local Government Employees | 1,051 | 9.3% |
| State Government Employees | 689 | 6.1% |
| Federal Government Employees | 293 | 2.6% |
| Unpaid Family Workers | 23 | 0.2% |
| Total | 11,247 | 100.0% |
Employment Status by Age in Upson County
According to the labor force statistics for Upson County, out of the total population over 16 years of age (22,142), 52.9% or 11,713 individuals are in the labor force, with 3.1% or 363 of them unemployed. The age group with the highest labor force participation rate is 25 to 29 years, with 77.1% or 1,359 individuals in the labor force. Within the labor force, the 35 to 44 years age range has the highest percentage of unemployed individuals, with 9.3% or 215 of them being unemployed.
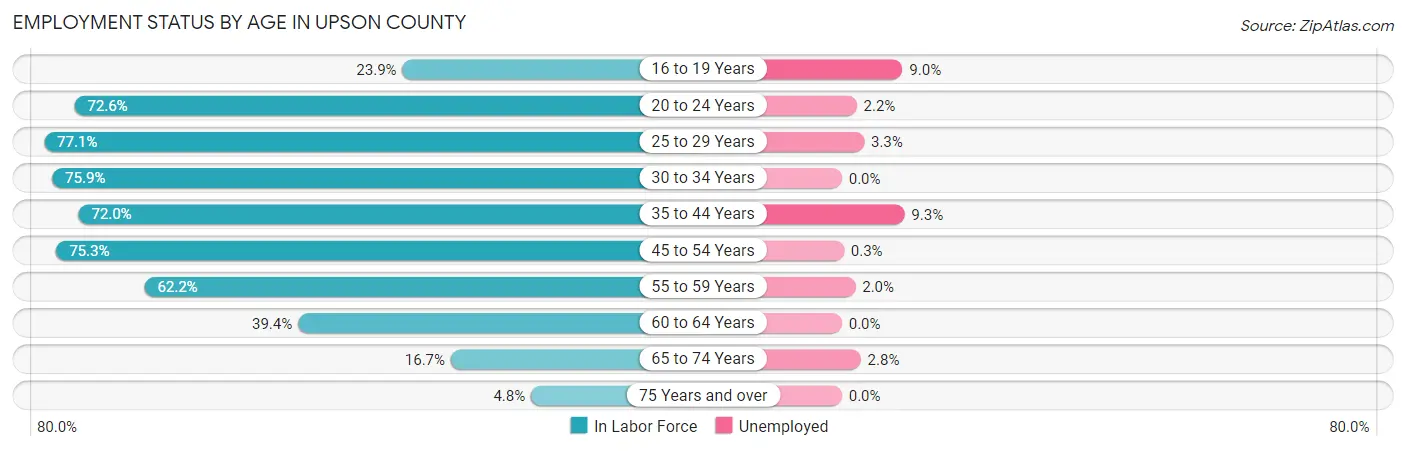
| Age Bracket | In Labor Force | Unemployed |
| 16 to 19 Years | 332 (23.9%) | 30 (9.0%) |
| 20 to 24 Years | 1,236 (72.6%) | 27 (2.2%) |
| 25 to 29 Years | 1,359 (77.1%) | 45 (3.3%) |
| 30 to 34 Years | 1,334 (75.9%) | 0 (0.0%) |
| 35 to 44 Years | 2,313 (72.0%) | 215 (9.3%) |
| 45 to 54 Years | 2,453 (75.3%) | 7 (0.3%) |
| 55 to 59 Years | 1,381 (62.2%) | 28 (2.0%) |
| 60 to 64 Years | 709 (39.4%) | 0 (0.0%) |
| 65 to 74 Years | 503 (16.7%) | 14 (2.8%) |
| 75 Years and over | 97 (4.8%) | 0 (0.0%) |
| Total | 11,713 (52.9%) | 363 (3.1%) |
Employment Status by Educational Attainment in Upson County
According to labor force statistics for Upson County, 68.1% of individuals (9,541) out of the total population between 25 and 64 years of age (14,010) are in the labor force, with 3.1% or 296 of them being unemployed. The group with the highest labor force participation rate are those with the educational attainment of bachelor's degree or higher, with 83.8% or 1,710 individuals in the labor force. Within the labor force, individuals with high school diploma education have the highest percentage of unemployment, with 5.4% or 204 of them being unemployed.
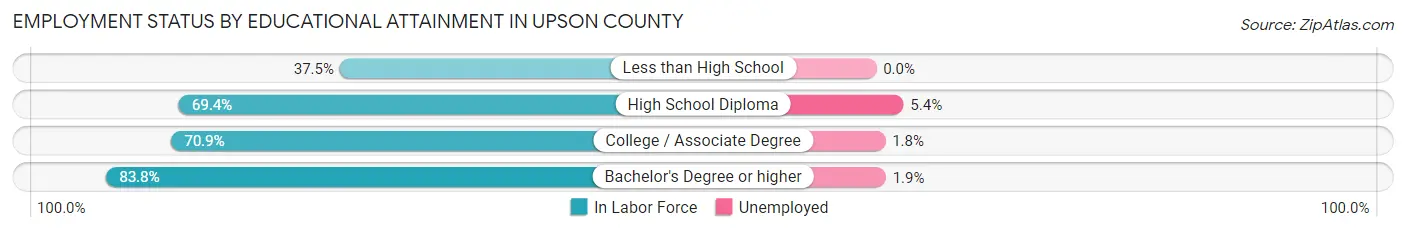
| Educational Attainment | In Labor Force | Unemployed |
| Less than High School | 642 (37.5%) | 0 (0.0%) |
| High School Diploma | 3,773 (69.4%) | 294 (5.4%) |
| College / Associate Degree | 3,418 (70.9%) | 87 (1.8%) |
| Bachelor's Degree or higher | 1,710 (83.8%) | 39 (1.9%) |
| Total | 9,541 (68.1%) | 434 (3.1%) |
Employment Occupations by Sex in Upson County
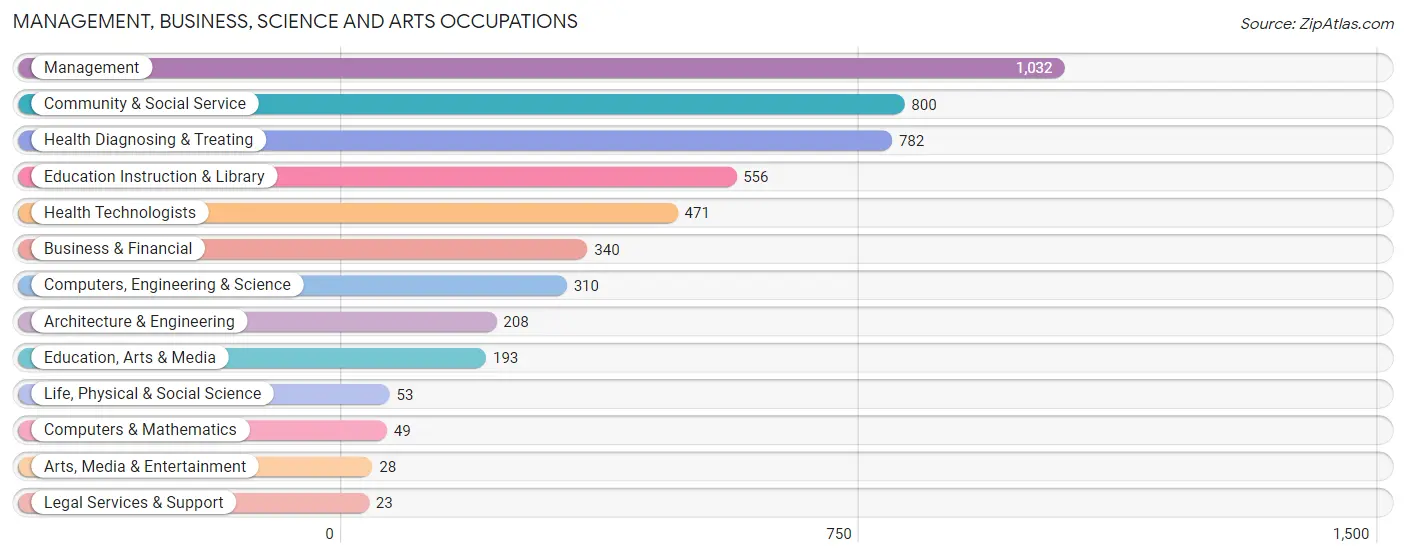
Management, Business, Science and Arts Occupations
The most common Management, Business, Science and Arts occupations in Upson County are Management (1,032 | 9.1%), Community & Social Service (800 | 7.0%), Health Diagnosing & Treating (782 | 6.9%), Education Instruction & Library (556 | 4.9%), and Health Technologists (471 | 4.2%).
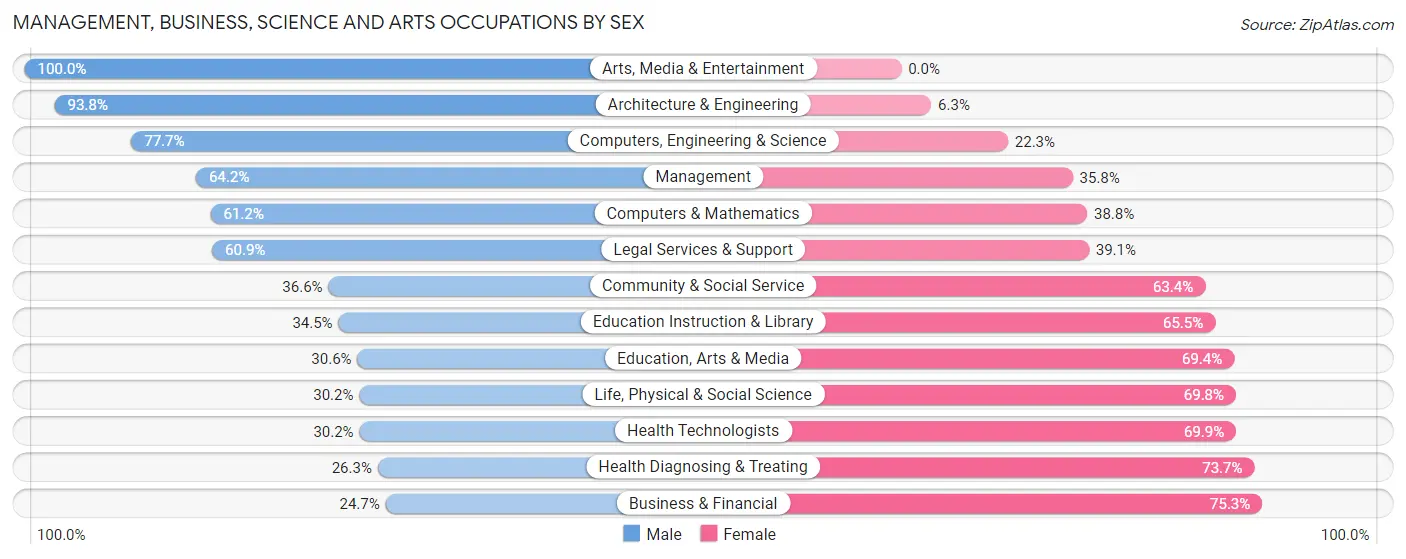
Management, Business, Science and Arts Occupations by Sex
Within the Management, Business, Science and Arts occupations in Upson County, the most male-oriented occupations are Arts, Media & Entertainment (100.0%), Architecture & Engineering (93.8%), and Computers, Engineering & Science (77.7%), while the most female-oriented occupations are Business & Financial (75.3%), Health Diagnosing & Treating (73.7%), and Health Technologists (69.9%).
| Occupation | Male | Female |
| Management | 663 (64.2%) | 369 (35.8%) |
| Business & Financial | 84 (24.7%) | 256 (75.3%) |
| Computers, Engineering & Science | 241 (77.7%) | 69 (22.3%) |
| Computers & Mathematics | 30 (61.2%) | 19 (38.8%) |
| Architecture & Engineering | 195 (93.8%) | 13 (6.2%) |
| Life, Physical & Social Science | 16 (30.2%) | 37 (69.8%) |
| Community & Social Service | 293 (36.6%) | 507 (63.4%) |
| Education, Arts & Media | 59 (30.6%) | 134 (69.4%) |
| Legal Services & Support | 14 (60.9%) | 9 (39.1%) |
| Education Instruction & Library | 192 (34.5%) | 364 (65.5%) |
| Arts, Media & Entertainment | 28 (100.0%) | 0 (0.0%) |
| Health Diagnosing & Treating | 206 (26.3%) | 576 (73.7%) |
| Health Technologists | 142 (30.1%) | 329 (69.9%) |
| Total (Category) | 1,487 (45.6%) | 1,777 (54.4%) |
| Total (Overall) | 5,855 (51.6%) | 5,492 (48.4%) |
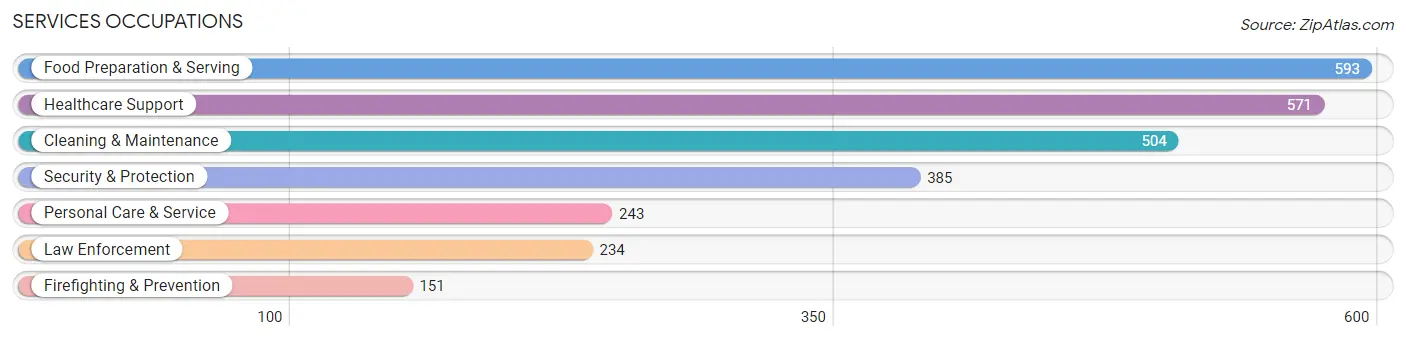
Services Occupations
The most common Services occupations in Upson County are Food Preparation & Serving (593 | 5.2%), Healthcare Support (571 | 5.0%), Cleaning & Maintenance (504 | 4.4%), Security & Protection (385 | 3.4%), and Personal Care & Service (243 | 2.1%).
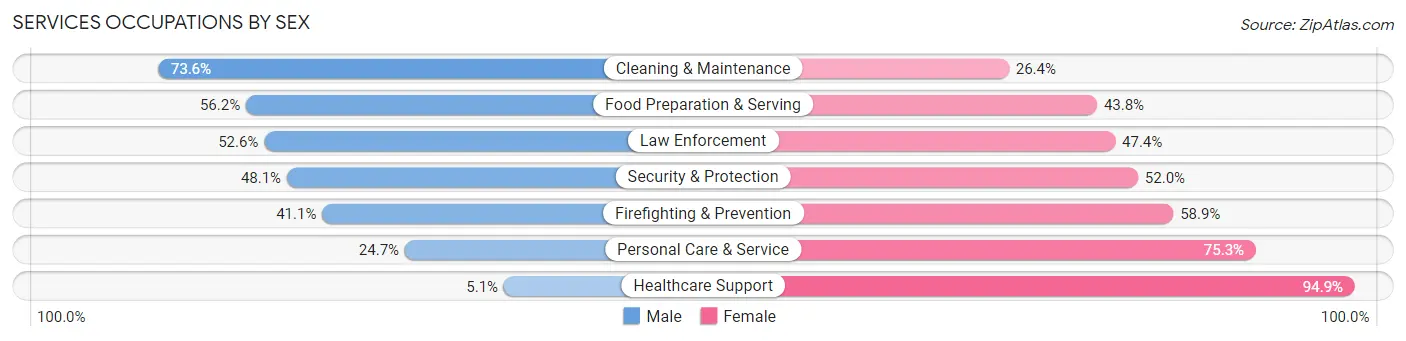
Services Occupations by Sex
Within the Services occupations in Upson County, the most male-oriented occupations are Cleaning & Maintenance (73.6%), Food Preparation & Serving (56.2%), and Law Enforcement (52.6%), while the most female-oriented occupations are Healthcare Support (94.9%), Personal Care & Service (75.3%), and Firefighting & Prevention (58.9%).
| Occupation | Male | Female |
| Healthcare Support | 29 (5.1%) | 542 (94.9%) |
| Security & Protection | 185 (48.0%) | 200 (51.9%) |
| Firefighting & Prevention | 62 (41.1%) | 89 (58.9%) |
| Law Enforcement | 123 (52.6%) | 111 (47.4%) |
| Food Preparation & Serving | 333 (56.2%) | 260 (43.8%) |
| Cleaning & Maintenance | 371 (73.6%) | 133 (26.4%) |
| Personal Care & Service | 60 (24.7%) | 183 (75.3%) |
| Total (Category) | 978 (42.6%) | 1,318 (57.4%) |
| Total (Overall) | 5,855 (51.6%) | 5,492 (48.4%) |
Sales and Office Occupations
The most common Sales and Office occupations in Upson County are Office & Administration (1,483 | 13.1%), and Sales & Related (825 | 7.3%).
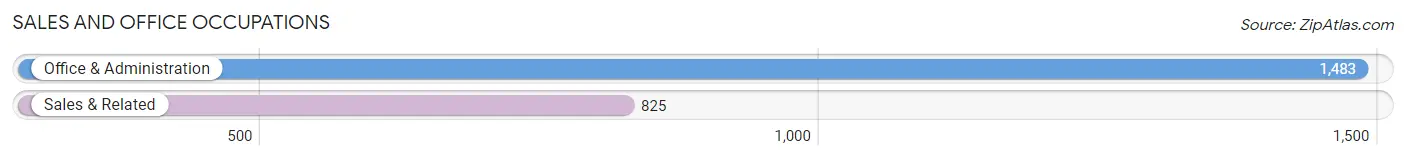
Sales and Office Occupations by Sex
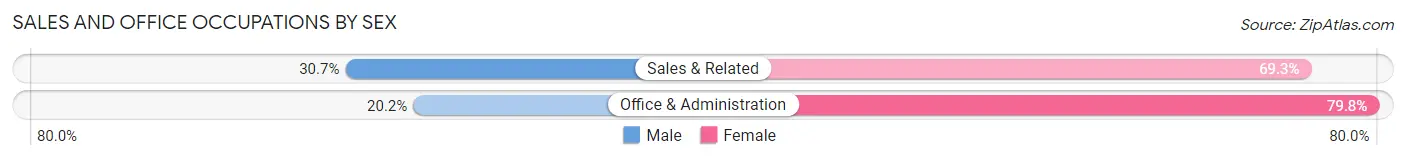
| Occupation | Male | Female |
| Sales & Related | 253 (30.7%) | 572 (69.3%) |
| Office & Administration | 300 (20.2%) | 1,183 (79.8%) |
| Total (Category) | 553 (24.0%) | 1,755 (76.0%) |
| Total (Overall) | 5,855 (51.6%) | 5,492 (48.4%) |
Natural Resources, Construction and Maintenance Occupations
The most common Natural Resources, Construction and Maintenance occupations in Upson County are Construction & Extraction (575 | 5.1%), Installation, Maintenance & Repair (462 | 4.1%), and Farming, Fishing & Forestry (80 | 0.7%).
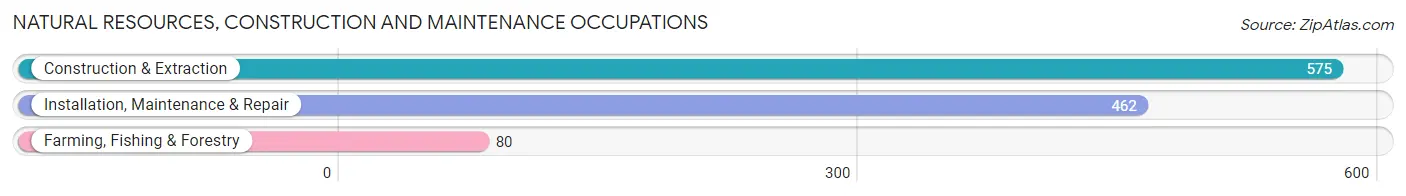
Natural Resources, Construction and Maintenance Occupations by Sex
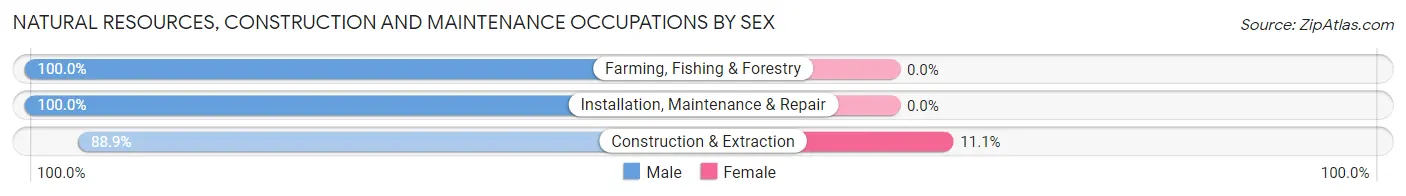
| Occupation | Male | Female |
| Farming, Fishing & Forestry | 80 (100.0%) | 0 (0.0%) |
| Construction & Extraction | 511 (88.9%) | 64 (11.1%) |
| Installation, Maintenance & Repair | 462 (100.0%) | 0 (0.0%) |
| Total (Category) | 1,053 (94.3%) | 64 (5.7%) |
| Total (Overall) | 5,855 (51.6%) | 5,492 (48.4%) |
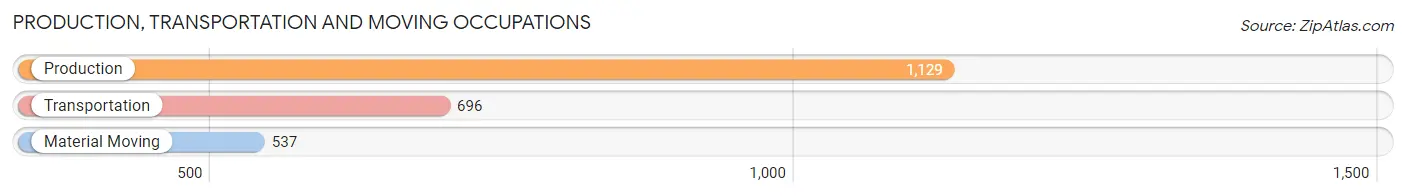
Production, Transportation and Moving Occupations
The most common Production, Transportation and Moving occupations in Upson County are Production (1,129 | 10.0%), Transportation (696 | 6.1%), and Material Moving (537 | 4.7%).
Production, Transportation and Moving Occupations by Sex
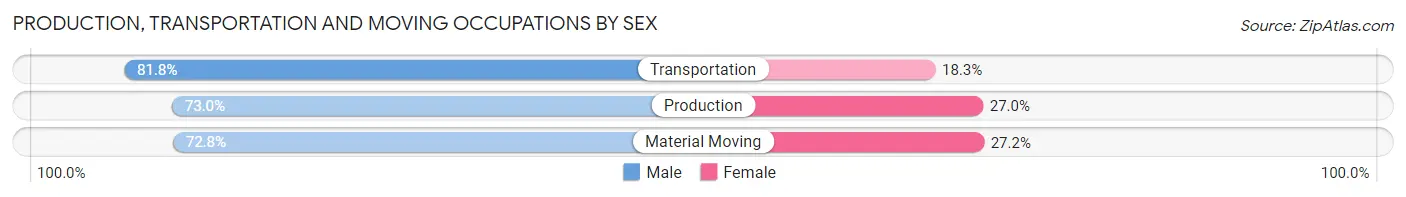
| Occupation | Male | Female |
| Production | 824 (73.0%) | 305 (27.0%) |
| Transportation | 569 (81.8%) | 127 (18.2%) |
| Material Moving | 391 (72.8%) | 146 (27.2%) |
| Total (Category) | 1,784 (75.5%) | 578 (24.5%) |
| Total (Overall) | 5,855 (51.6%) | 5,492 (48.4%) |
Employment Industries by Sex in Upson County
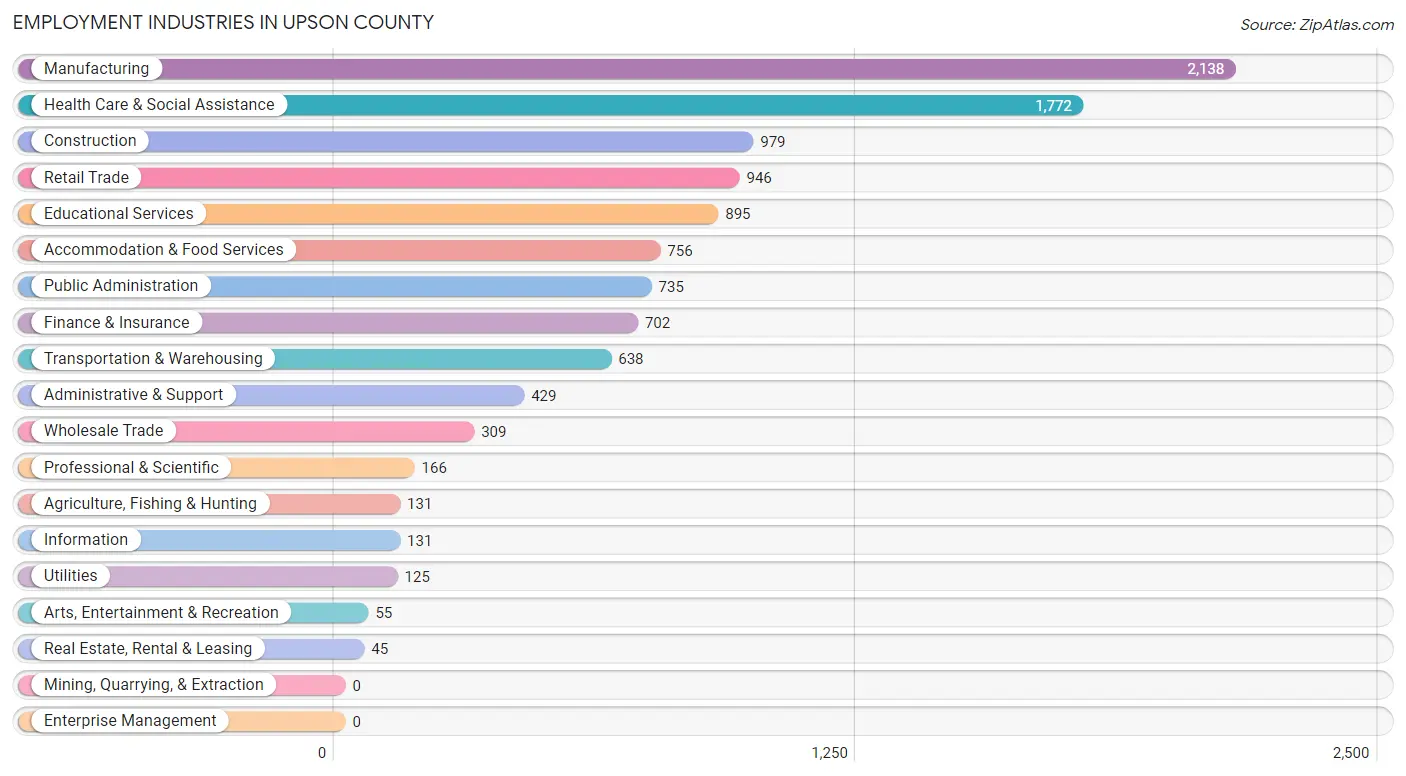
Employment Industries in Upson County
The major employment industries in Upson County include Manufacturing (2,138 | 18.8%), Health Care & Social Assistance (1,772 | 15.6%), Construction (979 | 8.6%), Retail Trade (946 | 8.3%), and Educational Services (895 | 7.9%).
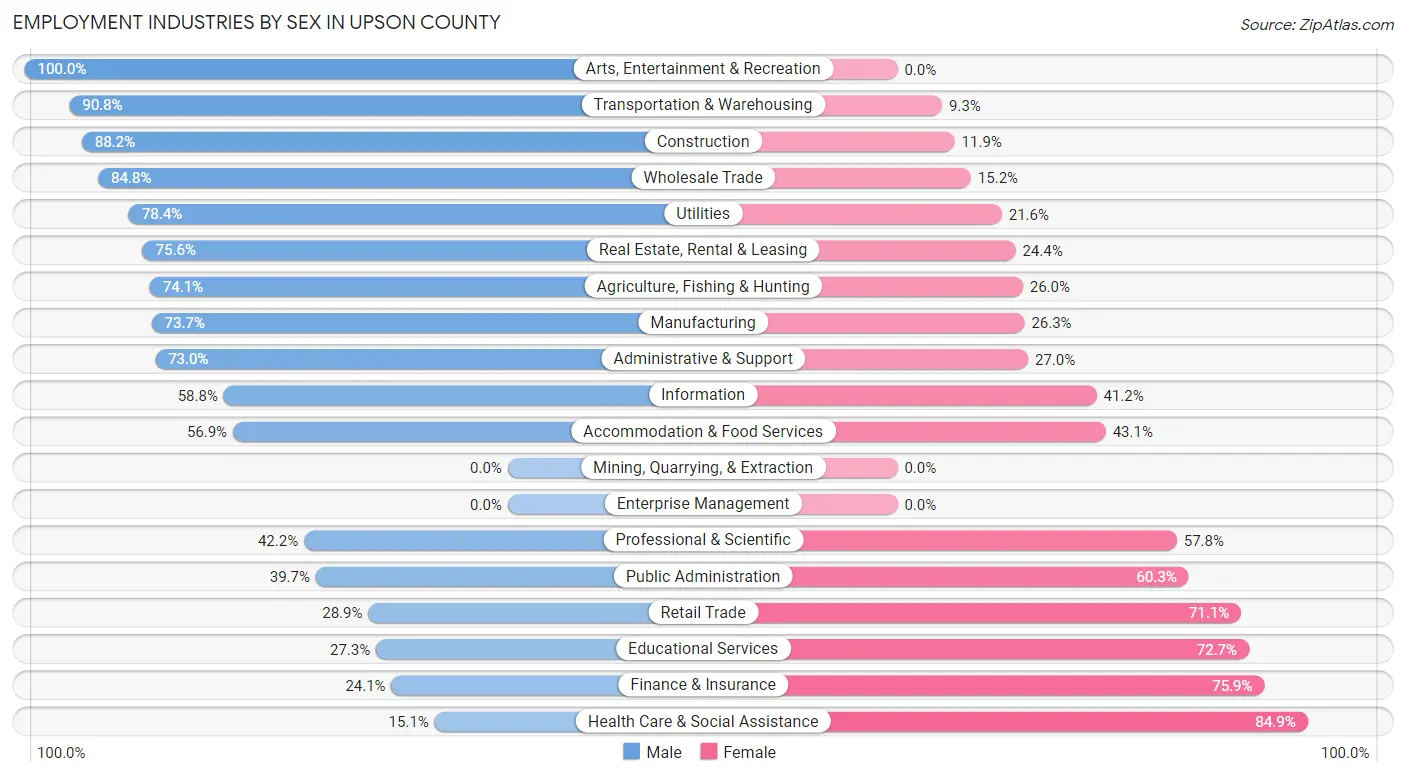
Employment Industries by Sex in Upson County
The Upson County industries that see more men than women are Arts, Entertainment & Recreation (100.0%), Transportation & Warehousing (90.7%), and Construction (88.1%), whereas the industries that tend to have a higher number of women are Health Care & Social Assistance (84.9%), Finance & Insurance (75.9%), and Educational Services (72.7%).
| Industry | Male | Female |
| Agriculture, Fishing & Hunting | 97 (74.1%) | 34 (26.0%) |
| Mining, Quarrying, & Extraction | 0 (0.0%) | 0 (0.0%) |
| Construction | 863 (88.1%) | 116 (11.8%) |
| Manufacturing | 1,576 (73.7%) | 562 (26.3%) |
| Wholesale Trade | 262 (84.8%) | 47 (15.2%) |
| Retail Trade | 273 (28.9%) | 673 (71.1%) |
| Transportation & Warehousing | 579 (90.7%) | 59 (9.2%) |
| Utilities | 98 (78.4%) | 27 (21.6%) |
| Information | 77 (58.8%) | 54 (41.2%) |
| Finance & Insurance | 169 (24.1%) | 533 (75.9%) |
| Real Estate, Rental & Leasing | 34 (75.6%) | 11 (24.4%) |
| Professional & Scientific | 70 (42.2%) | 96 (57.8%) |
| Enterprise Management | 0 (0.0%) | 0 (0.0%) |
| Administrative & Support | 313 (73.0%) | 116 (27.0%) |
| Educational Services | 244 (27.3%) | 651 (72.7%) |
| Health Care & Social Assistance | 268 (15.1%) | 1,504 (84.9%) |
| Arts, Entertainment & Recreation | 55 (100.0%) | 0 (0.0%) |
| Accommodation & Food Services | 430 (56.9%) | 326 (43.1%) |
| Public Administration | 292 (39.7%) | 443 (60.3%) |
| Total | 5,855 (51.6%) | 5,492 (48.4%) |
Education in Upson County
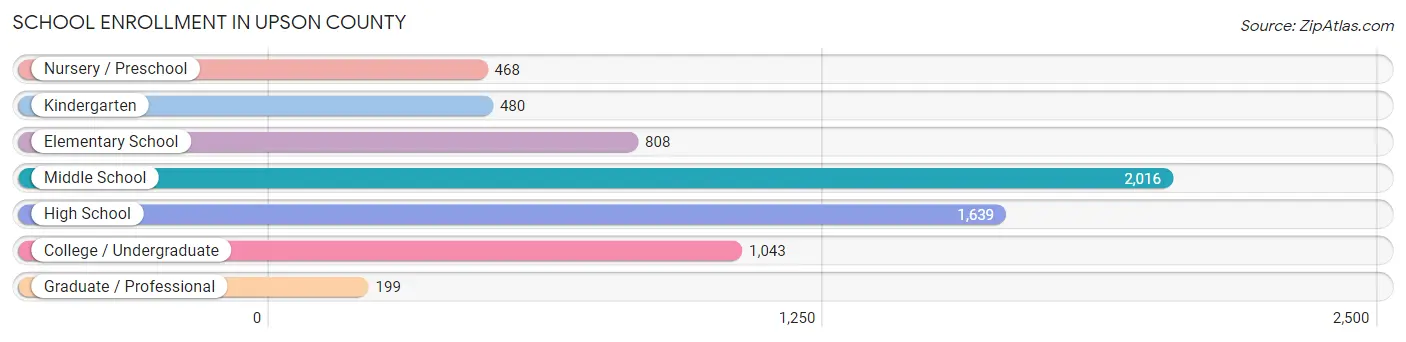
School Enrollment in Upson County
The most common levels of schooling among the 6,653 students in Upson County are middle school (2,016 | 30.3%), high school (1,639 | 24.6%), and college / undergraduate (1,043 | 15.7%).
| School Level | # Students | % Students |
| Nursery / Preschool | 468 | 7.0% |
| Kindergarten | 480 | 7.2% |
| Elementary School | 808 | 12.1% |
| Middle School | 2,016 | 30.3% |
| High School | 1,639 | 24.6% |
| College / Undergraduate | 1,043 | 15.7% |
| Graduate / Professional | 199 | 3.0% |
| Total | 6,653 | 100.0% |
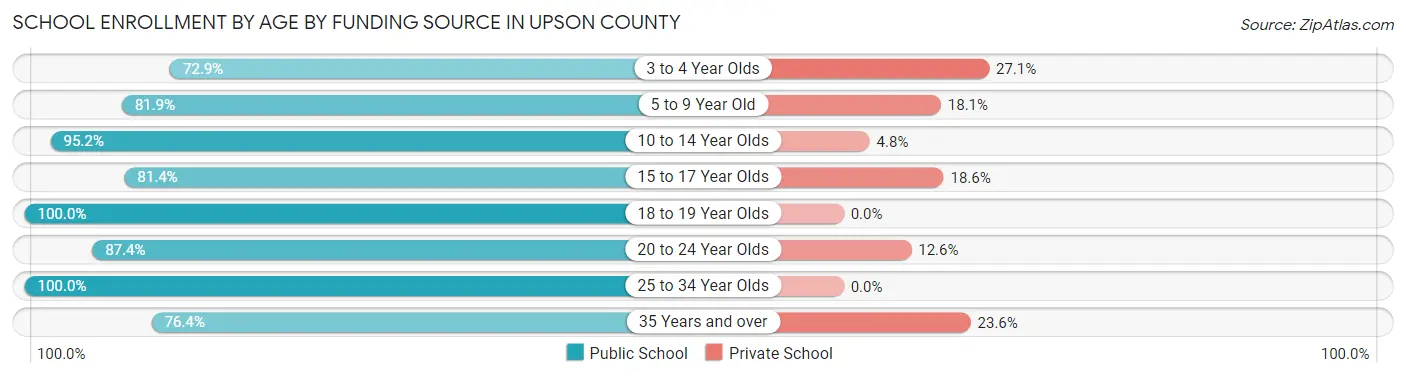
School Enrollment by Age by Funding Source in Upson County
Out of a total of 6,653 students who are enrolled in schools in Upson County, 825 (12.4%) attend a private institution, while the remaining 5,828 (87.6%) are enrolled in public schools. The age group of 3 to 4 year olds has the highest likelihood of being enrolled in private schools, with 91 (27.1% in the age bracket) enrolled. Conversely, the age group of 18 to 19 year olds has the lowest likelihood of being enrolled in a private school, with 339 (100.0% in the age bracket) attending a public institution.
| Age Bracket | Public School | Private School |
| 3 to 4 Year Olds | 245 (72.9%) | 91 (27.1%) |
| 5 to 9 Year Old | 1,118 (81.9%) | 247 (18.1%) |
| 10 to 14 Year Olds | 2,300 (95.2%) | 117 (4.8%) |
| 15 to 17 Year Olds | 827 (81.4%) | 189 (18.6%) |
| 18 to 19 Year Olds | 339 (100.0%) | 0 (0.0%) |
| 20 to 24 Year Olds | 430 (87.4%) | 62 (12.6%) |
| 25 to 34 Year Olds | 193 (100.0%) | 0 (0.0%) |
| 35 Years and over | 378 (76.4%) | 117 (23.6%) |
| Total | 5,828 (87.6%) | 825 (12.4%) |
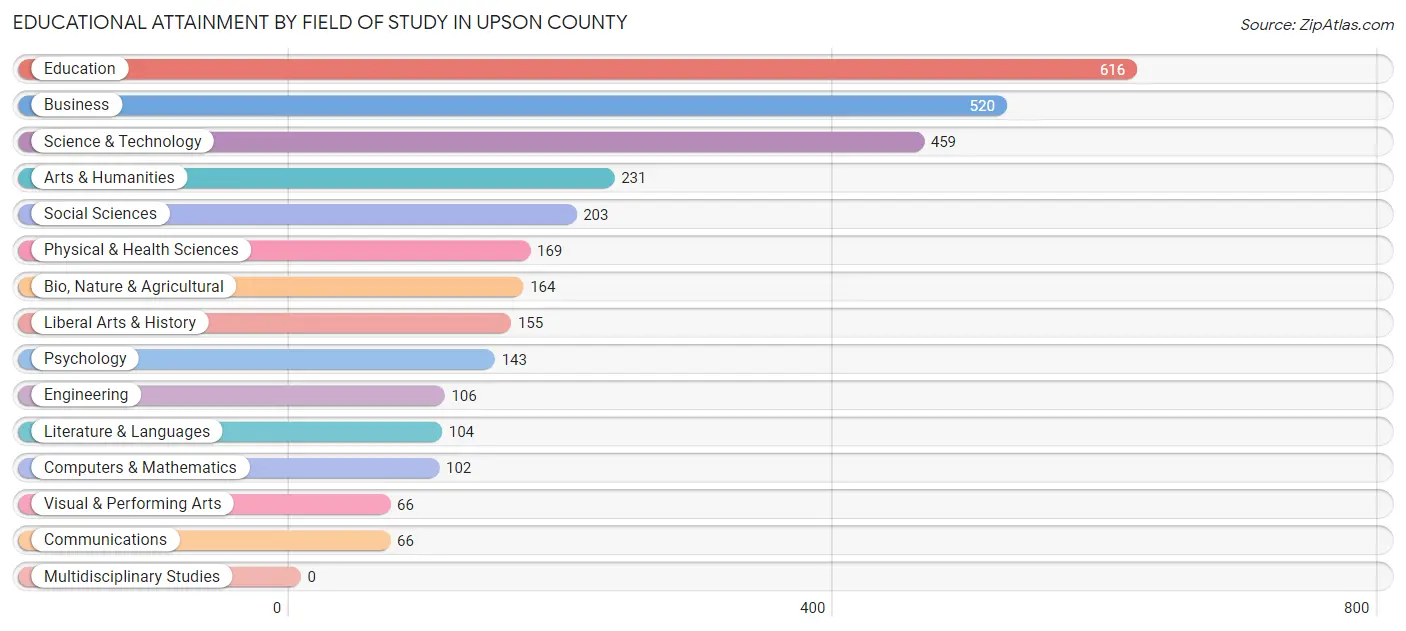
Educational Attainment by Field of Study in Upson County
Education (616 | 19.9%), business (520 | 16.8%), science & technology (459 | 14.8%), arts & humanities (231 | 7.4%), and social sciences (203 | 6.5%) are the most common fields of study among 3,104 individuals in Upson County who have obtained a bachelor's degree or higher.
| Field of Study | # Graduates | % Graduates |
| Computers & Mathematics | 102 | 3.3% |
| Bio, Nature & Agricultural | 164 | 5.3% |
| Physical & Health Sciences | 169 | 5.4% |
| Psychology | 143 | 4.6% |
| Social Sciences | 203 | 6.5% |
| Engineering | 106 | 3.4% |
| Multidisciplinary Studies | 0 | 0.0% |
| Science & Technology | 459 | 14.8% |
| Business | 520 | 16.8% |
| Education | 616 | 19.9% |
| Literature & Languages | 104 | 3.4% |
| Liberal Arts & History | 155 | 5.0% |
| Visual & Performing Arts | 66 | 2.1% |
| Communications | 66 | 2.1% |
| Arts & Humanities | 231 | 7.4% |
| Total | 3,104 | 100.0% |
Transportation & Commute in Upson County
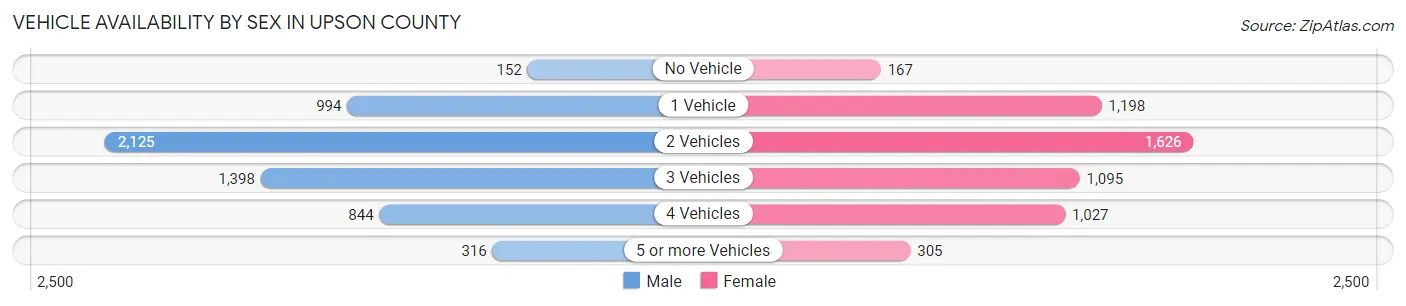
Vehicle Availability by Sex in Upson County
The most prevalent vehicle ownership categories in Upson County are males with 2 vehicles (2,125, accounting for 36.5%) and females with 2 vehicles (1,626, making up 39.2%).
| Vehicles Available | Male | Female |
| No Vehicle | 152 (2.6%) | 167 (3.1%) |
| 1 Vehicle | 994 (17.1%) | 1,198 (22.1%) |
| 2 Vehicles | 2,125 (36.5%) | 1,626 (30.0%) |
| 3 Vehicles | 1,398 (24.0%) | 1,095 (20.2%) |
| 4 Vehicles | 844 (14.5%) | 1,027 (19.0%) |
| 5 or more Vehicles | 316 (5.4%) | 305 (5.6%) |
| Total | 5,829 (100.0%) | 5,418 (100.0%) |
Commute Time in Upson County
The most frequently occuring commute durations in Upson County are 5 to 9 minutes (1,869 commuters, 17.0%), 10 to 14 minutes (1,825 commuters, 16.6%), and 15 to 19 minutes (1,719 commuters, 15.7%).
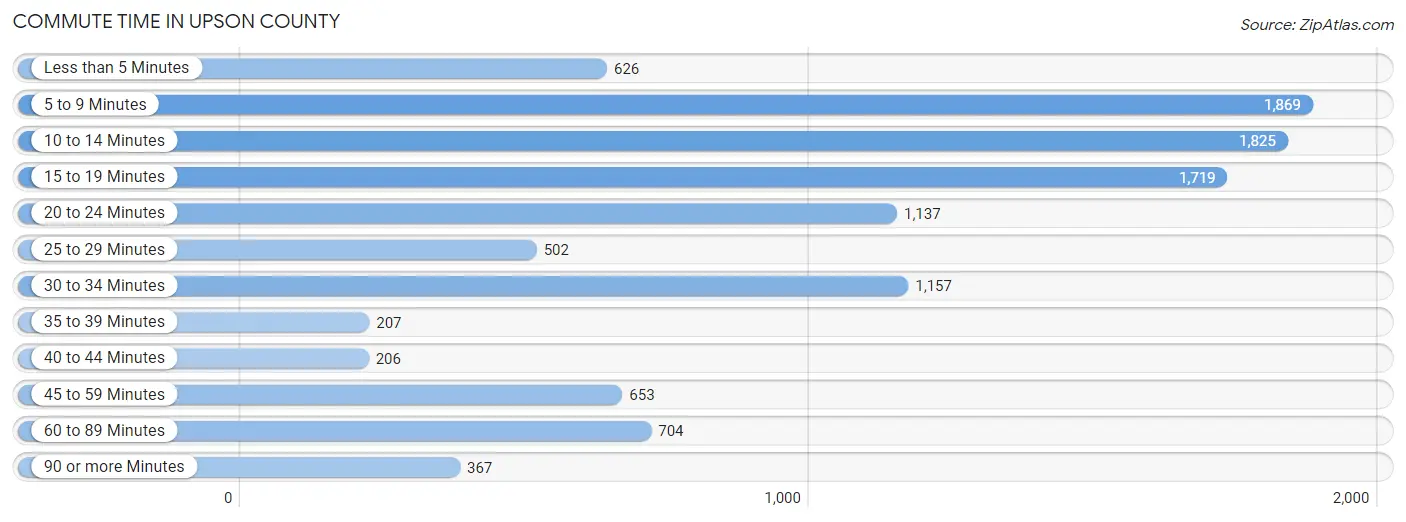
| Commute Time | # Commuters | % Commuters |
| Less than 5 Minutes | 626 | 5.7% |
| 5 to 9 Minutes | 1,869 | 17.0% |
| 10 to 14 Minutes | 1,825 | 16.6% |
| 15 to 19 Minutes | 1,719 | 15.7% |
| 20 to 24 Minutes | 1,137 | 10.4% |
| 25 to 29 Minutes | 502 | 4.6% |
| 30 to 34 Minutes | 1,157 | 10.5% |
| 35 to 39 Minutes | 207 | 1.9% |
| 40 to 44 Minutes | 206 | 1.9% |
| 45 to 59 Minutes | 653 | 5.9% |
| 60 to 89 Minutes | 704 | 6.4% |
| 90 or more Minutes | 367 | 3.3% |
Commute Time by Sex in Upson County
The most common commute times in Upson County are 5 to 9 minutes (963 commuters, 17.1%) for males and 15 to 19 minutes (1,046 commuters, 19.6%) for females.
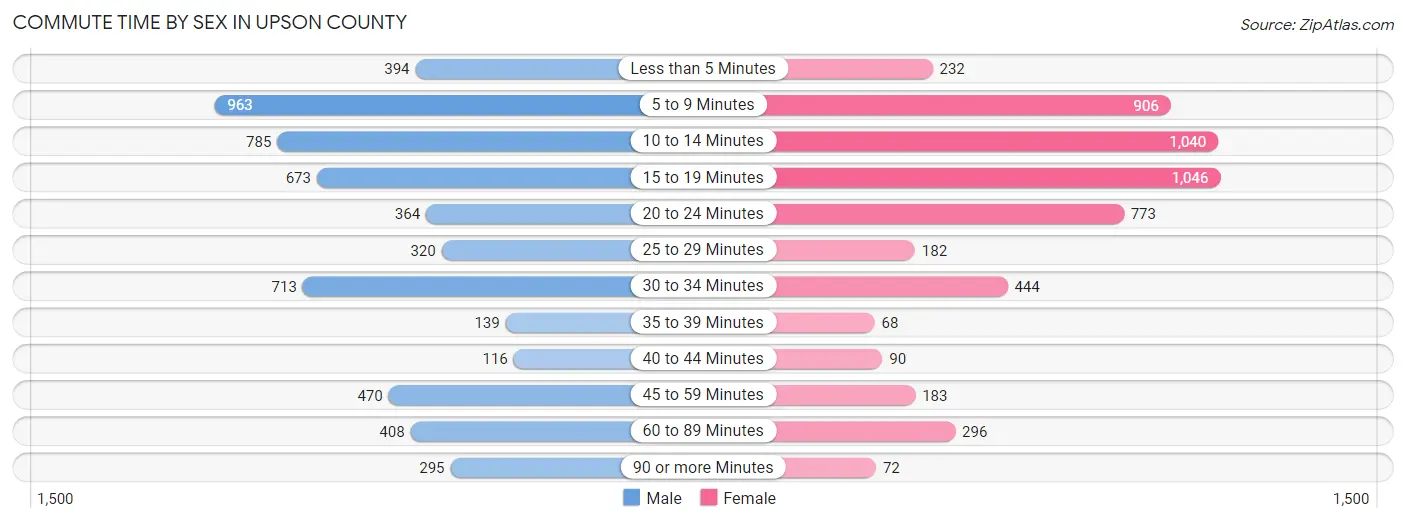
| Commute Time | Male | Female |
| Less than 5 Minutes | 394 (7.0%) | 232 (4.3%) |
| 5 to 9 Minutes | 963 (17.1%) | 906 (17.0%) |
| 10 to 14 Minutes | 785 (13.9%) | 1,040 (19.5%) |
| 15 to 19 Minutes | 673 (11.9%) | 1,046 (19.6%) |
| 20 to 24 Minutes | 364 (6.5%) | 773 (14.5%) |
| 25 to 29 Minutes | 320 (5.7%) | 182 (3.4%) |
| 30 to 34 Minutes | 713 (12.6%) | 444 (8.3%) |
| 35 to 39 Minutes | 139 (2.5%) | 68 (1.3%) |
| 40 to 44 Minutes | 116 (2.1%) | 90 (1.7%) |
| 45 to 59 Minutes | 470 (8.3%) | 183 (3.4%) |
| 60 to 89 Minutes | 408 (7.2%) | 296 (5.6%) |
| 90 or more Minutes | 295 (5.2%) | 72 (1.3%) |
Time of Departure to Work by Sex in Upson County
The most frequent times of departure to work in Upson County are 6:30 AM to 6:59 AM (831, 14.7%) for males and 7:30 AM to 7:59 AM (1,170, 21.9%) for females.
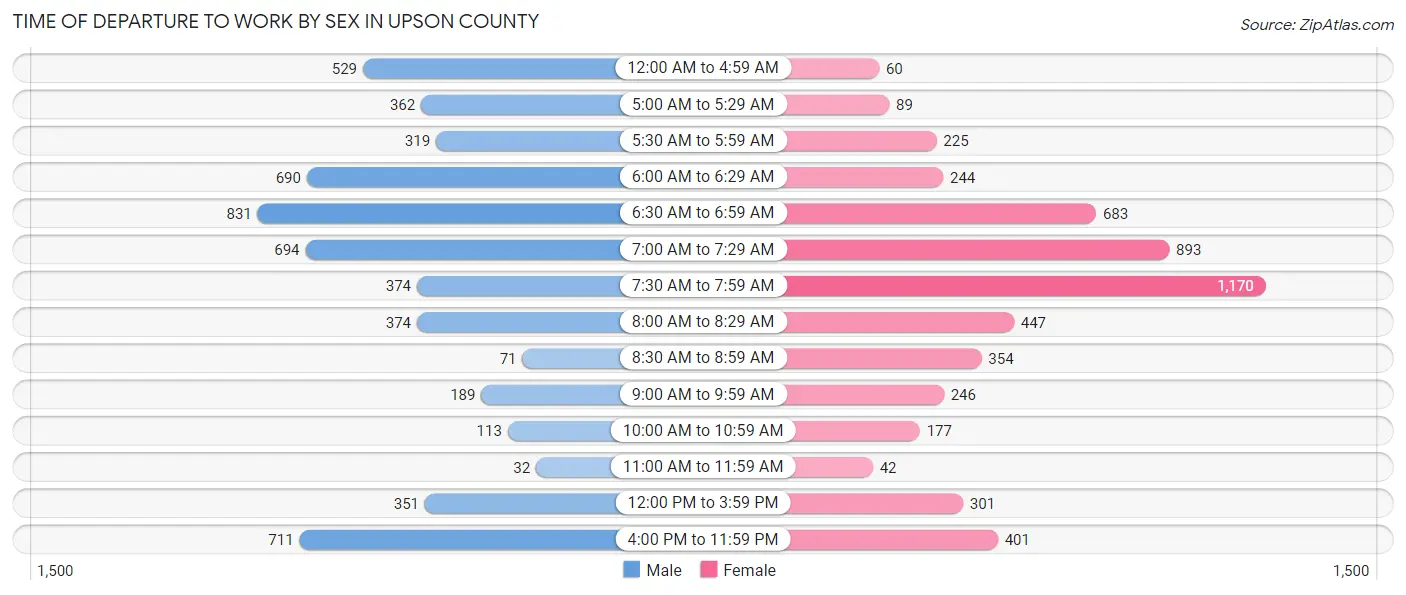
| Time of Departure | Male | Female |
| 12:00 AM to 4:59 AM | 529 (9.4%) | 60 (1.1%) |
| 5:00 AM to 5:29 AM | 362 (6.4%) | 89 (1.7%) |
| 5:30 AM to 5:59 AM | 319 (5.7%) | 225 (4.2%) |
| 6:00 AM to 6:29 AM | 690 (12.2%) | 244 (4.6%) |
| 6:30 AM to 6:59 AM | 831 (14.7%) | 683 (12.8%) |
| 7:00 AM to 7:29 AM | 694 (12.3%) | 893 (16.8%) |
| 7:30 AM to 7:59 AM | 374 (6.6%) | 1,170 (21.9%) |
| 8:00 AM to 8:29 AM | 374 (6.6%) | 447 (8.4%) |
| 8:30 AM to 8:59 AM | 71 (1.3%) | 354 (6.6%) |
| 9:00 AM to 9:59 AM | 189 (3.4%) | 246 (4.6%) |
| 10:00 AM to 10:59 AM | 113 (2.0%) | 177 (3.3%) |
| 11:00 AM to 11:59 AM | 32 (0.6%) | 42 (0.8%) |
| 12:00 PM to 3:59 PM | 351 (6.2%) | 301 (5.7%) |
| 4:00 PM to 11:59 PM | 711 (12.6%) | 401 (7.5%) |
| Total | 5,640 (100.0%) | 5,332 (100.0%) |
Housing Occupancy in Upson County
Occupancy by Ownership in Upson County
Of the total 10,412 dwellings in Upson County, owner-occupied units account for 6,729 (64.6%), while renter-occupied units make up 3,683 (35.4%).
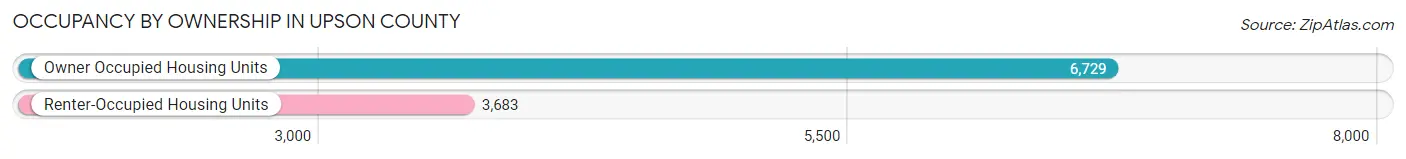
| Occupancy | # Housing Units | % Housing Units |
| Owner Occupied Housing Units | 6,729 | 64.6% |
| Renter-Occupied Housing Units | 3,683 | 35.4% |
| Total Occupied Housing Units | 10,412 | 100.0% |
Occupancy by Household Size in Upson County

| Household Size | # Housing Units | % Housing Units |
| 1-Person Household | 3,131 | 30.1% |
| 2-Person Household | 3,508 | 33.7% |
| 3-Person Household | 1,895 | 18.2% |
| 4+ Person Household | 1,878 | 18.0% |
| Total Housing Units | 10,412 | 100.0% |
Occupancy by Ownership by Household Size in Upson County
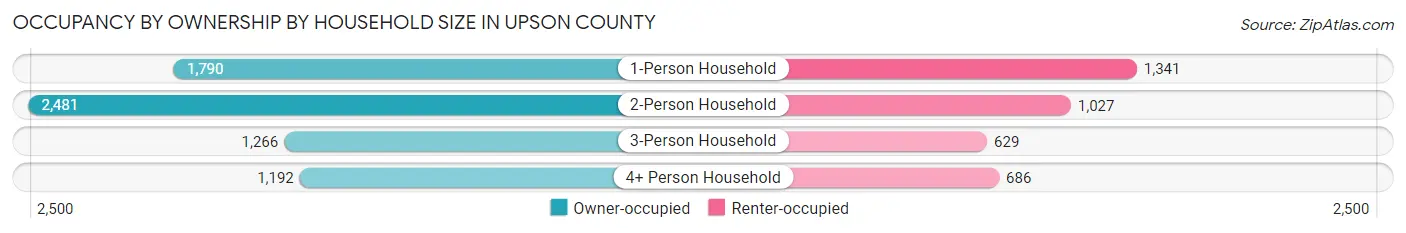
| Household Size | Owner-occupied | Renter-occupied |
| 1-Person Household | 1,790 (57.2%) | 1,341 (42.8%) |
| 2-Person Household | 2,481 (70.7%) | 1,027 (29.3%) |
| 3-Person Household | 1,266 (66.8%) | 629 (33.2%) |
| 4+ Person Household | 1,192 (63.5%) | 686 (36.5%) |
| Total Housing Units | 6,729 (64.6%) | 3,683 (35.4%) |
Occupancy by Educational Attainment in Upson County
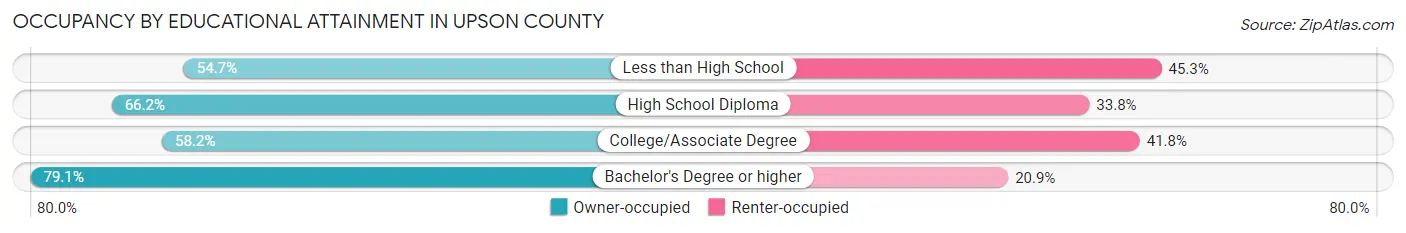
| Household Size | Owner-occupied | Renter-occupied |
| Less than High School | 791 (54.7%) | 654 (45.3%) |
| High School Diploma | 2,697 (66.2%) | 1,378 (33.8%) |
| College/Associate Degree | 1,746 (58.2%) | 1,255 (41.8%) |
| Bachelor's Degree or higher | 1,495 (79.1%) | 396 (20.9%) |
Occupancy by Age of Householder in Upson County
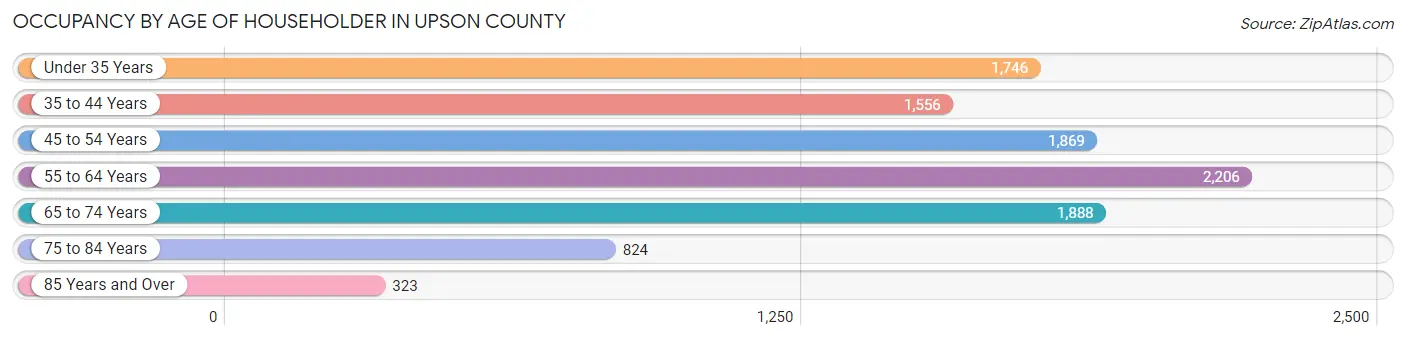
| Age Bracket | # Households | % Households |
| Under 35 Years | 1,746 | 16.8% |
| 35 to 44 Years | 1,556 | 14.9% |
| 45 to 54 Years | 1,869 | 17.9% |
| 55 to 64 Years | 2,206 | 21.2% |
| 65 to 74 Years | 1,888 | 18.1% |
| 75 to 84 Years | 824 | 7.9% |
| 85 Years and Over | 323 | 3.1% |
| Total | 10,412 | 100.0% |
Housing Finances in Upson County
Median Income by Occupancy in Upson County
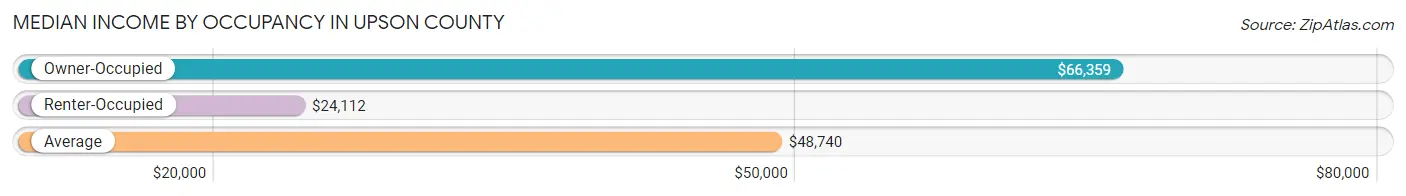
| Occupancy Type | # Households | Median Income |
| Owner-Occupied | 6,729 (64.6%) | $66,359 |
| Renter-Occupied | 3,683 (35.4%) | $24,112 |
| Average | 10,412 (100.0%) | $48,740 |
Occupancy by Householder Income Bracket in Upson County
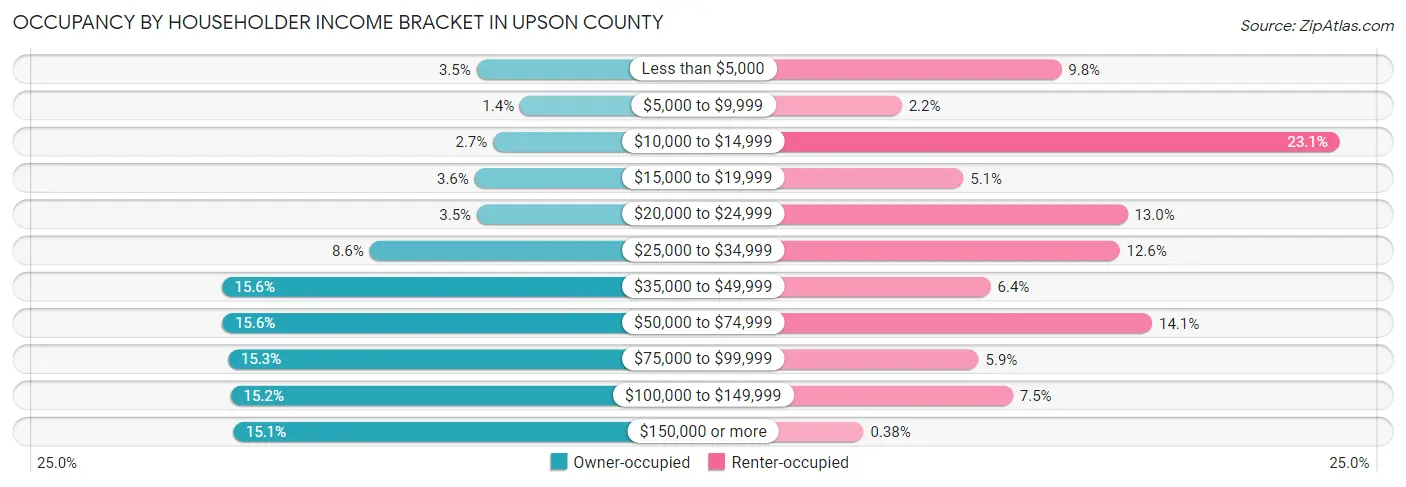
| Income Bracket | Owner-occupied | Renter-occupied |
| Less than $5,000 | 234 (3.5%) | 361 (9.8%) |
| $5,000 to $9,999 | 95 (1.4%) | 81 (2.2%) |
| $10,000 to $14,999 | 181 (2.7%) | 849 (23.1%) |
| $15,000 to $19,999 | 240 (3.6%) | 189 (5.1%) |
| $20,000 to $24,999 | 233 (3.5%) | 477 (13.0%) |
| $25,000 to $34,999 | 577 (8.6%) | 463 (12.6%) |
| $35,000 to $49,999 | 1,051 (15.6%) | 237 (6.4%) |
| $50,000 to $74,999 | 1,050 (15.6%) | 520 (14.1%) |
| $75,000 to $99,999 | 1,031 (15.3%) | 216 (5.9%) |
| $100,000 to $149,999 | 1,022 (15.2%) | 276 (7.5%) |
| $150,000 or more | 1,015 (15.1%) | 14 (0.4%) |
| Total | 6,729 (100.0%) | 3,683 (100.0%) |
Monthly Housing Cost Tiers in Upson County
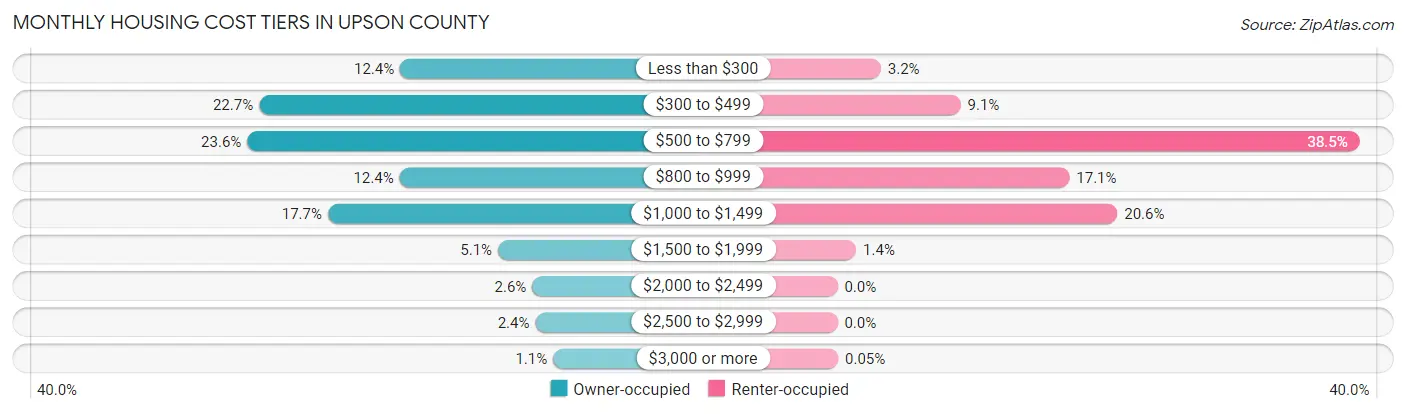
| Monthly Cost | Owner-occupied | Renter-occupied |
| Less than $300 | 831 (12.3%) | 118 (3.2%) |
| $300 to $499 | 1,530 (22.7%) | 334 (9.1%) |
| $500 to $799 | 1,589 (23.6%) | 1,416 (38.5%) |
| $800 to $999 | 834 (12.4%) | 629 (17.1%) |
| $1,000 to $1,499 | 1,189 (17.7%) | 759 (20.6%) |
| $1,500 to $1,999 | 346 (5.1%) | 51 (1.4%) |
| $2,000 to $2,499 | 176 (2.6%) | 0 (0.0%) |
| $2,500 to $2,999 | 161 (2.4%) | 0 (0.0%) |
| $3,000 or more | 73 (1.1%) | 2 (0.1%) |
| Total | 6,729 (100.0%) | 3,683 (100.0%) |
Physical Housing Characteristics in Upson County
Housing Structures in Upson County
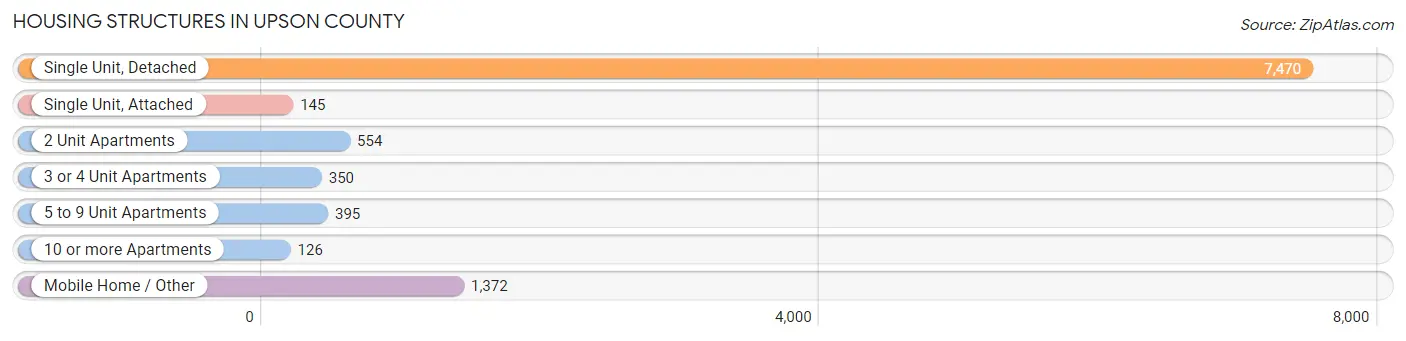
| Structure Type | # Housing Units | % Housing Units |
| Single Unit, Detached | 7,470 | 71.7% |
| Single Unit, Attached | 145 | 1.4% |
| 2 Unit Apartments | 554 | 5.3% |
| 3 or 4 Unit Apartments | 350 | 3.4% |
| 5 to 9 Unit Apartments | 395 | 3.8% |
| 10 or more Apartments | 126 | 1.2% |
| Mobile Home / Other | 1,372 | 13.2% |
| Total | 10,412 | 100.0% |
Housing Structures by Occupancy in Upson County
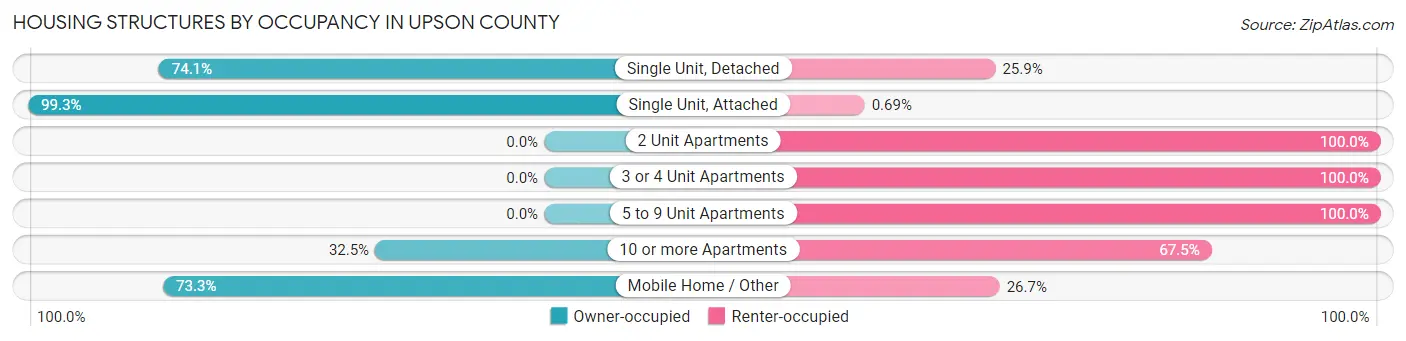
| Structure Type | Owner-occupied | Renter-occupied |
| Single Unit, Detached | 5,538 (74.1%) | 1,932 (25.9%) |
| Single Unit, Attached | 144 (99.3%) | 1 (0.7%) |
| 2 Unit Apartments | 0 (0.0%) | 554 (100.0%) |
| 3 or 4 Unit Apartments | 0 (0.0%) | 350 (100.0%) |
| 5 to 9 Unit Apartments | 0 (0.0%) | 395 (100.0%) |
| 10 or more Apartments | 41 (32.5%) | 85 (67.5%) |
| Mobile Home / Other | 1,006 (73.3%) | 366 (26.7%) |
| Total | 6,729 (64.6%) | 3,683 (35.4%) |
Housing Structures by Number of Rooms in Upson County
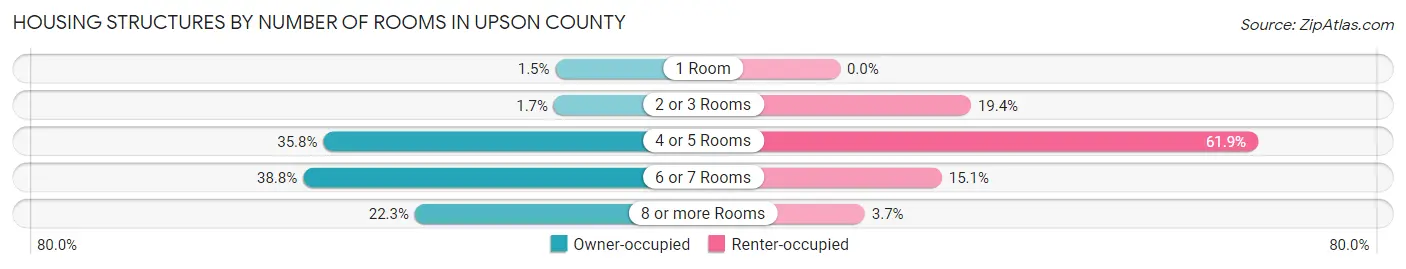
| Number of Rooms | Owner-occupied | Renter-occupied |
| 1 Room | 98 (1.5%) | 0 (0.0%) |
| 2 or 3 Rooms | 113 (1.7%) | 714 (19.4%) |
| 4 or 5 Rooms | 2,409 (35.8%) | 2,278 (61.9%) |
| 6 or 7 Rooms | 2,611 (38.8%) | 555 (15.1%) |
| 8 or more Rooms | 1,498 (22.3%) | 136 (3.7%) |
| Total | 6,729 (100.0%) | 3,683 (100.0%) |
Housing Structure by Heating Type in Upson County
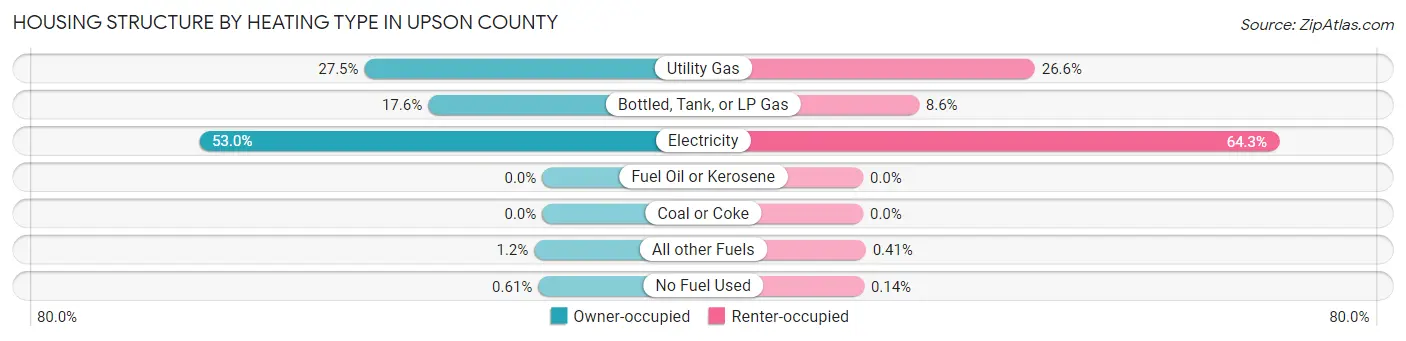
| Heating Type | Owner-occupied | Renter-occupied |
| Utility Gas | 1,849 (27.5%) | 978 (26.6%) |
| Bottled, Tank, or LP Gas | 1,187 (17.6%) | 318 (8.6%) |
| Electricity | 3,569 (53.0%) | 2,367 (64.3%) |
| Fuel Oil or Kerosene | 0 (0.0%) | 0 (0.0%) |
| Coal or Coke | 0 (0.0%) | 0 (0.0%) |
| All other Fuels | 83 (1.2%) | 15 (0.4%) |
| No Fuel Used | 41 (0.6%) | 5 (0.1%) |
| Total | 6,729 (100.0%) | 3,683 (100.0%) |
Household Vehicle Usage in Upson County
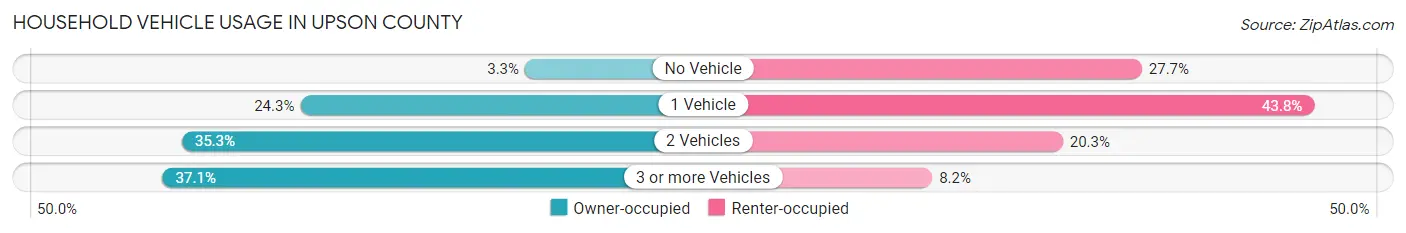
| Vehicles per Household | Owner-occupied | Renter-occupied |
| No Vehicle | 222 (3.3%) | 1,021 (27.7%) |
| 1 Vehicle | 1,633 (24.3%) | 1,613 (43.8%) |
| 2 Vehicles | 2,377 (35.3%) | 749 (20.3%) |
| 3 or more Vehicles | 2,497 (37.1%) | 300 (8.2%) |
| Total | 6,729 (100.0%) | 3,683 (100.0%) |
Real Estate & Mortgages in Upson County
Real Estate and Mortgage Overview in Upson County
| Characteristic | Without Mortgage | With Mortgage |
| Housing Units | 3,810 | 2,919 |
| Median Property Value | $125,400 | $146,300 |
| Median Household Income | $53,167 | $600 |
| Monthly Housing Costs | $424 | $71 |
| Real Estate Taxes | $1,130 | $38 |
Property Value by Mortgage Status in Upson County
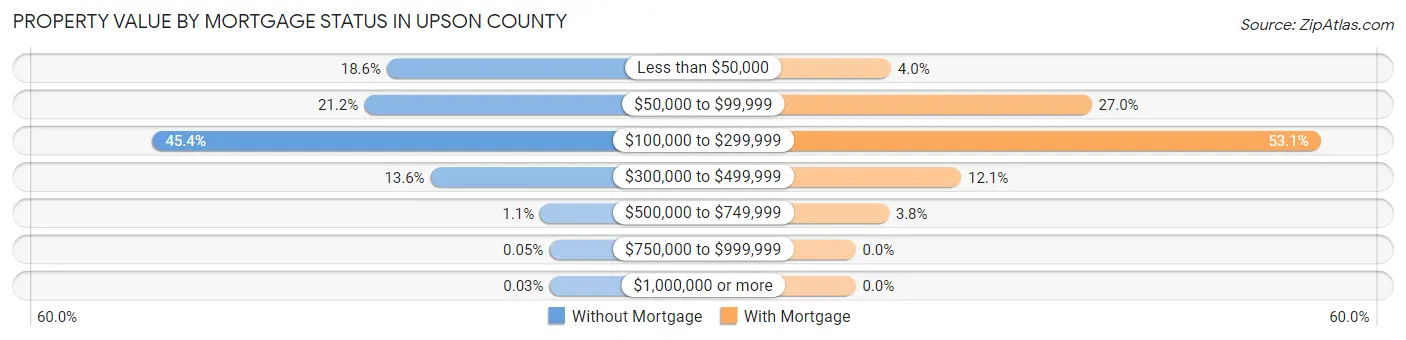
| Property Value | Without Mortgage | With Mortgage |
| Less than $50,000 | 709 (18.6%) | 118 (4.0%) |
| $50,000 to $99,999 | 808 (21.2%) | 787 (27.0%) |
| $100,000 to $299,999 | 1,729 (45.4%) | 1,551 (53.1%) |
| $300,000 to $499,999 | 519 (13.6%) | 352 (12.1%) |
| $500,000 to $749,999 | 42 (1.1%) | 111 (3.8%) |
| $750,000 to $999,999 | 2 (0.1%) | 0 (0.0%) |
| $1,000,000 or more | 1 (0.0%) | 0 (0.0%) |
| Total | 3,810 (100.0%) | 2,919 (100.0%) |
Household Income by Mortgage Status in Upson County
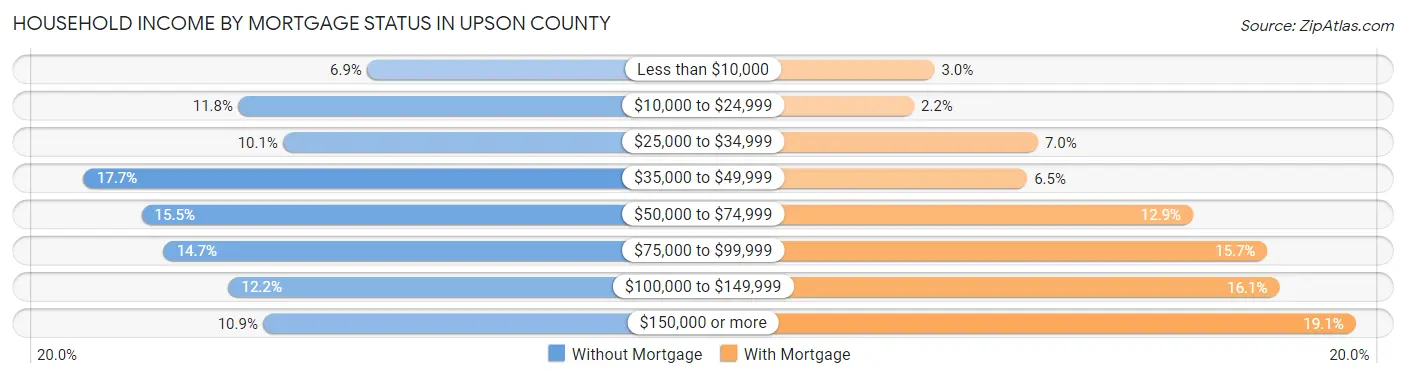
| Household Income | Without Mortgage | With Mortgage |
| Less than $10,000 | 264 (6.9%) | 88 (3.0%) |
| $10,000 to $24,999 | 451 (11.8%) | 65 (2.2%) |
| $25,000 to $34,999 | 386 (10.1%) | 203 (7.0%) |
| $35,000 to $49,999 | 676 (17.7%) | 191 (6.5%) |
| $50,000 to $74,999 | 592 (15.5%) | 375 (12.9%) |
| $75,000 to $99,999 | 560 (14.7%) | 458 (15.7%) |
| $100,000 to $149,999 | 466 (12.2%) | 471 (16.1%) |
| $150,000 or more | 415 (10.9%) | 556 (19.1%) |
| Total | 3,810 (100.0%) | 2,919 (100.0%) |
Property Value to Household Income Ratio in Upson County
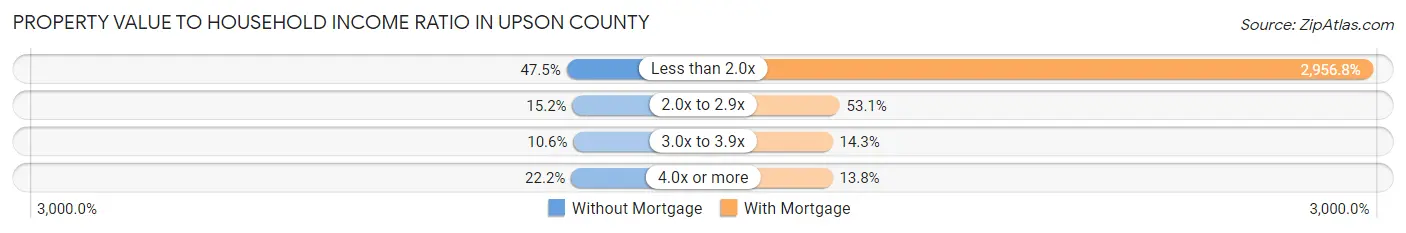
| Value-to-Income Ratio | Without Mortgage | With Mortgage |
| Less than 2.0x | 1,811 (47.5%) | 86,310 (2,956.8%) |
| 2.0x to 2.9x | 580 (15.2%) | 1,549 (53.1%) |
| 3.0x to 3.9x | 404 (10.6%) | 418 (14.3%) |
| 4.0x or more | 847 (22.2%) | 402 (13.8%) |
| Total | 3,810 (100.0%) | 2,919 (100.0%) |
Real Estate Taxes by Mortgage Status in Upson County
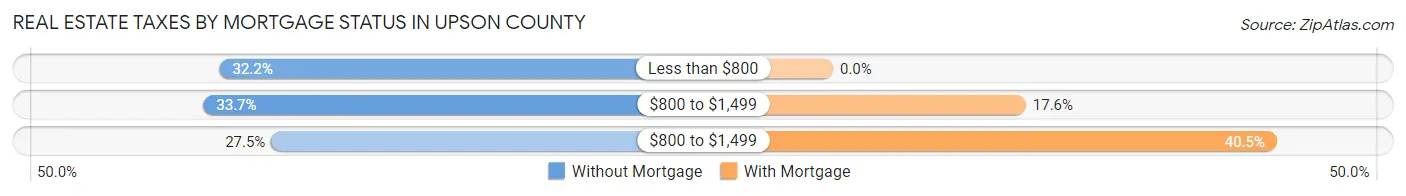
| Property Taxes | Without Mortgage | With Mortgage |
| Less than $800 | 1,227 (32.2%) | 0 (0.0%) |
| $800 to $1,499 | 1,283 (33.7%) | 514 (17.6%) |
| $800 to $1,499 | 1,047 (27.5%) | 1,183 (40.5%) |
| Total | 3,810 (100.0%) | 2,919 (100.0%) |
Health & Disability in Upson County
Health Insurance Coverage by Age in Upson County
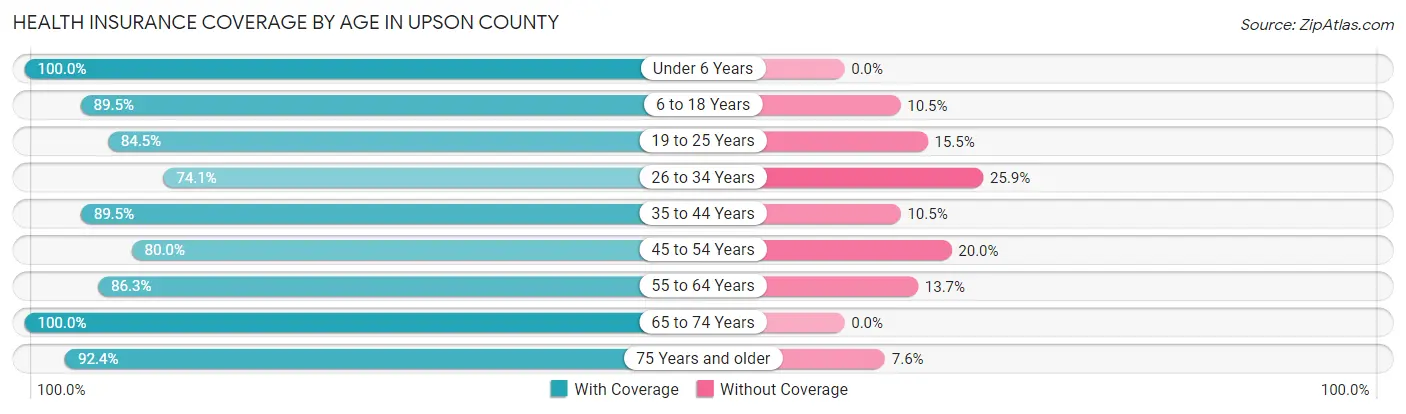
| Age Bracket | With Coverage | Without Coverage |
| Under 6 Years | 1,647 (100.0%) | 0 (0.0%) |
| 6 to 18 Years | 4,528 (89.5%) | 529 (10.5%) |
| 19 to 25 Years | 1,844 (84.5%) | 339 (15.5%) |
| 26 to 34 Years | 2,284 (74.1%) | 798 (25.9%) |
| 35 to 44 Years | 2,853 (89.5%) | 334 (10.5%) |
| 45 to 54 Years | 2,598 (80.0%) | 648 (20.0%) |
| 55 to 64 Years | 3,428 (86.3%) | 545 (13.7%) |
| 65 to 74 Years | 2,926 (100.0%) | 0 (0.0%) |
| 75 Years and older | 1,725 (92.4%) | 141 (7.6%) |
| Total | 23,833 (87.7%) | 3,334 (12.3%) |
Health Insurance Coverage by Citizenship Status in Upson County
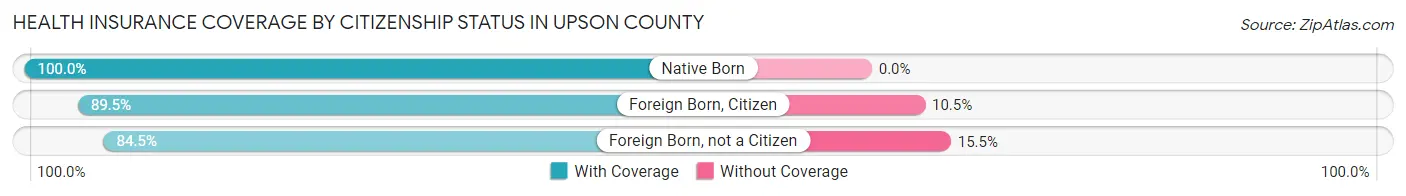
| Citizenship Status | With Coverage | Without Coverage |
| Native Born | 1,647 (100.0%) | 0 (0.0%) |
| Foreign Born, Citizen | 4,528 (89.5%) | 529 (10.5%) |
| Foreign Born, not a Citizen | 1,844 (84.5%) | 339 (15.5%) |
Health Insurance Coverage by Household Income in Upson County
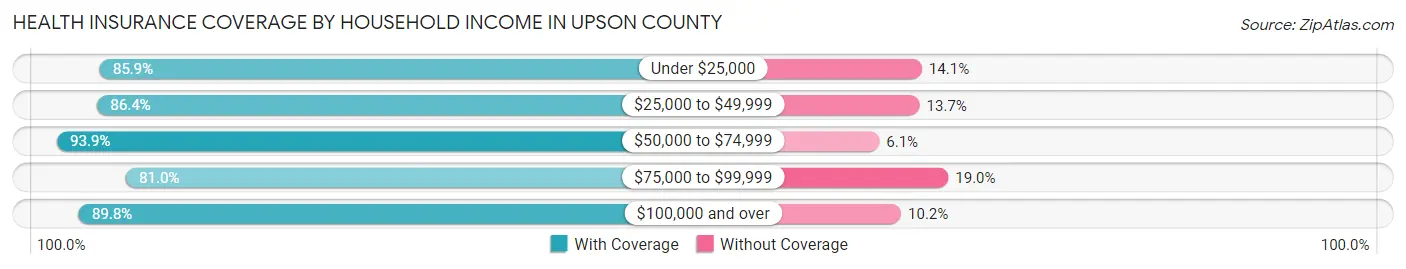
| Household Income | With Coverage | Without Coverage |
| Under $25,000 | 4,968 (85.9%) | 815 (14.1%) |
| $25,000 to $49,999 | 4,663 (86.4%) | 737 (13.7%) |
| $50,000 to $74,999 | 4,325 (93.9%) | 281 (6.1%) |
| $75,000 to $99,999 | 3,008 (81.0%) | 707 (19.0%) |
| $100,000 and over | 6,861 (89.8%) | 778 (10.2%) |
Public vs Private Health Insurance Coverage by Age in Upson County
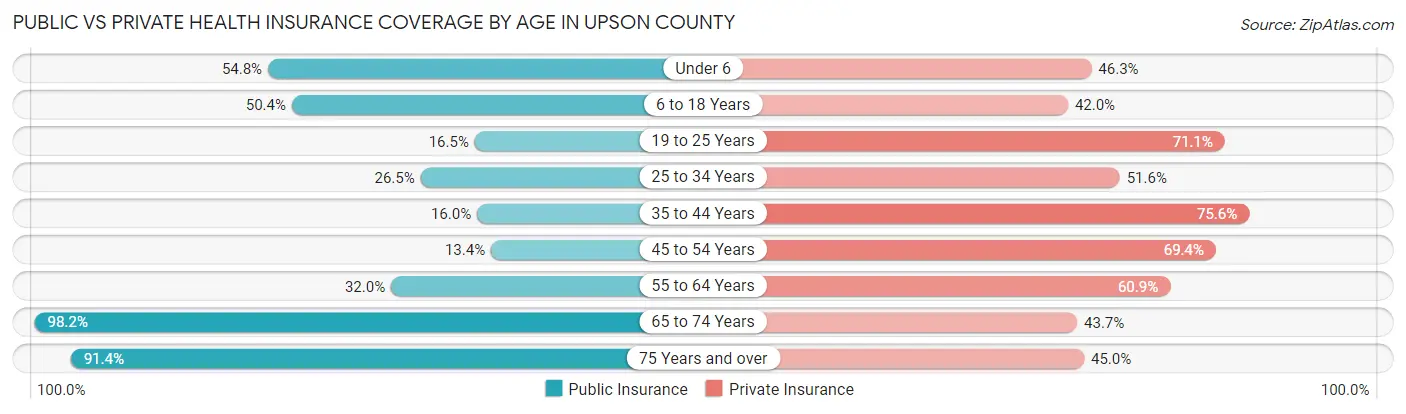
| Age Bracket | Public Insurance | Private Insurance |
| Under 6 | 903 (54.8%) | 763 (46.3%) |
| 6 to 18 Years | 2,549 (50.4%) | 2,123 (42.0%) |
| 19 to 25 Years | 359 (16.5%) | 1,552 (71.1%) |
| 25 to 34 Years | 817 (26.5%) | 1,590 (51.6%) |
| 35 to 44 Years | 511 (16.0%) | 2,409 (75.6%) |
| 45 to 54 Years | 436 (13.4%) | 2,253 (69.4%) |
| 55 to 64 Years | 1,271 (32.0%) | 2,420 (60.9%) |
| 65 to 74 Years | 2,872 (98.2%) | 1,278 (43.7%) |
| 75 Years and over | 1,706 (91.4%) | 839 (45.0%) |
| Total | 11,424 (42.0%) | 15,227 (56.0%) |
Disability Status by Sex by Age in Upson County
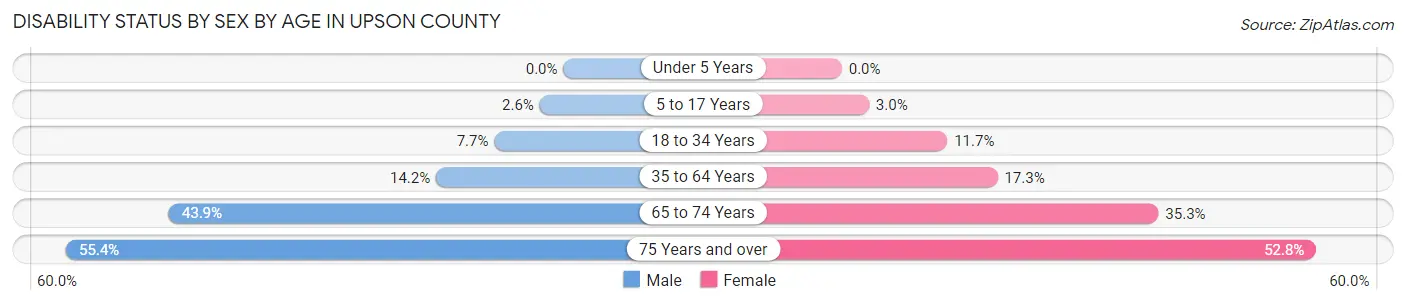
| Age Bracket | Male | Female |
| Under 5 Years | 0 (0.0%) | 0 (0.0%) |
| 5 to 17 Years | 68 (2.6%) | 69 (3.0%) |
| 18 to 34 Years | 205 (7.7%) | 355 (11.7%) |
| 35 to 64 Years | 701 (14.2%) | 947 (17.3%) |
| 65 to 74 Years | 594 (43.9%) | 555 (35.3%) |
| 75 Years and over | 416 (55.4%) | 589 (52.8%) |
Disability Class by Sex by Age in Upson County
Disability Class: Hearing Difficulty
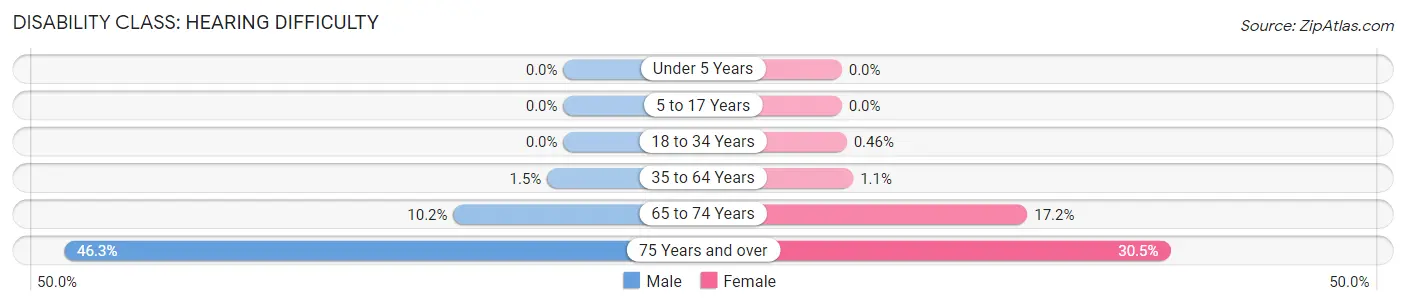
| Age Bracket | Male | Female |
| Under 5 Years | 0 (0.0%) | 0 (0.0%) |
| 5 to 17 Years | 0 (0.0%) | 0 (0.0%) |
| 18 to 34 Years | 0 (0.0%) | 14 (0.5%) |
| 35 to 64 Years | 74 (1.5%) | 58 (1.1%) |
| 65 to 74 Years | 138 (10.2%) | 271 (17.2%) |
| 75 Years and over | 348 (46.3%) | 340 (30.5%) |
Disability Class: Vision Difficulty
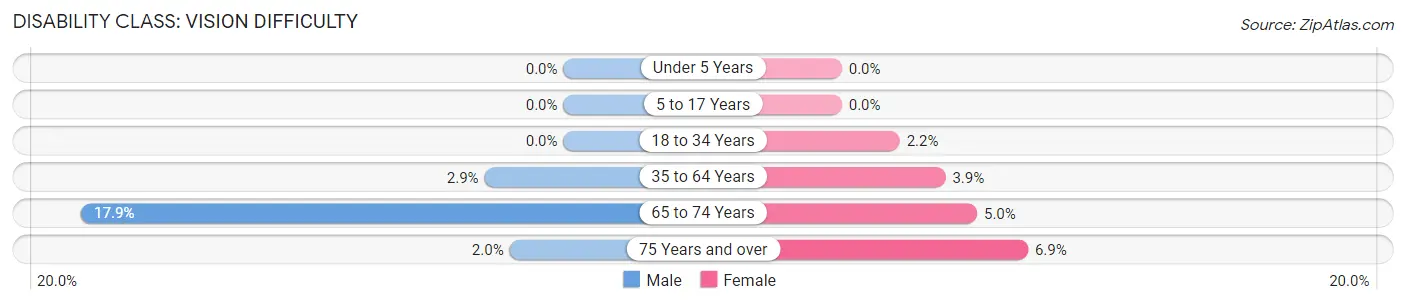
| Age Bracket | Male | Female |
| Under 5 Years | 0 (0.0%) | 0 (0.0%) |
| 5 to 17 Years | 0 (0.0%) | 0 (0.0%) |
| 18 to 34 Years | 0 (0.0%) | 65 (2.1%) |
| 35 to 64 Years | 145 (2.9%) | 210 (3.8%) |
| 65 to 74 Years | 242 (17.9%) | 79 (5.0%) |
| 75 Years and over | 15 (2.0%) | 77 (6.9%) |
Disability Class: Cognitive Difficulty
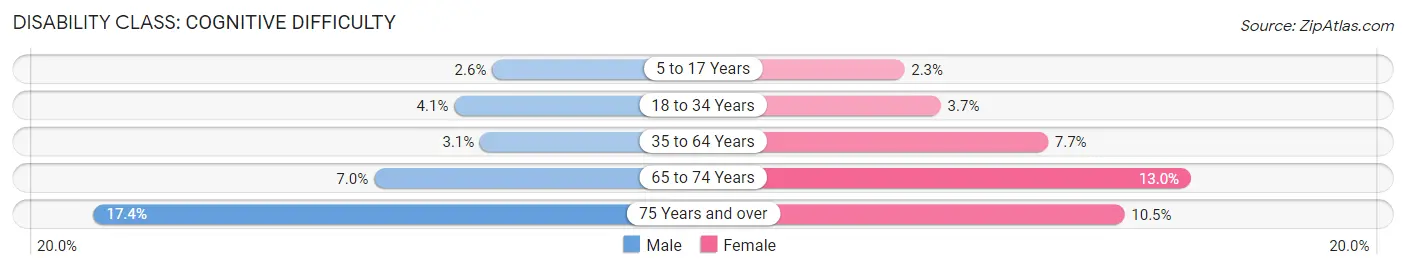
| Age Bracket | Male | Female |
| 5 to 17 Years | 68 (2.6%) | 53 (2.3%) |
| 18 to 34 Years | 108 (4.1%) | 111 (3.7%) |
| 35 to 64 Years | 153 (3.1%) | 418 (7.6%) |
| 65 to 74 Years | 95 (7.0%) | 204 (13.0%) |
| 75 Years and over | 131 (17.4%) | 117 (10.5%) |
Disability Class: Ambulatory Difficulty
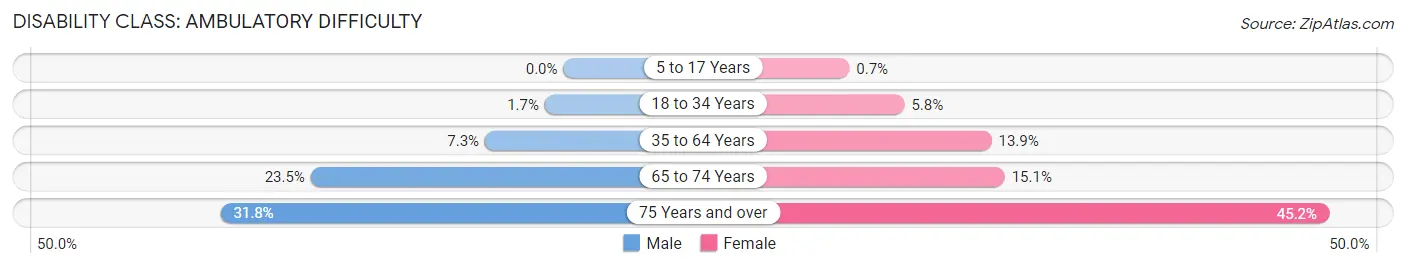
| Age Bracket | Male | Female |
| 5 to 17 Years | 0 (0.0%) | 16 (0.7%) |
| 18 to 34 Years | 46 (1.7%) | 176 (5.8%) |
| 35 to 64 Years | 360 (7.3%) | 759 (13.9%) |
| 65 to 74 Years | 317 (23.4%) | 238 (15.1%) |
| 75 Years and over | 239 (31.8%) | 504 (45.2%) |
Disability Class: Self-Care Difficulty
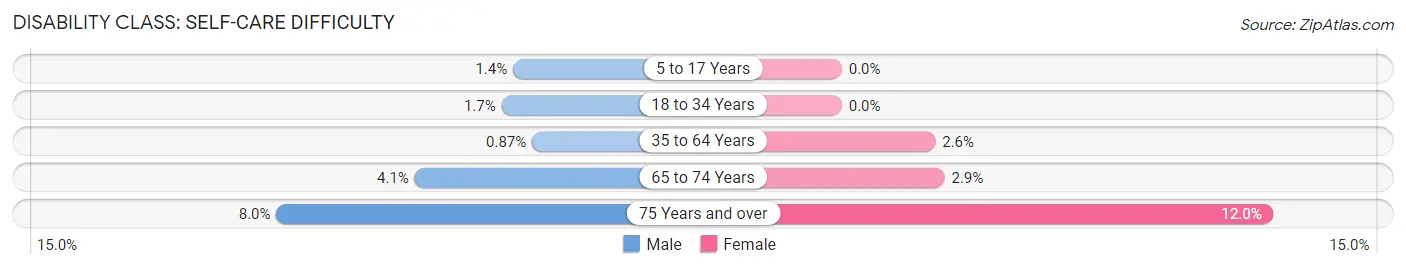
| Age Bracket | Male | Female |
| 5 to 17 Years | 36 (1.4%) | 0 (0.0%) |
| 18 to 34 Years | 46 (1.7%) | 0 (0.0%) |
| 35 to 64 Years | 43 (0.9%) | 142 (2.6%) |
| 65 to 74 Years | 56 (4.1%) | 45 (2.9%) |
| 75 Years and over | 60 (8.0%) | 134 (12.0%) |
Technology Access in Upson County
Computing Device Access in Upson County
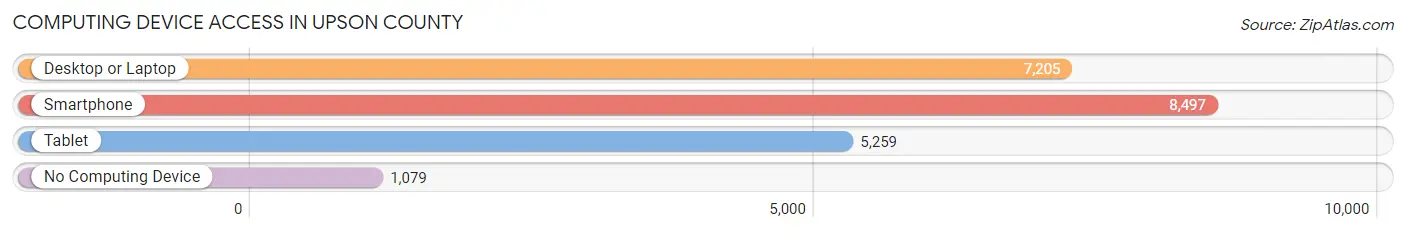
| Device Type | # Households | % Households |
| Desktop or Laptop | 7,205 | 69.2% |
| Smartphone | 8,497 | 81.6% |
| Tablet | 5,259 | 50.5% |
| No Computing Device | 1,079 | 10.4% |
| Total | 10,412 | 100.0% |
Internet Access in Upson County
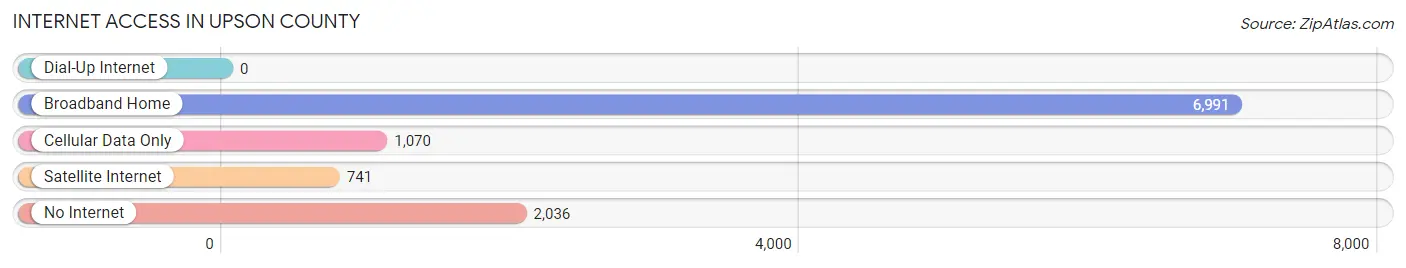
| Internet Type | # Households | % Households |
| Dial-Up Internet | 0 | 0.0% |
| Broadband Home | 6,991 | 67.1% |
| Cellular Data Only | 1,070 | 10.3% |
| Satellite Internet | 741 | 7.1% |
| No Internet | 2,036 | 19.6% |
| Total | 10,412 | 100.0% |
Upson County Summary
Upson County is located in the west-central part of the state of Georgia, in the United States. It is part of the Macon metropolitan statistical area. The county seat is Thomaston, and the county was created in 1824. As of the 2010 census, the population was 27,153.
Geography
Upson County is located in the Piedmont region of Georgia, and is bordered by Lamar County to the north, Pike County to the east, Meriwether County to the south, and Monroe County to the west. The county has a total area of 441 square miles, of which 437 square miles is land and 4.2 square miles is water. The county is drained by the Flint River, which flows through the center of the county. The terrain is generally rolling hills, with some areas of flat land.
Economy
The economy of Upson County is largely based on agriculture and manufacturing. The county is home to several large poultry processing plants, as well as a number of smaller agricultural operations. The county also has a number of manufacturing plants, including a large textile mill and a furniture factory. The county is also home to a number of small businesses, including restaurants, retail stores, and service providers.
Demographics
As of the 2010 census, there were 27,153 people, 10,541 households, and 7,541 families residing in the county. The population density was 61.7 people per square mile. The racial makeup of the county was 68.2% White, 28.3% African American, 0.3% Native American, 0.5% Asian, 0.1% Pacific Islander, 1.2% from other races, and 1.4% from two or more races. Hispanic or Latino of any race were 3.2% of the population.
The median income for a household in the county was $35,945, and the median income for a family was $43,945. The per capita income for the county was $17,845. About 17.2% of families and 21.2% of the population were below the poverty line, including 28.2% of those under age 18 and 16.2% of those age 65 or over.
Conclusion
Upson County is a rural county located in the west-central part of the state of Georgia. It is part of the Macon metropolitan statistical area, and has a population of 27,153 as of the 2010 census. The economy of the county is largely based on agriculture and manufacturing, and the county is home to several large poultry processing plants, as well as a number of smaller agricultural operations and manufacturing plants. The median income for a household in the county was $35,945, and the median income for a family was $43,945. About 17.2% of families and 21.2% of the population were below the poverty line.
Common Questions
What is Per Capita Income in Upson County?
Per Capita income in Upson County is $27,906.
What is the Median Family Income in Upson County?
Median Family Income in Upson County is $61,466.
What is the Median Household income in Upson County?
Median Household Income in Upson County is $48,740.
What is Income or Wage Gap in Upson County?
Income or Wage Gap in Upson County is 41.9%.
Women in Upson County earn 58.1 cents for every dollar earned by a man.
What is Family Income Deficit in Upson County?
Family Income Deficit in Upson County is $10,618.
Families that are below poverty line in Upson County earn $10,618 less on average than the poverty threshold level.
What is Inequality or Gini Index in Upson County?
Inequality or Gini Index in Upson County is 0.49.
What is the Total Population of Upson County?
Total Population of Upson County is 27,638.
What is the Total Male Population of Upson County?
Total Male Population of Upson County is 13,285.
What is the Total Female Population of Upson County?
Total Female Population of Upson County is 14,353.
What is the Ratio of Males per 100 Females in Upson County?
There are 92.56 Males per 100 Females in Upson County.
What is the Ratio of Females per 100 Males in Upson County?
There are 108.04 Females per 100 Males in Upson County.
What is the Median Population Age in Upson County?
Median Population Age in Upson County is 41.5 Years.
What is the Average Family Size in Upson County
Average Family Size in Upson County is 3.2 People.
What is the Average Household Size in Upson County
Average Household Size in Upson County is 2.6 People.
How Large is the Labor Force in Upson County?
There are 11,713 People in the Labor Forcein in Upson County.
What is the Percentage of People in the Labor Force in Upson County?
52.9% of People are in the Labor Force in Upson County.
What is the Unemployment Rate in Upson County?
Unemployment Rate in Upson County is 3.1%.