Twiggs County, GA Map & Demographics
Twiggs County Map
Twiggs County Overview
$32,105
PER CAPITA INCOME
$73,500
AVG FAMILY INCOME
$50,446
AVG HOUSEHOLD INCOME
18.2%
WAGE / INCOME GAP [ % ]
81.8¢/ $1
WAGE / INCOME GAP [ $ ]
0.54
INEQUALITY / GINI INDEX
7,955
TOTAL POPULATION
3,881
MALE POPULATION
4,074
FEMALE POPULATION
95.26
MALES / 100 FEMALES
104.97
FEMALES / 100 MALES
45.9
MEDIAN AGE
3.6
AVG FAMILY SIZE
2.7
AVG HOUSEHOLD SIZE
2,858
LABOR FORCE [ PEOPLE ]
43.3%
PERCENT IN LABOR FORCE
3.4%
UNEMPLOYMENT RATE
Twiggs County Area Codes
Income in Twiggs County
Income Overview in Twiggs County
Per Capita Income in Twiggs County is $32,105, while median incomes of families and households are $73,500 and $50,446 respectively.
| Characteristic | Number | Measure |
| Per Capita Income | 7,955 | $32,105 |
| Median Family Income | 1,796 | $73,500 |
| Mean Family Income | 1,796 | $104,456 |
| Median Household Income | 2,900 | $50,446 |
| Mean Household Income | 2,900 | $76,579 |
| Income Deficit | 1,796 | $0 |
| Wage / Income Gap (%) | 7,955 | 18.18% |
| Wage / Income Gap ($) | 7,955 | 81.82¢ per $1 |
| Gini / Inequality Index | 7,955 | 0.54 |
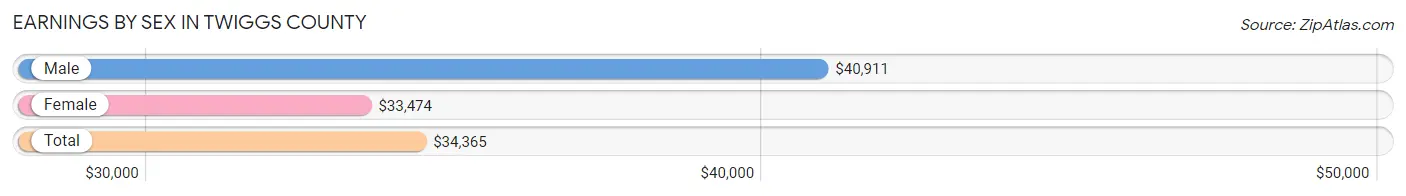
Earnings by Sex in Twiggs County
Average Earnings in Twiggs County are $34,365, $40,911 for men and $33,474 for women, a difference of 18.2%.
| Sex | Number | Average Earnings |
| Male | 1,561 (50.8%) | $40,911 |
| Female | 1,513 (49.2%) | $33,474 |
| Total | 3,074 (100.0%) | $34,365 |
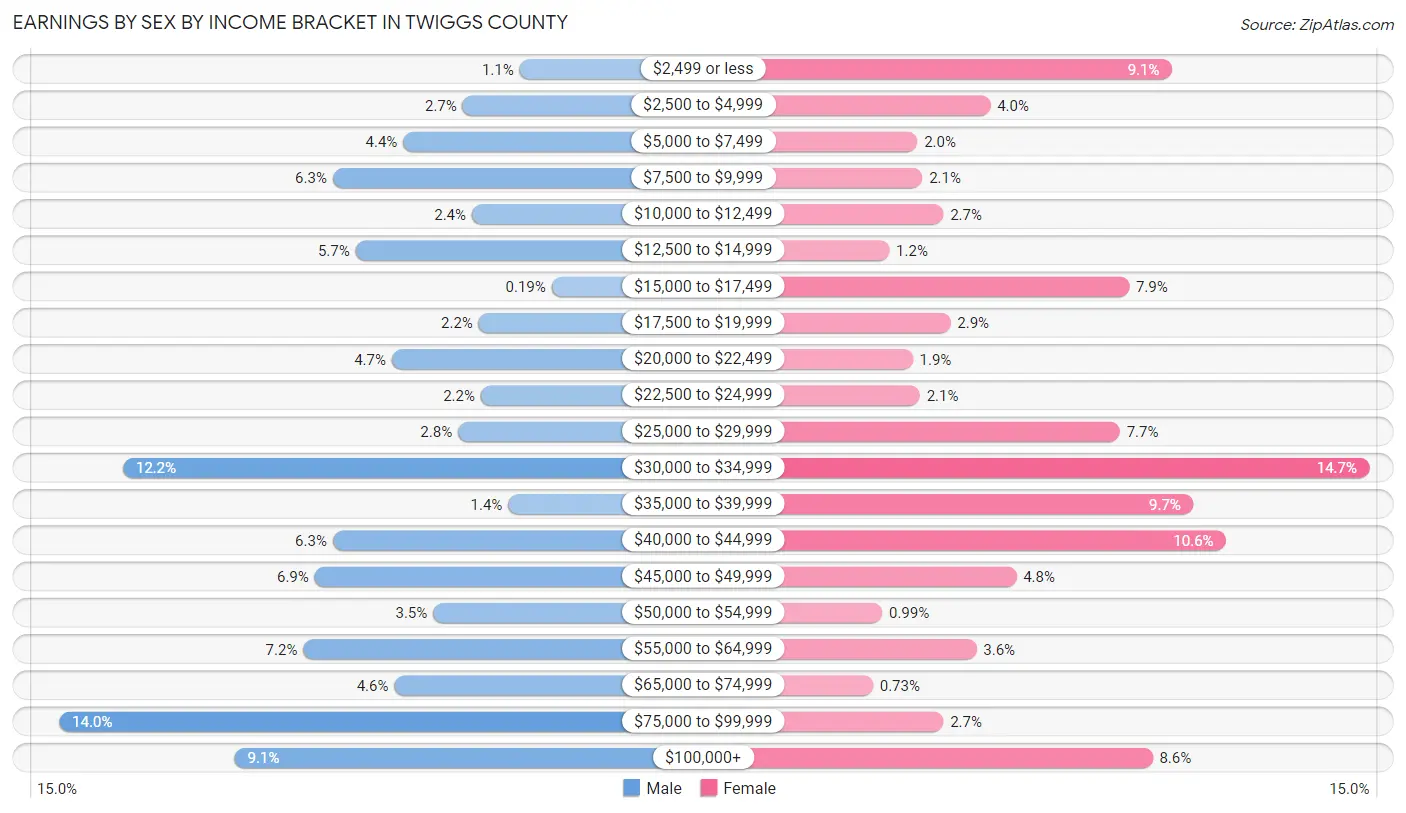
Earnings by Sex by Income Bracket in Twiggs County
The most common earnings brackets in Twiggs County are $75,000 to $99,999 for men (219 | 14.0%) and $30,000 to $34,999 for women (222 | 14.7%).
| Income | Male | Female |
| $2,499 or less | 17 (1.1%) | 138 (9.1%) |
| $2,500 to $4,999 | 42 (2.7%) | 61 (4.0%) |
| $5,000 to $7,499 | 68 (4.4%) | 30 (2.0%) |
| $7,500 to $9,999 | 99 (6.3%) | 32 (2.1%) |
| $10,000 to $12,499 | 38 (2.4%) | 41 (2.7%) |
| $12,500 to $14,999 | 89 (5.7%) | 18 (1.2%) |
| $15,000 to $17,499 | 3 (0.2%) | 120 (7.9%) |
| $17,500 to $19,999 | 35 (2.2%) | 44 (2.9%) |
| $20,000 to $22,499 | 73 (4.7%) | 28 (1.8%) |
| $22,500 to $24,999 | 34 (2.2%) | 31 (2.1%) |
| $25,000 to $29,999 | 44 (2.8%) | 116 (7.7%) |
| $30,000 to $34,999 | 191 (12.2%) | 222 (14.7%) |
| $35,000 to $39,999 | 22 (1.4%) | 147 (9.7%) |
| $40,000 to $44,999 | 99 (6.3%) | 161 (10.6%) |
| $45,000 to $49,999 | 107 (6.9%) | 72 (4.8%) |
| $50,000 to $54,999 | 55 (3.5%) | 15 (1.0%) |
| $55,000 to $64,999 | 112 (7.2%) | 55 (3.6%) |
| $65,000 to $74,999 | 72 (4.6%) | 11 (0.7%) |
| $75,000 to $99,999 | 219 (14.0%) | 41 (2.7%) |
| $100,000+ | 142 (9.1%) | 130 (8.6%) |
| Total | 1,561 (100.0%) | 1,513 (100.0%) |
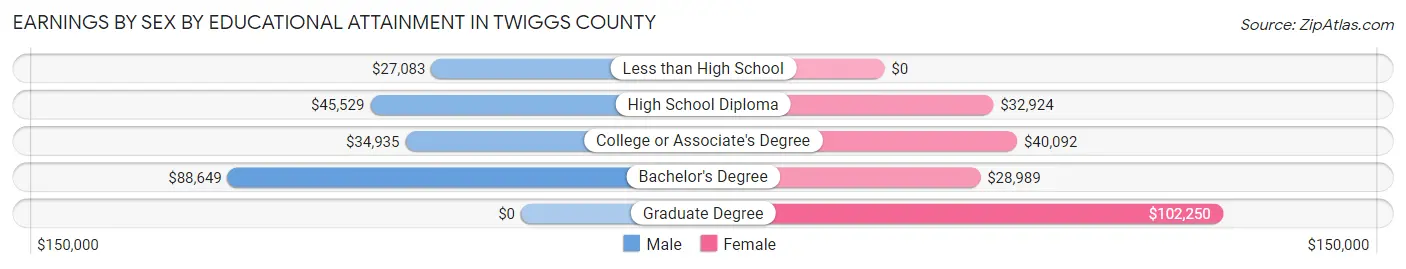
Earnings by Sex by Educational Attainment in Twiggs County
Average earnings in Twiggs County are $42,143 for men and $34,063 for women, a difference of 19.2%. Men with an educational attainment of bachelor's degree enjoy the highest average annual earnings of $88,649, while those with less than high school education earn the least with $27,083. Women with an educational attainment of graduate degree earn the most with the average annual earnings of $102,250, while those with bachelor's degree education have the smallest earnings of $28,989.
| Educational Attainment | Male Income | Female Income |
| Less than High School | $27,083 | $0 |
| High School Diploma | $45,529 | $32,924 |
| College or Associate's Degree | $34,935 | $40,092 |
| Bachelor's Degree | $88,649 | $28,989 |
| Graduate Degree | - | - |
| Total | $42,143 | $34,063 |
Family Income in Twiggs County
Family Income Brackets in Twiggs County
According to the Twiggs County family income data, there are 357 families falling into the $50,000 to $74,999 income range, which is the most common income bracket and makes up 19.9% of all families. Conversely, the $15,000 to $24,999 income bracket is the least frequent group with only 65 families (3.6%) belonging to this category.
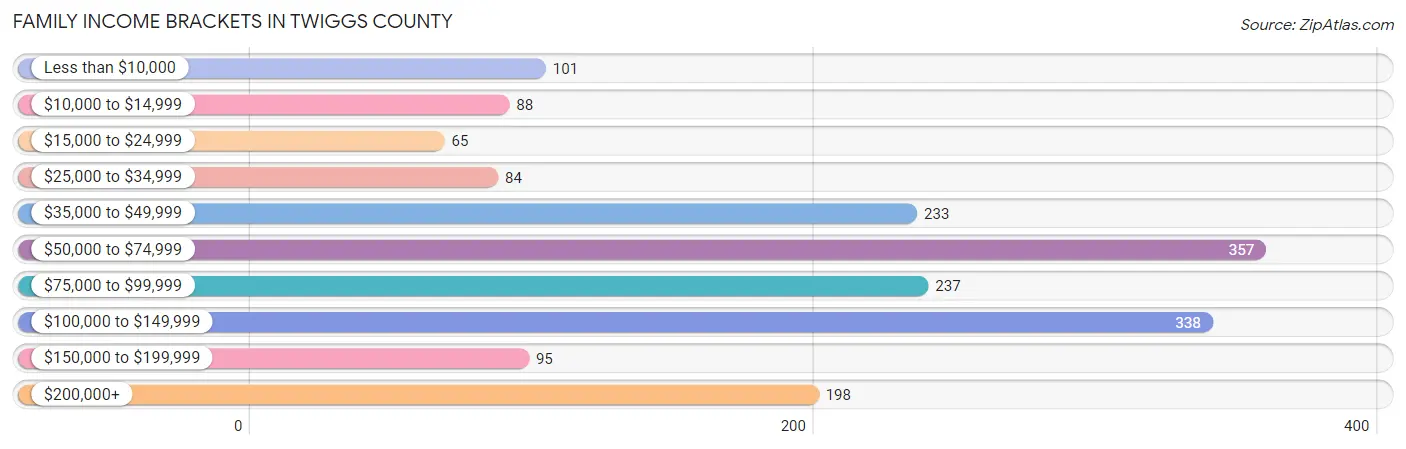
| Income Bracket | # Families | % Families |
| Less than $10,000 | 101 | 5.6% |
| $10,000 to $14,999 | 88 | 4.9% |
| $15,000 to $24,999 | 65 | 3.6% |
| $25,000 to $34,999 | 84 | 4.7% |
| $35,000 to $49,999 | 233 | 13.0% |
| $50,000 to $74,999 | 357 | 19.9% |
| $75,000 to $99,999 | 237 | 13.2% |
| $100,000 to $149,999 | 338 | 18.8% |
| $150,000 to $199,999 | 95 | 5.3% |
| $200,000+ | 198 | 11.0% |
Family Income by Famaliy Size in Twiggs County
4-person families (189 | 10.5%) account for the highest median family income in Twiggs County with $115,990 per family, while 4-person families (189 | 10.5%) have the highest median income of $28,998 per family member.
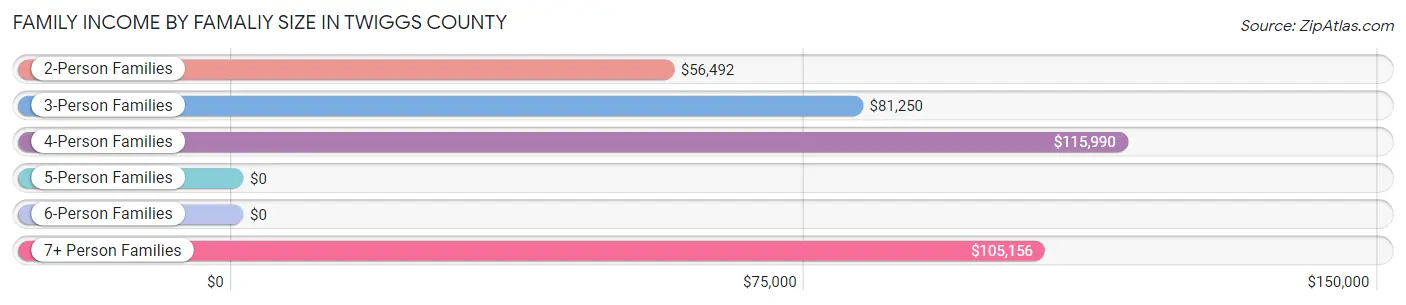
| Income Bracket | # Families | Median Income |
| 2-Person Families | 974 (54.2%) | $56,492 |
| 3-Person Families | 398 (22.2%) | $81,250 |
| 4-Person Families | 189 (10.5%) | $115,990 |
| 5-Person Families | 108 (6.0%) | $0 |
| 6-Person Families | 74 (4.1%) | $0 |
| 7+ Person Families | 53 (2.9%) | $105,156 |
| Total | 1,796 (100.0%) | $73,500 |
Family Income by Number of Earners in Twiggs County
The median family income in Twiggs County is $73,500, with families comprising 3+ earners (143) having the highest median family income of $205,282, while families with no earners (495) have the lowest median family income of $49,638, accounting for 8.0% and 27.6% of families, respectively.
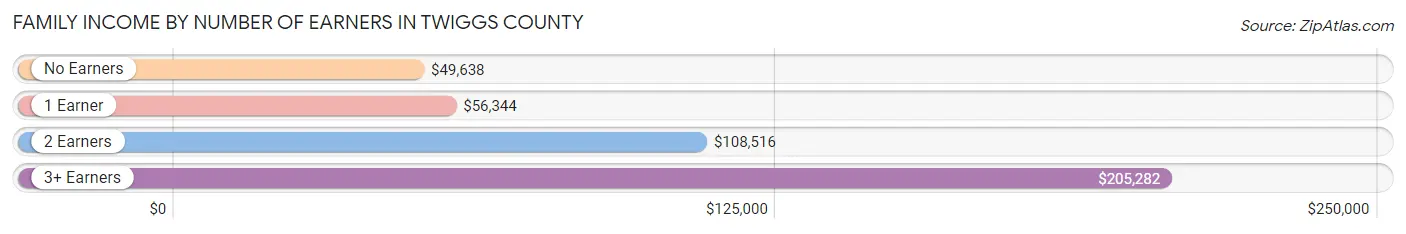
| Number of Earners | # Families | Median Income |
| No Earners | 495 (27.6%) | $49,638 |
| 1 Earner | 568 (31.6%) | $56,344 |
| 2 Earners | 590 (32.9%) | $108,516 |
| 3+ Earners | 143 (8.0%) | $205,282 |
| Total | 1,796 (100.0%) | $73,500 |
Household Income in Twiggs County
Household Income Brackets in Twiggs County
With 473 households falling in the category, the $50,000 to $74,999 income range is the most frequent in Twiggs County, accounting for 16.3% of all households. In contrast, only 139 households (4.8%) fall into the $150,000 to $199,999 income bracket, making it the least populous group.
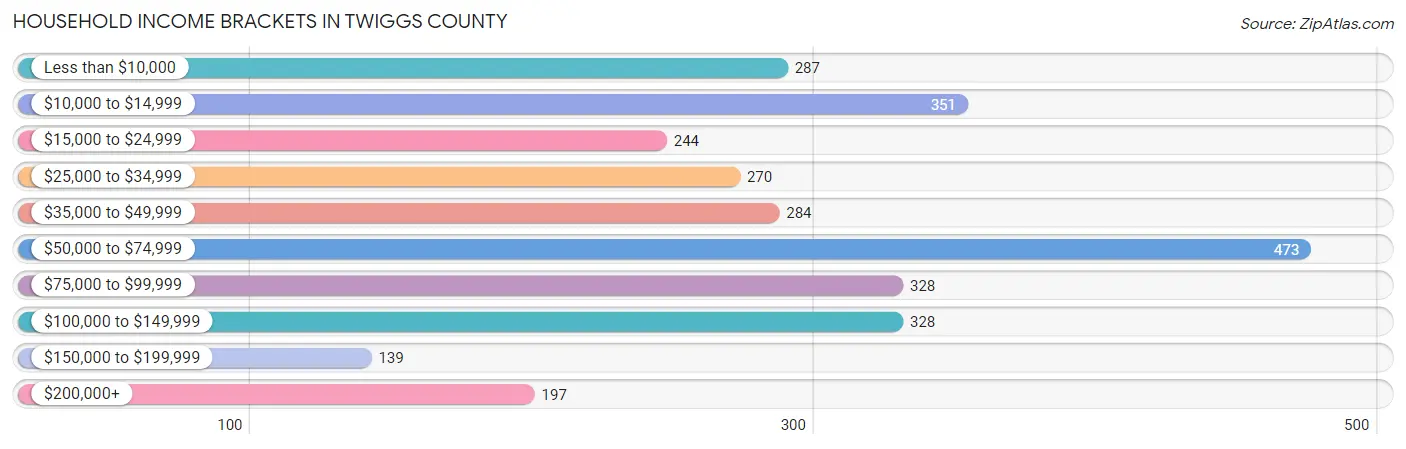
| Income Bracket | # Households | % Households |
| Less than $10,000 | 287 | 9.9% |
| $10,000 to $14,999 | 351 | 12.1% |
| $15,000 to $24,999 | 244 | 8.4% |
| $25,000 to $34,999 | 270 | 9.3% |
| $35,000 to $49,999 | 284 | 9.8% |
| $50,000 to $74,999 | 473 | 16.3% |
| $75,000 to $99,999 | 328 | 11.3% |
| $100,000 to $149,999 | 328 | 11.3% |
| $150,000 to $199,999 | 139 | 4.8% |
| $200,000+ | 197 | 6.8% |
Household Income by Householder Age in Twiggs County
The median household income in Twiggs County is $50,446, with the highest median household income of $61,725 found in the 45 to 64 years age bracket for the primary householder. A total of 1,231 households (42.4%) fall into this category. Meanwhile, the 15 to 24 years age bracket for the primary householder has the lowest median household income of $0, with 7 households (0.2%) in this group.
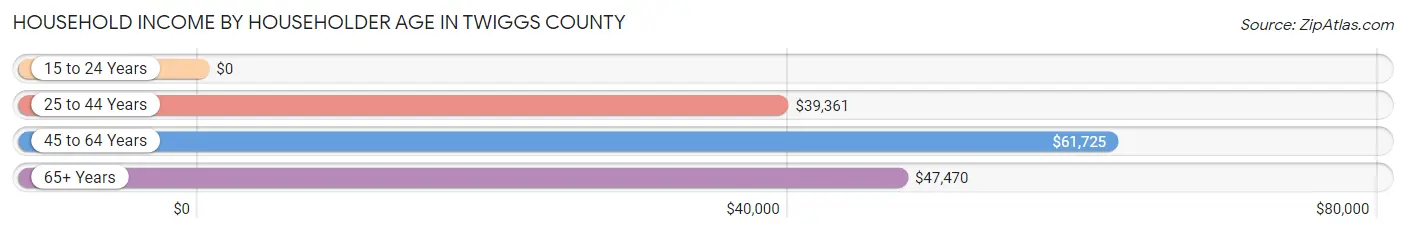
| Income Bracket | # Households | Median Income |
| 15 to 24 Years | 7 (0.2%) | $0 |
| 25 to 44 Years | 489 (16.9%) | $39,361 |
| 45 to 64 Years | 1,231 (42.4%) | $61,725 |
| 65+ Years | 1,173 (40.5%) | $47,470 |
| Total | 2,900 (100.0%) | $50,446 |
Poverty in Twiggs County
Income Below Poverty by Sex and Age in Twiggs County
With 16.1% poverty level for males and 15.2% for females among the residents of Twiggs County, 15 year old males and 55 to 64 year old females are the most vulnerable to poverty, with 10 males (58.8%) and 200 females (28.9%) in their respective age groups living below the poverty level.
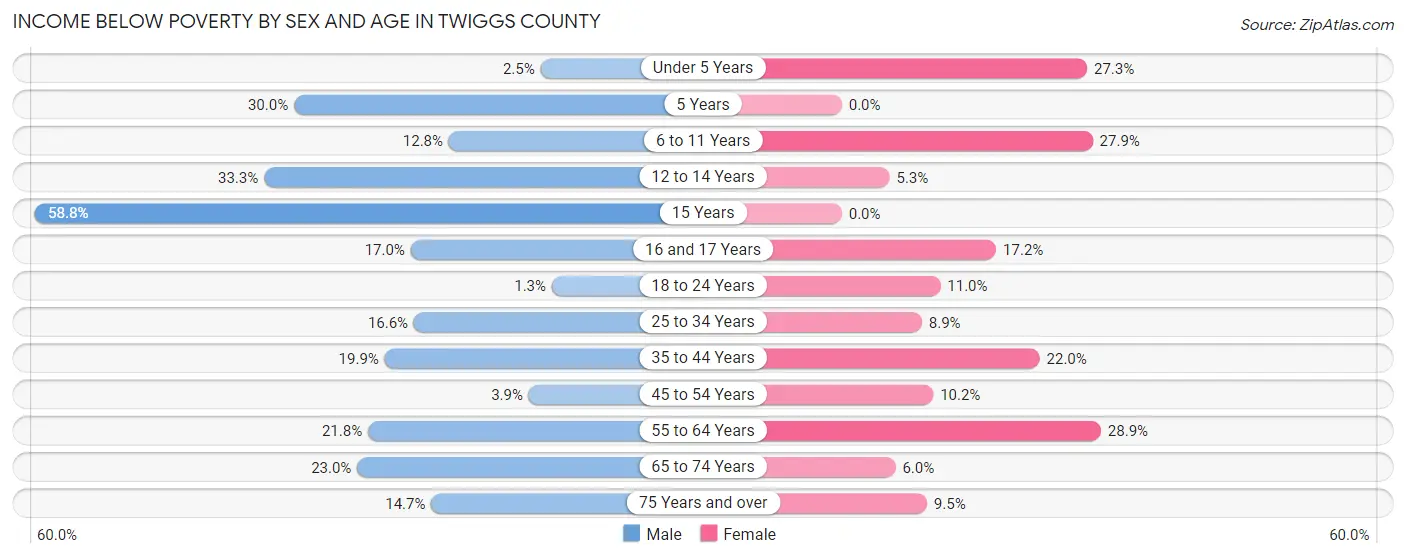
| Age Bracket | Male | Female |
| Under 5 Years | 5 (2.5%) | 59 (27.3%) |
| 5 Years | 12 (30.0%) | 0 (0.0%) |
| 6 to 11 Years | 32 (12.8%) | 76 (27.9%) |
| 12 to 14 Years | 42 (33.3%) | 5 (5.3%) |
| 15 Years | 10 (58.8%) | 0 (0.0%) |
| 16 and 17 Years | 17 (17.0%) | 11 (17.2%) |
| 18 to 24 Years | 3 (1.3%) | 19 (11.0%) |
| 25 to 34 Years | 99 (16.6%) | 58 (8.9%) |
| 35 to 44 Years | 81 (19.9%) | 65 (22.0%) |
| 45 to 54 Years | 15 (3.8%) | 46 (10.2%) |
| 55 to 64 Years | 141 (21.8%) | 200 (28.9%) |
| 65 to 74 Years | 110 (23.0%) | 34 (6.0%) |
| 75 Years and over | 54 (14.7%) | 38 (9.5%) |
| Total | 621 (16.1%) | 611 (15.2%) |
Income Above Poverty by Sex and Age in Twiggs County
According to the poverty statistics in Twiggs County, males aged 18 to 24 years and females aged 5 years are the age groups that are most secure financially, with 98.7% of males and 100.0% of females in these age groups living above the poverty line.
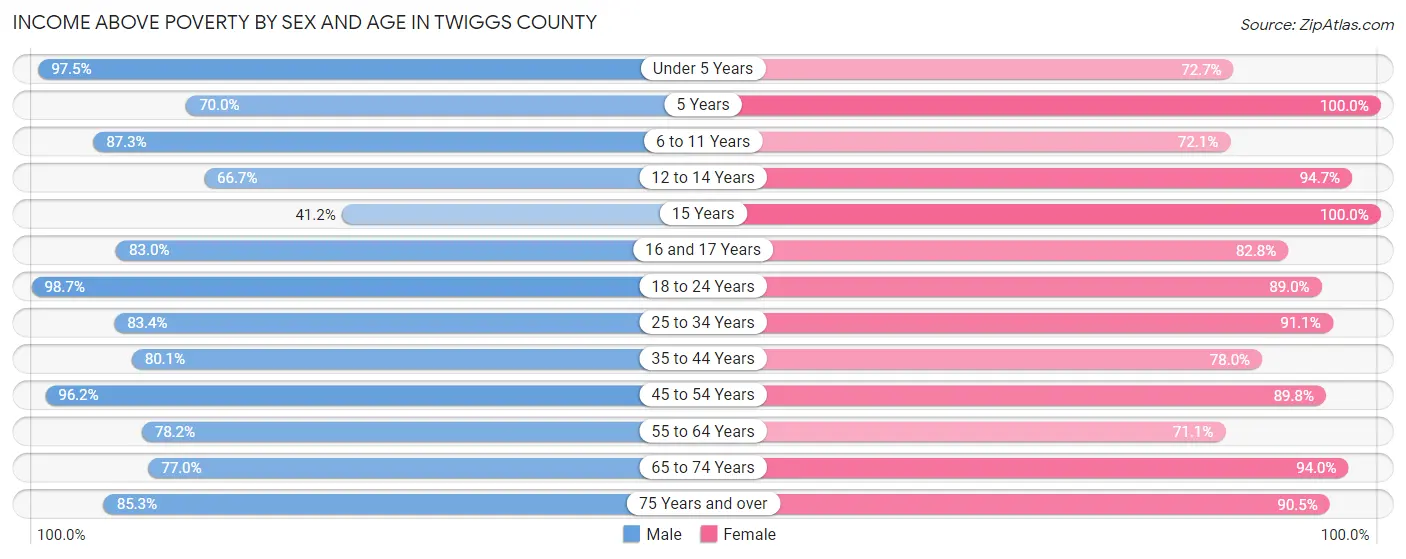
| Age Bracket | Male | Female |
| Under 5 Years | 192 (97.5%) | 157 (72.7%) |
| 5 Years | 28 (70.0%) | 73 (100.0%) |
| 6 to 11 Years | 219 (87.3%) | 196 (72.1%) |
| 12 to 14 Years | 84 (66.7%) | 89 (94.7%) |
| 15 Years | 7 (41.2%) | 68 (100.0%) |
| 16 and 17 Years | 83 (83.0%) | 53 (82.8%) |
| 18 to 24 Years | 231 (98.7%) | 154 (89.0%) |
| 25 to 34 Years | 496 (83.4%) | 592 (91.1%) |
| 35 to 44 Years | 326 (80.1%) | 230 (78.0%) |
| 45 to 54 Years | 375 (96.2%) | 406 (89.8%) |
| 55 to 64 Years | 507 (78.2%) | 493 (71.1%) |
| 65 to 74 Years | 369 (77.0%) | 535 (94.0%) |
| 75 Years and over | 313 (85.3%) | 363 (90.5%) |
| Total | 3,230 (83.9%) | 3,409 (84.8%) |
Income Below Poverty Among Married-Couple Families in Twiggs County
The poverty statistics for married-couple families in Twiggs County show that 10.1% or 133 of the total 1,314 families live below the poverty line. Families with 3 or 4 children have the highest poverty rate of 36.9%, comprising of 24 families. On the other hand, families with 5 or more children have the lowest poverty rate of 0.0%, which includes 0 families.
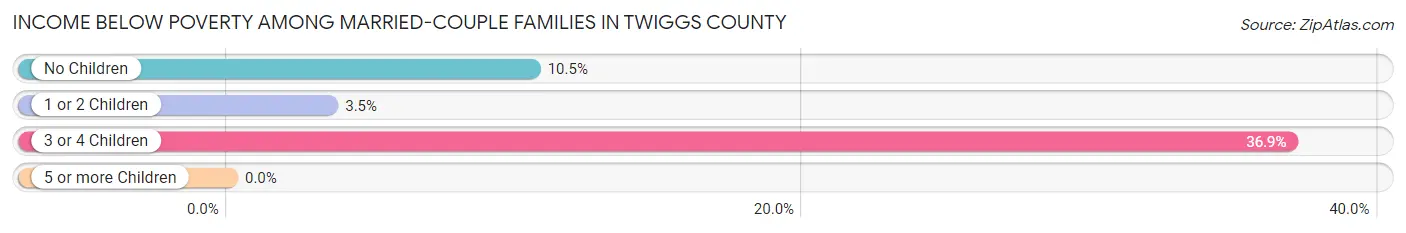
| Children | Above Poverty | Below Poverty |
| No Children | 832 (89.5%) | 98 (10.5%) |
| 1 or 2 Children | 304 (96.5%) | 11 (3.5%) |
| 3 or 4 Children | 41 (63.1%) | 24 (36.9%) |
| 5 or more Children | 4 (100.0%) | 0 (0.0%) |
| Total | 1,181 (89.9%) | 133 (10.1%) |
Income Below Poverty Among Single-Parent Households in Twiggs County
According to the poverty data in Twiggs County, 19.8% or 18 single-father households and 23.5% or 92 single-mother households are living below the poverty line. Among single-father households, those with no children have the highest poverty rate, with 18 households (26.5%) experiencing poverty. Likewise, among single-mother households, those with 3 or 4 children have the highest poverty rate, with 3 households (100.0%) falling below the poverty line.
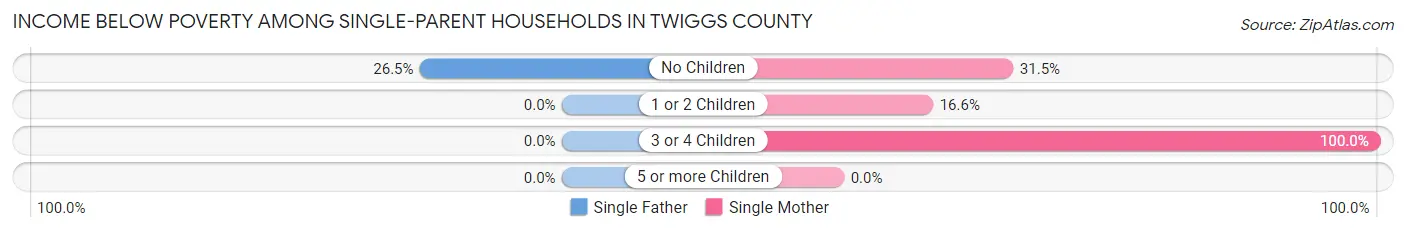
| Children | Single Father | Single Mother |
| No Children | 18 (26.5%) | 52 (31.5%) |
| 1 or 2 Children | 0 (0.0%) | 37 (16.6%) |
| 3 or 4 Children | 0 (0.0%) | 3 (100.0%) |
| 5 or more Children | 0 (0.0%) | 0 (0.0%) |
| Total | 18 (19.8%) | 92 (23.5%) |
Income Below Poverty Among Married-Couple vs Single-Parent Households in Twiggs County
The poverty data for Twiggs County shows that 133 of the married-couple family households (10.1%) and 110 of the single-parent households (22.8%) are living below the poverty level. Within the married-couple family households, those with 3 or 4 children have the highest poverty rate, with 24 households (36.9%) falling below the poverty line. Among the single-parent households, those with 3 or 4 children have the highest poverty rate, with 3 household (100.0%) living below poverty.
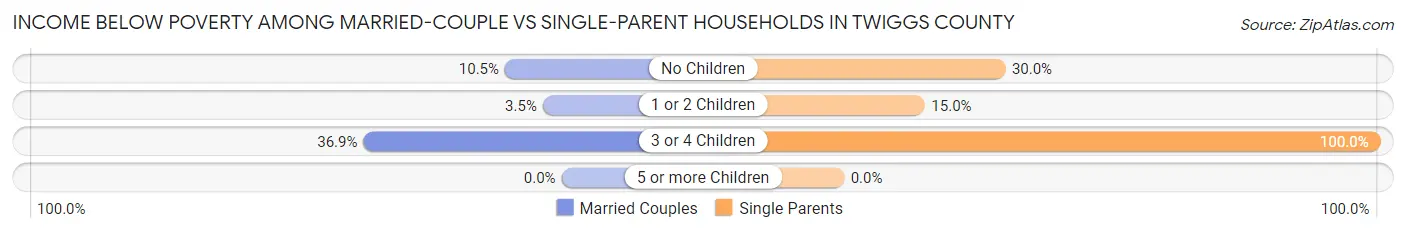
| Children | Married-Couple Families | Single-Parent Households |
| No Children | 98 (10.5%) | 70 (30.0%) |
| 1 or 2 Children | 11 (3.5%) | 37 (15.0%) |
| 3 or 4 Children | 24 (36.9%) | 3 (100.0%) |
| 5 or more Children | 0 (0.0%) | 0 (0.0%) |
| Total | 133 (10.1%) | 110 (22.8%) |
Race in Twiggs County
The most populous races in Twiggs County are White / Caucasian (4,452 | 56.0%), Black / African American (3,305 | 41.5%), and Two or more Races (105 | 1.3%).
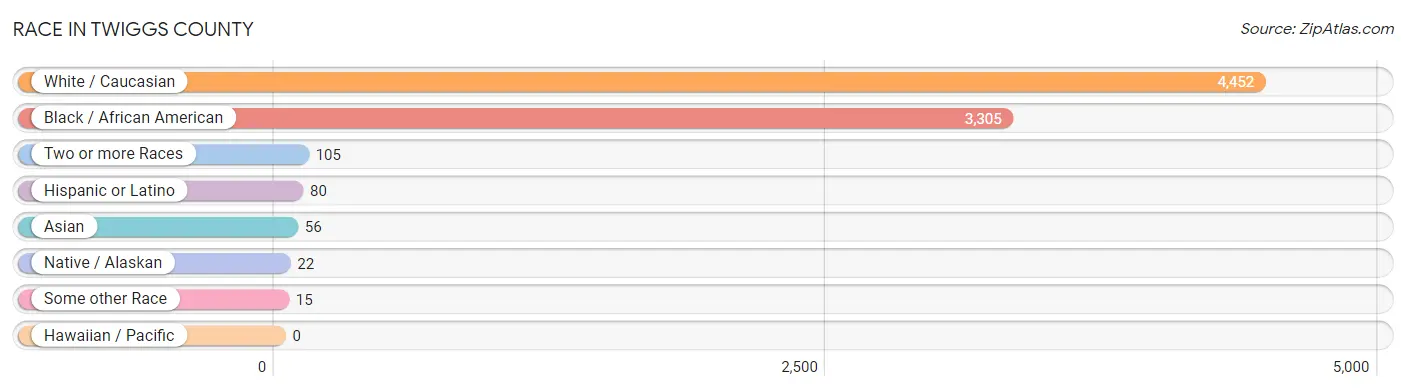
| Race | # Population | % Population |
| Asian | 56 | 0.7% |
| Black / African American | 3,305 | 41.5% |
| Hawaiian / Pacific | 0 | 0.0% |
| Hispanic or Latino | 80 | 1.0% |
| Native / Alaskan | 22 | 0.3% |
| White / Caucasian | 4,452 | 56.0% |
| Two or more Races | 105 | 1.3% |
| Some other Race | 15 | 0.2% |
| Total | 7,955 | 100.0% |
Ancestry in Twiggs County
The most populous ancestries reported in Twiggs County are American (926 | 11.6%), English (649 | 8.2%), German (300 | 3.8%), Irish (202 | 2.5%), and European (90 | 1.1%), together accounting for 27.2% of all Twiggs County residents.
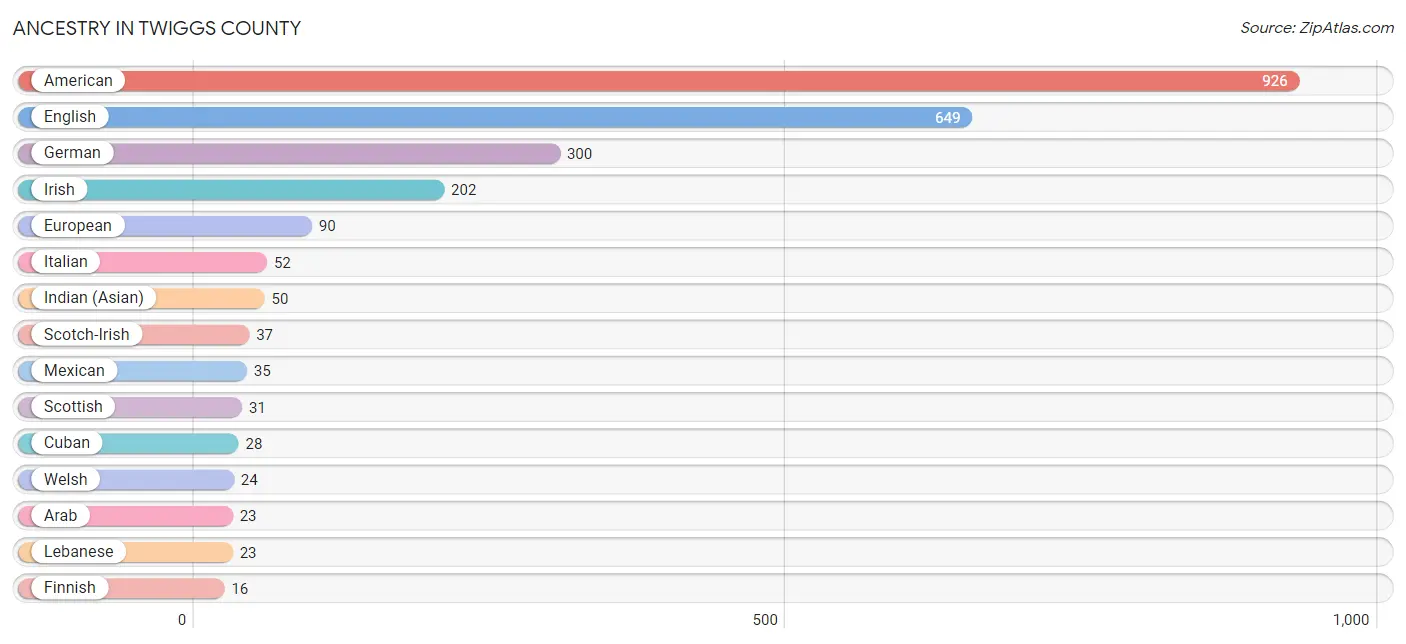
| Ancestry | # Population | % Population |
| African | 6 | 0.1% |
| American | 926 | 11.6% |
| Arab | 23 | 0.3% |
| British | 15 | 0.2% |
| Choctaw | 15 | 0.2% |
| Cuban | 28 | 0.4% |
| Danish | 13 | 0.2% |
| English | 649 | 8.2% |
| European | 90 | 1.1% |
| Finnish | 16 | 0.2% |
| French | 15 | 0.2% |
| German | 300 | 3.8% |
| Haitian | 2 | 0.0% |
| Indian (Asian) | 50 | 0.6% |
| Irish | 202 | 2.5% |
| Italian | 52 | 0.6% |
| Lebanese | 23 | 0.3% |
| Mexican | 35 | 0.4% |
| Pakistani | 3 | 0.0% |
| Scotch-Irish | 37 | 0.5% |
| Scottish | 31 | 0.4% |
| South American | 15 | 0.2% |
| Subsaharan African | 6 | 0.1% |
| Thai | 6 | 0.1% |
| Venezuelan | 10 | 0.1% |
| Welsh | 24 | 0.3% | View All 26 Rows |
Immigrants in Twiggs County
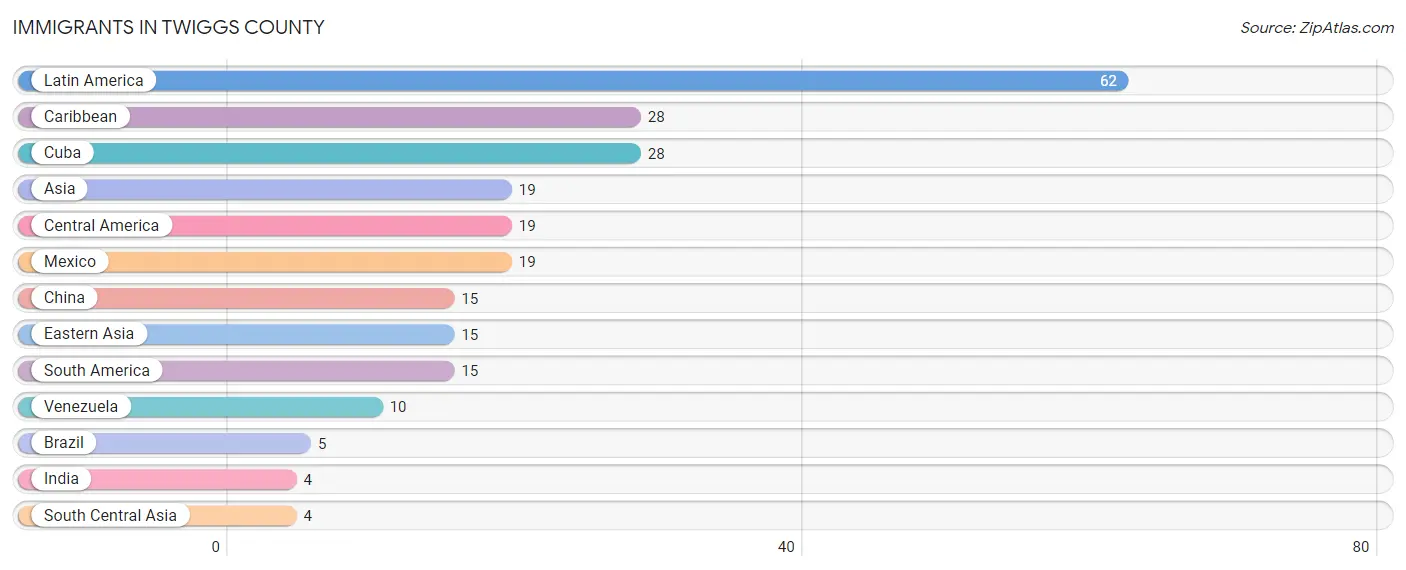
The most numerous immigrant groups reported in Twiggs County came from Latin America (62 | 0.8%), Caribbean (28 | 0.4%), Cuba (28 | 0.4%), Asia (19 | 0.2%), and Central America (19 | 0.2%), together accounting for 2.0% of all Twiggs County residents.
| Immigration Origin | # Population | % Population |
| Asia | 19 | 0.2% |
| Brazil | 5 | 0.1% |
| Caribbean | 28 | 0.4% |
| Central America | 19 | 0.2% |
| China | 15 | 0.2% |
| Cuba | 28 | 0.4% |
| Eastern Asia | 15 | 0.2% |
| India | 4 | 0.1% |
| Latin America | 62 | 0.8% |
| Mexico | 19 | 0.2% |
| South America | 15 | 0.2% |
| South Central Asia | 4 | 0.1% |
| Venezuela | 10 | 0.1% | View All 13 Rows |
Sex and Age in Twiggs County
Sex and Age in Twiggs County
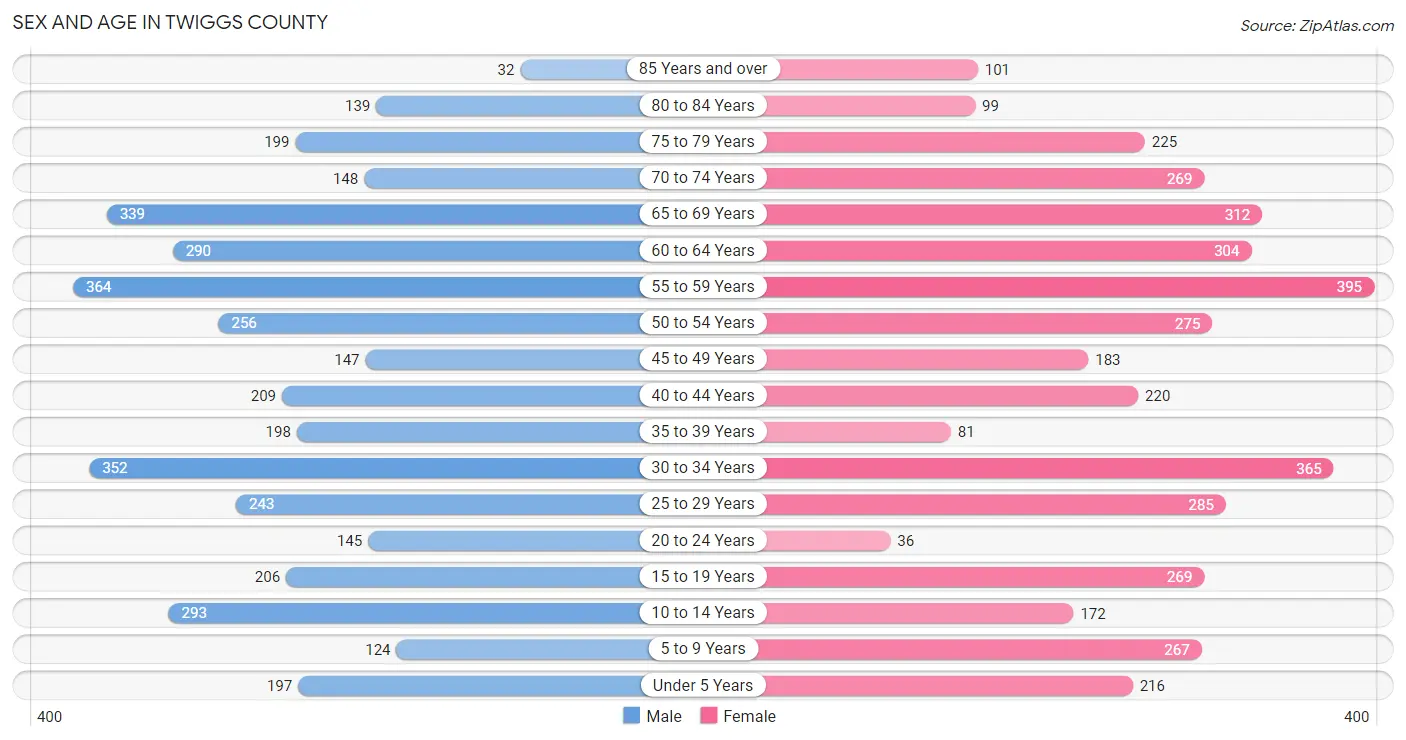
The most populous age groups in Twiggs County are 55 to 59 Years (364 | 9.4%) for men and 55 to 59 Years (395 | 9.7%) for women.
| Age Bracket | Male | Female |
| Under 5 Years | 197 (5.1%) | 216 (5.3%) |
| 5 to 9 Years | 124 (3.2%) | 267 (6.6%) |
| 10 to 14 Years | 293 (7.5%) | 172 (4.2%) |
| 15 to 19 Years | 206 (5.3%) | 269 (6.6%) |
| 20 to 24 Years | 145 (3.7%) | 36 (0.9%) |
| 25 to 29 Years | 243 (6.3%) | 285 (7.0%) |
| 30 to 34 Years | 352 (9.1%) | 365 (9.0%) |
| 35 to 39 Years | 198 (5.1%) | 81 (2.0%) |
| 40 to 44 Years | 209 (5.4%) | 220 (5.4%) |
| 45 to 49 Years | 147 (3.8%) | 183 (4.5%) |
| 50 to 54 Years | 256 (6.6%) | 275 (6.8%) |
| 55 to 59 Years | 364 (9.4%) | 395 (9.7%) |
| 60 to 64 Years | 290 (7.5%) | 304 (7.5%) |
| 65 to 69 Years | 339 (8.7%) | 312 (7.7%) |
| 70 to 74 Years | 148 (3.8%) | 269 (6.6%) |
| 75 to 79 Years | 199 (5.1%) | 225 (5.5%) |
| 80 to 84 Years | 139 (3.6%) | 99 (2.4%) |
| 85 Years and over | 32 (0.8%) | 101 (2.5%) |
| Total | 3,881 (100.0%) | 4,074 (100.0%) |
Families and Households in Twiggs County
Median Family Size in Twiggs County
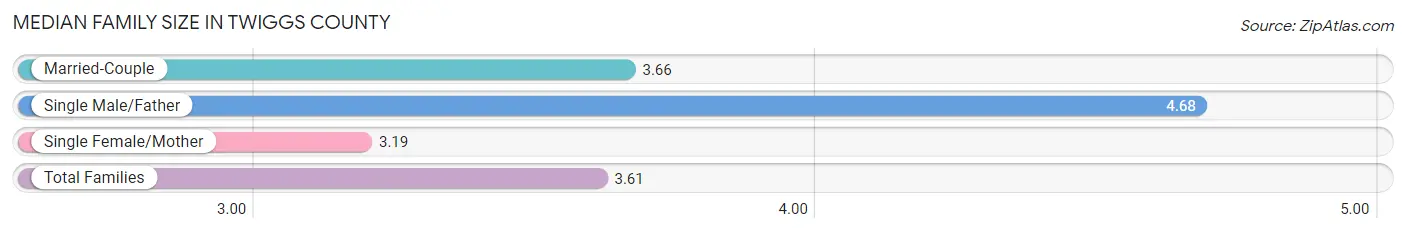
The median family size in Twiggs County is 3.61 persons per family, with single male/father families (91 | 5.1%) accounting for the largest median family size of 4.68 persons per family. On the other hand, single female/mother families (391 | 21.8%) represent the smallest median family size with 3.19 persons per family.
| Family Type | # Families | Family Size |
| Married-Couple | 1,314 (73.2%) | 3.66 |
| Single Male/Father | 91 (5.1%) | 4.68 |
| Single Female/Mother | 391 (21.8%) | 3.19 |
| Total Families | 1,796 (100.0%) | 3.61 |
Median Household Size in Twiggs County
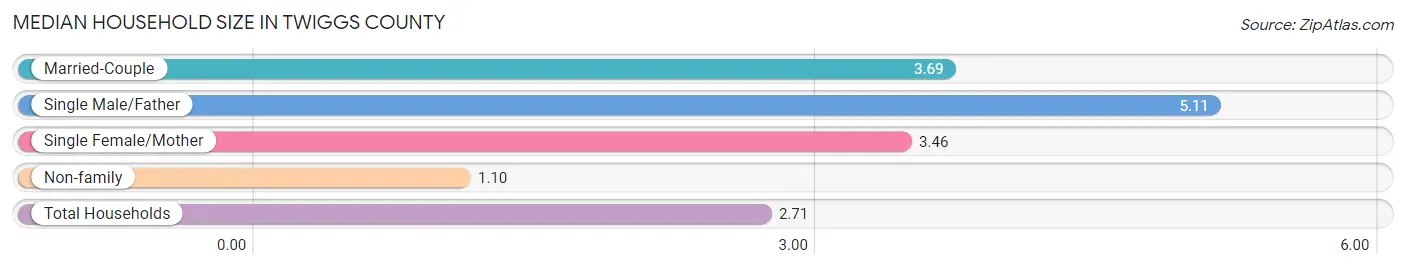
The median household size in Twiggs County is 2.71 persons per household, with single male/father households (91 | 3.1%) accounting for the largest median household size of 5.11 persons per household. non-family households (1,104 | 38.1%) represent the smallest median household size with 1.10 persons per household.
| Household Type | # Households | Household Size |
| Married-Couple | 1,314 (45.3%) | 3.69 |
| Single Male/Father | 91 (3.1%) | 5.11 |
| Single Female/Mother | 391 (13.5%) | 3.46 |
| Non-family | 1,104 (38.1%) | 1.10 |
| Total Households | 2,900 (100.0%) | 2.71 |
Household Size by Marriage Status in Twiggs County
Out of a total of 2,900 households in Twiggs County, 1,796 (61.9%) are family households, while 1,104 (38.1%) are nonfamily households. The most numerous type of family households are 2-person households, comprising 928, and the most common type of nonfamily households are 1-person households, comprising 1,027.
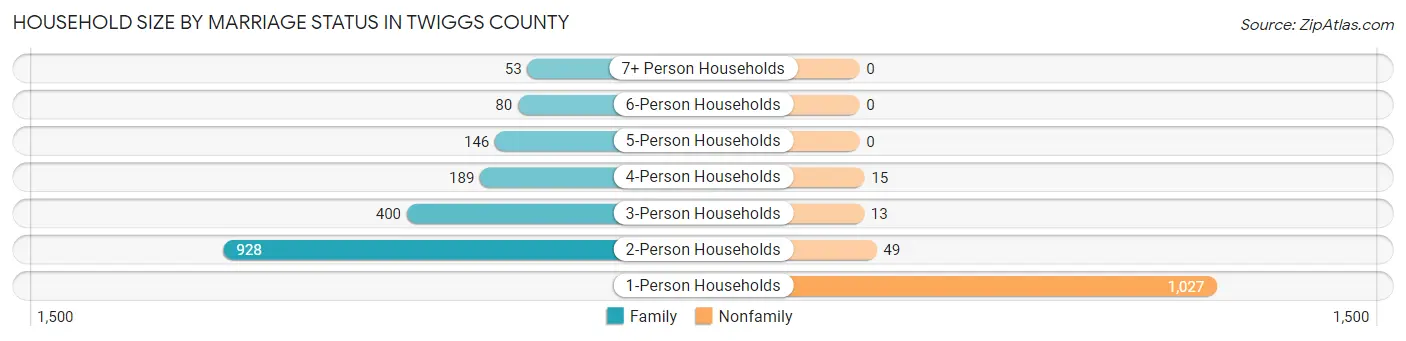
| Household Size | Family Households | Nonfamily Households |
| 1-Person Households | - | 1,027 (35.4%) |
| 2-Person Households | 928 (32.0%) | 49 (1.7%) |
| 3-Person Households | 400 (13.8%) | 13 (0.4%) |
| 4-Person Households | 189 (6.5%) | 15 (0.5%) |
| 5-Person Households | 146 (5.0%) | 0 (0.0%) |
| 6-Person Households | 80 (2.8%) | 0 (0.0%) |
| 7+ Person Households | 53 (1.8%) | 0 (0.0%) |
| Total | 1,796 (61.9%) | 1,104 (38.1%) |
Female Fertility in Twiggs County
Fertility by Age in Twiggs County
Average fertility rate in Twiggs County is 52.0 births per 1,000 women. Women in the age bracket of 15 to 19 years have the highest fertility rate with 223.0 births per 1,000 women. Women in the age bracket of 15 to 19 years acount for 80.0% of all women with births.
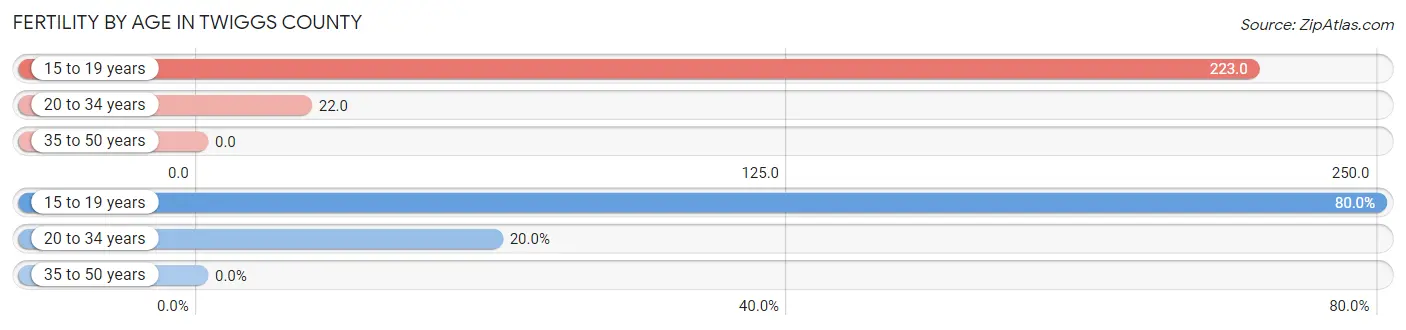
| Age Bracket | Women with Births | Births / 1,000 Women |
| 15 to 19 years | 60 (80.0%) | 223.0 |
| 20 to 34 years | 15 (20.0%) | 22.0 |
| 35 to 50 years | 0 (0.0%) | 0.0 |
| Total | 75 (100.0%) | 52.0 |
Fertility by Age by Marriage Status in Twiggs County
20.0% of women with births (75) in Twiggs County are married. The highest percentage of unmarried women with births falls into 15 to 19 years age bracket with 100.0% of them unmarried at the time of birth, while the lowest percentage of unmarried women with births belong to 20 to 34 years age bracket with 0.0% of them unmarried.
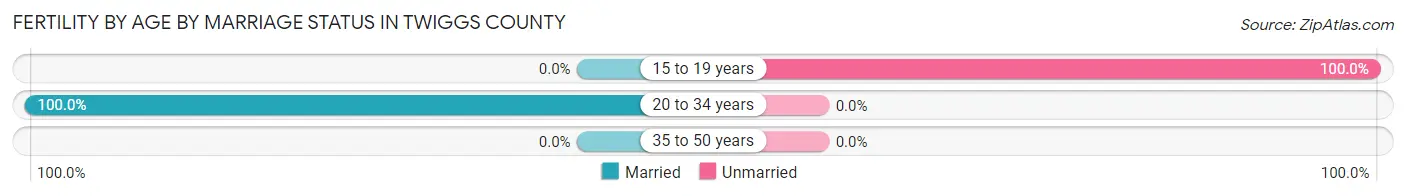
| Age Bracket | Married | Unmarried |
| 15 to 19 years | 0 (0.0%) | 60 (100.0%) |
| 20 to 34 years | 15 (100.0%) | 0 (0.0%) |
| 35 to 50 years | 0 (0.0%) | 0 (0.0%) |
| Total | 15 (20.0%) | 60 (80.0%) |
Fertility by Education in Twiggs County
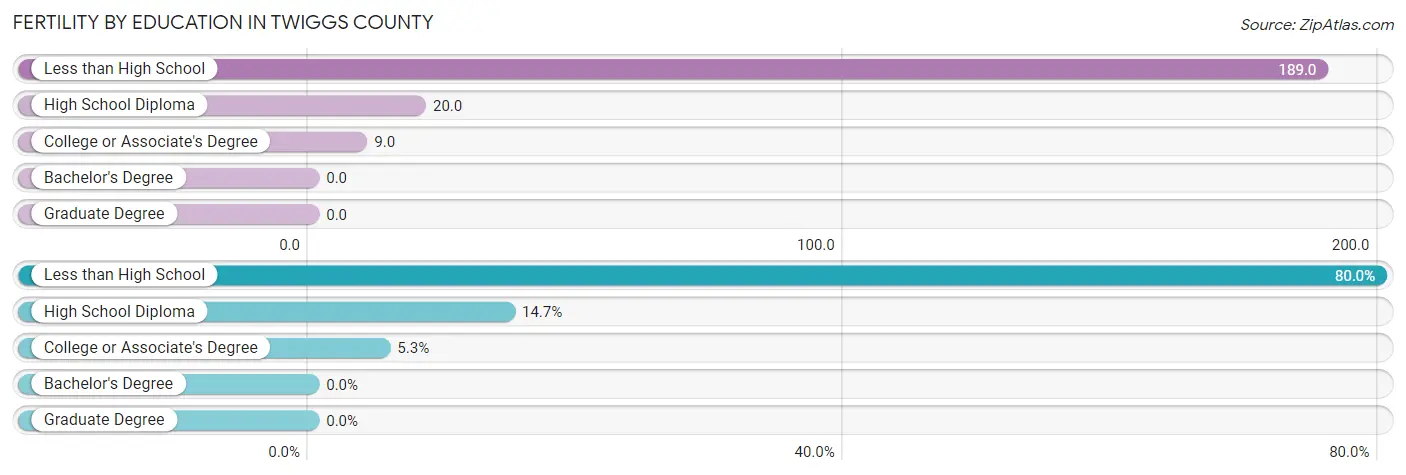
| Educational Attainment | Women with Births | Births / 1,000 Women |
| Less than High School | 60 (80.0%) | 189.0 |
| High School Diploma | 11 (14.7%) | 20.0 |
| College or Associate's Degree | 4 (5.3%) | 9.0 |
| Bachelor's Degree | 0 (0.0%) | 0.0 |
| Graduate Degree | 0 (0.0%) | 0.0 |
| Total | 75 (100.0%) | 52.0 |
Fertility by Education by Marriage Status in Twiggs County
80.0% of women with births in Twiggs County are unmarried. Women with the educational attainment of high school diploma are most likely to be married with 100.0% of them married at childbirth, while women with the educational attainment of less than high school are least likely to be married with 100.0% of them unmarried at childbirth.
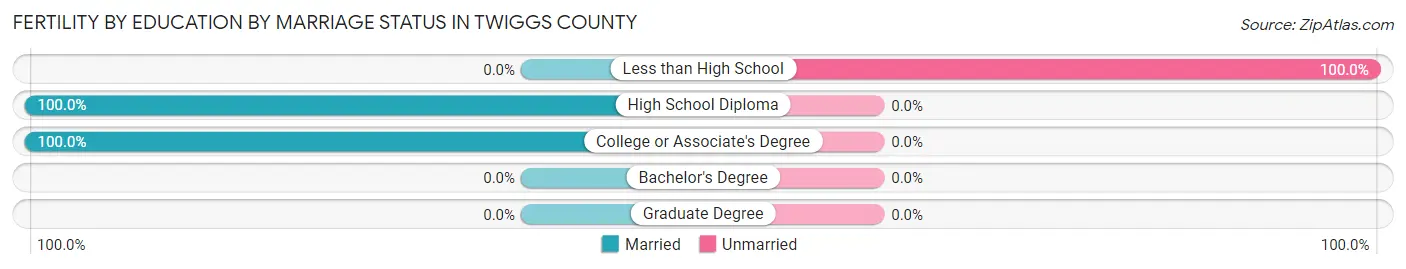
| Educational Attainment | Married | Unmarried |
| Less than High School | 0 (0.0%) | 60 (100.0%) |
| High School Diploma | 11 (100.0%) | 0 (0.0%) |
| College or Associate's Degree | 4 (100.0%) | 0 (0.0%) |
| Bachelor's Degree | 0 (0.0%) | 0 (0.0%) |
| Graduate Degree | 0 (0.0%) | 0 (0.0%) |
| Total | 15 (20.0%) | 60 (80.0%) |
Employment Characteristics in Twiggs County
Employment by Class of Employer in Twiggs County
Among the 2,727 employed individuals in Twiggs County, private company employees (1,689 | 61.9%), federal government employees (297 | 10.9%), and local government employees (232 | 8.5%) make up the most common classes of employment.
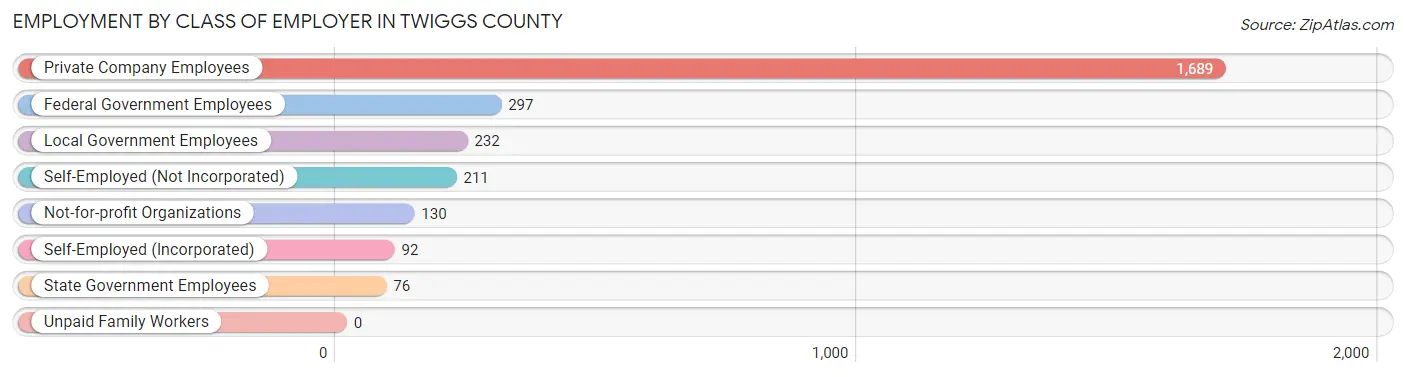
| Employer Class | # Employees | % Employees |
| Private Company Employees | 1,689 | 61.9% |
| Self-Employed (Incorporated) | 92 | 3.4% |
| Self-Employed (Not Incorporated) | 211 | 7.7% |
| Not-for-profit Organizations | 130 | 4.8% |
| Local Government Employees | 232 | 8.5% |
| State Government Employees | 76 | 2.8% |
| Federal Government Employees | 297 | 10.9% |
| Unpaid Family Workers | 0 | 0.0% |
| Total | 2,727 | 100.0% |
Employment Status by Age in Twiggs County
According to the labor force statistics for Twiggs County, out of the total population over 16 years of age (6,601), 43.3% or 2,858 individuals are in the labor force, with 3.4% or 97 of them unemployed. The age group with the highest labor force participation rate is 35 to 44 years, with 87.4% or 619 individuals in the labor force. Within the labor force, the 60 to 64 years age range has the highest percentage of unemployed individuals, with 10.4% or 12 of them being unemployed.
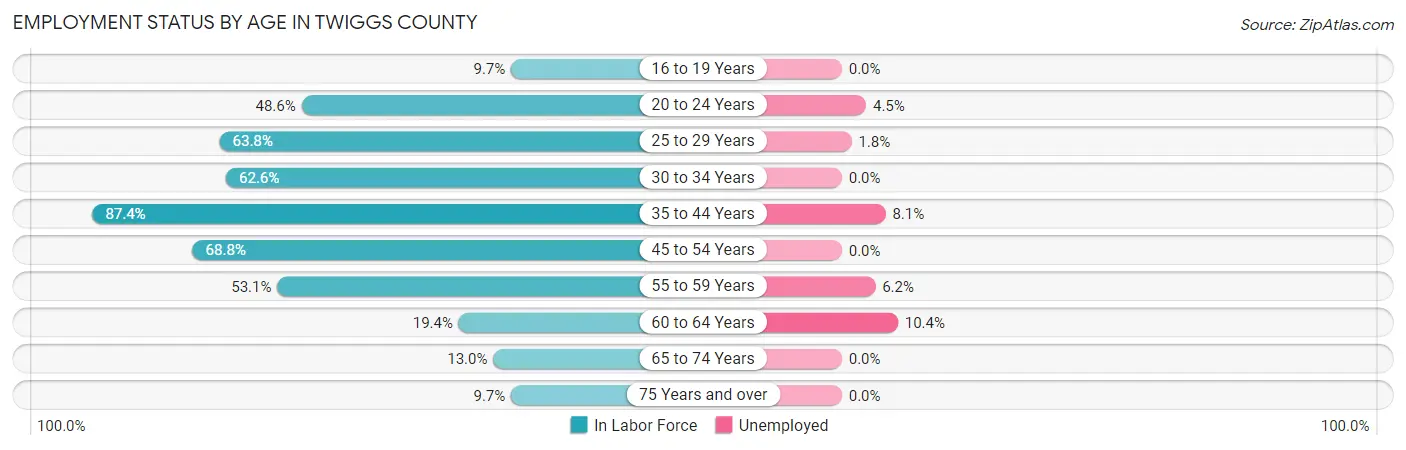
| Age Bracket | In Labor Force | Unemployed |
| 16 to 19 Years | 38 (9.7%) | 0 (0.0%) |
| 20 to 24 Years | 88 (48.6%) | 4 (4.5%) |
| 25 to 29 Years | 337 (63.8%) | 6 (1.8%) |
| 30 to 34 Years | 449 (62.6%) | 0 (0.0%) |
| 35 to 44 Years | 619 (87.4%) | 50 (8.1%) |
| 45 to 54 Years | 592 (68.8%) | 0 (0.0%) |
| 55 to 59 Years | 403 (53.1%) | 25 (6.2%) |
| 60 to 64 Years | 115 (19.4%) | 12 (10.4%) |
| 65 to 74 Years | 139 (13.0%) | 0 (0.0%) |
| 75 Years and over | 77 (9.7%) | 0 (0.0%) |
| Total | 2,858 (43.3%) | 97 (3.4%) |
Employment Status by Educational Attainment in Twiggs County
According to labor force statistics for Twiggs County, 60.4% of individuals (2,517) out of the total population between 25 and 64 years of age (4,167) are in the labor force, with 3.7% or 93 of them being unemployed. The group with the highest labor force participation rate are those with the educational attainment of bachelor's degree or higher, with 81.8% or 378 individuals in the labor force. Within the labor force, individuals with less than high school education have the highest percentage of unemployment, with 16.8% or 50 of them being unemployed.
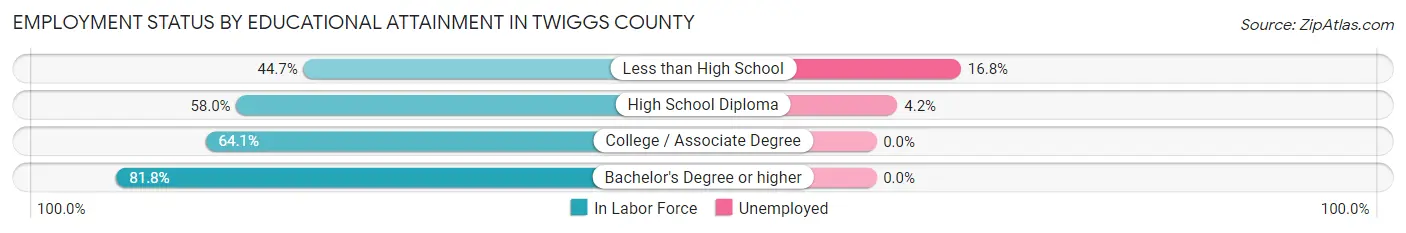
| Educational Attainment | In Labor Force | Unemployed |
| Less than High School | 297 (44.7%) | 112 (16.8%) |
| High School Diploma | 1,028 (58.0%) | 74 (4.2%) |
| College / Associate Degree | 813 (64.1%) | 0 (0.0%) |
| Bachelor's Degree or higher | 378 (81.8%) | 0 (0.0%) |
| Total | 2,517 (60.4%) | 154 (3.7%) |
Employment Occupations by Sex in Twiggs County
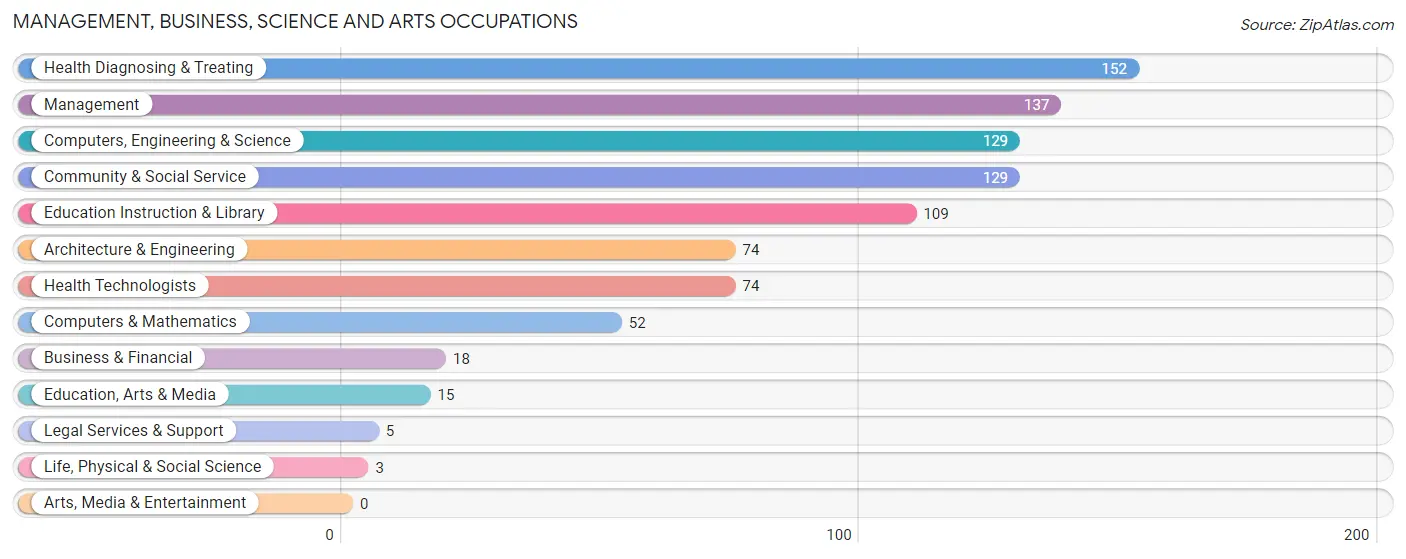
Management, Business, Science and Arts Occupations
The most common Management, Business, Science and Arts occupations in Twiggs County are Health Diagnosing & Treating (152 | 5.5%), Management (137 | 5.0%), Computers, Engineering & Science (129 | 4.7%), Community & Social Service (129 | 4.7%), and Education Instruction & Library (109 | 4.0%).
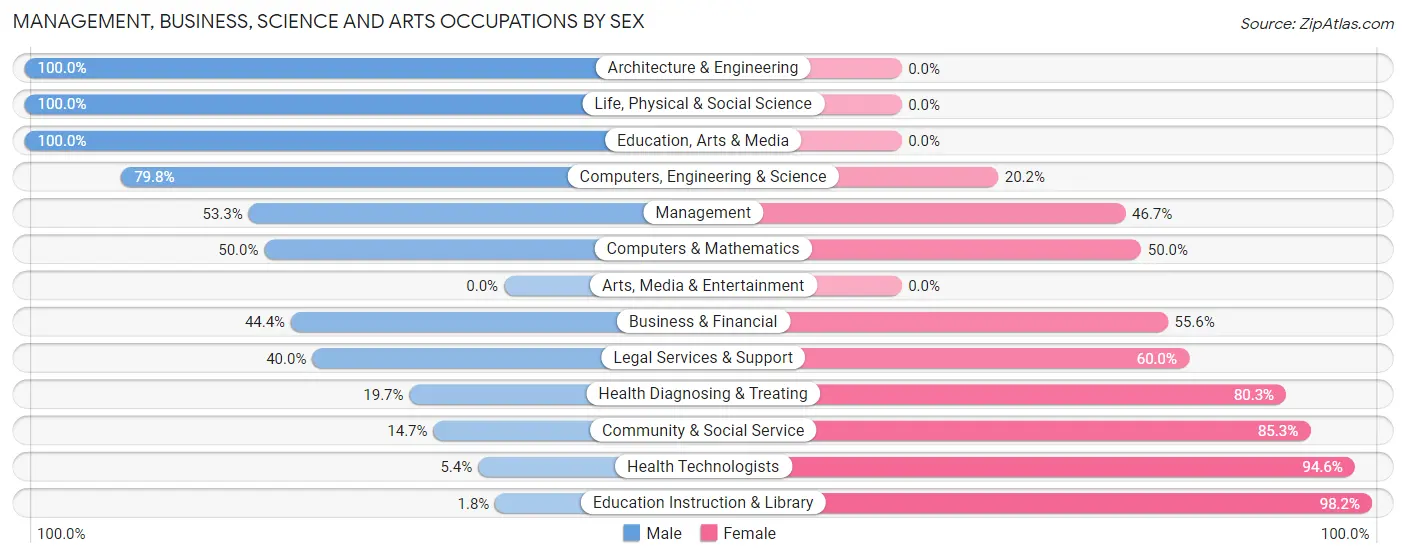
Management, Business, Science and Arts Occupations by Sex
Within the Management, Business, Science and Arts occupations in Twiggs County, the most male-oriented occupations are Architecture & Engineering (100.0%), Life, Physical & Social Science (100.0%), and Education, Arts & Media (100.0%), while the most female-oriented occupations are Education Instruction & Library (98.2%), Health Technologists (94.6%), and Community & Social Service (85.3%).
| Occupation | Male | Female |
| Management | 73 (53.3%) | 64 (46.7%) |
| Business & Financial | 8 (44.4%) | 10 (55.6%) |
| Computers, Engineering & Science | 103 (79.8%) | 26 (20.2%) |
| Computers & Mathematics | 26 (50.0%) | 26 (50.0%) |
| Architecture & Engineering | 74 (100.0%) | 0 (0.0%) |
| Life, Physical & Social Science | 3 (100.0%) | 0 (0.0%) |
| Community & Social Service | 19 (14.7%) | 110 (85.3%) |
| Education, Arts & Media | 15 (100.0%) | 0 (0.0%) |
| Legal Services & Support | 2 (40.0%) | 3 (60.0%) |
| Education Instruction & Library | 2 (1.8%) | 107 (98.2%) |
| Arts, Media & Entertainment | 0 (0.0%) | 0 (0.0%) |
| Health Diagnosing & Treating | 30 (19.7%) | 122 (80.3%) |
| Health Technologists | 4 (5.4%) | 70 (94.6%) |
| Total (Category) | 233 (41.2%) | 332 (58.8%) |
| Total (Overall) | 1,407 (51.0%) | 1,353 (49.0%) |
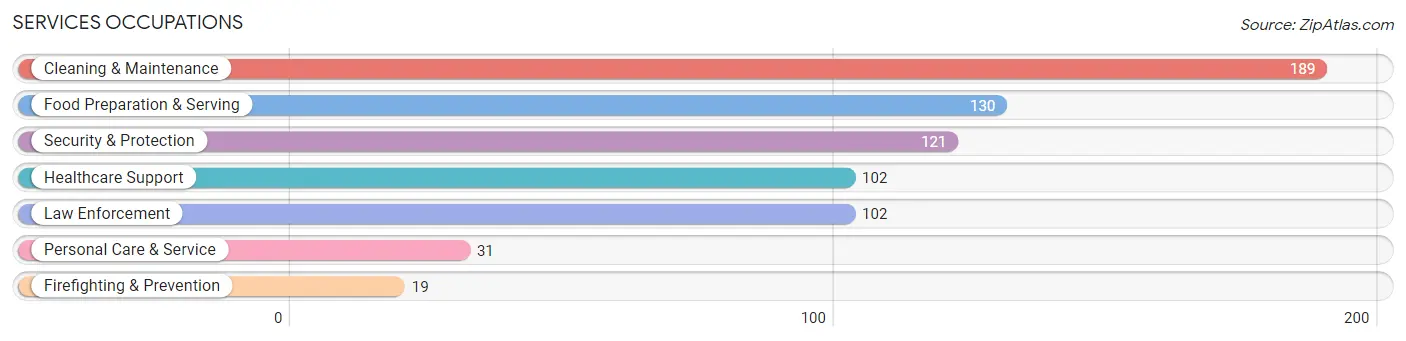
Services Occupations
The most common Services occupations in Twiggs County are Cleaning & Maintenance (189 | 6.9%), Food Preparation & Serving (130 | 4.7%), Security & Protection (121 | 4.4%), Healthcare Support (102 | 3.7%), and Law Enforcement (102 | 3.7%).
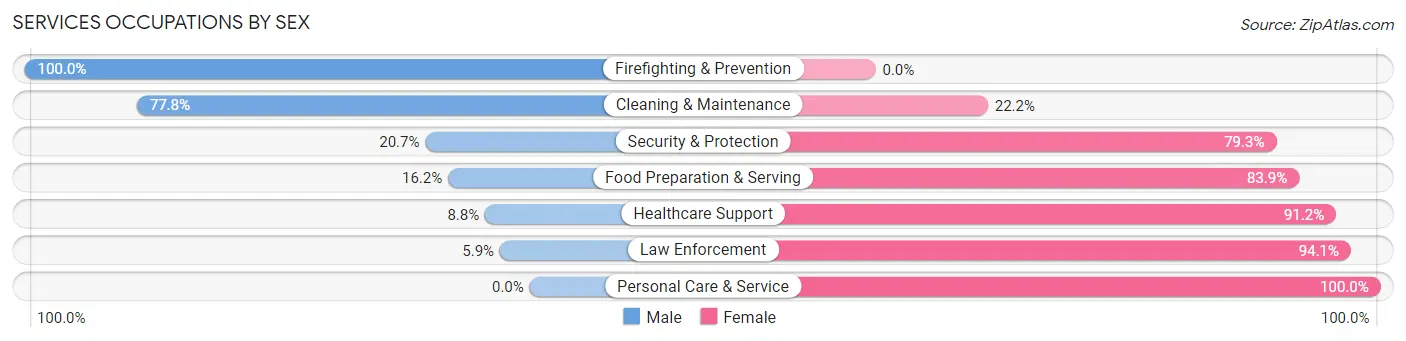
Services Occupations by Sex
Within the Services occupations in Twiggs County, the most male-oriented occupations are Firefighting & Prevention (100.0%), Cleaning & Maintenance (77.8%), and Security & Protection (20.7%), while the most female-oriented occupations are Personal Care & Service (100.0%), Law Enforcement (94.1%), and Healthcare Support (91.2%).
| Occupation | Male | Female |
| Healthcare Support | 9 (8.8%) | 93 (91.2%) |
| Security & Protection | 25 (20.7%) | 96 (79.3%) |
| Firefighting & Prevention | 19 (100.0%) | 0 (0.0%) |
| Law Enforcement | 6 (5.9%) | 96 (94.1%) |
| Food Preparation & Serving | 21 (16.2%) | 109 (83.9%) |
| Cleaning & Maintenance | 147 (77.8%) | 42 (22.2%) |
| Personal Care & Service | 0 (0.0%) | 31 (100.0%) |
| Total (Category) | 202 (35.2%) | 371 (64.7%) |
| Total (Overall) | 1,407 (51.0%) | 1,353 (49.0%) |
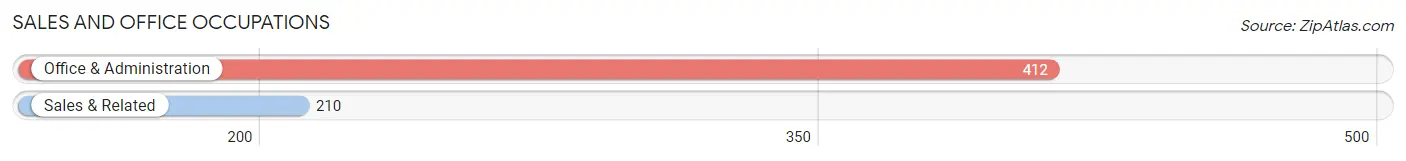
Sales and Office Occupations
The most common Sales and Office occupations in Twiggs County are Office & Administration (412 | 14.9%), and Sales & Related (210 | 7.6%).
Sales and Office Occupations by Sex
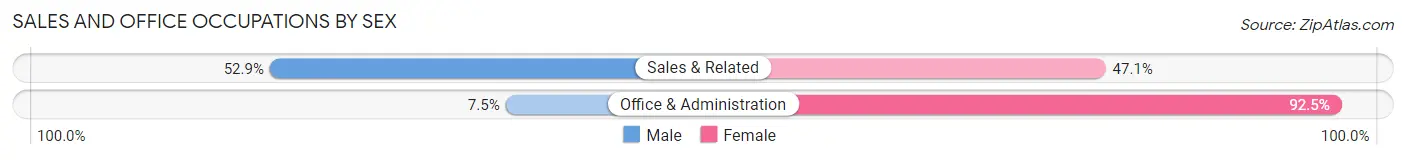
| Occupation | Male | Female |
| Sales & Related | 111 (52.9%) | 99 (47.1%) |
| Office & Administration | 31 (7.5%) | 381 (92.5%) |
| Total (Category) | 142 (22.8%) | 480 (77.2%) |
| Total (Overall) | 1,407 (51.0%) | 1,353 (49.0%) |
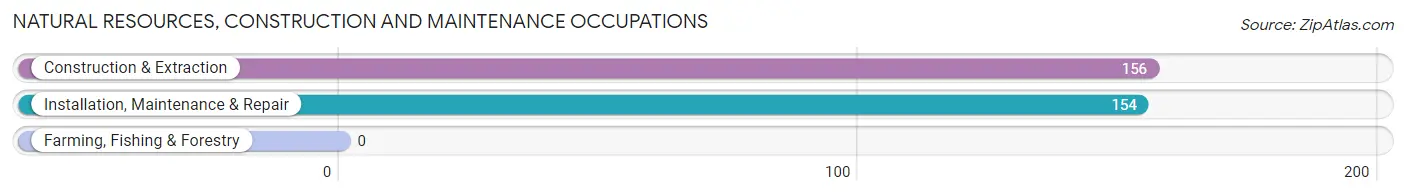
Natural Resources, Construction and Maintenance Occupations
The most common Natural Resources, Construction and Maintenance occupations in Twiggs County are Construction & Extraction (156 | 5.7%), and Installation, Maintenance & Repair (154 | 5.6%).
Natural Resources, Construction and Maintenance Occupations by Sex
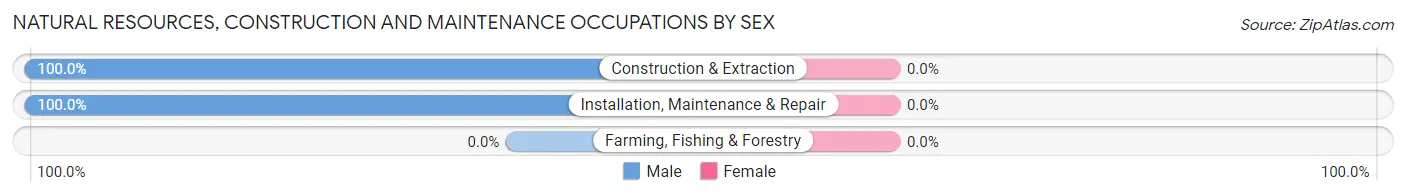
| Occupation | Male | Female |
| Farming, Fishing & Forestry | 0 (0.0%) | 0 (0.0%) |
| Construction & Extraction | 156 (100.0%) | 0 (0.0%) |
| Installation, Maintenance & Repair | 154 (100.0%) | 0 (0.0%) |
| Total (Category) | 310 (100.0%) | 0 (0.0%) |
| Total (Overall) | 1,407 (51.0%) | 1,353 (49.0%) |
Production, Transportation and Moving Occupations
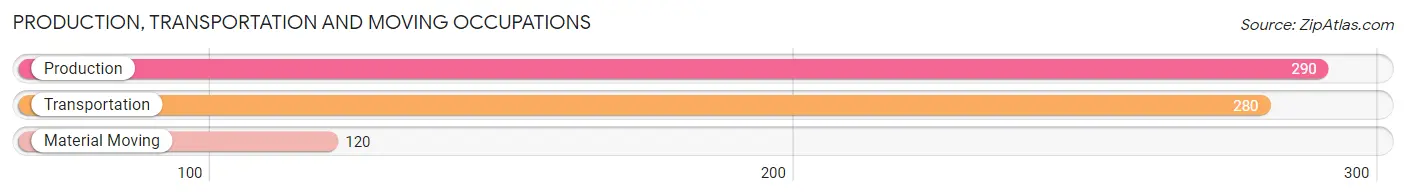
The most common Production, Transportation and Moving occupations in Twiggs County are Production (290 | 10.5%), Transportation (280 | 10.1%), and Material Moving (120 | 4.3%).
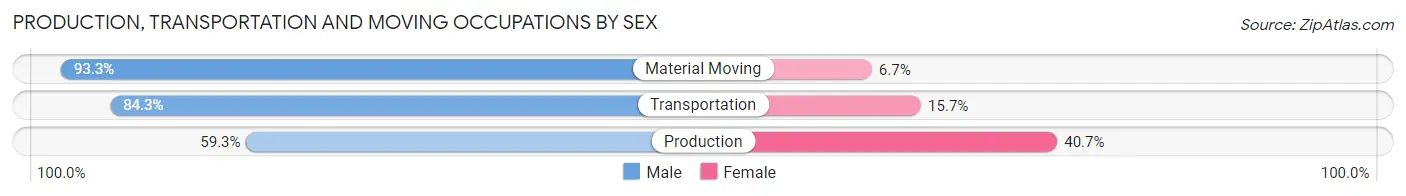
Production, Transportation and Moving Occupations by Sex
| Occupation | Male | Female |
| Production | 172 (59.3%) | 118 (40.7%) |
| Transportation | 236 (84.3%) | 44 (15.7%) |
| Material Moving | 112 (93.3%) | 8 (6.7%) |
| Total (Category) | 520 (75.4%) | 170 (24.6%) |
| Total (Overall) | 1,407 (51.0%) | 1,353 (49.0%) |
Employment Industries by Sex in Twiggs County
Employment Industries in Twiggs County
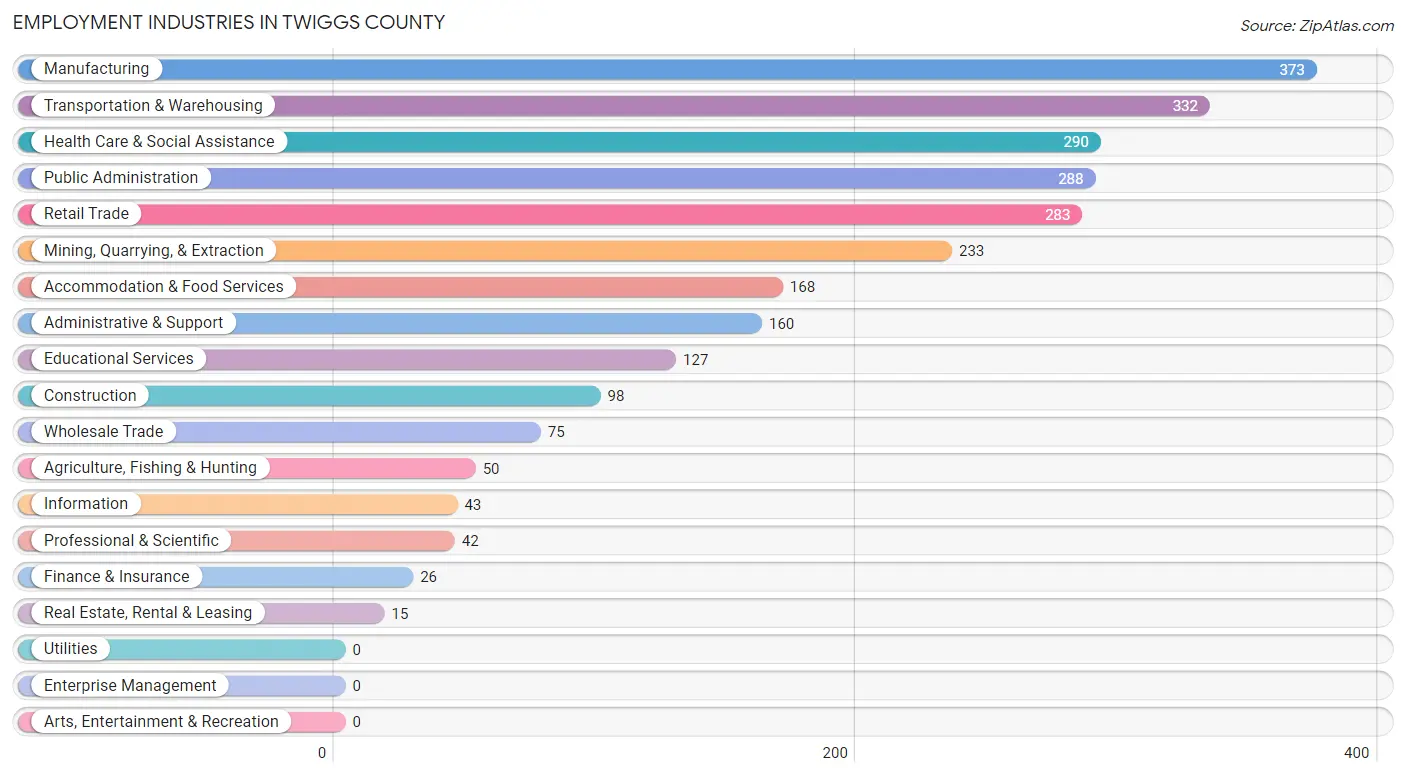
The major employment industries in Twiggs County include Manufacturing (373 | 13.5%), Transportation & Warehousing (332 | 12.0%), Health Care & Social Assistance (290 | 10.5%), Public Administration (288 | 10.4%), and Retail Trade (283 | 10.2%).
Employment Industries by Sex in Twiggs County
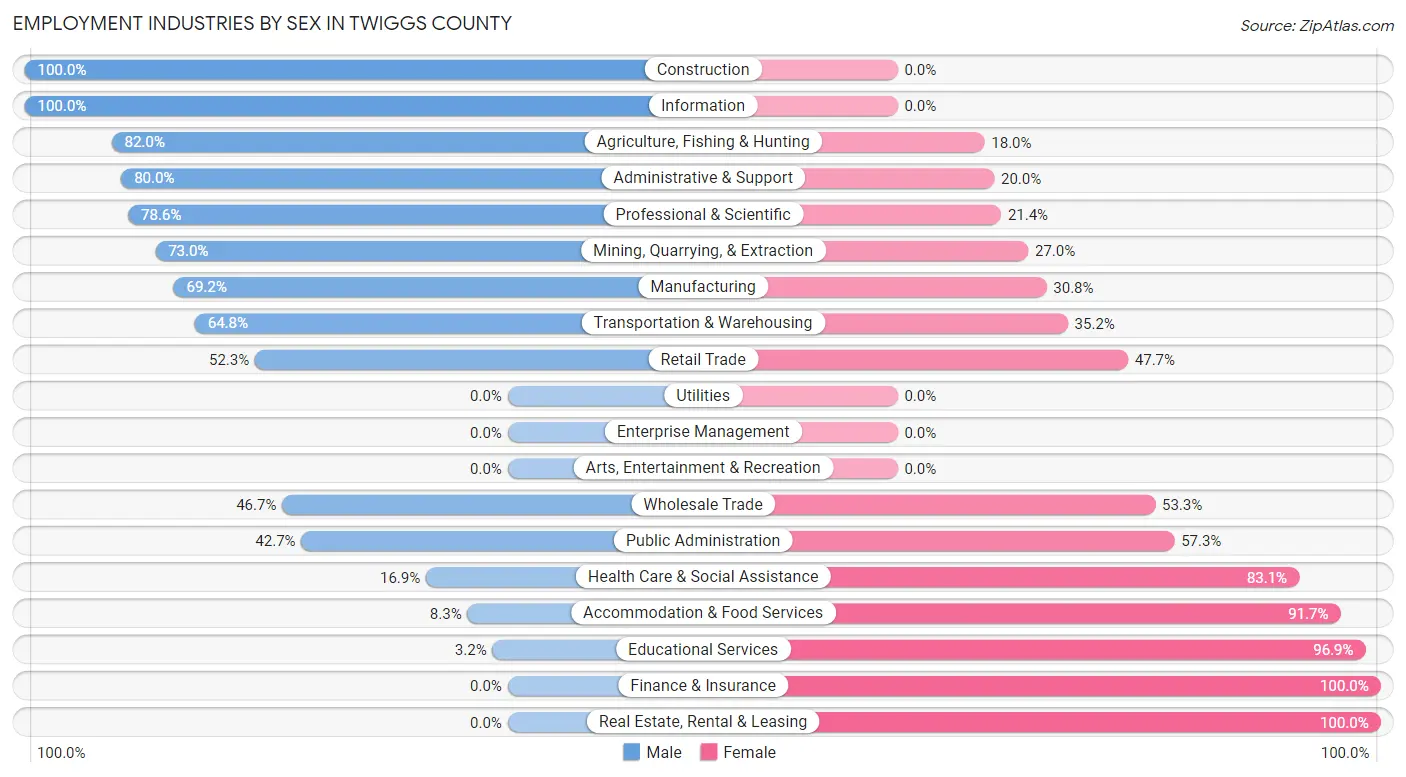
The Twiggs County industries that see more men than women are Construction (100.0%), Information (100.0%), and Agriculture, Fishing & Hunting (82.0%), whereas the industries that tend to have a higher number of women are Finance & Insurance (100.0%), Real Estate, Rental & Leasing (100.0%), and Educational Services (96.9%).
| Industry | Male | Female |
| Agriculture, Fishing & Hunting | 41 (82.0%) | 9 (18.0%) |
| Mining, Quarrying, & Extraction | 170 (73.0%) | 63 (27.0%) |
| Construction | 98 (100.0%) | 0 (0.0%) |
| Manufacturing | 258 (69.2%) | 115 (30.8%) |
| Wholesale Trade | 35 (46.7%) | 40 (53.3%) |
| Retail Trade | 148 (52.3%) | 135 (47.7%) |
| Transportation & Warehousing | 215 (64.8%) | 117 (35.2%) |
| Utilities | 0 (0.0%) | 0 (0.0%) |
| Information | 43 (100.0%) | 0 (0.0%) |
| Finance & Insurance | 0 (0.0%) | 26 (100.0%) |
| Real Estate, Rental & Leasing | 0 (0.0%) | 15 (100.0%) |
| Professional & Scientific | 33 (78.6%) | 9 (21.4%) |
| Enterprise Management | 0 (0.0%) | 0 (0.0%) |
| Administrative & Support | 128 (80.0%) | 32 (20.0%) |
| Educational Services | 4 (3.2%) | 123 (96.9%) |
| Health Care & Social Assistance | 49 (16.9%) | 241 (83.1%) |
| Arts, Entertainment & Recreation | 0 (0.0%) | 0 (0.0%) |
| Accommodation & Food Services | 14 (8.3%) | 154 (91.7%) |
| Public Administration | 123 (42.7%) | 165 (57.3%) |
| Total | 1,407 (51.0%) | 1,353 (49.0%) |
Education in Twiggs County
School Enrollment in Twiggs County
The most common levels of schooling among the 1,459 students in Twiggs County are high school (416 | 28.5%), middle school (375 | 25.7%), and elementary school (313 | 21.4%).
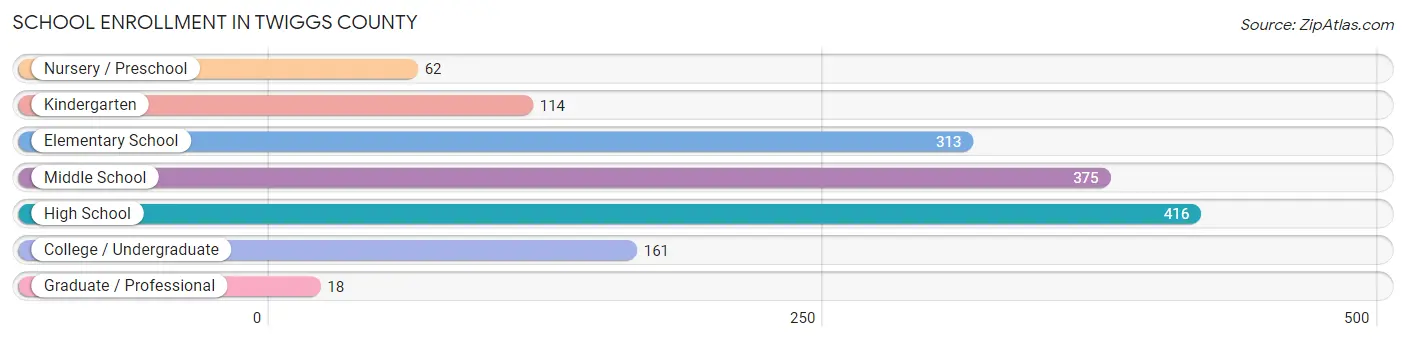
| School Level | # Students | % Students |
| Nursery / Preschool | 62 | 4.3% |
| Kindergarten | 114 | 7.8% |
| Elementary School | 313 | 21.4% |
| Middle School | 375 | 25.7% |
| High School | 416 | 28.5% |
| College / Undergraduate | 161 | 11.0% |
| Graduate / Professional | 18 | 1.2% |
| Total | 1,459 | 100.0% |
School Enrollment by Age by Funding Source in Twiggs County
Out of a total of 1,459 students who are enrolled in schools in Twiggs County, 290 (19.9%) attend a private institution, while the remaining 1,169 (80.1%) are enrolled in public schools. The age group of 3 to 4 year olds has the highest likelihood of being enrolled in private schools, with 35 (94.6% in the age bracket) enrolled. Conversely, the age group of 25 to 34 year olds has the lowest likelihood of being enrolled in a private school, with 25 (100.0% in the age bracket) attending a public institution.
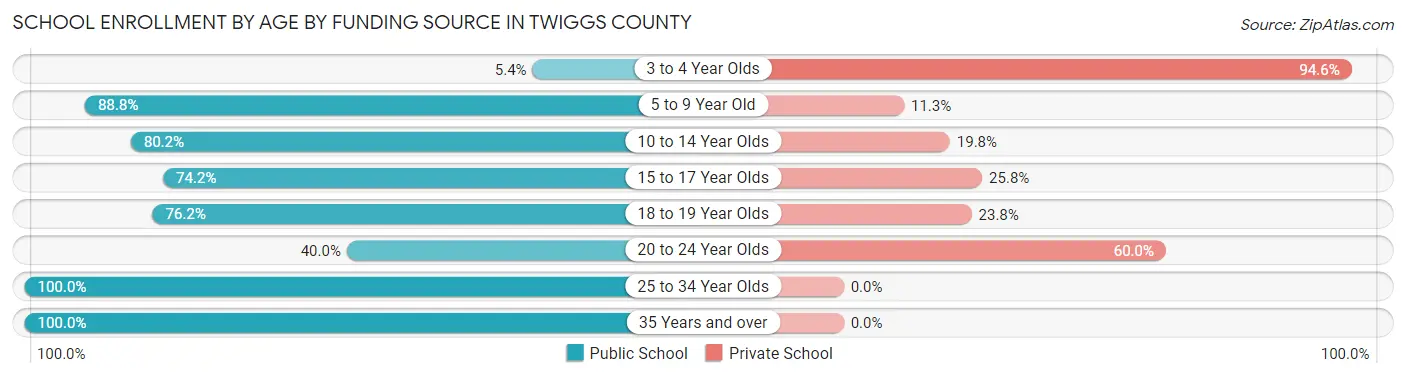
| Age Bracket | Public School | Private School |
| 3 to 4 Year Olds | 2 (5.4%) | 35 (94.6%) |
| 5 to 9 Year Old | 347 (88.7%) | 44 (11.3%) |
| 10 to 14 Year Olds | 373 (80.2%) | 92 (19.8%) |
| 15 to 17 Year Olds | 141 (74.2%) | 49 (25.8%) |
| 18 to 19 Year Olds | 147 (76.2%) | 46 (23.8%) |
| 20 to 24 Year Olds | 16 (40.0%) | 24 (60.0%) |
| 25 to 34 Year Olds | 25 (100.0%) | 0 (0.0%) |
| 35 Years and over | 118 (100.0%) | 0 (0.0%) |
| Total | 1,169 (80.1%) | 290 (19.9%) |
Educational Attainment by Field of Study in Twiggs County
Science & technology (145 | 21.6%), education (112 | 16.7%), bio, nature & agricultural (105 | 15.6%), arts & humanities (68 | 10.1%), and business (60 | 8.9%) are the most common fields of study among 672 individuals in Twiggs County who have obtained a bachelor's degree or higher.
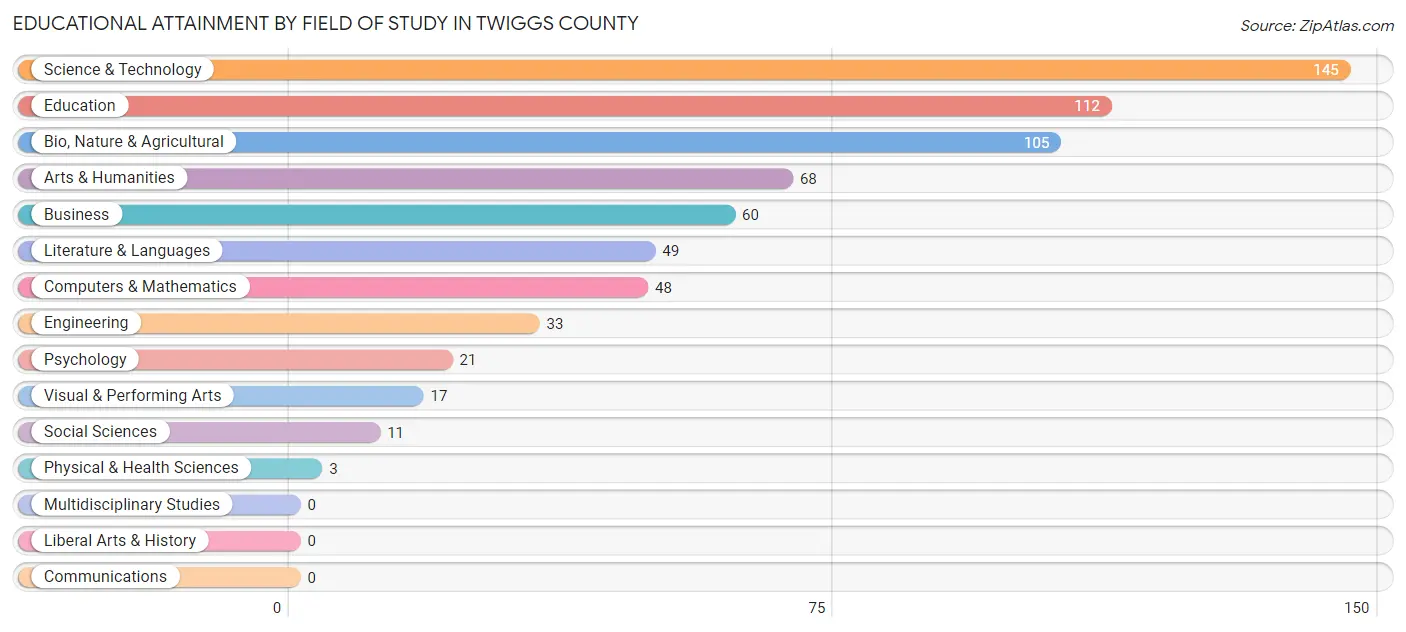
| Field of Study | # Graduates | % Graduates |
| Computers & Mathematics | 48 | 7.1% |
| Bio, Nature & Agricultural | 105 | 15.6% |
| Physical & Health Sciences | 3 | 0.4% |
| Psychology | 21 | 3.1% |
| Social Sciences | 11 | 1.6% |
| Engineering | 33 | 4.9% |
| Multidisciplinary Studies | 0 | 0.0% |
| Science & Technology | 145 | 21.6% |
| Business | 60 | 8.9% |
| Education | 112 | 16.7% |
| Literature & Languages | 49 | 7.3% |
| Liberal Arts & History | 0 | 0.0% |
| Visual & Performing Arts | 17 | 2.5% |
| Communications | 0 | 0.0% |
| Arts & Humanities | 68 | 10.1% |
| Total | 672 | 100.0% |
Transportation & Commute in Twiggs County
Vehicle Availability by Sex in Twiggs County
The most prevalent vehicle ownership categories in Twiggs County are males with 2 vehicles (486, accounting for 34.8%) and females with 2 vehicles (315, making up 36.6%).
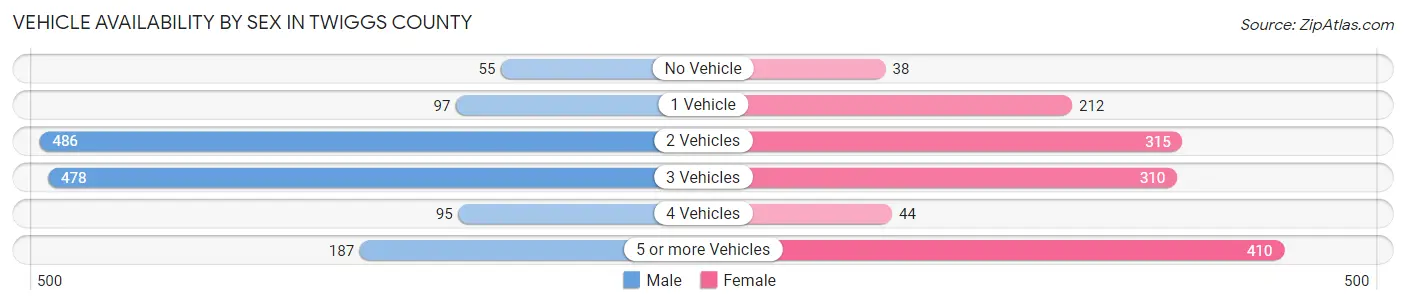
| Vehicles Available | Male | Female |
| No Vehicle | 55 (3.9%) | 38 (2.9%) |
| 1 Vehicle | 97 (6.9%) | 212 (16.0%) |
| 2 Vehicles | 486 (34.8%) | 315 (23.7%) |
| 3 Vehicles | 478 (34.2%) | 310 (23.3%) |
| 4 Vehicles | 95 (6.8%) | 44 (3.3%) |
| 5 or more Vehicles | 187 (13.4%) | 410 (30.8%) |
| Total | 1,398 (100.0%) | 1,329 (100.0%) |
Commute Time in Twiggs County
The most frequently occuring commute durations in Twiggs County are 20 to 24 minutes (409 commuters, 16.1%), 15 to 19 minutes (391 commuters, 15.3%), and 30 to 34 minutes (384 commuters, 15.1%).
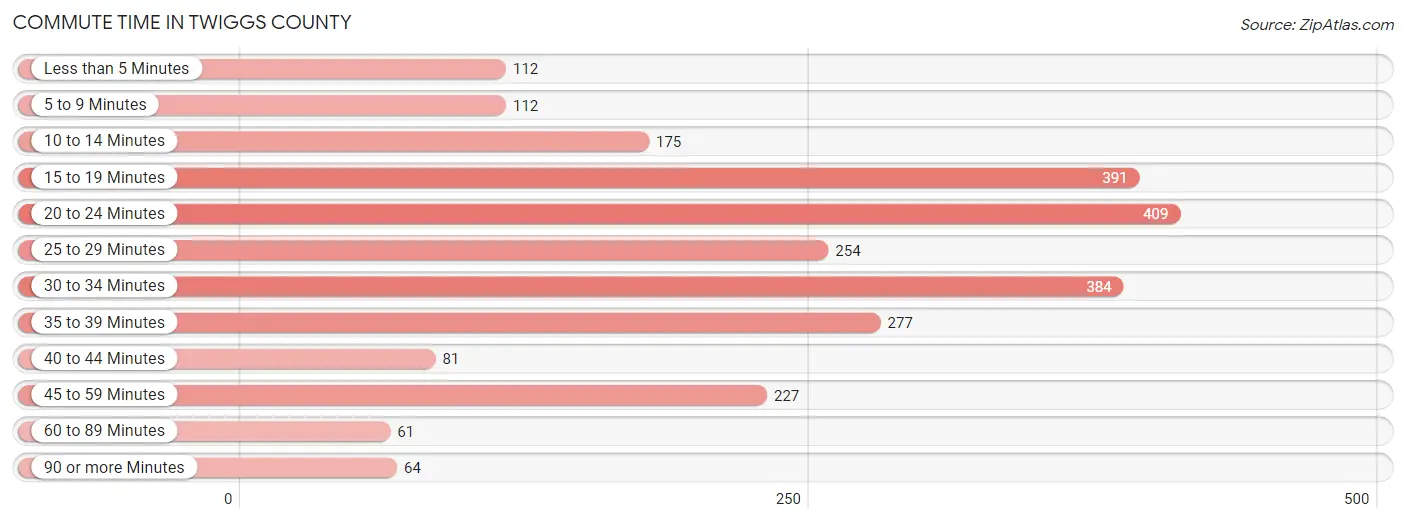
| Commute Time | # Commuters | % Commuters |
| Less than 5 Minutes | 112 | 4.4% |
| 5 to 9 Minutes | 112 | 4.4% |
| 10 to 14 Minutes | 175 | 6.9% |
| 15 to 19 Minutes | 391 | 15.3% |
| 20 to 24 Minutes | 409 | 16.1% |
| 25 to 29 Minutes | 254 | 10.0% |
| 30 to 34 Minutes | 384 | 15.1% |
| 35 to 39 Minutes | 277 | 10.9% |
| 40 to 44 Minutes | 81 | 3.2% |
| 45 to 59 Minutes | 227 | 8.9% |
| 60 to 89 Minutes | 61 | 2.4% |
| 90 or more Minutes | 64 | 2.5% |
Commute Time by Sex in Twiggs County
The most common commute times in Twiggs County are 30 to 34 minutes (253 commuters, 19.8%) for males and 20 to 24 minutes (261 commuters, 20.5%) for females.
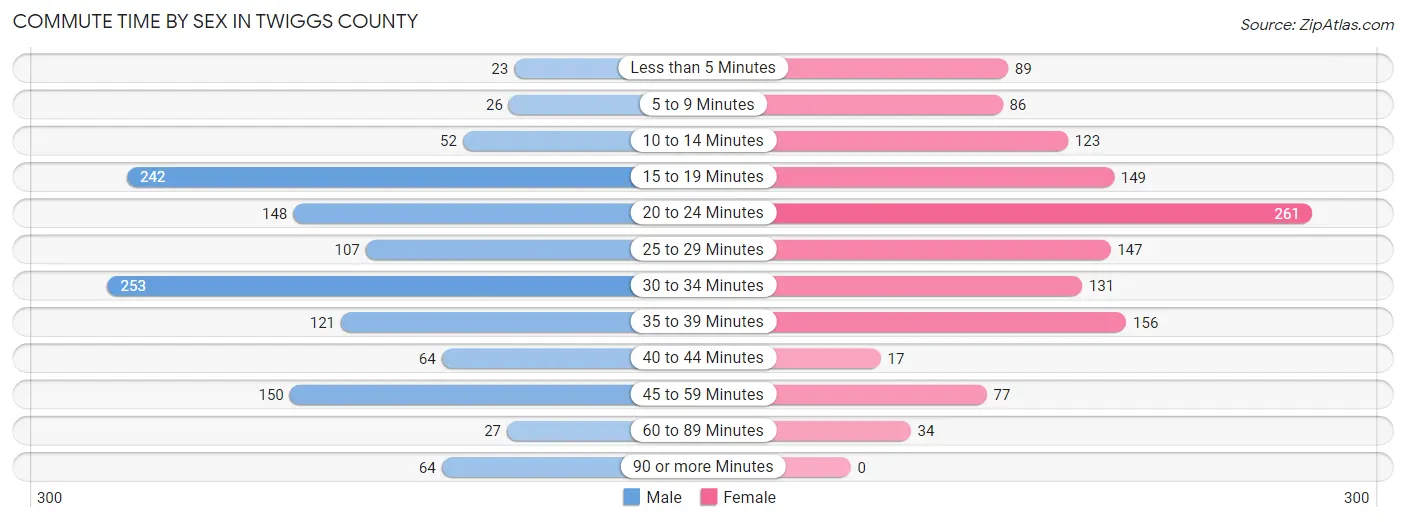
| Commute Time | Male | Female |
| Less than 5 Minutes | 23 (1.8%) | 89 (7.0%) |
| 5 to 9 Minutes | 26 (2.0%) | 86 (6.8%) |
| 10 to 14 Minutes | 52 (4.1%) | 123 (9.7%) |
| 15 to 19 Minutes | 242 (19.0%) | 149 (11.7%) |
| 20 to 24 Minutes | 148 (11.6%) | 261 (20.5%) |
| 25 to 29 Minutes | 107 (8.4%) | 147 (11.6%) |
| 30 to 34 Minutes | 253 (19.8%) | 131 (10.3%) |
| 35 to 39 Minutes | 121 (9.5%) | 156 (12.3%) |
| 40 to 44 Minutes | 64 (5.0%) | 17 (1.3%) |
| 45 to 59 Minutes | 150 (11.7%) | 77 (6.1%) |
| 60 to 89 Minutes | 27 (2.1%) | 34 (2.7%) |
| 90 or more Minutes | 64 (5.0%) | 0 (0.0%) |
Time of Departure to Work by Sex in Twiggs County
The most frequent times of departure to work in Twiggs County are 12:00 AM to 4:59 AM (188, 14.7%) for males and 7:00 AM to 7:29 AM (291, 22.9%) for females.
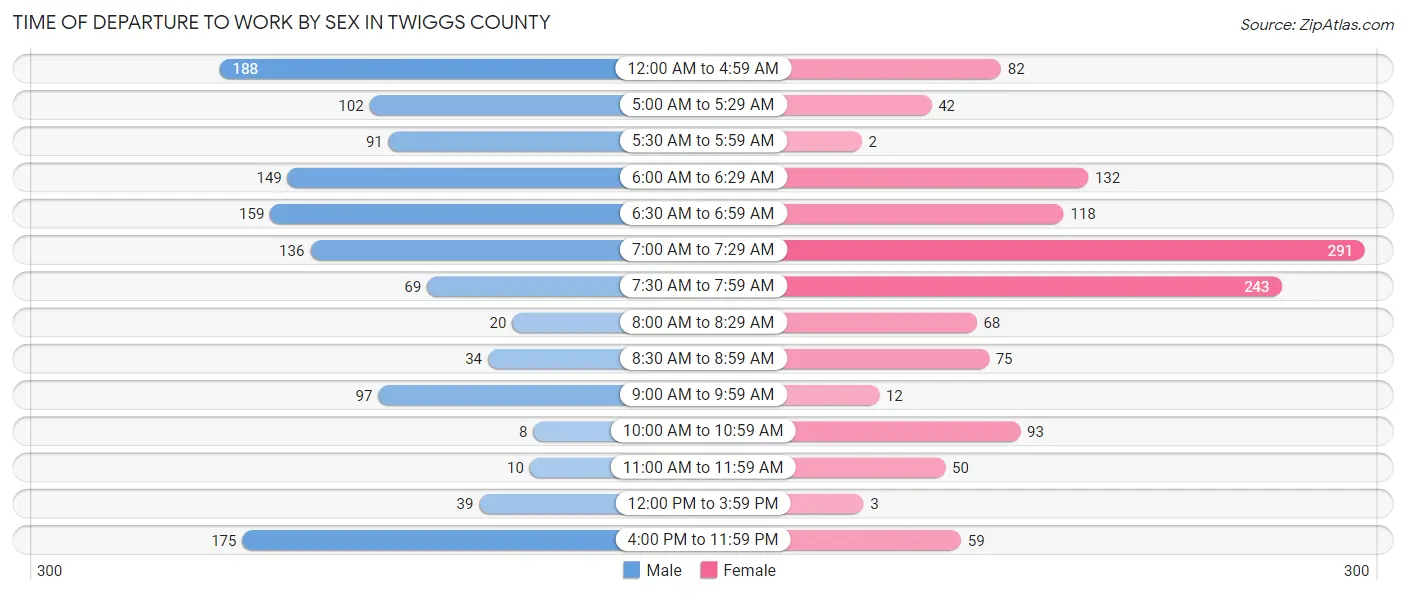
| Time of Departure | Male | Female |
| 12:00 AM to 4:59 AM | 188 (14.7%) | 82 (6.5%) |
| 5:00 AM to 5:29 AM | 102 (8.0%) | 42 (3.3%) |
| 5:30 AM to 5:59 AM | 91 (7.1%) | 2 (0.2%) |
| 6:00 AM to 6:29 AM | 149 (11.7%) | 132 (10.4%) |
| 6:30 AM to 6:59 AM | 159 (12.4%) | 118 (9.3%) |
| 7:00 AM to 7:29 AM | 136 (10.6%) | 291 (22.9%) |
| 7:30 AM to 7:59 AM | 69 (5.4%) | 243 (19.1%) |
| 8:00 AM to 8:29 AM | 20 (1.6%) | 68 (5.3%) |
| 8:30 AM to 8:59 AM | 34 (2.7%) | 75 (5.9%) |
| 9:00 AM to 9:59 AM | 97 (7.6%) | 12 (0.9%) |
| 10:00 AM to 10:59 AM | 8 (0.6%) | 93 (7.3%) |
| 11:00 AM to 11:59 AM | 10 (0.8%) | 50 (3.9%) |
| 12:00 PM to 3:59 PM | 39 (3.0%) | 3 (0.2%) |
| 4:00 PM to 11:59 PM | 175 (13.7%) | 59 (4.6%) |
| Total | 1,277 (100.0%) | 1,270 (100.0%) |
Housing Occupancy in Twiggs County
Occupancy by Ownership in Twiggs County
Of the total 2,900 dwellings in Twiggs County, owner-occupied units account for 2,582 (89.0%), while renter-occupied units make up 318 (11.0%).
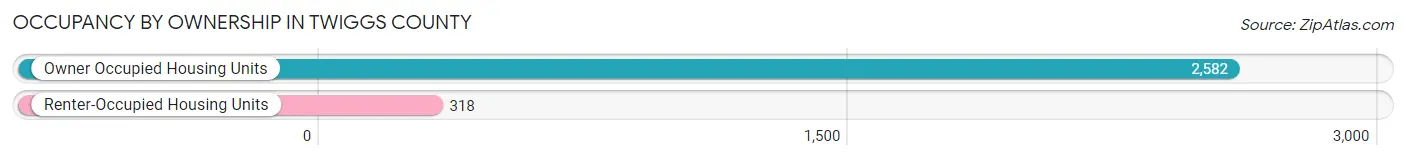
| Occupancy | # Housing Units | % Housing Units |
| Owner Occupied Housing Units | 2,582 | 89.0% |
| Renter-Occupied Housing Units | 318 | 11.0% |
| Total Occupied Housing Units | 2,900 | 100.0% |
Occupancy by Household Size in Twiggs County
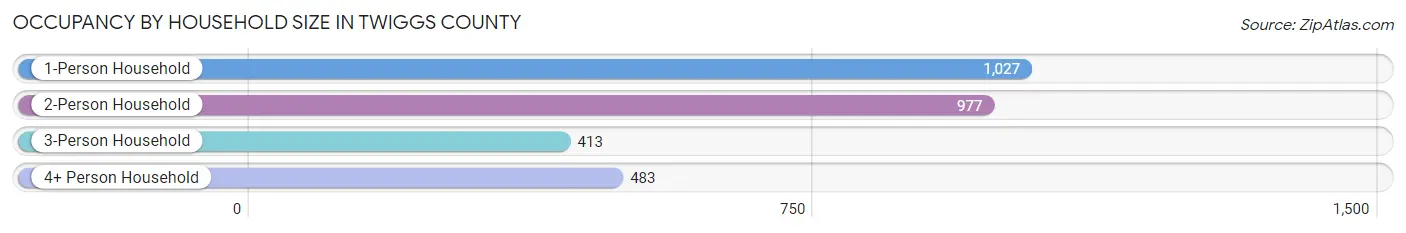
| Household Size | # Housing Units | % Housing Units |
| 1-Person Household | 1,027 | 35.4% |
| 2-Person Household | 977 | 33.7% |
| 3-Person Household | 413 | 14.2% |
| 4+ Person Household | 483 | 16.7% |
| Total Housing Units | 2,900 | 100.0% |
Occupancy by Ownership by Household Size in Twiggs County
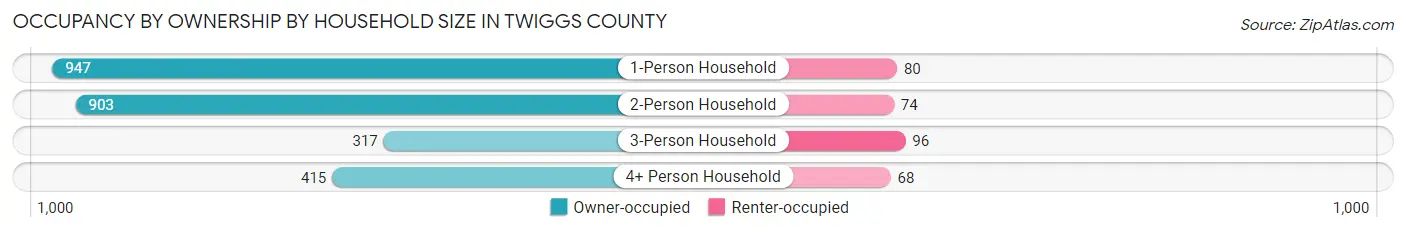
| Household Size | Owner-occupied | Renter-occupied |
| 1-Person Household | 947 (92.2%) | 80 (7.8%) |
| 2-Person Household | 903 (92.4%) | 74 (7.6%) |
| 3-Person Household | 317 (76.8%) | 96 (23.2%) |
| 4+ Person Household | 415 (85.9%) | 68 (14.1%) |
| Total Housing Units | 2,582 (89.0%) | 318 (11.0%) |
Occupancy by Educational Attainment in Twiggs County
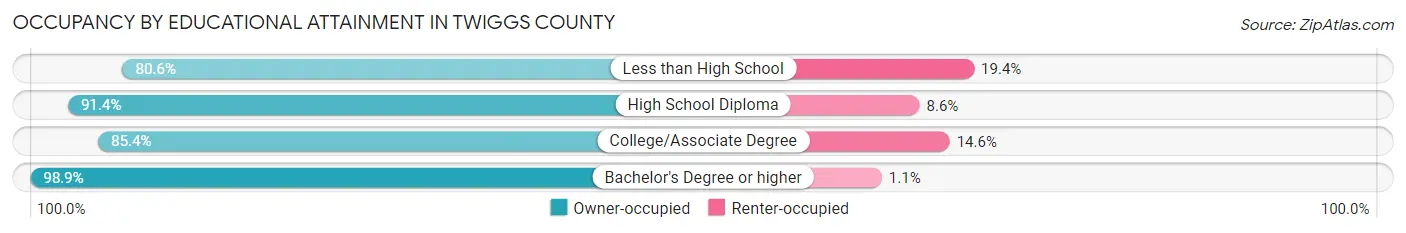
| Household Size | Owner-occupied | Renter-occupied |
| Less than High School | 369 (80.6%) | 89 (19.4%) |
| High School Diploma | 1,221 (91.4%) | 115 (8.6%) |
| College/Associate Degree | 644 (85.4%) | 110 (14.6%) |
| Bachelor's Degree or higher | 348 (98.9%) | 4 (1.1%) |
Occupancy by Age of Householder in Twiggs County
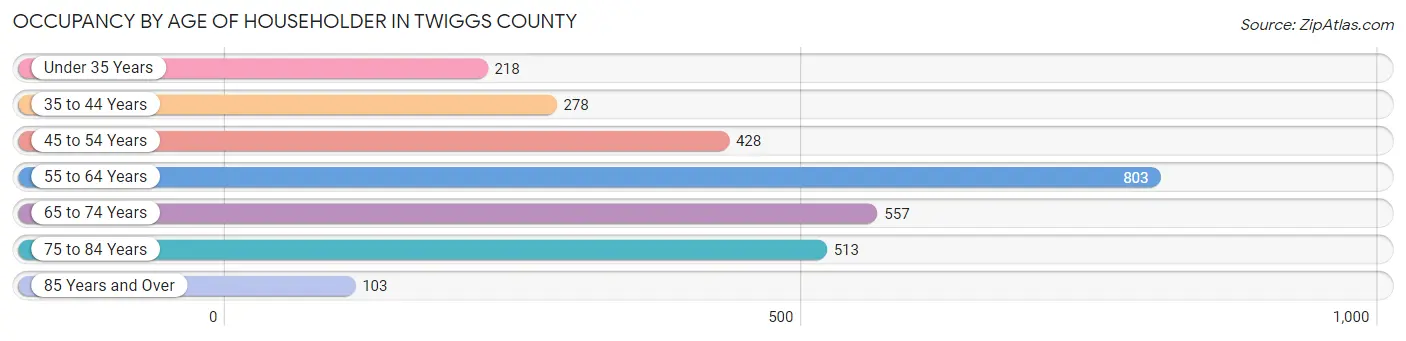
| Age Bracket | # Households | % Households |
| Under 35 Years | 218 | 7.5% |
| 35 to 44 Years | 278 | 9.6% |
| 45 to 54 Years | 428 | 14.8% |
| 55 to 64 Years | 803 | 27.7% |
| 65 to 74 Years | 557 | 19.2% |
| 75 to 84 Years | 513 | 17.7% |
| 85 Years and Over | 103 | 3.5% |
| Total | 2,900 | 100.0% |
Housing Finances in Twiggs County
Median Income by Occupancy in Twiggs County
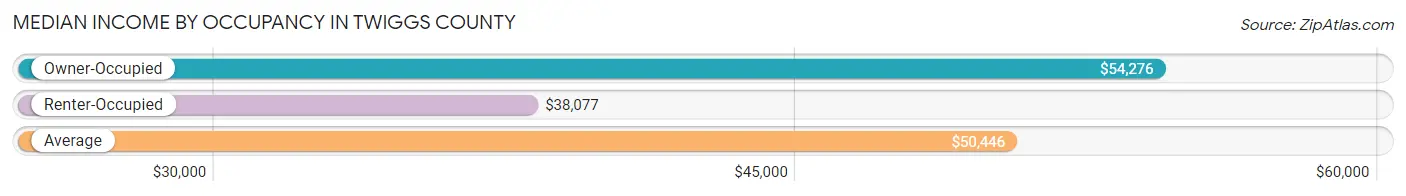
| Occupancy Type | # Households | Median Income |
| Owner-Occupied | 2,582 (89.0%) | $54,276 |
| Renter-Occupied | 318 (11.0%) | $38,077 |
| Average | 2,900 (100.0%) | $50,446 |
Occupancy by Householder Income Bracket in Twiggs County
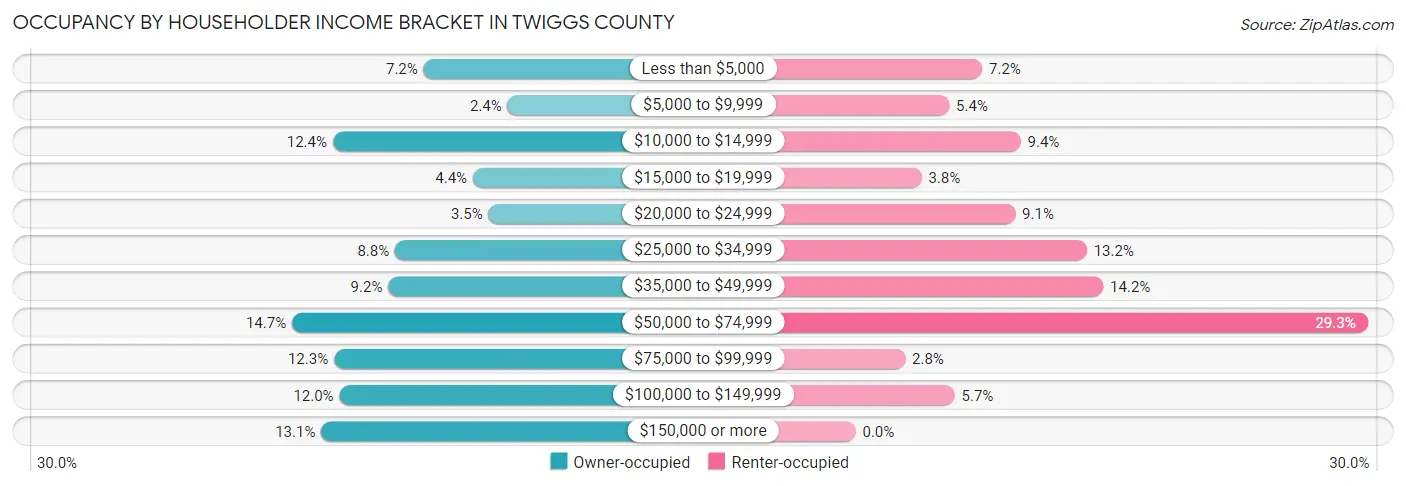
| Income Bracket | Owner-occupied | Renter-occupied |
| Less than $5,000 | 186 (7.2%) | 23 (7.2%) |
| $5,000 to $9,999 | 62 (2.4%) | 17 (5.3%) |
| $10,000 to $14,999 | 320 (12.4%) | 30 (9.4%) |
| $15,000 to $19,999 | 113 (4.4%) | 12 (3.8%) |
| $20,000 to $24,999 | 90 (3.5%) | 29 (9.1%) |
| $25,000 to $34,999 | 228 (8.8%) | 42 (13.2%) |
| $35,000 to $49,999 | 238 (9.2%) | 45 (14.1%) |
| $50,000 to $74,999 | 380 (14.7%) | 93 (29.2%) |
| $75,000 to $99,999 | 318 (12.3%) | 9 (2.8%) |
| $100,000 to $149,999 | 310 (12.0%) | 18 (5.7%) |
| $150,000 or more | 337 (13.1%) | 0 (0.0%) |
| Total | 2,582 (100.0%) | 318 (100.0%) |
Monthly Housing Cost Tiers in Twiggs County
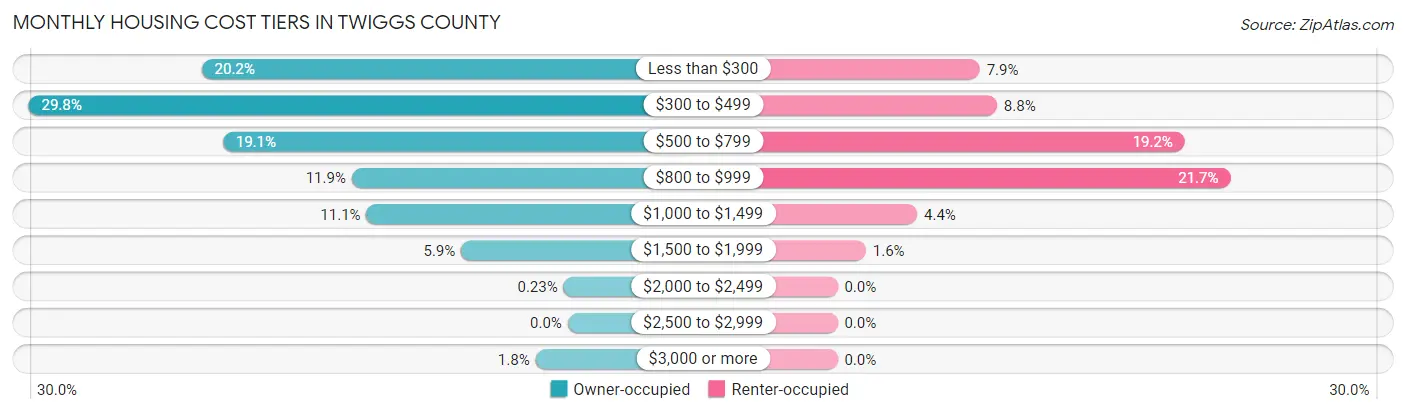
| Monthly Cost | Owner-occupied | Renter-occupied |
| Less than $300 | 522 (20.2%) | 25 (7.9%) |
| $300 to $499 | 769 (29.8%) | 28 (8.8%) |
| $500 to $799 | 492 (19.1%) | 61 (19.2%) |
| $800 to $999 | 308 (11.9%) | 69 (21.7%) |
| $1,000 to $1,499 | 287 (11.1%) | 14 (4.4%) |
| $1,500 to $1,999 | 152 (5.9%) | 5 (1.6%) |
| $2,000 to $2,499 | 6 (0.2%) | 0 (0.0%) |
| $2,500 to $2,999 | 0 (0.0%) | 0 (0.0%) |
| $3,000 or more | 46 (1.8%) | 0 (0.0%) |
| Total | 2,582 (100.0%) | 318 (100.0%) |
Physical Housing Characteristics in Twiggs County
Housing Structures in Twiggs County
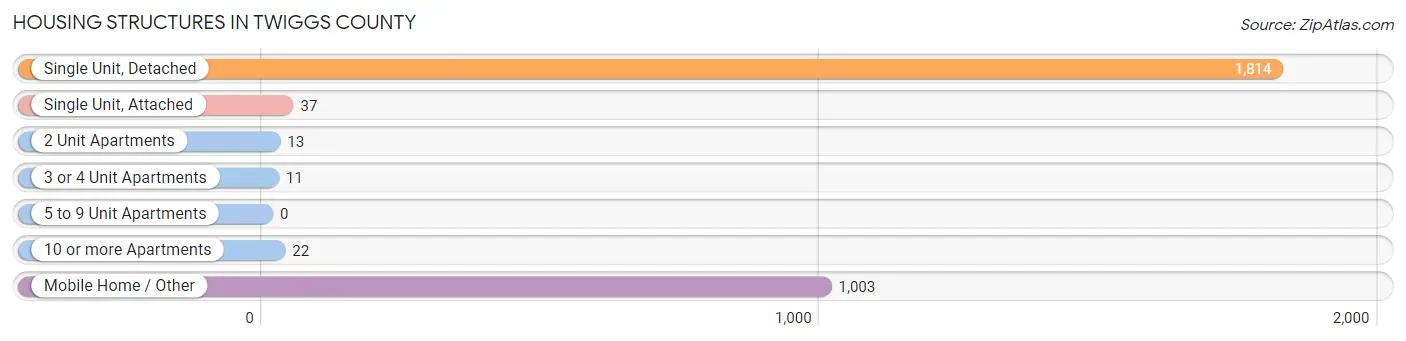
| Structure Type | # Housing Units | % Housing Units |
| Single Unit, Detached | 1,814 | 62.5% |
| Single Unit, Attached | 37 | 1.3% |
| 2 Unit Apartments | 13 | 0.4% |
| 3 or 4 Unit Apartments | 11 | 0.4% |
| 5 to 9 Unit Apartments | 0 | 0.0% |
| 10 or more Apartments | 22 | 0.8% |
| Mobile Home / Other | 1,003 | 34.6% |
| Total | 2,900 | 100.0% |
Housing Structures by Occupancy in Twiggs County
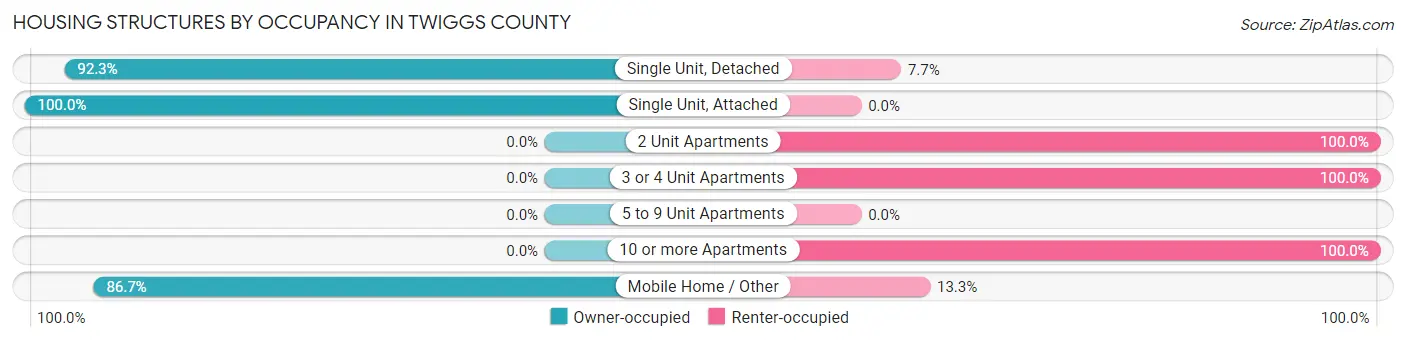
| Structure Type | Owner-occupied | Renter-occupied |
| Single Unit, Detached | 1,675 (92.3%) | 139 (7.7%) |
| Single Unit, Attached | 37 (100.0%) | 0 (0.0%) |
| 2 Unit Apartments | 0 (0.0%) | 13 (100.0%) |
| 3 or 4 Unit Apartments | 0 (0.0%) | 11 (100.0%) |
| 5 to 9 Unit Apartments | 0 (0.0%) | 0 (0.0%) |
| 10 or more Apartments | 0 (0.0%) | 22 (100.0%) |
| Mobile Home / Other | 870 (86.7%) | 133 (13.3%) |
| Total | 2,582 (89.0%) | 318 (11.0%) |
Housing Structures by Number of Rooms in Twiggs County
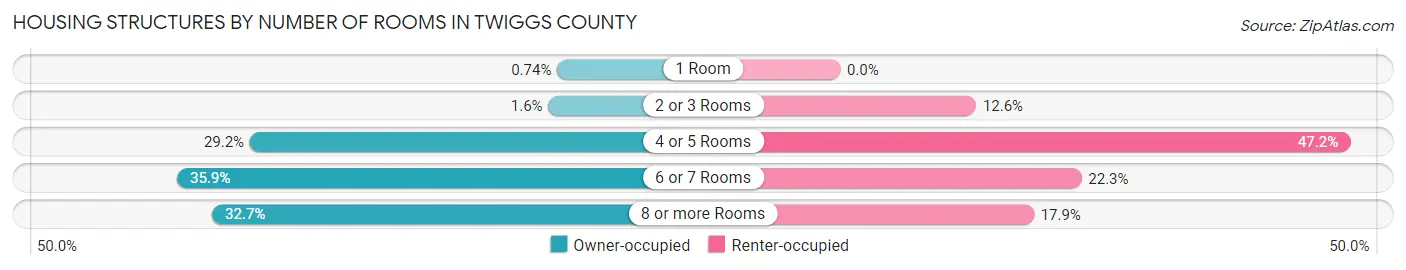
| Number of Rooms | Owner-occupied | Renter-occupied |
| 1 Room | 19 (0.7%) | 0 (0.0%) |
| 2 or 3 Rooms | 40 (1.5%) | 40 (12.6%) |
| 4 or 5 Rooms | 753 (29.2%) | 150 (47.2%) |
| 6 or 7 Rooms | 927 (35.9%) | 71 (22.3%) |
| 8 or more Rooms | 843 (32.7%) | 57 (17.9%) |
| Total | 2,582 (100.0%) | 318 (100.0%) |
Housing Structure by Heating Type in Twiggs County
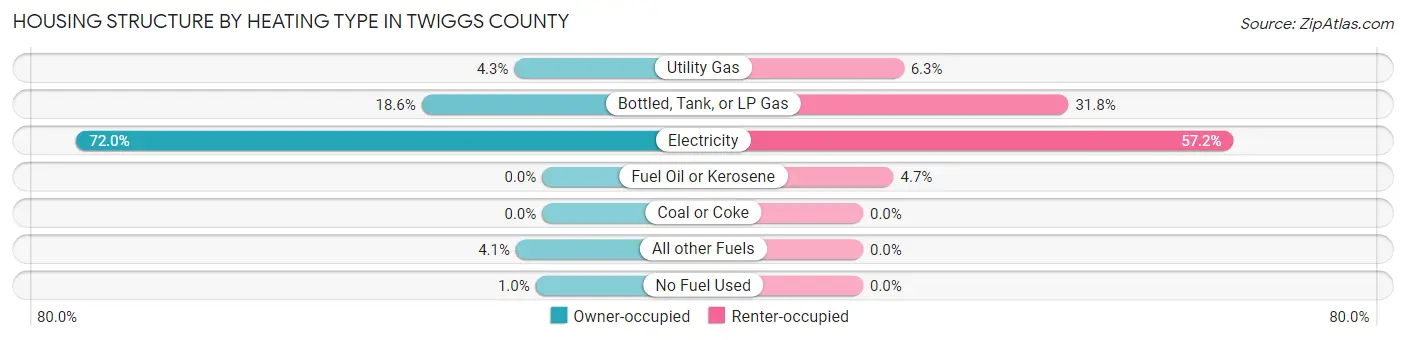
| Heating Type | Owner-occupied | Renter-occupied |
| Utility Gas | 111 (4.3%) | 20 (6.3%) |
| Bottled, Tank, or LP Gas | 481 (18.6%) | 101 (31.8%) |
| Electricity | 1,859 (72.0%) | 182 (57.2%) |
| Fuel Oil or Kerosene | 0 (0.0%) | 15 (4.7%) |
| Coal or Coke | 0 (0.0%) | 0 (0.0%) |
| All other Fuels | 105 (4.1%) | 0 (0.0%) |
| No Fuel Used | 26 (1.0%) | 0 (0.0%) |
| Total | 2,582 (100.0%) | 318 (100.0%) |
Household Vehicle Usage in Twiggs County
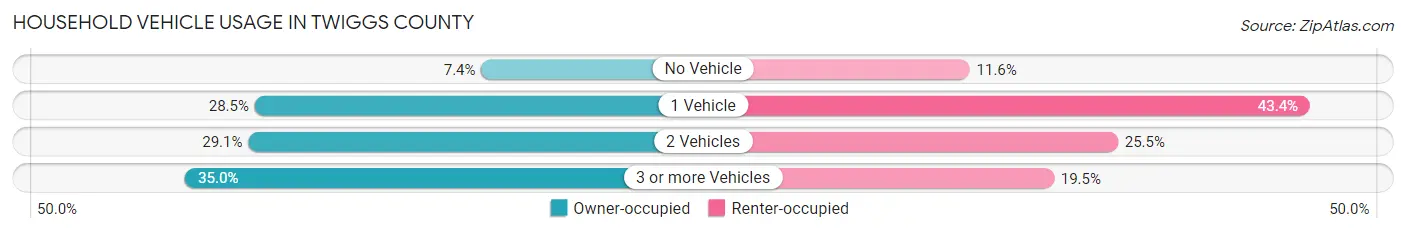
| Vehicles per Household | Owner-occupied | Renter-occupied |
| No Vehicle | 190 (7.4%) | 37 (11.6%) |
| 1 Vehicle | 736 (28.5%) | 138 (43.4%) |
| 2 Vehicles | 752 (29.1%) | 81 (25.5%) |
| 3 or more Vehicles | 904 (35.0%) | 62 (19.5%) |
| Total | 2,582 (100.0%) | 318 (100.0%) |
Real Estate & Mortgages in Twiggs County
Real Estate and Mortgage Overview in Twiggs County
| Characteristic | Without Mortgage | With Mortgage |
| Housing Units | 1,774 | 808 |
| Median Property Value | $80,500 | $152,900 |
| Median Household Income | $44,583 | $175 |
| Monthly Housing Costs | $392 | $46 |
| Real Estate Taxes | $742 | $80 |
Property Value by Mortgage Status in Twiggs County
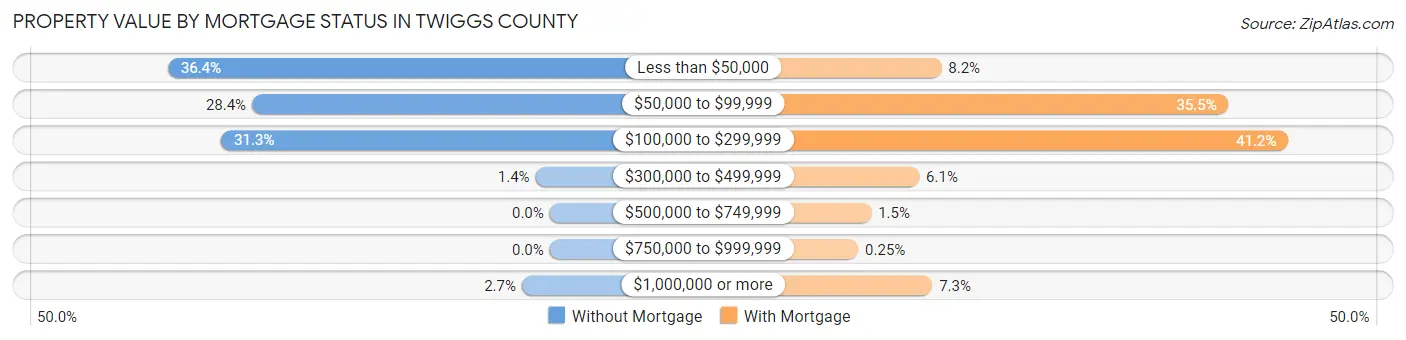
| Property Value | Without Mortgage | With Mortgage |
| Less than $50,000 | 645 (36.4%) | 66 (8.2%) |
| $50,000 to $99,999 | 503 (28.3%) | 287 (35.5%) |
| $100,000 to $299,999 | 555 (31.3%) | 333 (41.2%) |
| $300,000 to $499,999 | 24 (1.3%) | 49 (6.1%) |
| $500,000 to $749,999 | 0 (0.0%) | 12 (1.5%) |
| $750,000 to $999,999 | 0 (0.0%) | 2 (0.3%) |
| $1,000,000 or more | 47 (2.6%) | 59 (7.3%) |
| Total | 1,774 (100.0%) | 808 (100.0%) |
Household Income by Mortgage Status in Twiggs County
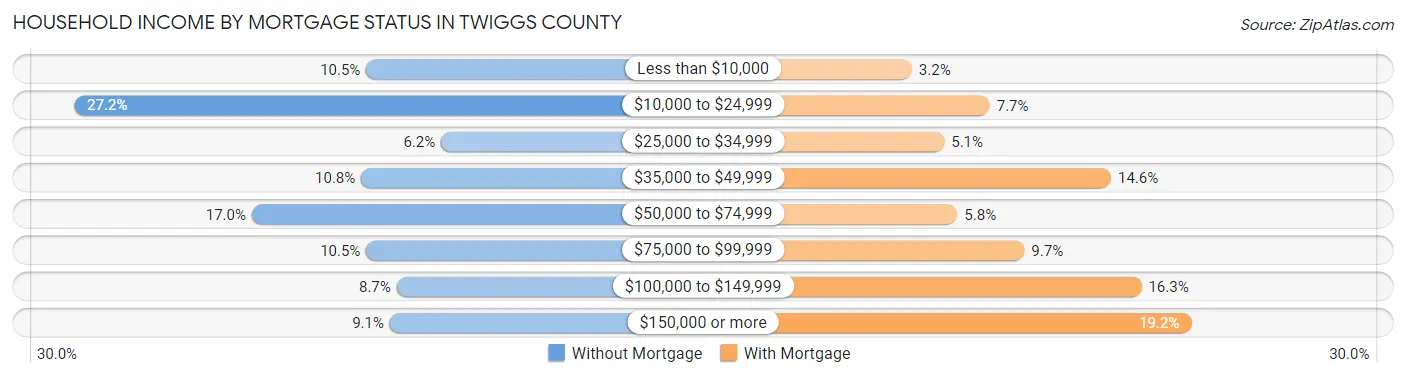
| Household Income | Without Mortgage | With Mortgage |
| Less than $10,000 | 186 (10.5%) | 26 (3.2%) |
| $10,000 to $24,999 | 482 (27.2%) | 62 (7.7%) |
| $25,000 to $34,999 | 110 (6.2%) | 41 (5.1%) |
| $35,000 to $49,999 | 191 (10.8%) | 118 (14.6%) |
| $50,000 to $74,999 | 302 (17.0%) | 47 (5.8%) |
| $75,000 to $99,999 | 186 (10.5%) | 78 (9.7%) |
| $100,000 to $149,999 | 155 (8.7%) | 132 (16.3%) |
| $150,000 or more | 162 (9.1%) | 155 (19.2%) |
| Total | 1,774 (100.0%) | 808 (100.0%) |
Property Value to Household Income Ratio in Twiggs County
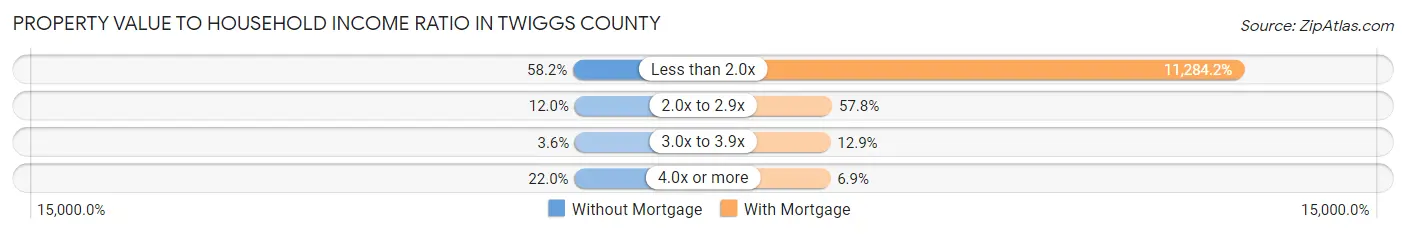
| Value-to-Income Ratio | Without Mortgage | With Mortgage |
| Less than 2.0x | 1,032 (58.2%) | 91,176 (11,284.2%) |
| 2.0x to 2.9x | 213 (12.0%) | 467 (57.8%) |
| 3.0x to 3.9x | 64 (3.6%) | 104 (12.9%) |
| 4.0x or more | 390 (22.0%) | 56 (6.9%) |
| Total | 1,774 (100.0%) | 808 (100.0%) |
Real Estate Taxes by Mortgage Status in Twiggs County
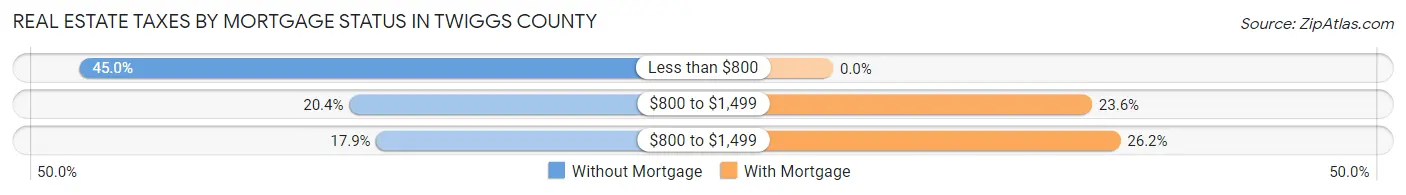
| Property Taxes | Without Mortgage | With Mortgage |
| Less than $800 | 798 (45.0%) | 0 (0.0%) |
| $800 to $1,499 | 361 (20.3%) | 191 (23.6%) |
| $800 to $1,499 | 317 (17.9%) | 212 (26.2%) |
| Total | 1,774 (100.0%) | 808 (100.0%) |
Health & Disability in Twiggs County
Health Insurance Coverage by Age in Twiggs County
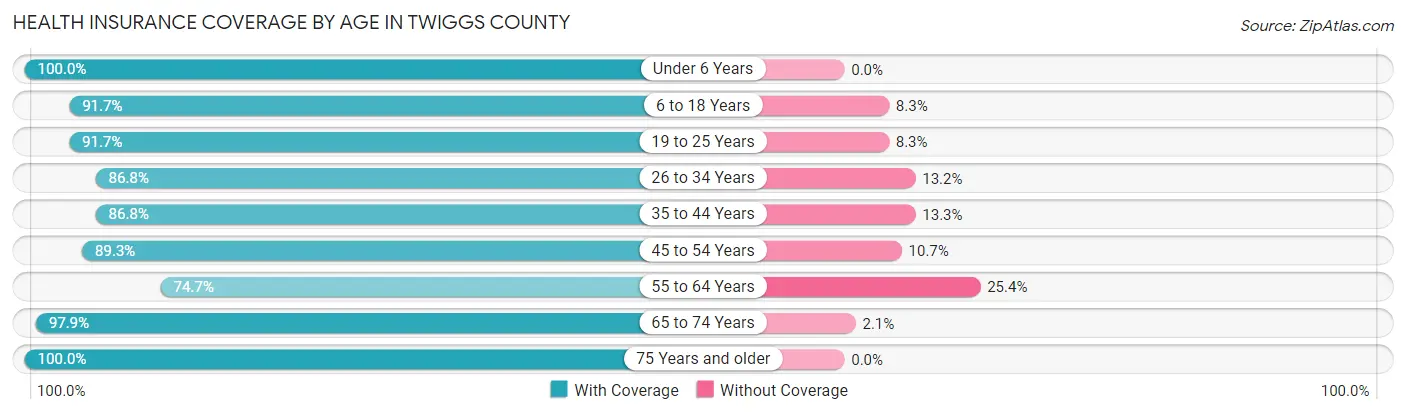
| Age Bracket | With Coverage | Without Coverage |
| Under 6 Years | 526 (100.0%) | 0 (0.0%) |
| 6 to 18 Years | 1,080 (91.7%) | 98 (8.3%) |
| 19 to 25 Years | 354 (91.7%) | 32 (8.3%) |
| 26 to 34 Years | 937 (86.8%) | 143 (13.2%) |
| 35 to 44 Years | 609 (86.8%) | 93 (13.3%) |
| 45 to 54 Years | 752 (89.3%) | 90 (10.7%) |
| 55 to 64 Years | 1,001 (74.7%) | 340 (25.4%) |
| 65 to 74 Years | 1,026 (97.9%) | 22 (2.1%) |
| 75 Years and older | 768 (100.0%) | 0 (0.0%) |
| Total | 7,053 (89.6%) | 818 (10.4%) |
Health Insurance Coverage by Citizenship Status in Twiggs County
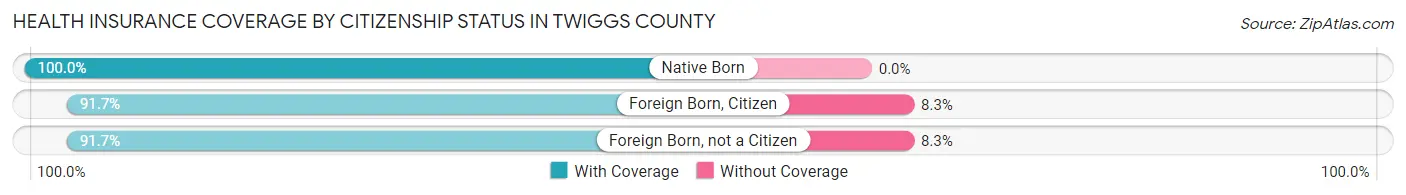
| Citizenship Status | With Coverage | Without Coverage |
| Native Born | 526 (100.0%) | 0 (0.0%) |
| Foreign Born, Citizen | 1,080 (91.7%) | 98 (8.3%) |
| Foreign Born, not a Citizen | 354 (91.7%) | 32 (8.3%) |
Health Insurance Coverage by Household Income in Twiggs County
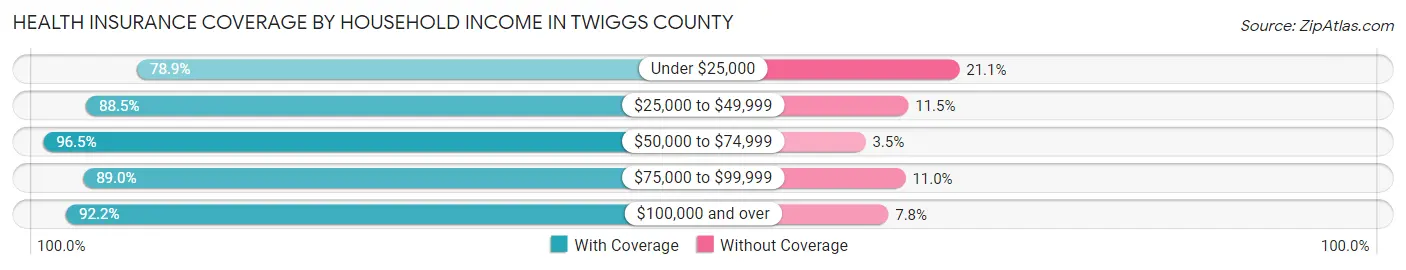
| Household Income | With Coverage | Without Coverage |
| Under $25,000 | 1,082 (78.9%) | 289 (21.1%) |
| $25,000 to $49,999 | 1,006 (88.5%) | 131 (11.5%) |
| $50,000 to $74,999 | 1,295 (96.5%) | 47 (3.5%) |
| $75,000 to $99,999 | 1,069 (89.0%) | 132 (11.0%) |
| $100,000 and over | 2,598 (92.2%) | 219 (7.8%) |
Public vs Private Health Insurance Coverage by Age in Twiggs County
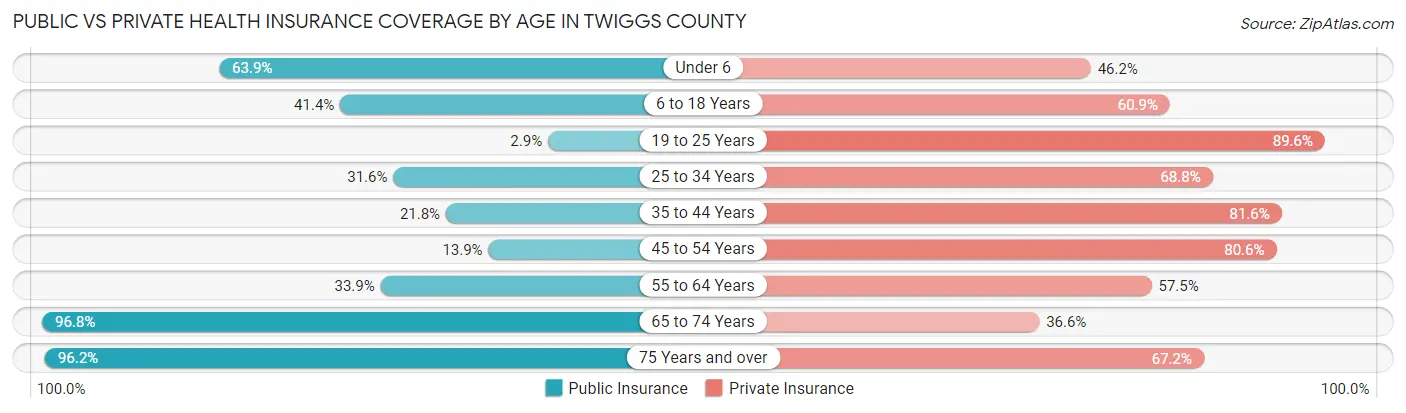
| Age Bracket | Public Insurance | Private Insurance |
| Under 6 | 336 (63.9%) | 243 (46.2%) |
| 6 to 18 Years | 488 (41.4%) | 717 (60.9%) |
| 19 to 25 Years | 11 (2.9%) | 346 (89.6%) |
| 25 to 34 Years | 341 (31.6%) | 743 (68.8%) |
| 35 to 44 Years | 153 (21.8%) | 573 (81.6%) |
| 45 to 54 Years | 117 (13.9%) | 679 (80.6%) |
| 55 to 64 Years | 455 (33.9%) | 771 (57.5%) |
| 65 to 74 Years | 1,014 (96.8%) | 384 (36.6%) |
| 75 Years and over | 739 (96.2%) | 516 (67.2%) |
| Total | 3,654 (46.4%) | 4,972 (63.2%) |
Disability Status by Sex by Age in Twiggs County
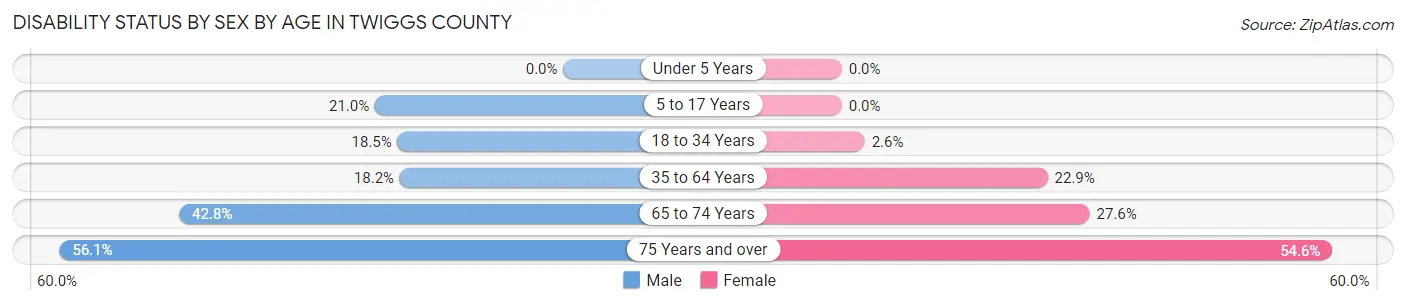
| Age Bracket | Male | Female |
| Under 5 Years | 0 (0.0%) | 0 (0.0%) |
| 5 to 17 Years | 112 (21.0%) | 0 (0.0%) |
| 18 to 34 Years | 153 (18.5%) | 21 (2.5%) |
| 35 to 64 Years | 263 (18.2%) | 330 (22.9%) |
| 65 to 74 Years | 205 (42.8%) | 157 (27.6%) |
| 75 Years and over | 206 (56.1%) | 219 (54.6%) |
Disability Class by Sex by Age in Twiggs County
Disability Class: Hearing Difficulty
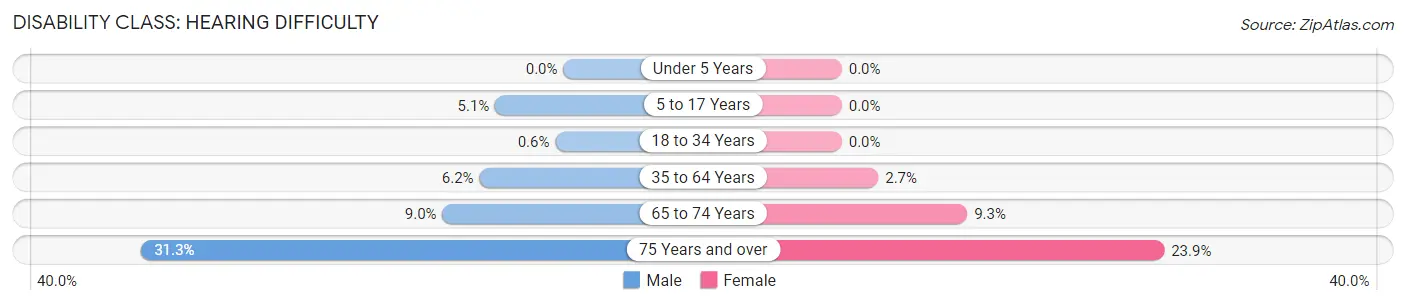
| Age Bracket | Male | Female |
| Under 5 Years | 0 (0.0%) | 0 (0.0%) |
| 5 to 17 Years | 27 (5.1%) | 0 (0.0%) |
| 18 to 34 Years | 5 (0.6%) | 0 (0.0%) |
| 35 to 64 Years | 90 (6.2%) | 39 (2.7%) |
| 65 to 74 Years | 43 (9.0%) | 53 (9.3%) |
| 75 Years and over | 115 (31.3%) | 96 (23.9%) |
Disability Class: Vision Difficulty
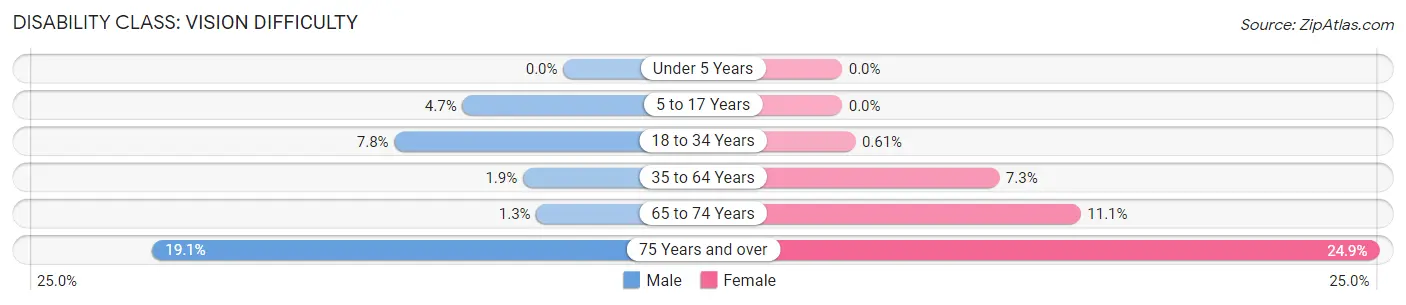
| Age Bracket | Male | Female |
| Under 5 Years | 0 (0.0%) | 0 (0.0%) |
| 5 to 17 Years | 25 (4.7%) | 0 (0.0%) |
| 18 to 34 Years | 65 (7.8%) | 5 (0.6%) |
| 35 to 64 Years | 27 (1.9%) | 105 (7.3%) |
| 65 to 74 Years | 6 (1.3%) | 63 (11.1%) |
| 75 Years and over | 70 (19.1%) | 100 (24.9%) |
Disability Class: Cognitive Difficulty
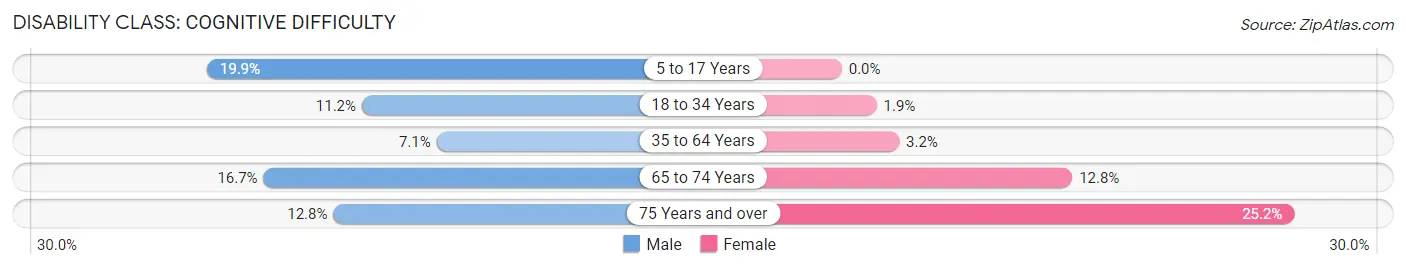
| Age Bracket | Male | Female |
| 5 to 17 Years | 106 (19.9%) | 0 (0.0%) |
| 18 to 34 Years | 93 (11.2%) | 16 (1.9%) |
| 35 to 64 Years | 102 (7.1%) | 46 (3.2%) |
| 65 to 74 Years | 80 (16.7%) | 73 (12.8%) |
| 75 Years and over | 47 (12.8%) | 101 (25.2%) |
Disability Class: Ambulatory Difficulty
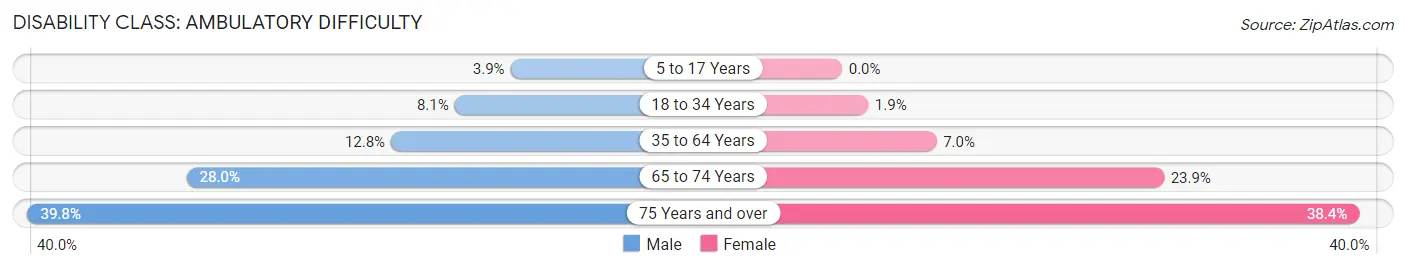
| Age Bracket | Male | Female |
| 5 to 17 Years | 21 (3.9%) | 0 (0.0%) |
| 18 to 34 Years | 67 (8.1%) | 16 (1.9%) |
| 35 to 64 Years | 185 (12.8%) | 101 (7.0%) |
| 65 to 74 Years | 134 (28.0%) | 136 (23.9%) |
| 75 Years and over | 146 (39.8%) | 154 (38.4%) |
Disability Class: Self-Care Difficulty
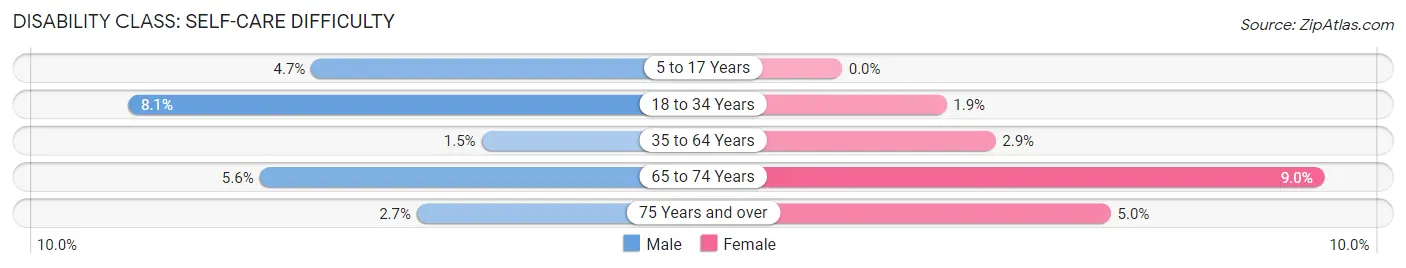
| Age Bracket | Male | Female |
| 5 to 17 Years | 25 (4.7%) | 0 (0.0%) |
| 18 to 34 Years | 67 (8.1%) | 16 (1.9%) |
| 35 to 64 Years | 22 (1.5%) | 41 (2.9%) |
| 65 to 74 Years | 27 (5.6%) | 51 (9.0%) |
| 75 Years and over | 10 (2.7%) | 20 (5.0%) |
Technology Access in Twiggs County
Computing Device Access in Twiggs County
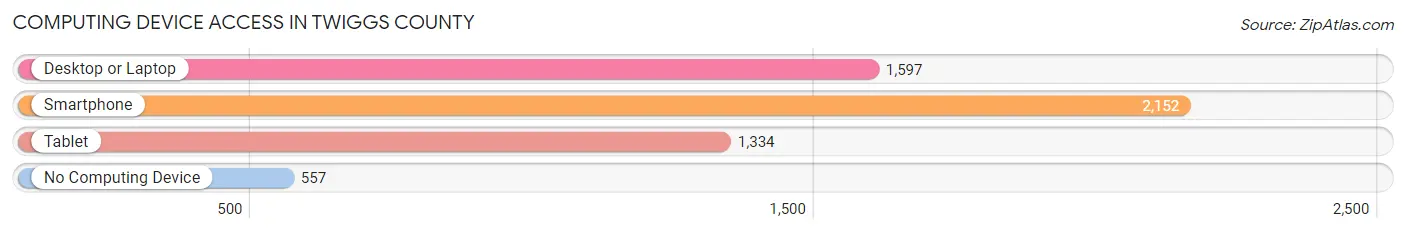
| Device Type | # Households | % Households |
| Desktop or Laptop | 1,597 | 55.1% |
| Smartphone | 2,152 | 74.2% |
| Tablet | 1,334 | 46.0% |
| No Computing Device | 557 | 19.2% |
| Total | 2,900 | 100.0% |
Internet Access in Twiggs County
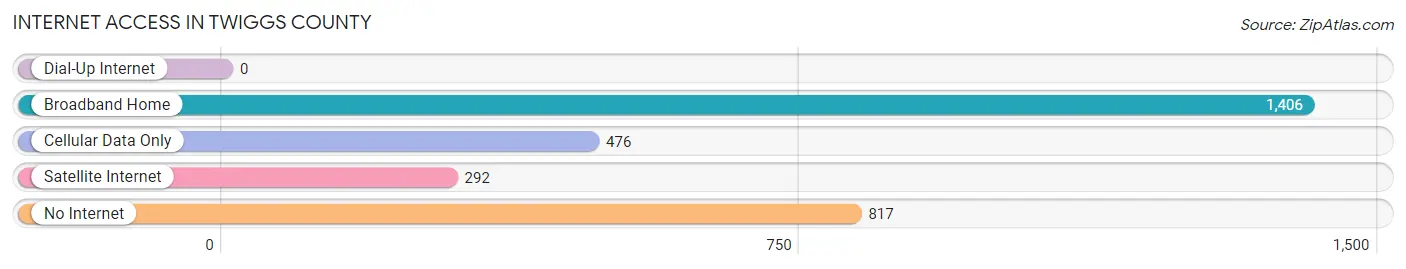
| Internet Type | # Households | % Households |
| Dial-Up Internet | 0 | 0.0% |
| Broadband Home | 1,406 | 48.5% |
| Cellular Data Only | 476 | 16.4% |
| Satellite Internet | 292 | 10.1% |
| No Internet | 817 | 28.2% |
| Total | 2,900 | 100.0% |
Twiggs County Summary
Twiggs County is located in the east-central part of the state of Georgia, in the United States. It is part of the Macon Metropolitan Statistical Area. The county was created in 1809 from parts of Wilkinson and Washington counties and was named for John Twiggs, a Revolutionary War hero. As of the 2010 census, the population was 9,023.
Geography
Twiggs County is located in the east-central part of Georgia, about 90 miles southeast of Atlanta. It is bordered by Wilkinson County to the north, Bleckley County to the east, Laurens County to the south, and Bibb and Houston counties to the west. The county has a total area of 246 square miles, of which 245 square miles is land and 1.2 square miles (0.5%) is water. The county is located in the Upper Ocmulgee River sub-basin of the Altamaha River basin.
The county is mostly flat, with some rolling hills in the northern part. The Ocmulgee River forms the western border of the county, and the Little Ocmulgee River forms the eastern border. The county is home to several small lakes, including Lake Sinclair, Lake Tobesofkee, and Lake Juliette.
Demographics
As of the 2010 census, there were 9,023 people, 3,093 households, and 2,220 families residing in the county. The population density was 37 people per square mile. There were 3,521 housing units at an average density of 14 per square mile. The racial makeup of the county was 63.2% White, 33.2% Black or African American, 0.3% Native American, 0.3% Asian, 0.1% Pacific Islander, 1.7% from other races, and 1.2% from two or more races. 3.2% of the population were Hispanic or Latino of any race.
Economy
The economy of Twiggs County is largely based on agriculture. The county is home to several large farms, including the Georgia-Pacific Corporation's Pinehurst Farms, which produces cotton, corn, and soybeans. Other crops grown in the county include peanuts, pecans, and hay.
The county is also home to several manufacturing companies, including the Georgia-Pacific Corporation's paper mill in Jeffersonville, which produces paper products. Other industries in the county include food processing, wood products, and metal fabrication.
Twiggs County is home to several tourist attractions, including the Ocmulgee National Monument, which is located in the county seat of Jeffersonville. The monument is a National Historic Landmark and is home to a variety of Native American artifacts. Other attractions in the county include the Little Ocmulgee State Park and Lodge, which offers camping, fishing, and other outdoor activities.
Conclusion
Twiggs County is a rural county located in the east-central part of Georgia. It is home to a variety of agricultural and manufacturing industries, as well as several tourist attractions. The county has a population of 9,023, as of the 2010 census, and is part of the Macon Metropolitan Statistical Area.
Common Questions
What is Per Capita Income in Twiggs County?
Per Capita income in Twiggs County is $32,105.
What is the Median Family Income in Twiggs County?
Median Family Income in Twiggs County is $73,500.
What is the Median Household income in Twiggs County?
Median Household Income in Twiggs County is $50,446.
What is Income or Wage Gap in Twiggs County?
Income or Wage Gap in Twiggs County is 18.2%.
Women in Twiggs County earn 81.8 cents for every dollar earned by a man.
What is Inequality or Gini Index in Twiggs County?
Inequality or Gini Index in Twiggs County is 0.54.
What is the Total Population of Twiggs County?
Total Population of Twiggs County is 7,955.
What is the Total Male Population of Twiggs County?
Total Male Population of Twiggs County is 3,881.
What is the Total Female Population of Twiggs County?
Total Female Population of Twiggs County is 4,074.
What is the Ratio of Males per 100 Females in Twiggs County?
There are 95.26 Males per 100 Females in Twiggs County.
What is the Ratio of Females per 100 Males in Twiggs County?
There are 104.97 Females per 100 Males in Twiggs County.
What is the Median Population Age in Twiggs County?
Median Population Age in Twiggs County is 45.9 Years.
What is the Average Family Size in Twiggs County
Average Family Size in Twiggs County is 3.6 People.
What is the Average Household Size in Twiggs County
Average Household Size in Twiggs County is 2.7 People.
How Large is the Labor Force in Twiggs County?
There are 2,858 People in the Labor Forcein in Twiggs County.
What is the Percentage of People in the Labor Force in Twiggs County?
43.3% of People are in the Labor Force in Twiggs County.
What is the Unemployment Rate in Twiggs County?
Unemployment Rate in Twiggs County is 3.4%.