Taliaferro County, GA Map & Demographics
Taliaferro County Map
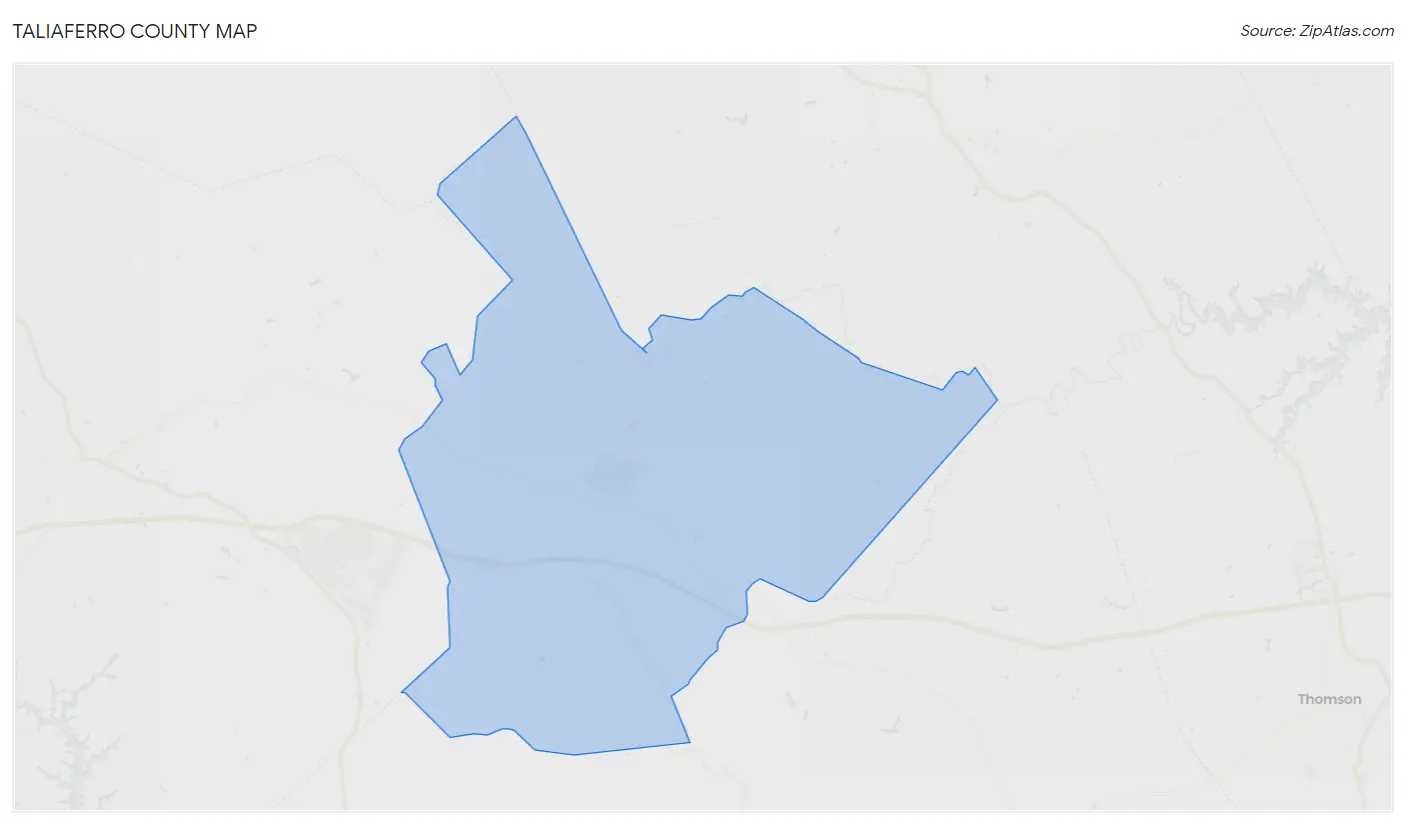
Taliaferro County Overview
$24,766
PER CAPITA INCOME
$45,903
AVG FAMILY INCOME
$45,881
AVG HOUSEHOLD INCOME
16.5%
WAGE / INCOME GAP [ % ]
83.5¢/ $1
WAGE / INCOME GAP [ $ ]
0.38
INEQUALITY / GINI INDEX
1,635
TOTAL POPULATION
734
MALE POPULATION
901
FEMALE POPULATION
81.47
MALES / 100 FEMALES
122.75
FEMALES / 100 MALES
47.2
MEDIAN AGE
3.2
AVG FAMILY SIZE
2.5
AVG HOUSEHOLD SIZE
698
LABOR FORCE [ PEOPLE ]
49.7%
PERCENT IN LABOR FORCE
4.0%
UNEMPLOYMENT RATE
Taliaferro County Area Codes
Income in Taliaferro County
Income Overview in Taliaferro County
Per Capita Income in Taliaferro County is $24,766, while median incomes of families and households are $45,903 and $45,881 respectively.
| Characteristic | Number | Measure |
| Per Capita Income | 1,635 | $24,766 |
| Median Family Income | 390 | $45,903 |
| Mean Family Income | 390 | $60,527 |
| Median Household Income | 643 | $45,881 |
| Mean Household Income | 643 | $54,144 |
| Income Deficit | 390 | $0 |
| Wage / Income Gap (%) | 1,635 | 16.49% |
| Wage / Income Gap ($) | 1,635 | 83.51¢ per $1 |
| Gini / Inequality Index | 1,635 | 0.38 |
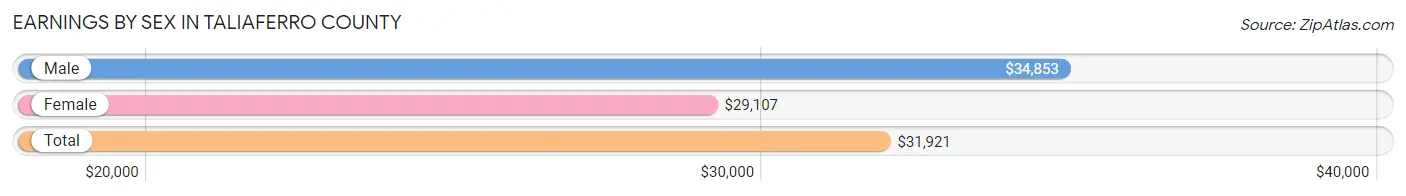
Earnings by Sex in Taliaferro County
Average Earnings in Taliaferro County are $31,921, $34,853 for men and $29,107 for women, a difference of 16.5%.
| Sex | Number | Average Earnings |
| Male | 348 (47.6%) | $34,853 |
| Female | 383 (52.4%) | $29,107 |
| Total | 731 (100.0%) | $31,921 |
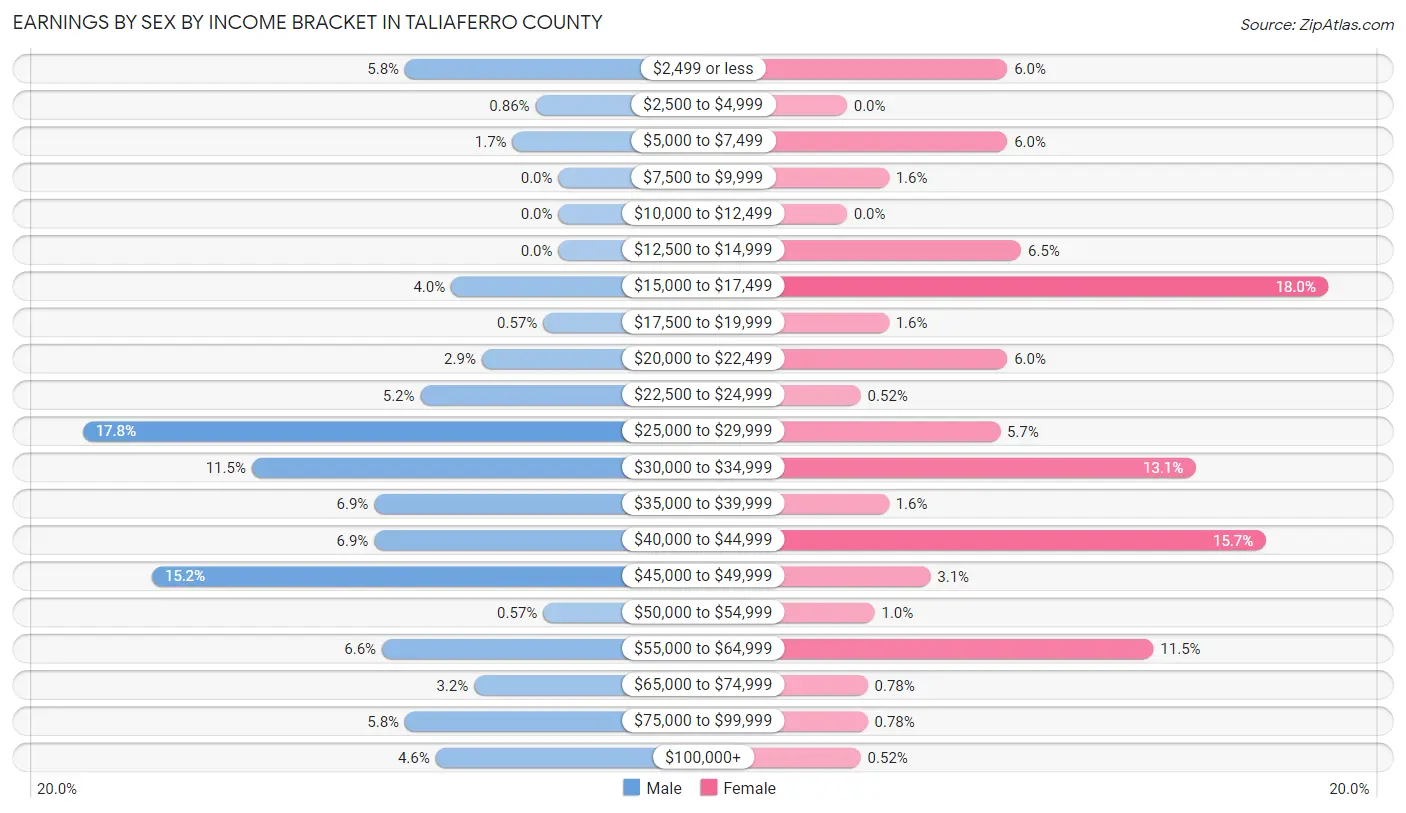
Earnings by Sex by Income Bracket in Taliaferro County
The most common earnings brackets in Taliaferro County are $25,000 to $29,999 for men (62 | 17.8%) and $15,000 to $17,499 for women (69 | 18.0%).
| Income | Male | Female |
| $2,499 or less | 20 (5.8%) | 23 (6.0%) |
| $2,500 to $4,999 | 3 (0.9%) | 0 (0.0%) |
| $5,000 to $7,499 | 6 (1.7%) | 23 (6.0%) |
| $7,500 to $9,999 | 0 (0.0%) | 6 (1.6%) |
| $10,000 to $12,499 | 0 (0.0%) | 0 (0.0%) |
| $12,500 to $14,999 | 0 (0.0%) | 25 (6.5%) |
| $15,000 to $17,499 | 14 (4.0%) | 69 (18.0%) |
| $17,500 to $19,999 | 2 (0.6%) | 6 (1.6%) |
| $20,000 to $22,499 | 10 (2.9%) | 23 (6.0%) |
| $22,500 to $24,999 | 18 (5.2%) | 2 (0.5%) |
| $25,000 to $29,999 | 62 (17.8%) | 22 (5.7%) |
| $30,000 to $34,999 | 40 (11.5%) | 50 (13.1%) |
| $35,000 to $39,999 | 24 (6.9%) | 6 (1.6%) |
| $40,000 to $44,999 | 24 (6.9%) | 60 (15.7%) |
| $45,000 to $49,999 | 53 (15.2%) | 12 (3.1%) |
| $50,000 to $54,999 | 2 (0.6%) | 4 (1.0%) |
| $55,000 to $64,999 | 23 (6.6%) | 44 (11.5%) |
| $65,000 to $74,999 | 11 (3.2%) | 3 (0.8%) |
| $75,000 to $99,999 | 20 (5.8%) | 3 (0.8%) |
| $100,000+ | 16 (4.6%) | 2 (0.5%) |
| Total | 348 (100.0%) | 383 (100.0%) |
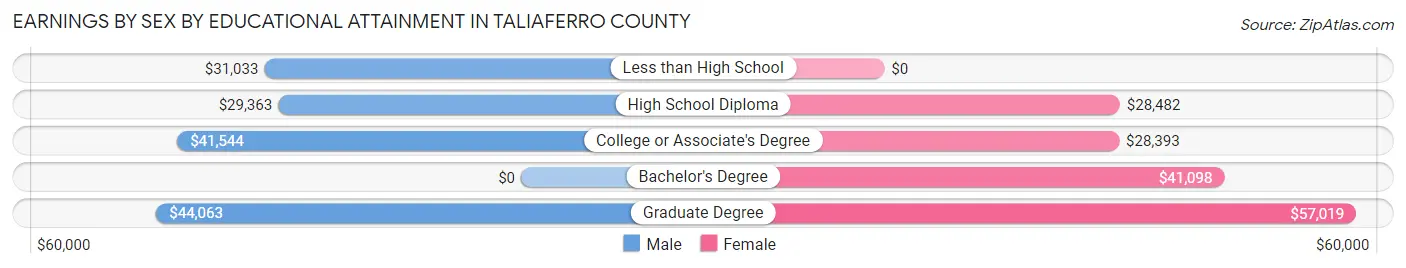
Earnings by Sex by Educational Attainment in Taliaferro County
Average earnings in Taliaferro County are $32,500 for men and $30,486 for women, a difference of 6.2%. Men with an educational attainment of graduate degree enjoy the highest average annual earnings of $44,063, while those with high school diploma education earn the least with $29,363. Women with an educational attainment of graduate degree earn the most with the average annual earnings of $57,019, while those with college or associate's degree education have the smallest earnings of $28,393.
| Educational Attainment | Male Income | Female Income |
| Less than High School | $31,033 | $0 |
| High School Diploma | $29,363 | $28,482 |
| College or Associate's Degree | $41,544 | $28,393 |
| Bachelor's Degree | - | - |
| Graduate Degree | $44,063 | $57,019 |
| Total | $32,500 | $30,486 |
Family Income in Taliaferro County
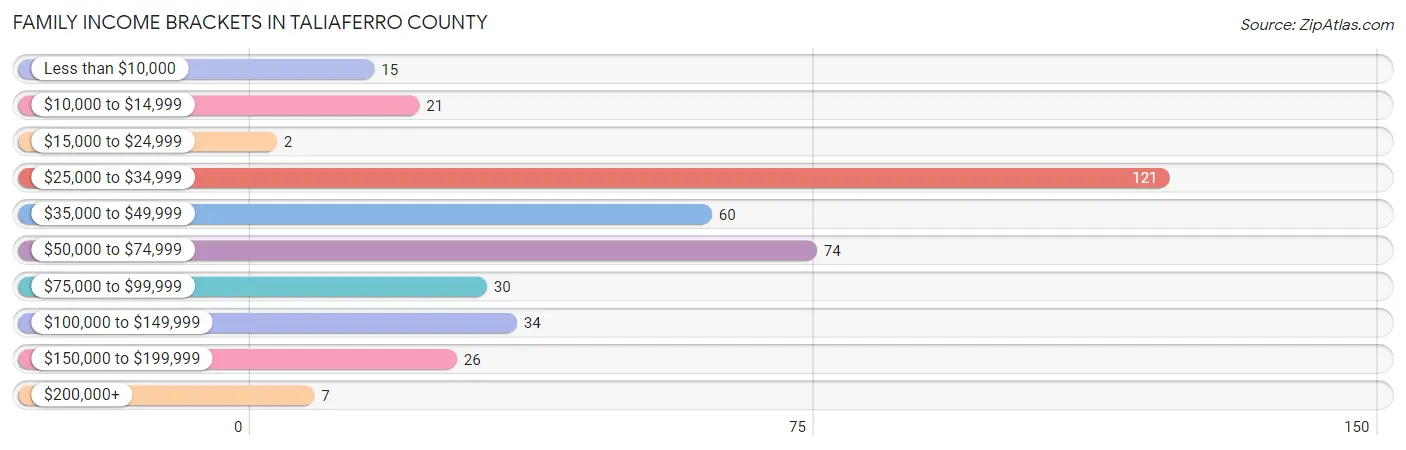
Family Income Brackets in Taliaferro County
According to the Taliaferro County family income data, there are 121 families falling into the $25,000 to $34,999 income range, which is the most common income bracket and makes up 31.0% of all families. Conversely, the $15,000 to $24,999 income bracket is the least frequent group with only 2 families (0.5%) belonging to this category.
| Income Bracket | # Families | % Families |
| Less than $10,000 | 15 | 3.8% |
| $10,000 to $14,999 | 21 | 5.4% |
| $15,000 to $24,999 | 2 | 0.5% |
| $25,000 to $34,999 | 121 | 31.0% |
| $35,000 to $49,999 | 60 | 15.4% |
| $50,000 to $74,999 | 74 | 19.0% |
| $75,000 to $99,999 | 30 | 7.7% |
| $100,000 to $149,999 | 34 | 8.7% |
| $150,000 to $199,999 | 26 | 6.7% |
| $200,000+ | 7 | 1.8% |
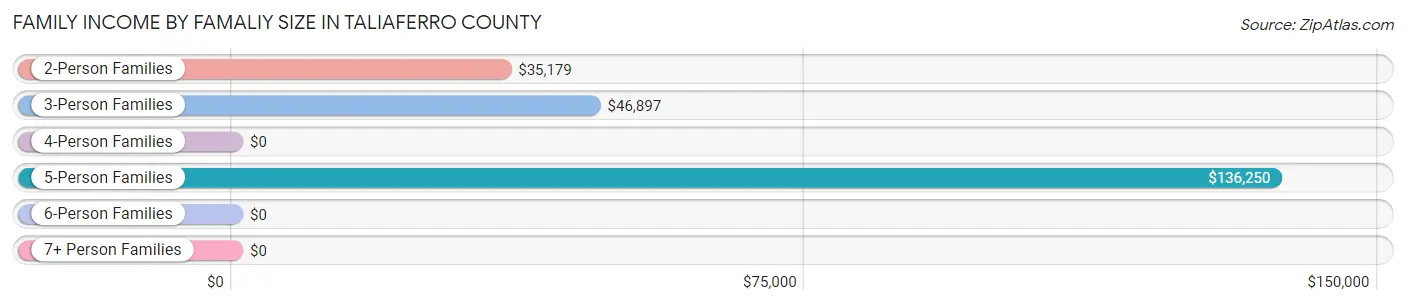
Family Income by Famaliy Size in Taliaferro County
5-person families (25 | 6.4%) account for the highest median family income in Taliaferro County with $136,250 per family, while 5-person families (25 | 6.4%) have the highest median income of $27,250 per family member.
| Income Bracket | # Families | Median Income |
| 2-Person Families | 201 (51.5%) | $35,179 |
| 3-Person Families | 66 (16.9%) | $46,897 |
| 4-Person Families | 92 (23.6%) | $0 |
| 5-Person Families | 25 (6.4%) | $136,250 |
| 6-Person Families | 6 (1.5%) | $0 |
| 7+ Person Families | 0 (0.0%) | $0 |
| Total | 390 (100.0%) | $45,903 |
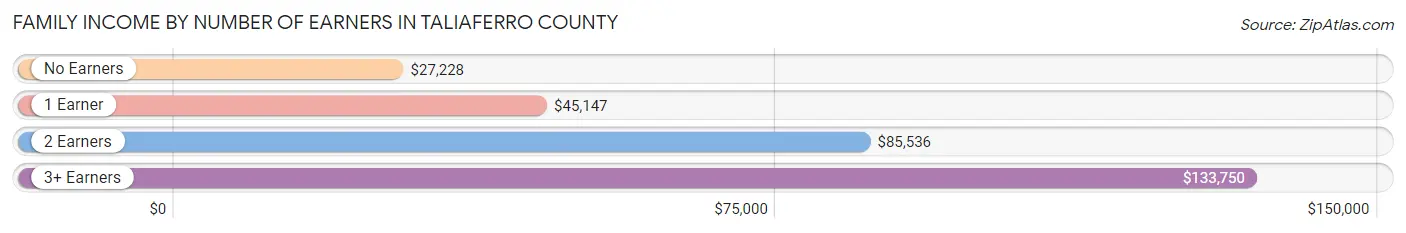
Family Income by Number of Earners in Taliaferro County
The median family income in Taliaferro County is $45,903, with families comprising 3+ earners (12) having the highest median family income of $133,750, while families with no earners (107) have the lowest median family income of $27,228, accounting for 3.1% and 27.4% of families, respectively.
| Number of Earners | # Families | Median Income |
| No Earners | 107 (27.4%) | $27,228 |
| 1 Earner | 166 (42.6%) | $45,147 |
| 2 Earners | 105 (26.9%) | $85,536 |
| 3+ Earners | 12 (3.1%) | $133,750 |
| Total | 390 (100.0%) | $45,903 |
Household Income in Taliaferro County
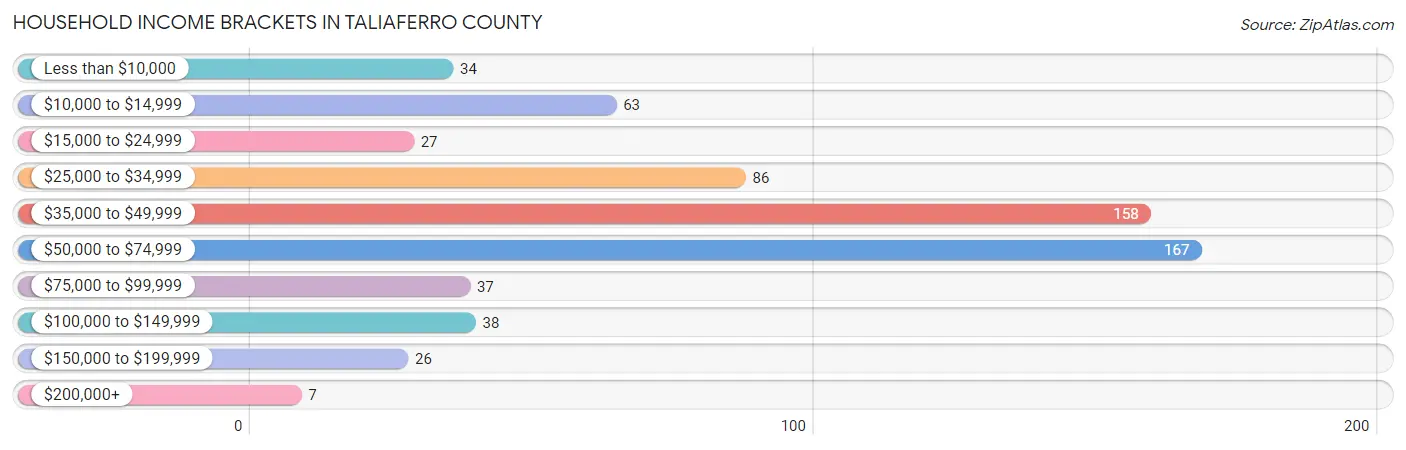
Household Income Brackets in Taliaferro County
With 167 households falling in the category, the $50,000 to $74,999 income range is the most frequent in Taliaferro County, accounting for 26.0% of all households. In contrast, only 7 households (1.1%) fall into the $200,000+ income bracket, making it the least populous group.
| Income Bracket | # Households | % Households |
| Less than $10,000 | 34 | 5.3% |
| $10,000 to $14,999 | 63 | 9.8% |
| $15,000 to $24,999 | 27 | 4.2% |
| $25,000 to $34,999 | 86 | 13.4% |
| $35,000 to $49,999 | 158 | 24.6% |
| $50,000 to $74,999 | 167 | 26.0% |
| $75,000 to $99,999 | 37 | 5.8% |
| $100,000 to $149,999 | 38 | 5.9% |
| $150,000 to $199,999 | 26 | 4.0% |
| $200,000+ | 7 | 1.1% |
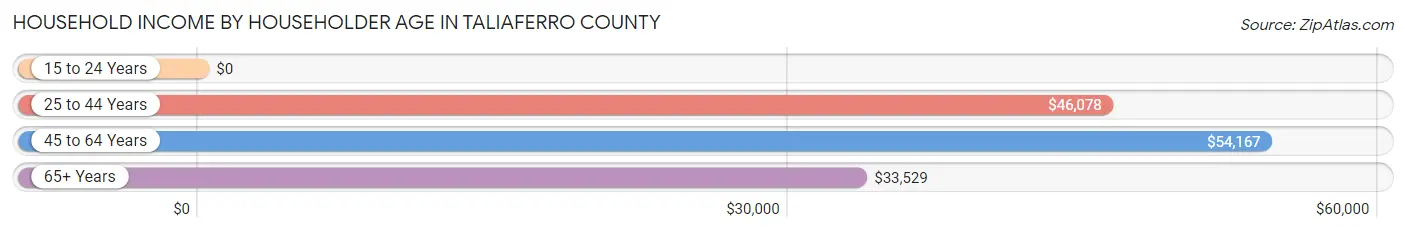
Household Income by Householder Age in Taliaferro County
The median household income in Taliaferro County is $45,881, with the highest median household income of $54,167 found in the 45 to 64 years age bracket for the primary householder. A total of 234 households (36.4%) fall into this category. Meanwhile, the 15 to 24 years age bracket for the primary householder has the lowest median household income of $0, with 29 households (4.5%) in this group.
| Income Bracket | # Households | Median Income |
| 15 to 24 Years | 29 (4.5%) | $0 |
| 25 to 44 Years | 138 (21.5%) | $46,078 |
| 45 to 64 Years | 234 (36.4%) | $54,167 |
| 65+ Years | 242 (37.6%) | $33,529 |
| Total | 643 (100.0%) | $45,881 |
Poverty in Taliaferro County
Income Below Poverty by Sex and Age in Taliaferro County
With 22.2% poverty level for males and 16.2% for females among the residents of Taliaferro County, 15 year old males and 75 year old and over females are the most vulnerable to poverty, with 6 males (50.0%) and 63 females (39.6%) in their respective age groups living below the poverty level.
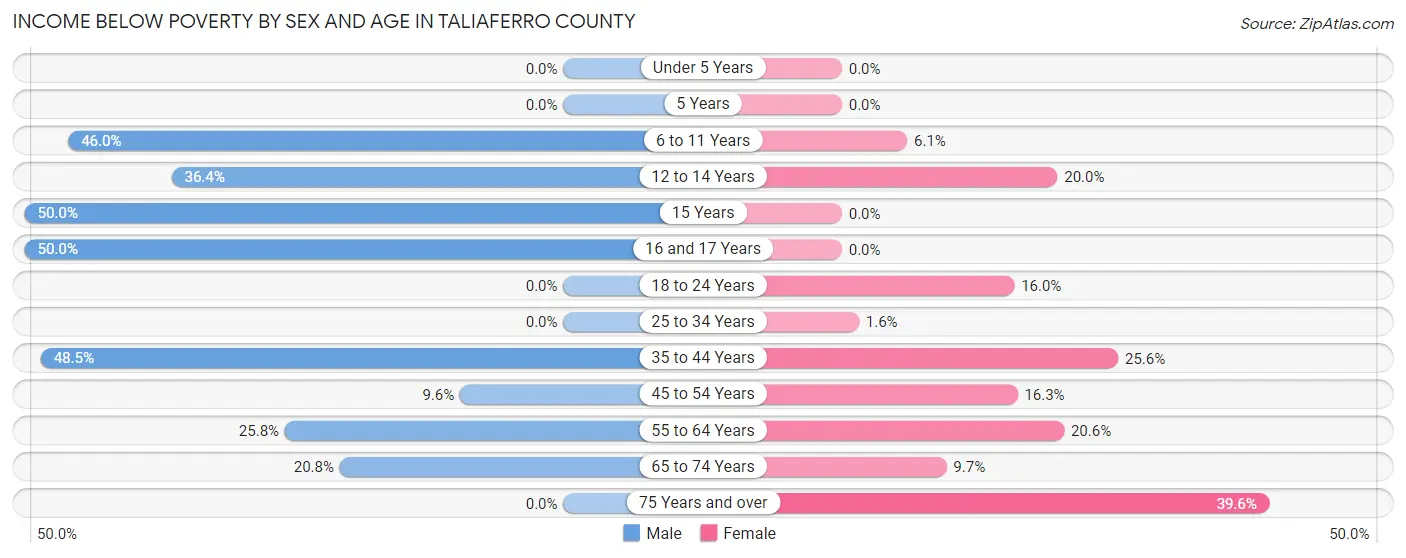
| Age Bracket | Male | Female |
| Under 5 Years | 0 (0.0%) | 0 (0.0%) |
| 5 Years | 0 (0.0%) | 0 (0.0%) |
| 6 to 11 Years | 17 (46.0%) | 4 (6.1%) |
| 12 to 14 Years | 4 (36.4%) | 5 (20.0%) |
| 15 Years | 6 (50.0%) | 0 (0.0%) |
| 16 and 17 Years | 3 (50.0%) | 0 (0.0%) |
| 18 to 24 Years | 0 (0.0%) | 8 (16.0%) |
| 25 to 34 Years | 0 (0.0%) | 3 (1.6%) |
| 35 to 44 Years | 81 (48.5%) | 10 (25.6%) |
| 45 to 54 Years | 7 (9.6%) | 22 (16.3%) |
| 55 to 64 Years | 23 (25.8%) | 20 (20.6%) |
| 65 to 74 Years | 22 (20.7%) | 10 (9.7%) |
| 75 Years and over | 0 (0.0%) | 63 (39.6%) |
| Total | 163 (22.2%) | 145 (16.2%) |
Income Above Poverty by Sex and Age in Taliaferro County
According to the poverty statistics in Taliaferro County, males aged under 5 years and females aged under 5 years are the age groups that are most secure financially, with 100.0% of males and 100.0% of females in these age groups living above the poverty line.
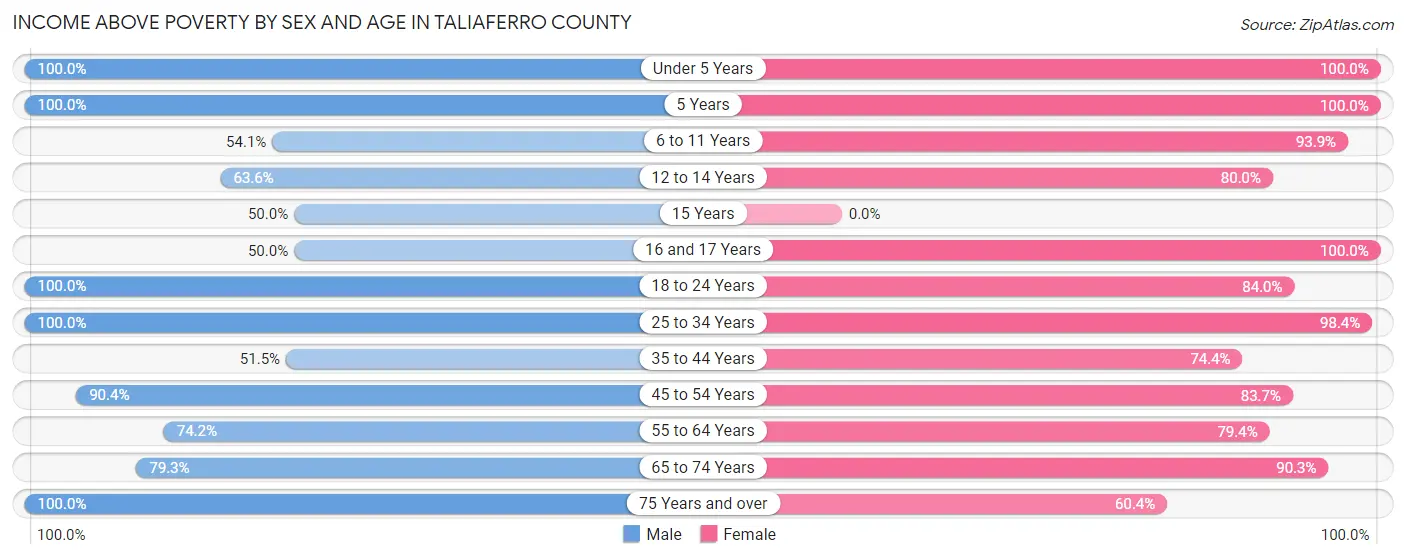
| Age Bracket | Male | Female |
| Under 5 Years | 41 (100.0%) | 26 (100.0%) |
| 5 Years | 7 (100.0%) | 6 (100.0%) |
| 6 to 11 Years | 20 (54.0%) | 62 (93.9%) |
| 12 to 14 Years | 7 (63.6%) | 20 (80.0%) |
| 15 Years | 6 (50.0%) | 0 (0.0%) |
| 16 and 17 Years | 3 (50.0%) | 2 (100.0%) |
| 18 to 24 Years | 46 (100.0%) | 42 (84.0%) |
| 25 to 34 Years | 53 (100.0%) | 187 (98.4%) |
| 35 to 44 Years | 86 (51.5%) | 29 (74.4%) |
| 45 to 54 Years | 66 (90.4%) | 113 (83.7%) |
| 55 to 64 Years | 66 (74.2%) | 77 (79.4%) |
| 65 to 74 Years | 84 (79.2%) | 93 (90.3%) |
| 75 Years and over | 86 (100.0%) | 96 (60.4%) |
| Total | 571 (77.8%) | 753 (83.9%) |
Income Below Poverty Among Married-Couple Families in Taliaferro County
The poverty statistics for married-couple families in Taliaferro County show that 2.2% or 4 of the total 178 families live below the poverty line. Families with no children have the highest poverty rate of 3.3%, comprising of 4 families. On the other hand, families with 1 or 2 children have the lowest poverty rate of 0.0%, which includes 0 families.
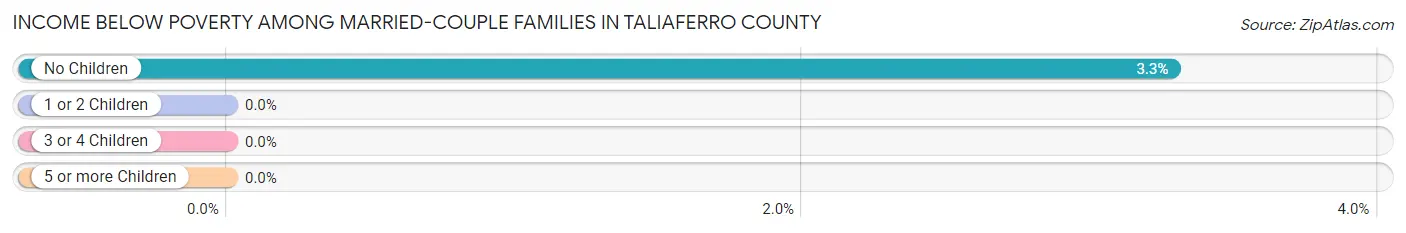
| Children | Above Poverty | Below Poverty |
| No Children | 118 (96.7%) | 4 (3.3%) |
| 1 or 2 Children | 56 (100.0%) | 0 (0.0%) |
| 3 or 4 Children | 0 (0.0%) | 0 (0.0%) |
| 5 or more Children | 0 (0.0%) | 0 (0.0%) |
| Total | 174 (97.8%) | 4 (2.2%) |
Income Below Poverty Among Single-Parent Households in Taliaferro County
According to the poverty data in Taliaferro County, 55.0% or 60 single-father households and 24.3% or 25 single-mother households are living below the poverty line. Among single-father households, those with 3 or 4 children have the highest poverty rate, with 51 households (100.0%) experiencing poverty. Likewise, among single-mother households, those with no children have the highest poverty rate, with 22 households (26.2%) falling below the poverty line.
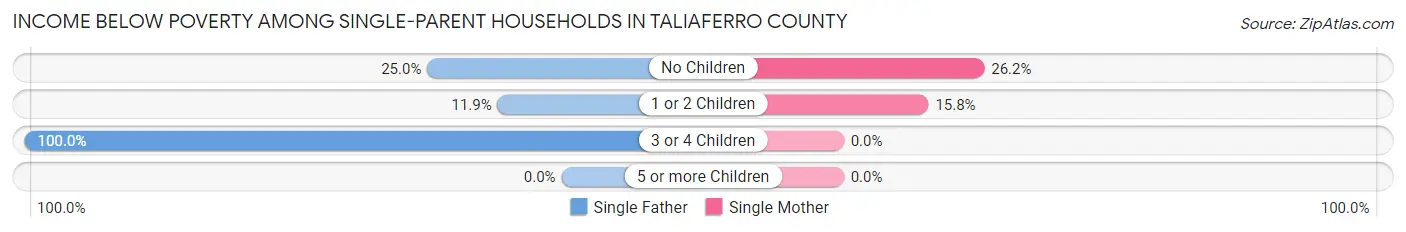
| Children | Single Father | Single Mother |
| No Children | 4 (25.0%) | 22 (26.2%) |
| 1 or 2 Children | 5 (11.9%) | 3 (15.8%) |
| 3 or 4 Children | 51 (100.0%) | 0 (0.0%) |
| 5 or more Children | 0 (0.0%) | 0 (0.0%) |
| Total | 60 (55.0%) | 25 (24.3%) |
Income Below Poverty Among Married-Couple vs Single-Parent Households in Taliaferro County
The poverty data for Taliaferro County shows that 4 of the married-couple family households (2.2%) and 85 of the single-parent households (40.1%) are living below the poverty level. Within the married-couple family households, those with no children have the highest poverty rate, with 4 households (3.3%) falling below the poverty line. Among the single-parent households, those with 3 or 4 children have the highest poverty rate, with 51 household (100.0%) living below poverty.
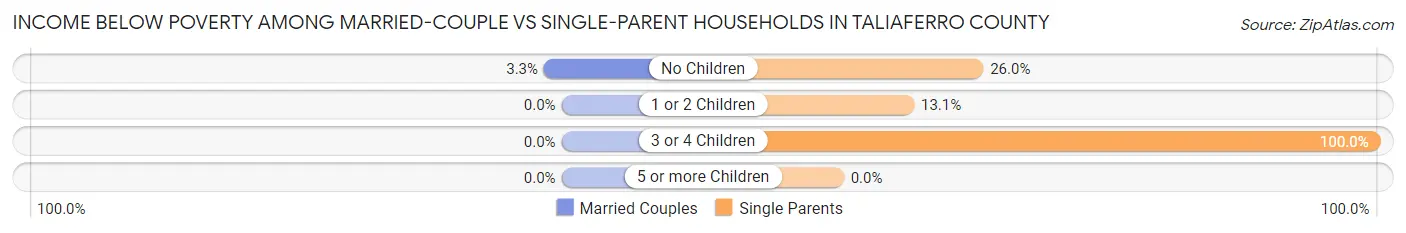
| Children | Married-Couple Families | Single-Parent Households |
| No Children | 4 (3.3%) | 26 (26.0%) |
| 1 or 2 Children | 0 (0.0%) | 8 (13.1%) |
| 3 or 4 Children | 0 (0.0%) | 51 (100.0%) |
| 5 or more Children | 0 (0.0%) | 0 (0.0%) |
| Total | 4 (2.2%) | 85 (40.1%) |
Race in Taliaferro County
The most populous races in Taliaferro County are Black / African American (822 | 50.3%), White / Caucasian (599 | 36.6%), and Some other Race (117 | 7.2%).
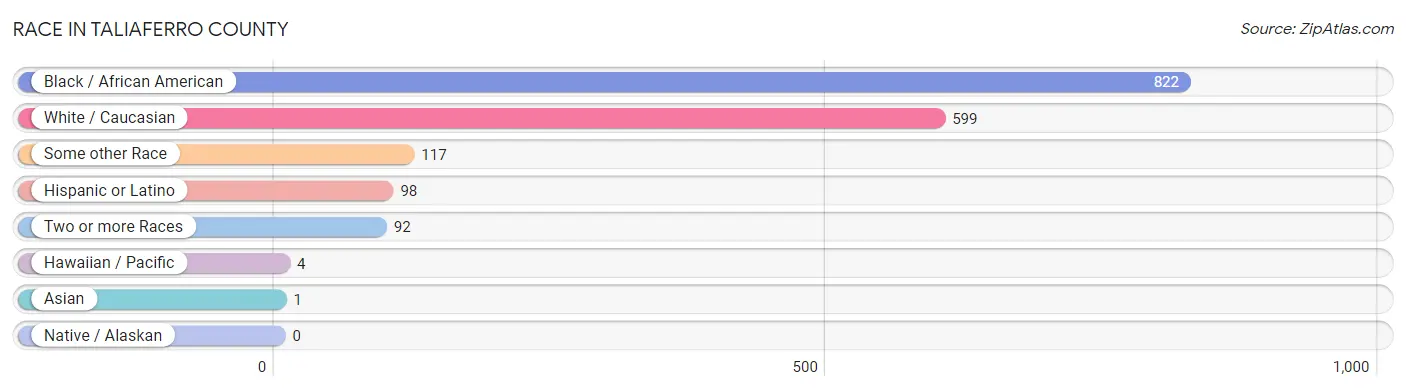
| Race | # Population | % Population |
| Asian | 1 | 0.1% |
| Black / African American | 822 | 50.3% |
| Hawaiian / Pacific | 4 | 0.2% |
| Hispanic or Latino | 98 | 6.0% |
| Native / Alaskan | 0 | 0.0% |
| White / Caucasian | 599 | 36.6% |
| Two or more Races | 92 | 5.6% |
| Some other Race | 117 | 7.2% |
| Total | 1,635 | 100.0% |
Ancestry in Taliaferro County
The most populous ancestries reported in Taliaferro County are English (153 | 9.4%), Mexican (74 | 4.5%), Irish (71 | 4.3%), American (67 | 4.1%), and Italian (52 | 3.2%), together accounting for 25.5% of all Taliaferro County residents.
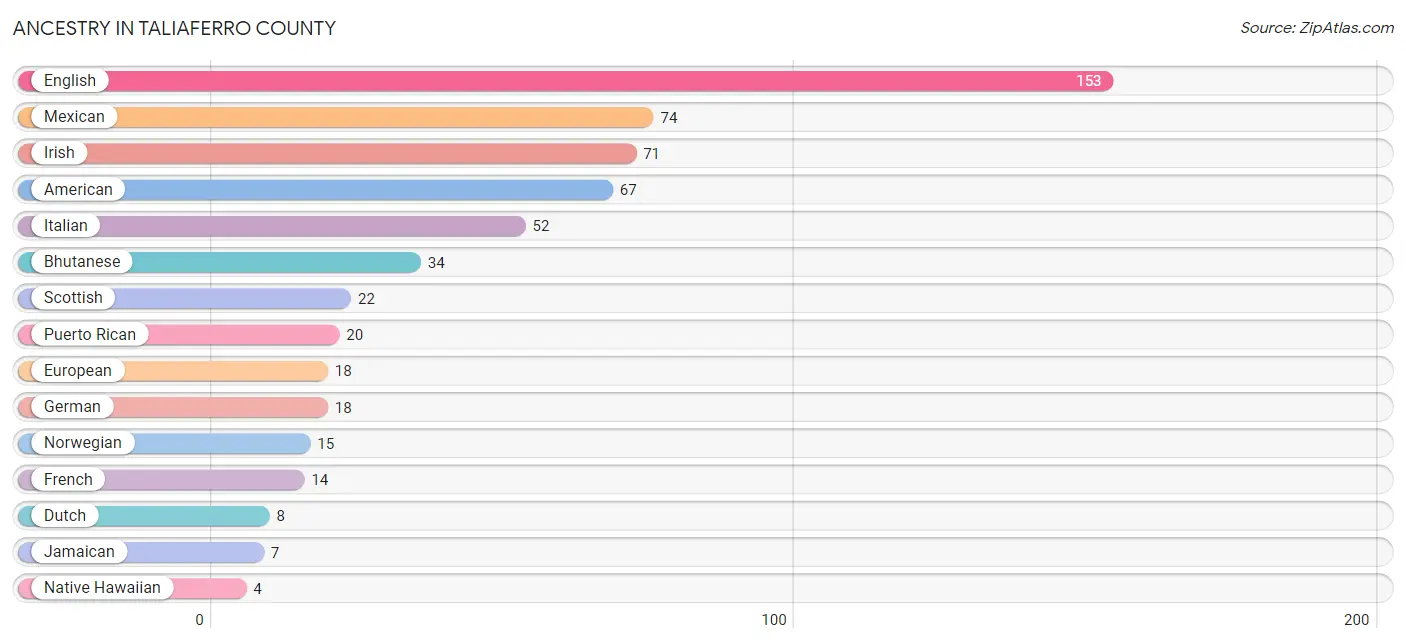
| Ancestry | # Population | % Population |
| African | 3 | 0.2% |
| American | 67 | 4.1% |
| Bhutanese | 34 | 2.1% |
| Burmese | 1 | 0.1% |
| Dutch | 8 | 0.5% |
| English | 153 | 9.4% |
| European | 18 | 1.1% |
| French | 14 | 0.9% |
| German | 18 | 1.1% |
| Irish | 71 | 4.3% |
| Italian | 52 | 3.2% |
| Jamaican | 7 | 0.4% |
| Mexican | 74 | 4.5% |
| Native Hawaiian | 4 | 0.2% |
| Norwegian | 15 | 0.9% |
| Polish | 2 | 0.1% |
| Puerto Rican | 20 | 1.2% |
| Scottish | 22 | 1.3% |
| Spanish | 4 | 0.2% |
| Subsaharan African | 3 | 0.2% | View All 20 Rows |
Immigrants in Taliaferro County
The most numerous immigrant groups reported in Taliaferro County came from Latin America (38 | 2.3%), Central America (31 | 1.9%), Mexico (31 | 1.9%), Caribbean (7 | 0.4%), and Jamaica (7 | 0.4%), together accounting for 7.0% of all Taliaferro County residents.
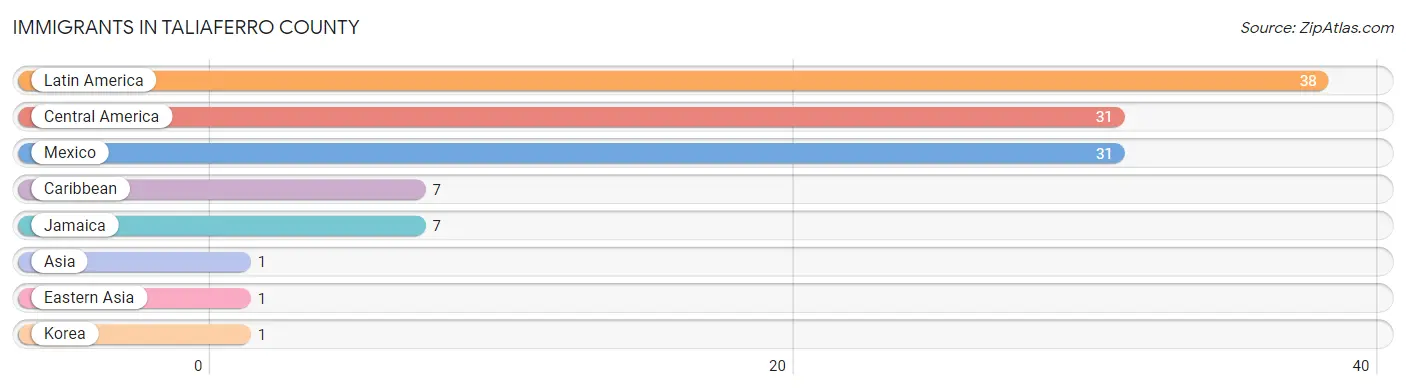
| Immigration Origin | # Population | % Population |
| Asia | 1 | 0.1% |
| Caribbean | 7 | 0.4% |
| Central America | 31 | 1.9% |
| Eastern Asia | 1 | 0.1% |
| Jamaica | 7 | 0.4% |
| Korea | 1 | 0.1% |
| Latin America | 38 | 2.3% |
| Mexico | 31 | 1.9% | View All 8 Rows |
Sex and Age in Taliaferro County
Sex and Age in Taliaferro County
The most populous age groups in Taliaferro County are 40 to 44 Years (109 | 14.8%) for men and 25 to 29 Years (117 | 13.0%) for women.
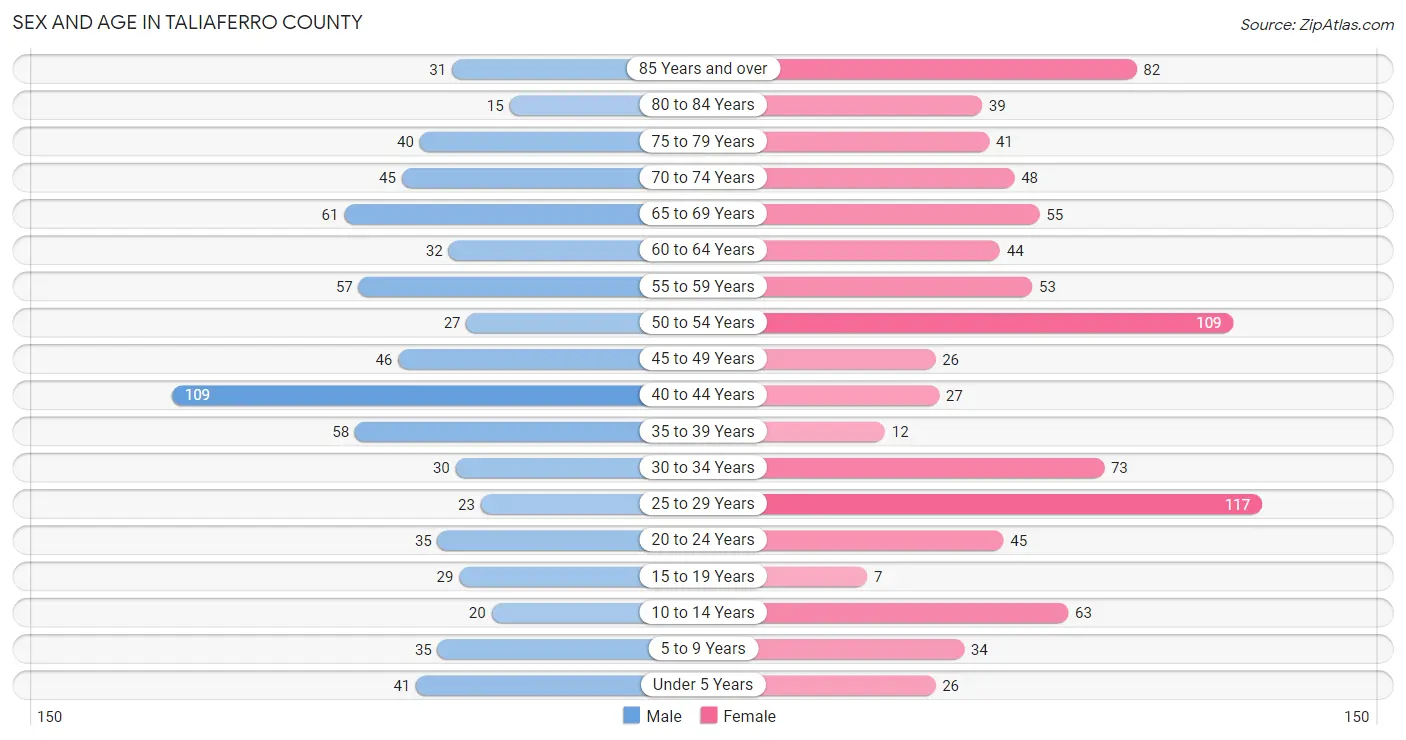
| Age Bracket | Male | Female |
| Under 5 Years | 41 (5.6%) | 26 (2.9%) |
| 5 to 9 Years | 35 (4.8%) | 34 (3.8%) |
| 10 to 14 Years | 20 (2.7%) | 63 (7.0%) |
| 15 to 19 Years | 29 (4.0%) | 7 (0.8%) |
| 20 to 24 Years | 35 (4.8%) | 45 (5.0%) |
| 25 to 29 Years | 23 (3.1%) | 117 (13.0%) |
| 30 to 34 Years | 30 (4.1%) | 73 (8.1%) |
| 35 to 39 Years | 58 (7.9%) | 12 (1.3%) |
| 40 to 44 Years | 109 (14.8%) | 27 (3.0%) |
| 45 to 49 Years | 46 (6.3%) | 26 (2.9%) |
| 50 to 54 Years | 27 (3.7%) | 109 (12.1%) |
| 55 to 59 Years | 57 (7.8%) | 53 (5.9%) |
| 60 to 64 Years | 32 (4.4%) | 44 (4.9%) |
| 65 to 69 Years | 61 (8.3%) | 55 (6.1%) |
| 70 to 74 Years | 45 (6.1%) | 48 (5.3%) |
| 75 to 79 Years | 40 (5.4%) | 41 (4.5%) |
| 80 to 84 Years | 15 (2.0%) | 39 (4.3%) |
| 85 Years and over | 31 (4.2%) | 82 (9.1%) |
| Total | 734 (100.0%) | 901 (100.0%) |
Families and Households in Taliaferro County
Median Family Size in Taliaferro County
The median family size in Taliaferro County is 3.25 persons per family, with single female/mother families (103 | 26.4%) accounting for the largest median family size of 3.85 persons per family. On the other hand, single male/father families (109 | 28.0%) represent the smallest median family size with 2.52 persons per family.
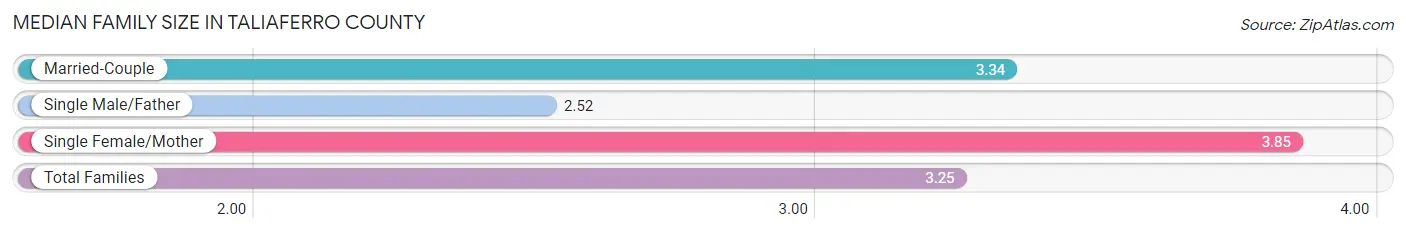
| Family Type | # Families | Family Size |
| Married-Couple | 178 (45.6%) | 3.34 |
| Single Male/Father | 109 (28.0%) | 2.52 |
| Single Female/Mother | 103 (26.4%) | 3.85 |
| Total Families | 390 (100.0%) | 3.25 |
Median Household Size in Taliaferro County
The median household size in Taliaferro County is 2.54 persons per household, with single female/mother households (103 | 16.0%) accounting for the largest median household size of 4.04 persons per household. non-family households (253 | 39.4%) represent the smallest median household size with 1.05 persons per household.
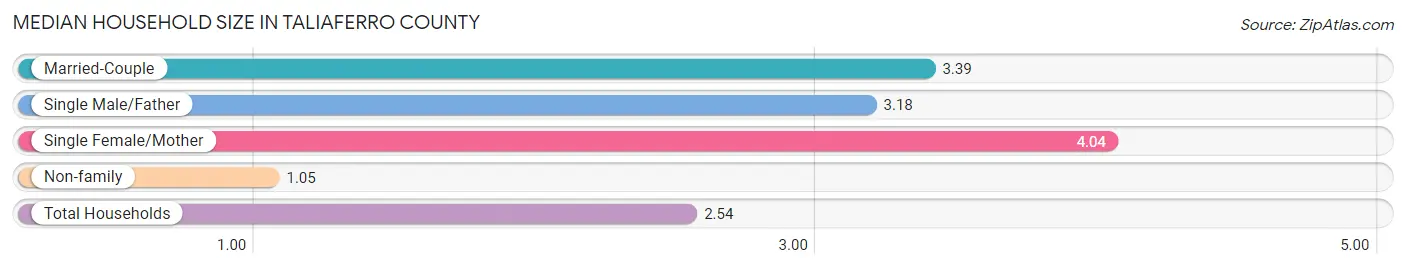
| Household Type | # Households | Household Size |
| Married-Couple | 178 (27.7%) | 3.39 |
| Single Male/Father | 109 (17.0%) | 3.18 |
| Single Female/Mother | 103 (16.0%) | 4.04 |
| Non-family | 253 (39.4%) | 1.05 |
| Total Households | 643 (100.0%) | 2.54 |
Household Size by Marriage Status in Taliaferro County
Out of a total of 643 households in Taliaferro County, 390 (60.7%) are family households, while 253 (39.4%) are nonfamily households. The most numerous type of family households are 2-person households, comprising 184, and the most common type of nonfamily households are 1-person households, comprising 242.
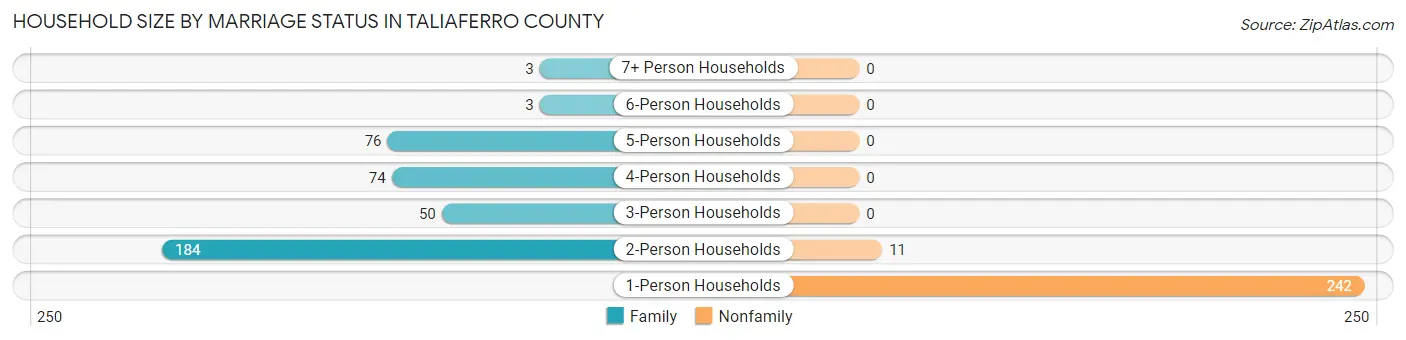
| Household Size | Family Households | Nonfamily Households |
| 1-Person Households | - | 242 (37.6%) |
| 2-Person Households | 184 (28.6%) | 11 (1.7%) |
| 3-Person Households | 50 (7.8%) | 0 (0.0%) |
| 4-Person Households | 74 (11.5%) | 0 (0.0%) |
| 5-Person Households | 76 (11.8%) | 0 (0.0%) |
| 6-Person Households | 3 (0.5%) | 0 (0.0%) |
| 7+ Person Households | 3 (0.5%) | 0 (0.0%) |
| Total | 390 (60.7%) | 253 (39.4%) |
Female Fertility in Taliaferro County
Fertility by Age in Taliaferro County
| Age Bracket | Women with Births | Births / 1,000 Women |
| 15 to 19 years | 0 (0.0%) | 0.0 |
| 20 to 34 years | 0 (0.0%) | 0.0 |
| 35 to 50 years | 0 (0.0%) | 0.0 |
| Total | 0 (0.0%) | 0.0 |
Fertility by Age by Marriage Status in Taliaferro County
| Age Bracket | Married | Unmarried |
| 15 to 19 years | 0 (0.0%) | 0 (0.0%) |
| 20 to 34 years | 0 (0.0%) | 0 (0.0%) |
| 35 to 50 years | 0 (0.0%) | 0 (0.0%) |
| Total | 0 (0.0%) | 0 (0.0%) |
Fertility by Education in Taliaferro County
| Educational Attainment | Women with Births | Births / 1,000 Women |
| Less than High School | 0 (0.0%) | 0.0 |
| High School Diploma | 0 (0.0%) | 0.0 |
| College or Associate's Degree | 0 (0.0%) | 0.0 |
| Bachelor's Degree | 0 (0.0%) | 0.0 |
| Graduate Degree | 0 (0.0%) | 0.0 |
| Total | 0 (0.0%) | 0.0 |
Fertility by Education by Marriage Status in Taliaferro County
| Educational Attainment | Married | Unmarried |
| Less than High School | 0 (0.0%) | 0 (0.0%) |
| High School Diploma | 0 (0.0%) | 0 (0.0%) |
| College or Associate's Degree | 0 (0.0%) | 0 (0.0%) |
| Bachelor's Degree | 0 (0.0%) | 0 (0.0%) |
| Graduate Degree | 0 (0.0%) | 0 (0.0%) |
| Total | 0 (0.0%) | 0 (0.0%) |
Employment Characteristics in Taliaferro County
Employment by Class of Employer in Taliaferro County
Among the 670 employed individuals in Taliaferro County, private company employees (382 | 57.0%), local government employees (104 | 15.5%), and state government employees (80 | 11.9%) make up the most common classes of employment.
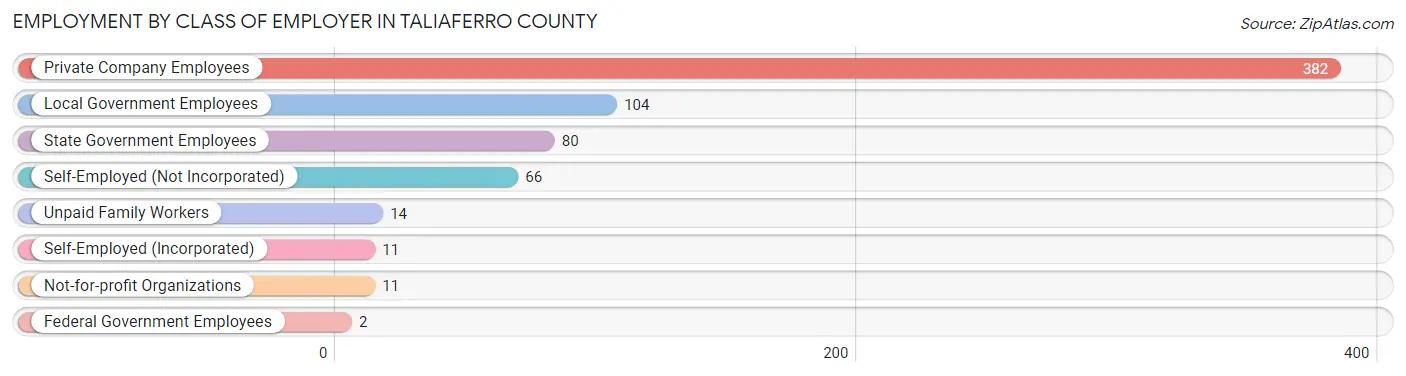
| Employer Class | # Employees | % Employees |
| Private Company Employees | 382 | 57.0% |
| Self-Employed (Incorporated) | 11 | 1.6% |
| Self-Employed (Not Incorporated) | 66 | 9.9% |
| Not-for-profit Organizations | 11 | 1.6% |
| Local Government Employees | 104 | 15.5% |
| State Government Employees | 80 | 11.9% |
| Federal Government Employees | 2 | 0.3% |
| Unpaid Family Workers | 14 | 2.1% |
| Total | 670 | 100.0% |
Employment Status by Age in Taliaferro County
According to the labor force statistics for Taliaferro County, out of the total population over 16 years of age (1,404), 49.7% or 698 individuals are in the labor force, with 4.0% or 28 of them unemployed. The age group with the highest labor force participation rate is 25 to 29 years, with 98.6% or 138 individuals in the labor force. Within the labor force, the 55 to 59 years age range has the highest percentage of unemployed individuals, with 10.0% or 4 of them being unemployed.
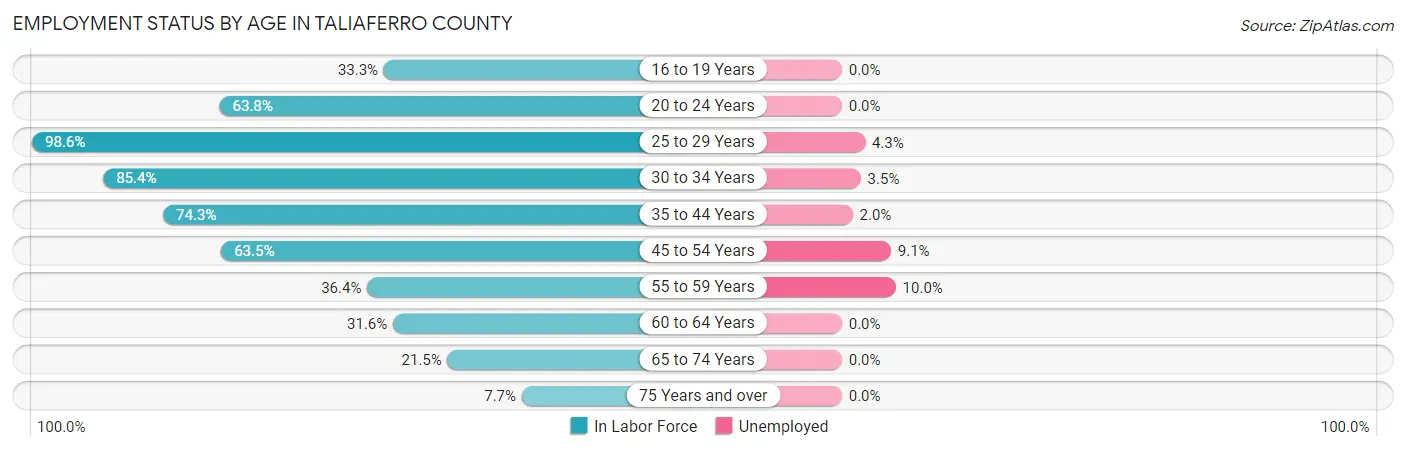
| Age Bracket | In Labor Force | Unemployed |
| 16 to 19 Years | 8 (33.3%) | 0 (0.0%) |
| 20 to 24 Years | 51 (63.8%) | 0 (0.0%) |
| 25 to 29 Years | 138 (98.6%) | 6 (4.3%) |
| 30 to 34 Years | 88 (85.4%) | 3 (3.5%) |
| 35 to 44 Years | 153 (74.3%) | 3 (2.0%) |
| 45 to 54 Years | 132 (63.5%) | 12 (9.1%) |
| 55 to 59 Years | 40 (36.4%) | 4 (10.0%) |
| 60 to 64 Years | 24 (31.6%) | 0 (0.0%) |
| 65 to 74 Years | 45 (21.5%) | 0 (0.0%) |
| 75 Years and over | 19 (7.7%) | 0 (0.0%) |
| Total | 698 (49.7%) | 28 (4.0%) |
Employment Status by Educational Attainment in Taliaferro County
According to labor force statistics for Taliaferro County, 68.2% of individuals (575) out of the total population between 25 and 64 years of age (843) are in the labor force, with 4.9% or 28 of them being unemployed. The group with the highest labor force participation rate are those with the educational attainment of bachelor's degree or higher, with 88.4% or 84 individuals in the labor force. Within the labor force, individuals with high school diploma education have the highest percentage of unemployment, with 8.7% or 21 of them being unemployed.
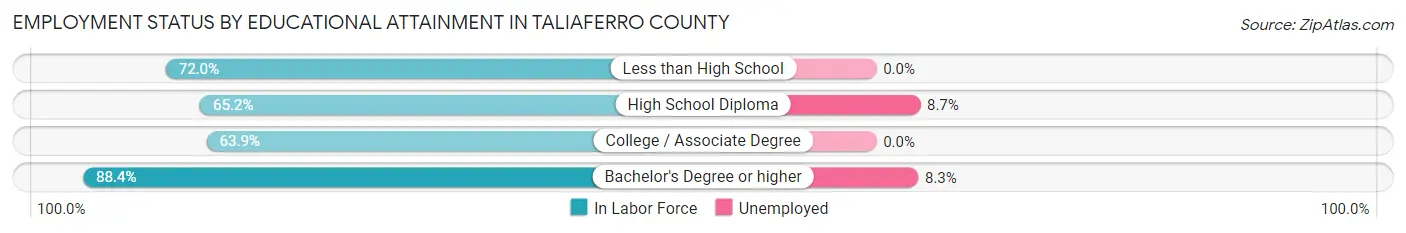
| Educational Attainment | In Labor Force | Unemployed |
| Less than High School | 72 (72.0%) | 0 (0.0%) |
| High School Diploma | 244 (65.2%) | 33 (8.7%) |
| College / Associate Degree | 175 (63.9%) | 0 (0.0%) |
| Bachelor's Degree or higher | 84 (88.4%) | 8 (8.3%) |
| Total | 575 (68.2%) | 41 (4.9%) |
Employment Occupations by Sex in Taliaferro County
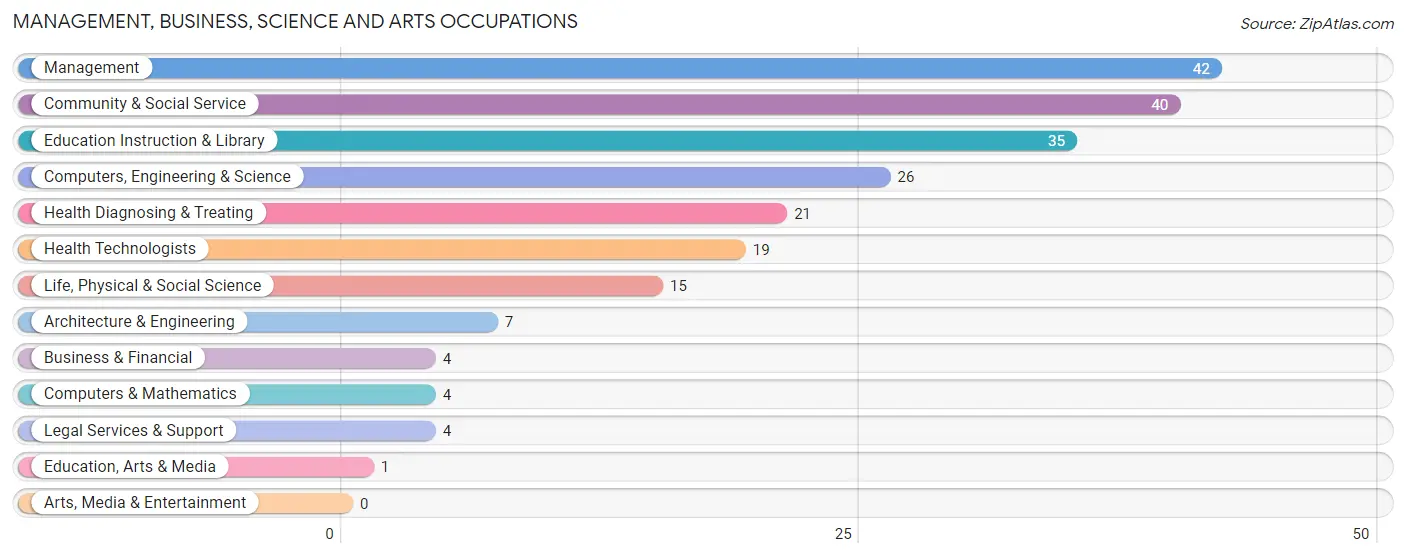
Management, Business, Science and Arts Occupations
The most common Management, Business, Science and Arts occupations in Taliaferro County are Management (42 | 6.3%), Community & Social Service (40 | 6.0%), Education Instruction & Library (35 | 5.2%), Computers, Engineering & Science (26 | 3.9%), and Health Diagnosing & Treating (21 | 3.1%).
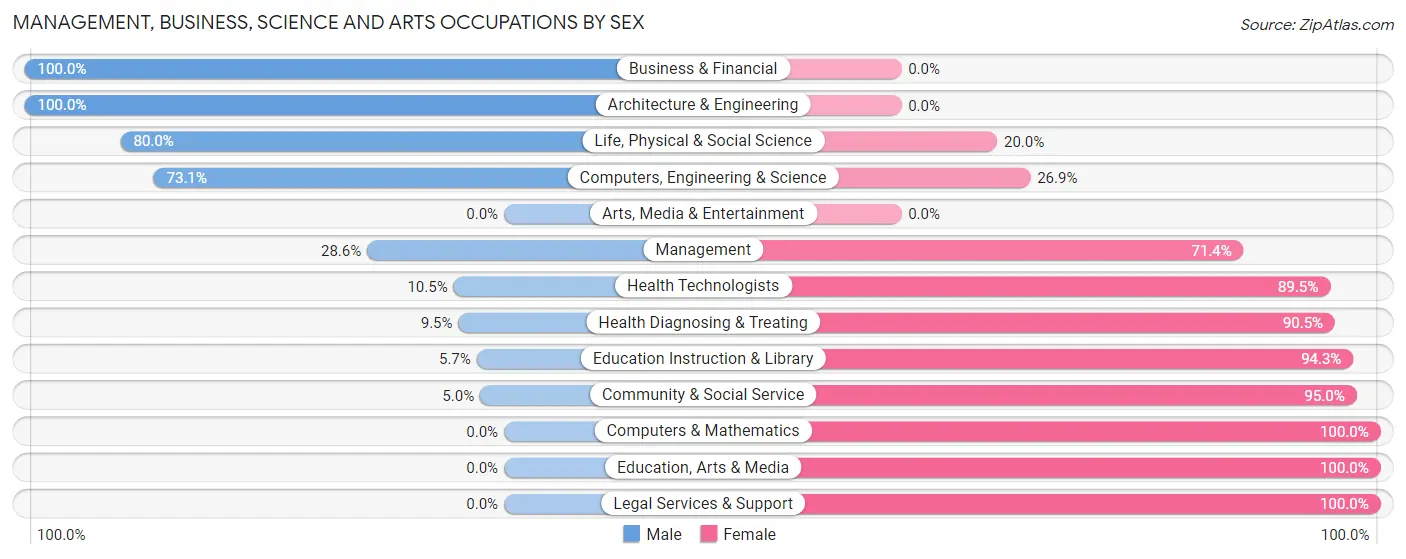
Management, Business, Science and Arts Occupations by Sex
Within the Management, Business, Science and Arts occupations in Taliaferro County, the most male-oriented occupations are Business & Financial (100.0%), Architecture & Engineering (100.0%), and Life, Physical & Social Science (80.0%), while the most female-oriented occupations are Computers & Mathematics (100.0%), Education, Arts & Media (100.0%), and Legal Services & Support (100.0%).
| Occupation | Male | Female |
| Management | 12 (28.6%) | 30 (71.4%) |
| Business & Financial | 4 (100.0%) | 0 (0.0%) |
| Computers, Engineering & Science | 19 (73.1%) | 7 (26.9%) |
| Computers & Mathematics | 0 (0.0%) | 4 (100.0%) |
| Architecture & Engineering | 7 (100.0%) | 0 (0.0%) |
| Life, Physical & Social Science | 12 (80.0%) | 3 (20.0%) |
| Community & Social Service | 2 (5.0%) | 38 (95.0%) |
| Education, Arts & Media | 0 (0.0%) | 1 (100.0%) |
| Legal Services & Support | 0 (0.0%) | 4 (100.0%) |
| Education Instruction & Library | 2 (5.7%) | 33 (94.3%) |
| Arts, Media & Entertainment | 0 (0.0%) | 0 (0.0%) |
| Health Diagnosing & Treating | 2 (9.5%) | 19 (90.5%) |
| Health Technologists | 2 (10.5%) | 17 (89.5%) |
| Total (Category) | 39 (29.3%) | 94 (70.7%) |
| Total (Overall) | 316 (47.3%) | 352 (52.7%) |
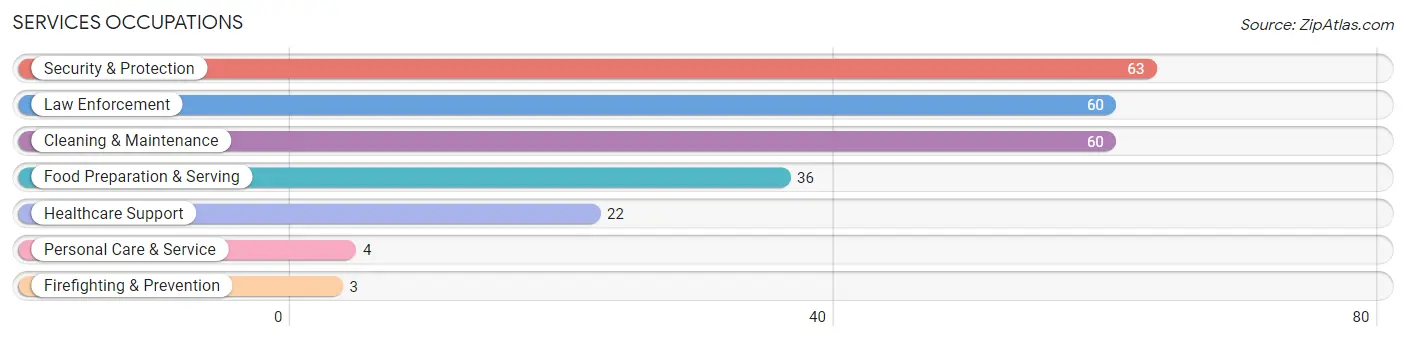
Services Occupations
The most common Services occupations in Taliaferro County are Security & Protection (63 | 9.4%), Law Enforcement (60 | 9.0%), Cleaning & Maintenance (60 | 9.0%), Food Preparation & Serving (36 | 5.4%), and Healthcare Support (22 | 3.3%).
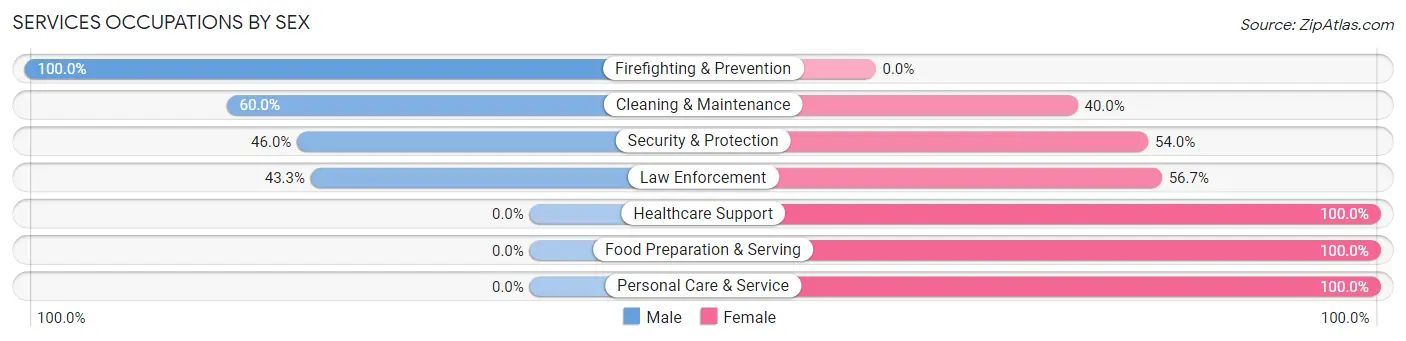
Services Occupations by Sex
Within the Services occupations in Taliaferro County, the most male-oriented occupations are Firefighting & Prevention (100.0%), Cleaning & Maintenance (60.0%), and Security & Protection (46.0%), while the most female-oriented occupations are Healthcare Support (100.0%), Food Preparation & Serving (100.0%), and Personal Care & Service (100.0%).
| Occupation | Male | Female |
| Healthcare Support | 0 (0.0%) | 22 (100.0%) |
| Security & Protection | 29 (46.0%) | 34 (54.0%) |
| Firefighting & Prevention | 3 (100.0%) | 0 (0.0%) |
| Law Enforcement | 26 (43.3%) | 34 (56.7%) |
| Food Preparation & Serving | 0 (0.0%) | 36 (100.0%) |
| Cleaning & Maintenance | 36 (60.0%) | 24 (40.0%) |
| Personal Care & Service | 0 (0.0%) | 4 (100.0%) |
| Total (Category) | 65 (35.1%) | 120 (64.9%) |
| Total (Overall) | 316 (47.3%) | 352 (52.7%) |
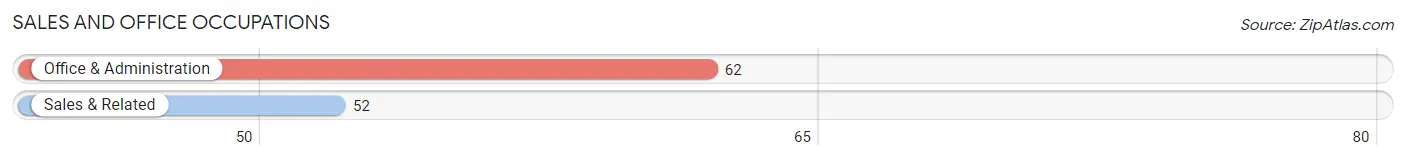
Sales and Office Occupations
The most common Sales and Office occupations in Taliaferro County are Office & Administration (62 | 9.3%), and Sales & Related (52 | 7.8%).
Sales and Office Occupations by Sex
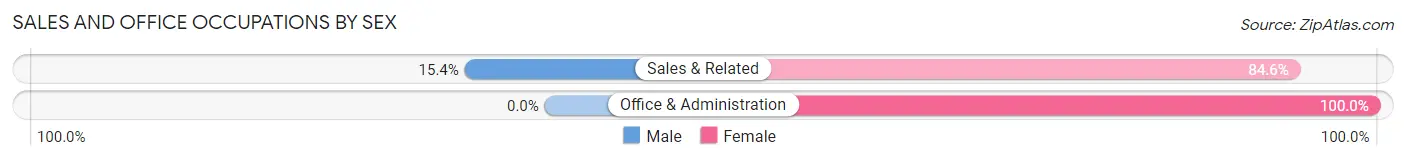
| Occupation | Male | Female |
| Sales & Related | 8 (15.4%) | 44 (84.6%) |
| Office & Administration | 0 (0.0%) | 62 (100.0%) |
| Total (Category) | 8 (7.0%) | 106 (93.0%) |
| Total (Overall) | 316 (47.3%) | 352 (52.7%) |
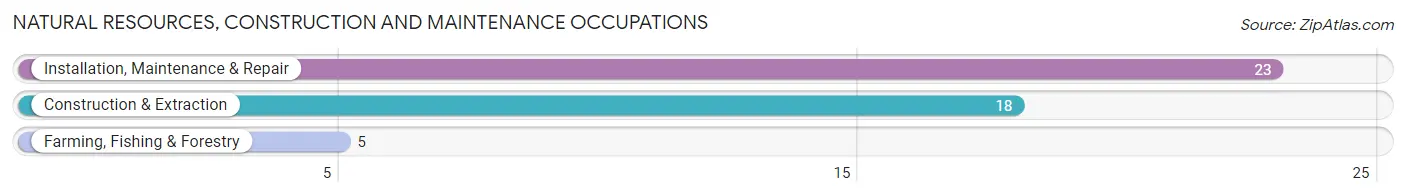
Natural Resources, Construction and Maintenance Occupations
The most common Natural Resources, Construction and Maintenance occupations in Taliaferro County are Installation, Maintenance & Repair (23 | 3.4%), Construction & Extraction (18 | 2.7%), and Farming, Fishing & Forestry (5 | 0.7%).
Natural Resources, Construction and Maintenance Occupations by Sex
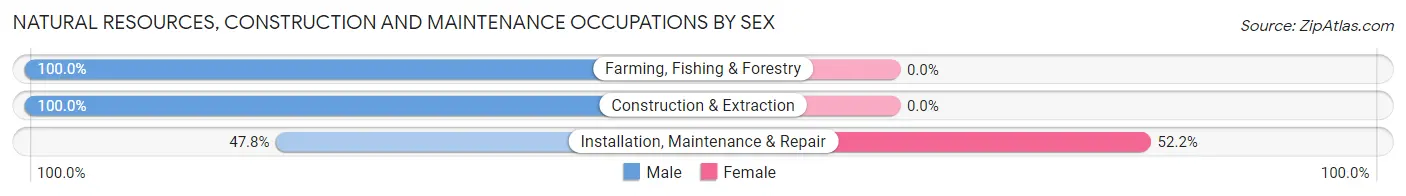
| Occupation | Male | Female |
| Farming, Fishing & Forestry | 5 (100.0%) | 0 (0.0%) |
| Construction & Extraction | 18 (100.0%) | 0 (0.0%) |
| Installation, Maintenance & Repair | 11 (47.8%) | 12 (52.2%) |
| Total (Category) | 34 (73.9%) | 12 (26.1%) |
| Total (Overall) | 316 (47.3%) | 352 (52.7%) |
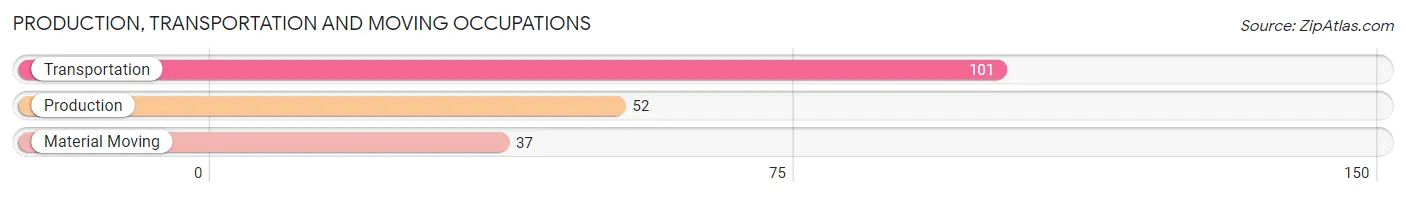
Production, Transportation and Moving Occupations
The most common Production, Transportation and Moving occupations in Taliaferro County are Transportation (101 | 15.1%), Production (52 | 7.8%), and Material Moving (37 | 5.5%).
Production, Transportation and Moving Occupations by Sex
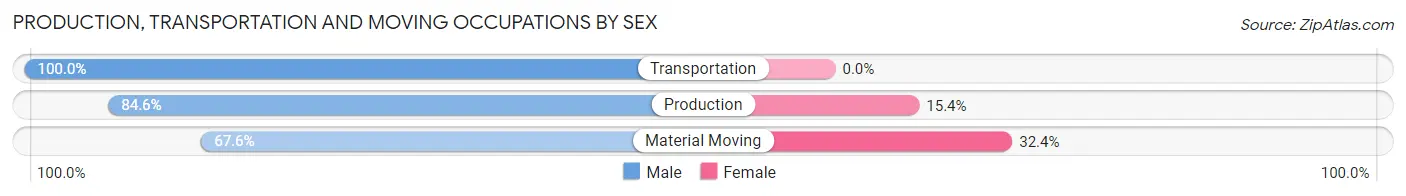
| Occupation | Male | Female |
| Production | 44 (84.6%) | 8 (15.4%) |
| Transportation | 101 (100.0%) | 0 (0.0%) |
| Material Moving | 25 (67.6%) | 12 (32.4%) |
| Total (Category) | 170 (89.5%) | 20 (10.5%) |
| Total (Overall) | 316 (47.3%) | 352 (52.7%) |
Employment Industries by Sex in Taliaferro County
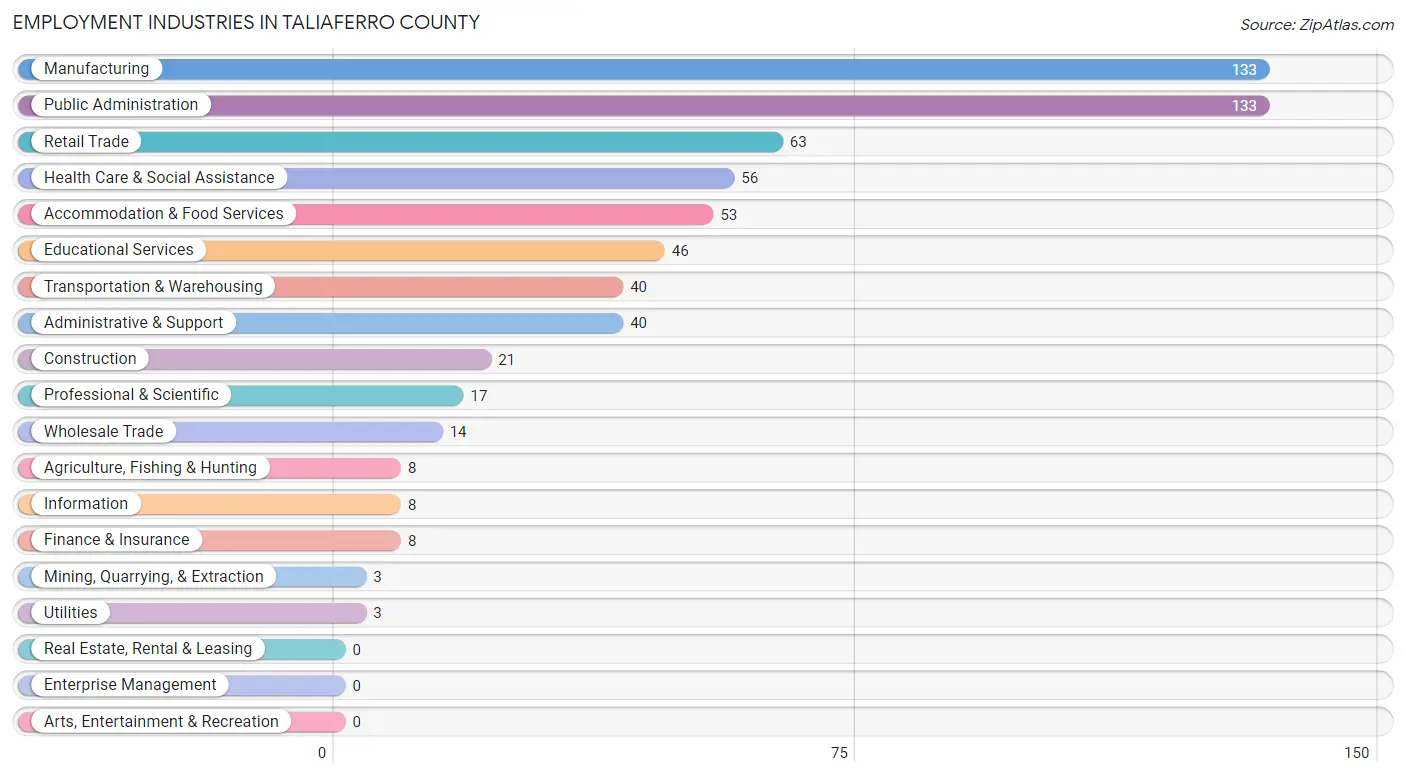
Employment Industries in Taliaferro County
The major employment industries in Taliaferro County include Manufacturing (133 | 19.9%), Public Administration (133 | 19.9%), Retail Trade (63 | 9.4%), Health Care & Social Assistance (56 | 8.4%), and Accommodation & Food Services (53 | 7.9%).
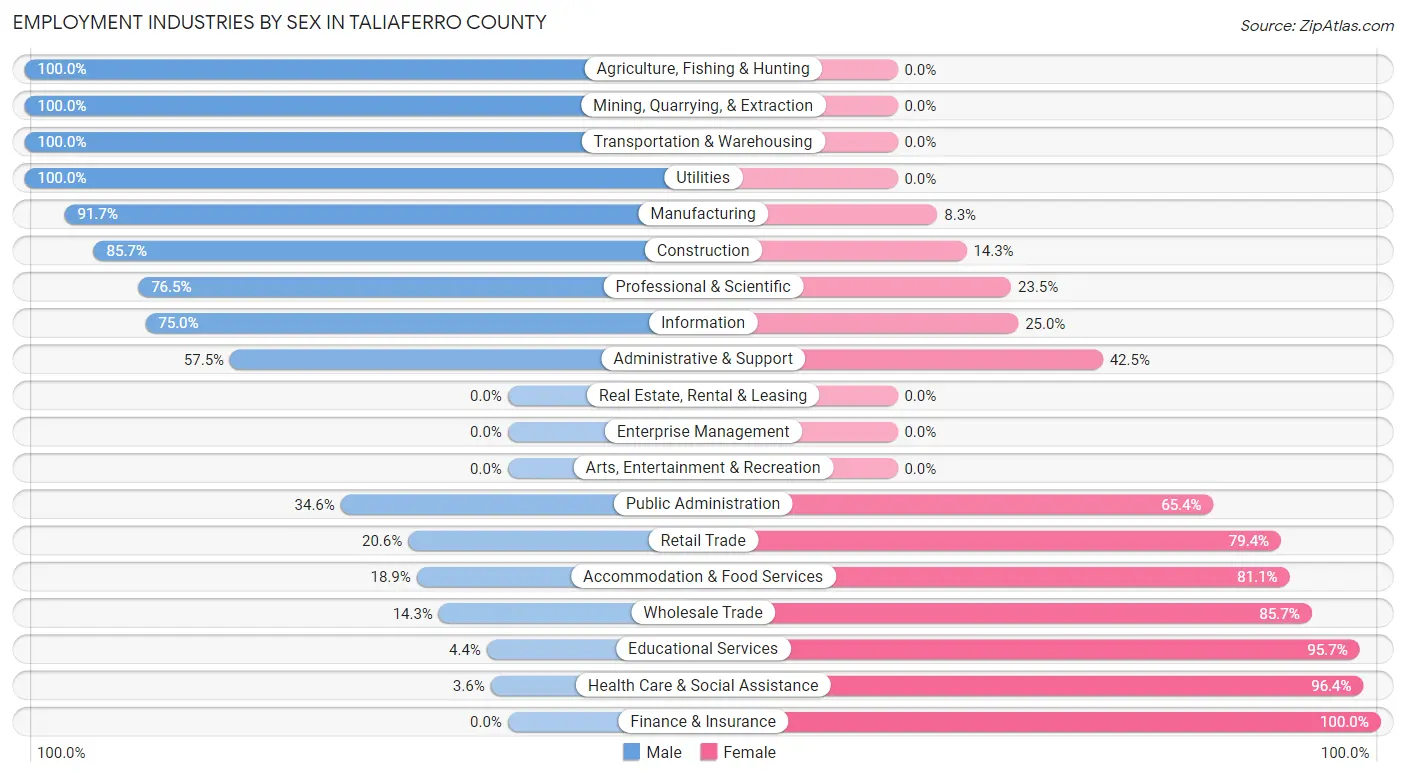
Employment Industries by Sex in Taliaferro County
The Taliaferro County industries that see more men than women are Agriculture, Fishing & Hunting (100.0%), Mining, Quarrying, & Extraction (100.0%), and Transportation & Warehousing (100.0%), whereas the industries that tend to have a higher number of women are Finance & Insurance (100.0%), Health Care & Social Assistance (96.4%), and Educational Services (95.7%).
| Industry | Male | Female |
| Agriculture, Fishing & Hunting | 8 (100.0%) | 0 (0.0%) |
| Mining, Quarrying, & Extraction | 3 (100.0%) | 0 (0.0%) |
| Construction | 18 (85.7%) | 3 (14.3%) |
| Manufacturing | 122 (91.7%) | 11 (8.3%) |
| Wholesale Trade | 2 (14.3%) | 12 (85.7%) |
| Retail Trade | 13 (20.6%) | 50 (79.4%) |
| Transportation & Warehousing | 40 (100.0%) | 0 (0.0%) |
| Utilities | 3 (100.0%) | 0 (0.0%) |
| Information | 6 (75.0%) | 2 (25.0%) |
| Finance & Insurance | 0 (0.0%) | 8 (100.0%) |
| Real Estate, Rental & Leasing | 0 (0.0%) | 0 (0.0%) |
| Professional & Scientific | 13 (76.5%) | 4 (23.5%) |
| Enterprise Management | 0 (0.0%) | 0 (0.0%) |
| Administrative & Support | 23 (57.5%) | 17 (42.5%) |
| Educational Services | 2 (4.3%) | 44 (95.7%) |
| Health Care & Social Assistance | 2 (3.6%) | 54 (96.4%) |
| Arts, Entertainment & Recreation | 0 (0.0%) | 0 (0.0%) |
| Accommodation & Food Services | 10 (18.9%) | 43 (81.1%) |
| Public Administration | 46 (34.6%) | 87 (65.4%) |
| Total | 316 (47.3%) | 352 (52.7%) |
Education in Taliaferro County
School Enrollment in Taliaferro County
The most common levels of schooling among the 178 students in Taliaferro County are middle school (58 | 32.6%), elementary school (55 | 30.9%), and high school (45 | 25.3%).
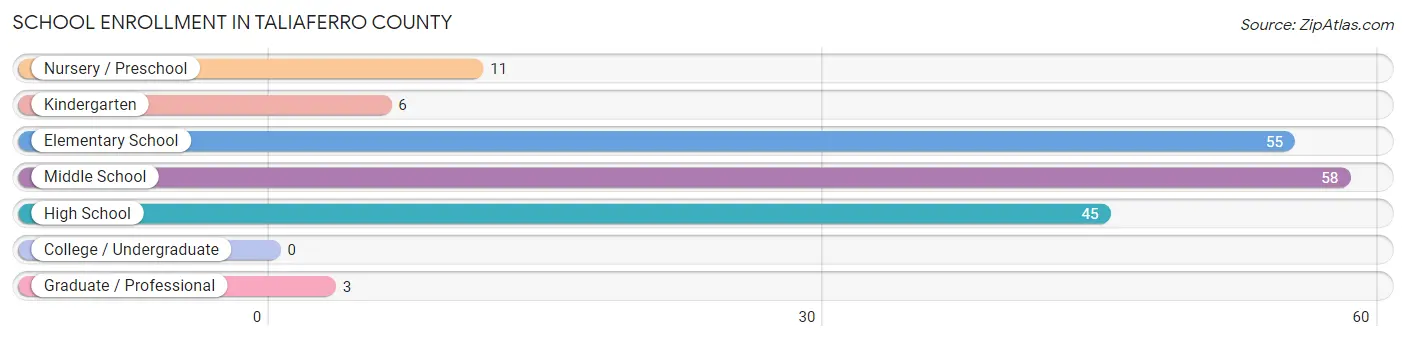
| School Level | # Students | % Students |
| Nursery / Preschool | 11 | 6.2% |
| Kindergarten | 6 | 3.4% |
| Elementary School | 55 | 30.9% |
| Middle School | 58 | 32.6% |
| High School | 45 | 25.3% |
| College / Undergraduate | 0 | 0.0% |
| Graduate / Professional | 3 | 1.7% |
| Total | 178 | 100.0% |
School Enrollment by Age by Funding Source in Taliaferro County
Out of a total of 178 students who are enrolled in schools in Taliaferro County, 42 (23.6%) attend a private institution, while the remaining 136 (76.4%) are enrolled in public schools. The age group of 20 to 24 year olds has the highest likelihood of being enrolled in private schools, with 8 (100.0% in the age bracket) enrolled. Conversely, the age group of 5 to 9 year old has the lowest likelihood of being enrolled in a private school, with 50 (92.6% in the age bracket) attending a public institution.
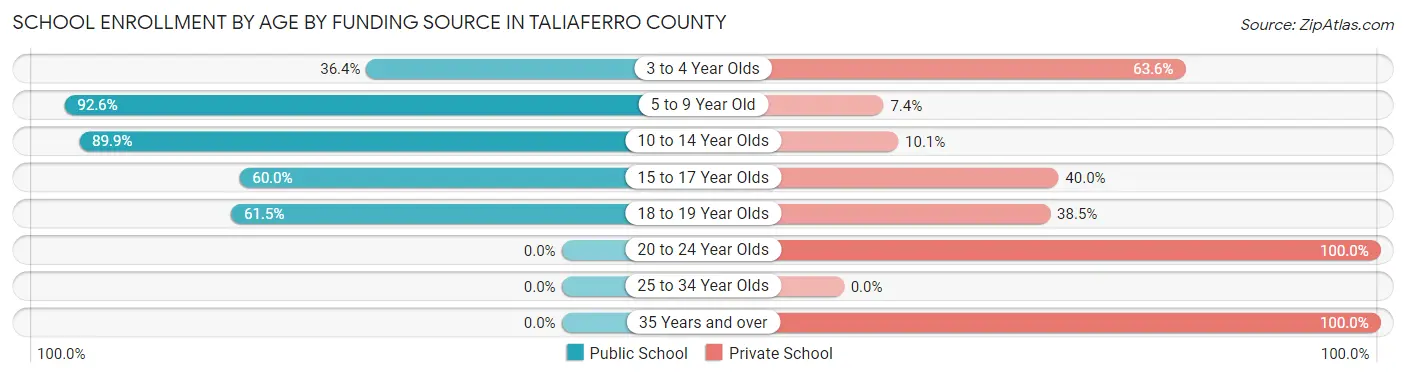
| Age Bracket | Public School | Private School |
| 3 to 4 Year Olds | 4 (36.4%) | 7 (63.6%) |
| 5 to 9 Year Old | 50 (92.6%) | 4 (7.4%) |
| 10 to 14 Year Olds | 62 (89.9%) | 7 (10.1%) |
| 15 to 17 Year Olds | 12 (60.0%) | 8 (40.0%) |
| 18 to 19 Year Olds | 8 (61.5%) | 5 (38.5%) |
| 20 to 24 Year Olds | 0 (0.0%) | 8 (100.0%) |
| 25 to 34 Year Olds | 0 (0.0%) | 0 (0.0%) |
| 35 Years and over | 0 (0.0%) | 3 (100.0%) |
| Total | 136 (76.4%) | 42 (23.6%) |
Educational Attainment by Field of Study in Taliaferro County
Physical & health sciences (37 | 24.8%), science & technology (33 | 22.2%), engineering (20 | 13.4%), education (17 | 11.4%), and business (16 | 10.7%) are the most common fields of study among 149 individuals in Taliaferro County who have obtained a bachelor's degree or higher.
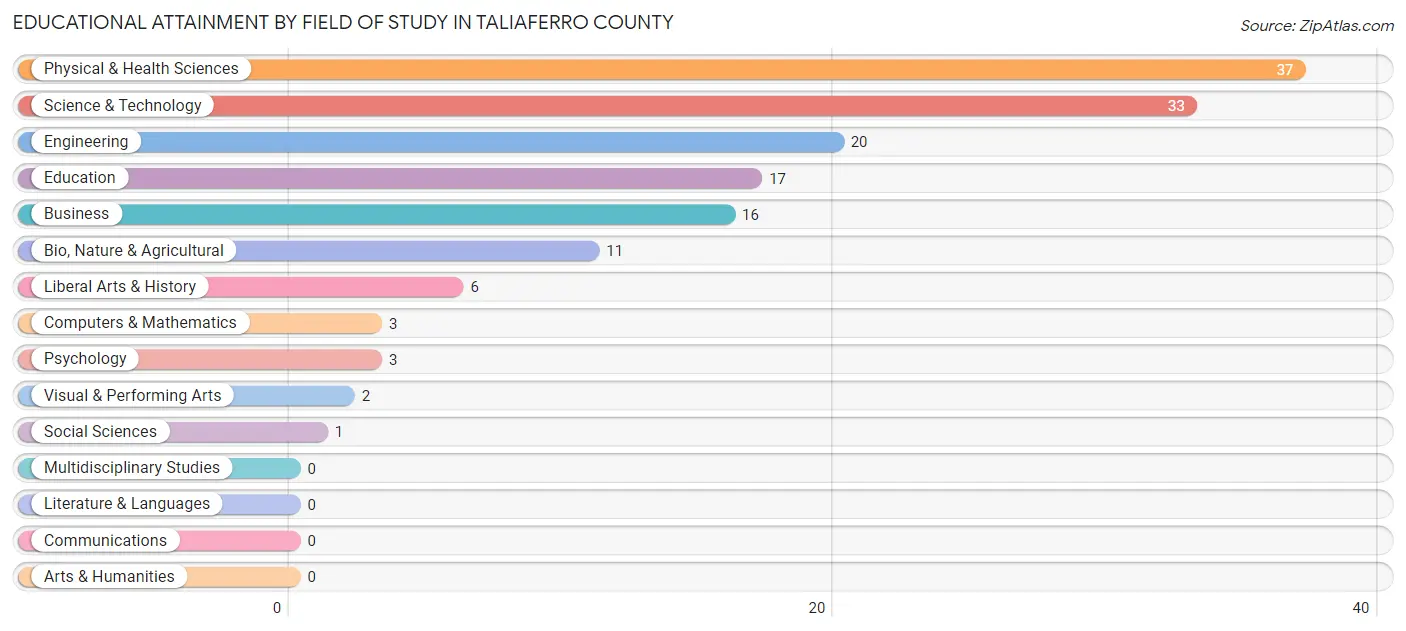
| Field of Study | # Graduates | % Graduates |
| Computers & Mathematics | 3 | 2.0% |
| Bio, Nature & Agricultural | 11 | 7.4% |
| Physical & Health Sciences | 37 | 24.8% |
| Psychology | 3 | 2.0% |
| Social Sciences | 1 | 0.7% |
| Engineering | 20 | 13.4% |
| Multidisciplinary Studies | 0 | 0.0% |
| Science & Technology | 33 | 22.2% |
| Business | 16 | 10.7% |
| Education | 17 | 11.4% |
| Literature & Languages | 0 | 0.0% |
| Liberal Arts & History | 6 | 4.0% |
| Visual & Performing Arts | 2 | 1.3% |
| Communications | 0 | 0.0% |
| Arts & Humanities | 0 | 0.0% |
| Total | 149 | 100.0% |
Transportation & Commute in Taliaferro County
Vehicle Availability by Sex in Taliaferro County
The most prevalent vehicle ownership categories in Taliaferro County are males with 2 vehicles (122, accounting for 38.4%) and females with 2 vehicles (100, making up 34.7%).
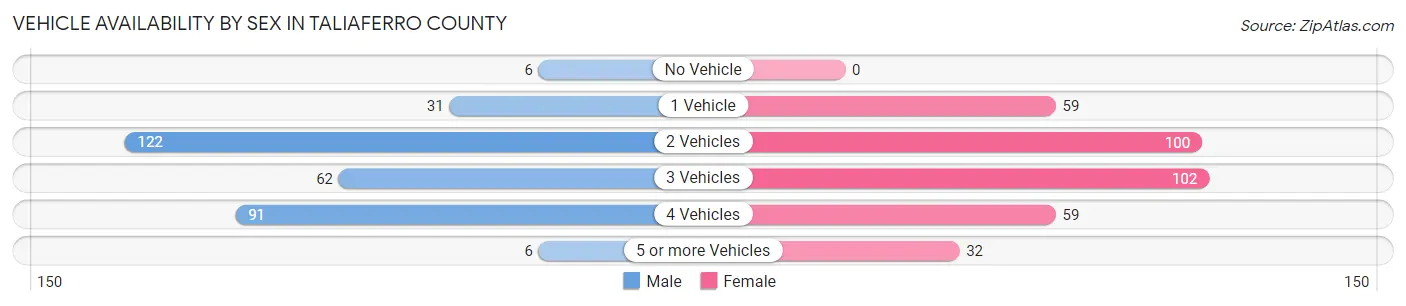
| Vehicles Available | Male | Female |
| No Vehicle | 6 (1.9%) | 0 (0.0%) |
| 1 Vehicle | 31 (9.8%) | 59 (16.8%) |
| 2 Vehicles | 122 (38.4%) | 100 (28.4%) |
| 3 Vehicles | 62 (19.5%) | 102 (29.0%) |
| 4 Vehicles | 91 (28.6%) | 59 (16.8%) |
| 5 or more Vehicles | 6 (1.9%) | 32 (9.1%) |
| Total | 318 (100.0%) | 352 (100.0%) |
Commute Time in Taliaferro County
The most frequently occuring commute durations in Taliaferro County are 45 to 59 minutes (134 commuters, 23.4%), 15 to 19 minutes (100 commuters, 17.4%), and 10 to 14 minutes (63 commuters, 11.0%).
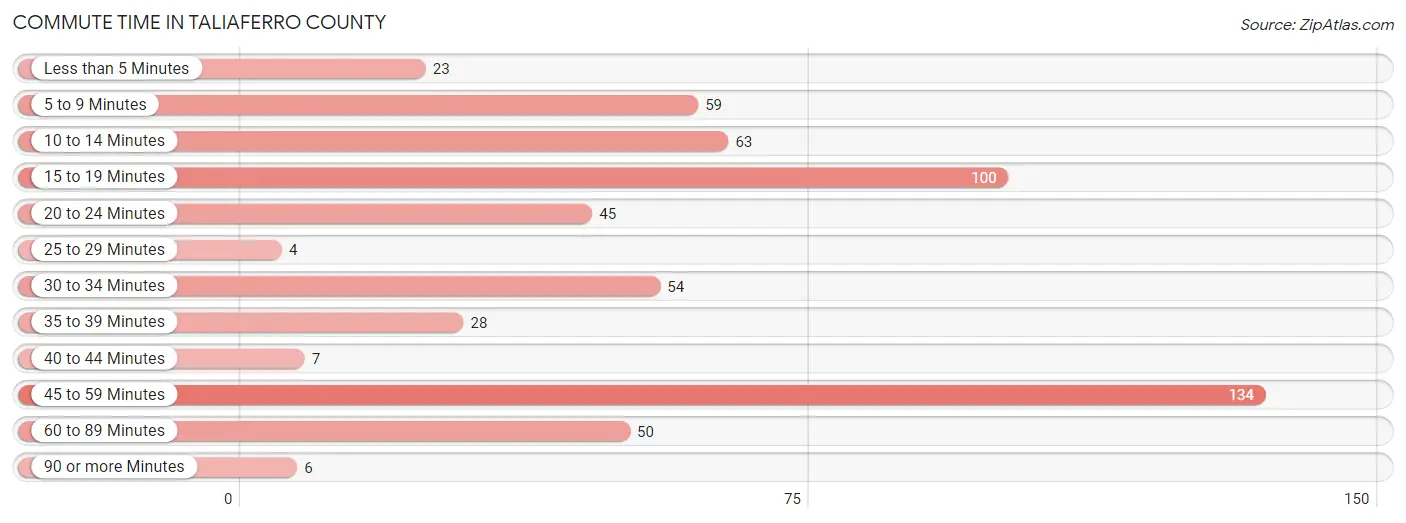
| Commute Time | # Commuters | % Commuters |
| Less than 5 Minutes | 23 | 4.0% |
| 5 to 9 Minutes | 59 | 10.3% |
| 10 to 14 Minutes | 63 | 11.0% |
| 15 to 19 Minutes | 100 | 17.4% |
| 20 to 24 Minutes | 45 | 7.9% |
| 25 to 29 Minutes | 4 | 0.7% |
| 30 to 34 Minutes | 54 | 9.4% |
| 35 to 39 Minutes | 28 | 4.9% |
| 40 to 44 Minutes | 7 | 1.2% |
| 45 to 59 Minutes | 134 | 23.4% |
| 60 to 89 Minutes | 50 | 8.7% |
| 90 or more Minutes | 6 | 1.1% |
Commute Time by Sex in Taliaferro County
The most common commute times in Taliaferro County are 15 to 19 minutes (67 commuters, 25.5%) for males and 45 to 59 minutes (87 commuters, 28.1%) for females.
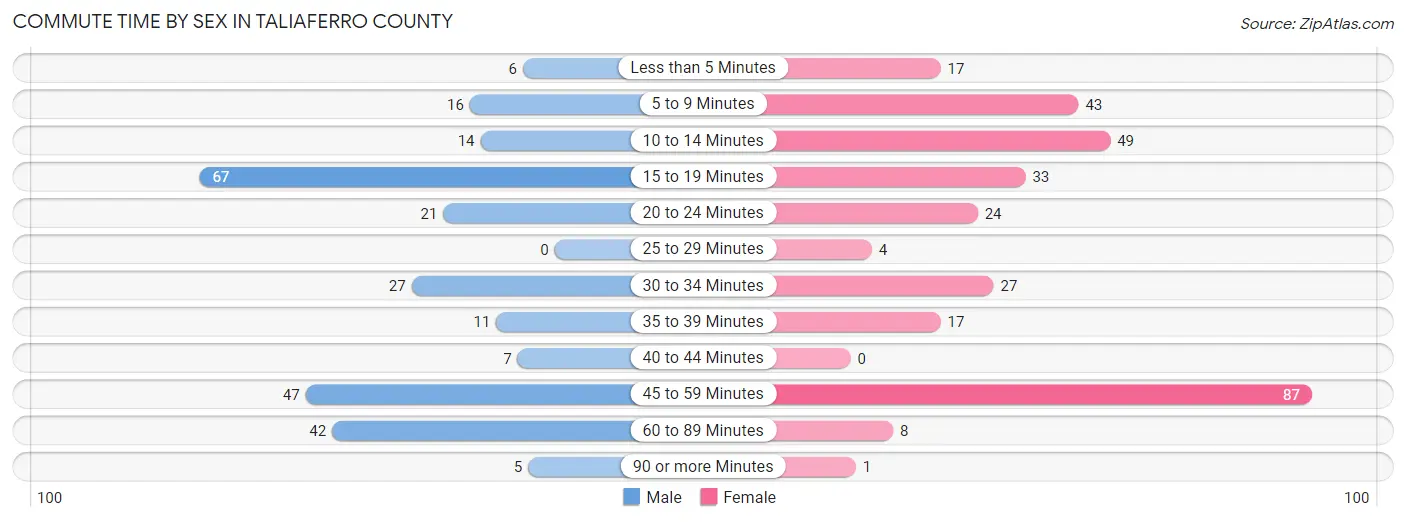
| Commute Time | Male | Female |
| Less than 5 Minutes | 6 (2.3%) | 17 (5.5%) |
| 5 to 9 Minutes | 16 (6.1%) | 43 (13.9%) |
| 10 to 14 Minutes | 14 (5.3%) | 49 (15.8%) |
| 15 to 19 Minutes | 67 (25.5%) | 33 (10.6%) |
| 20 to 24 Minutes | 21 (8.0%) | 24 (7.7%) |
| 25 to 29 Minutes | 0 (0.0%) | 4 (1.3%) |
| 30 to 34 Minutes | 27 (10.3%) | 27 (8.7%) |
| 35 to 39 Minutes | 11 (4.2%) | 17 (5.5%) |
| 40 to 44 Minutes | 7 (2.7%) | 0 (0.0%) |
| 45 to 59 Minutes | 47 (17.9%) | 87 (28.1%) |
| 60 to 89 Minutes | 42 (16.0%) | 8 (2.6%) |
| 90 or more Minutes | 5 (1.9%) | 1 (0.3%) |
Time of Departure to Work by Sex in Taliaferro County
The most frequent times of departure to work in Taliaferro County are 6:00 AM to 6:29 AM (59, 22.4%) for males and 7:30 AM to 7:59 AM (82, 26.5%) for females.
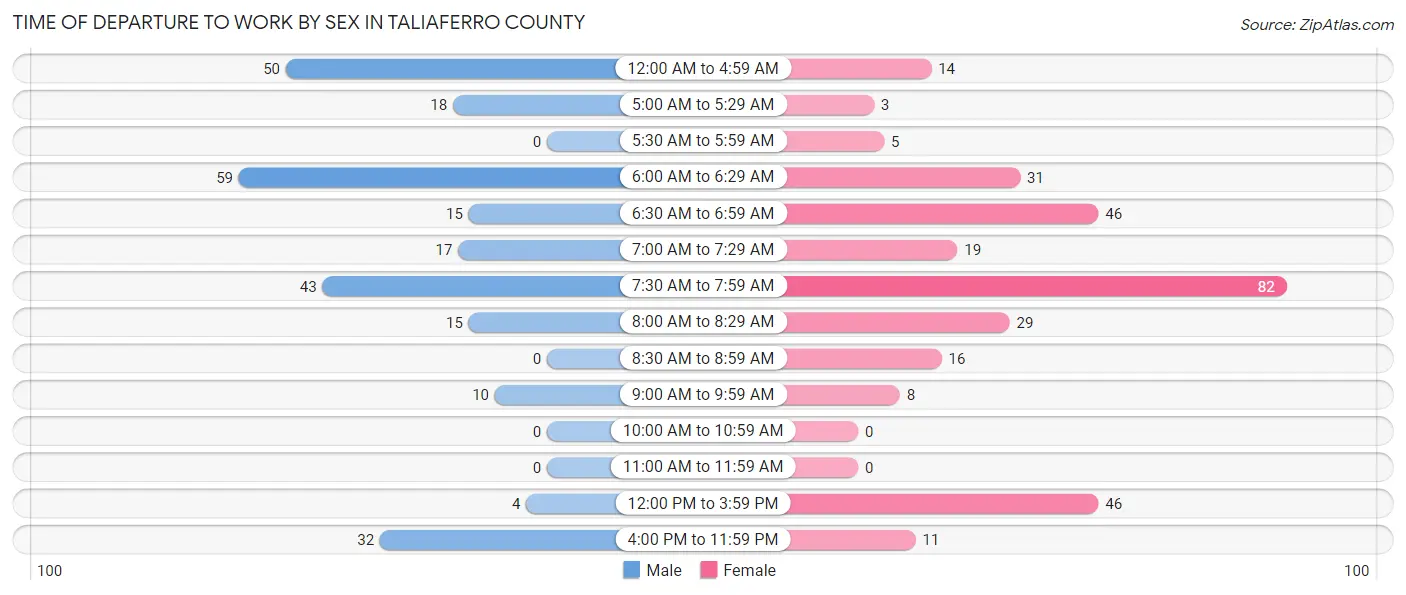
| Time of Departure | Male | Female |
| 12:00 AM to 4:59 AM | 50 (19.0%) | 14 (4.5%) |
| 5:00 AM to 5:29 AM | 18 (6.8%) | 3 (1.0%) |
| 5:30 AM to 5:59 AM | 0 (0.0%) | 5 (1.6%) |
| 6:00 AM to 6:29 AM | 59 (22.4%) | 31 (10.0%) |
| 6:30 AM to 6:59 AM | 15 (5.7%) | 46 (14.8%) |
| 7:00 AM to 7:29 AM | 17 (6.5%) | 19 (6.1%) |
| 7:30 AM to 7:59 AM | 43 (16.4%) | 82 (26.5%) |
| 8:00 AM to 8:29 AM | 15 (5.7%) | 29 (9.3%) |
| 8:30 AM to 8:59 AM | 0 (0.0%) | 16 (5.2%) |
| 9:00 AM to 9:59 AM | 10 (3.8%) | 8 (2.6%) |
| 10:00 AM to 10:59 AM | 0 (0.0%) | 0 (0.0%) |
| 11:00 AM to 11:59 AM | 0 (0.0%) | 0 (0.0%) |
| 12:00 PM to 3:59 PM | 4 (1.5%) | 46 (14.8%) |
| 4:00 PM to 11:59 PM | 32 (12.2%) | 11 (3.5%) |
| Total | 263 (100.0%) | 310 (100.0%) |
Housing Occupancy in Taliaferro County
Occupancy by Ownership in Taliaferro County
Of the total 643 dwellings in Taliaferro County, owner-occupied units account for 483 (75.1%), while renter-occupied units make up 160 (24.9%).
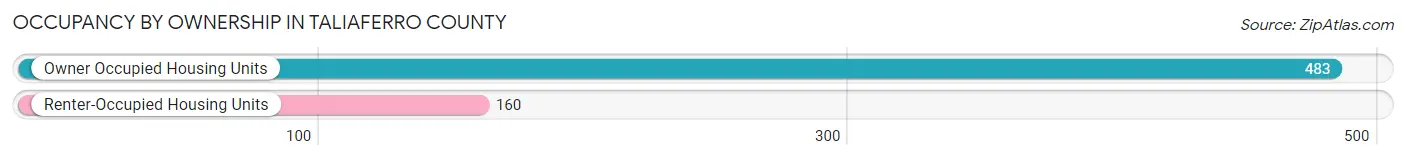
| Occupancy | # Housing Units | % Housing Units |
| Owner Occupied Housing Units | 483 | 75.1% |
| Renter-Occupied Housing Units | 160 | 24.9% |
| Total Occupied Housing Units | 643 | 100.0% |
Occupancy by Household Size in Taliaferro County
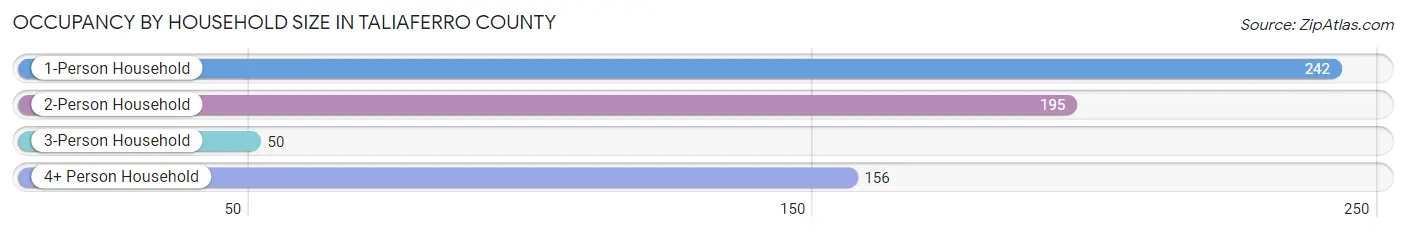
| Household Size | # Housing Units | % Housing Units |
| 1-Person Household | 242 | 37.6% |
| 2-Person Household | 195 | 30.3% |
| 3-Person Household | 50 | 7.8% |
| 4+ Person Household | 156 | 24.3% |
| Total Housing Units | 643 | 100.0% |
Occupancy by Ownership by Household Size in Taliaferro County
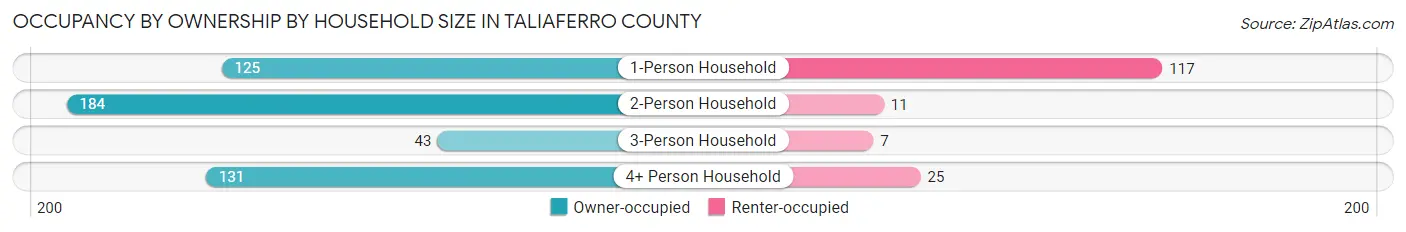
| Household Size | Owner-occupied | Renter-occupied |
| 1-Person Household | 125 (51.6%) | 117 (48.3%) |
| 2-Person Household | 184 (94.4%) | 11 (5.6%) |
| 3-Person Household | 43 (86.0%) | 7 (14.0%) |
| 4+ Person Household | 131 (84.0%) | 25 (16.0%) |
| Total Housing Units | 483 (75.1%) | 160 (24.9%) |
Occupancy by Educational Attainment in Taliaferro County
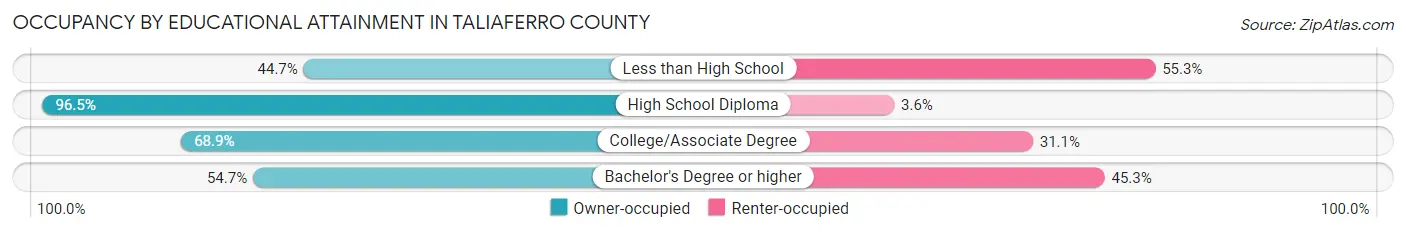
| Household Size | Owner-occupied | Renter-occupied |
| Less than High School | 42 (44.7%) | 52 (55.3%) |
| High School Diploma | 272 (96.5%) | 10 (3.5%) |
| College/Associate Degree | 111 (68.9%) | 50 (31.1%) |
| Bachelor's Degree or higher | 58 (54.7%) | 48 (45.3%) |
Occupancy by Age of Householder in Taliaferro County
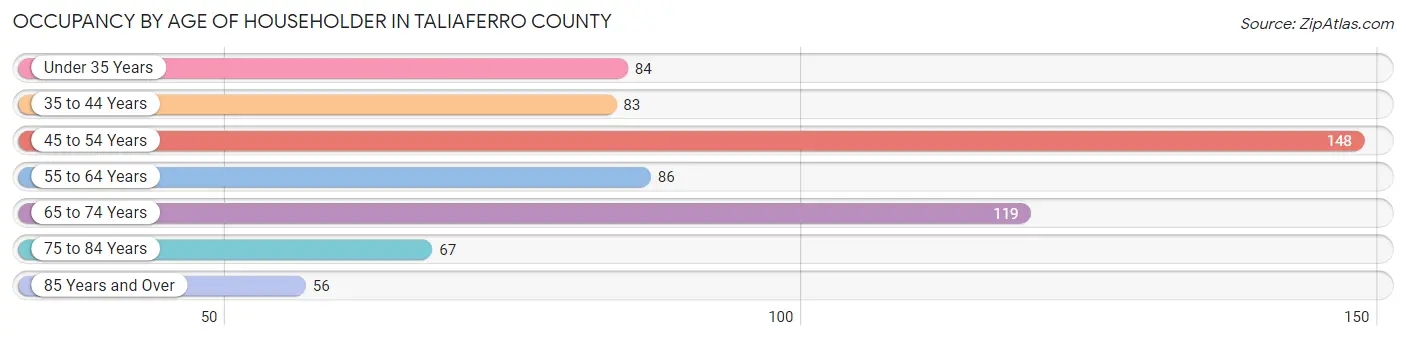
| Age Bracket | # Households | % Households |
| Under 35 Years | 84 | 13.1% |
| 35 to 44 Years | 83 | 12.9% |
| 45 to 54 Years | 148 | 23.0% |
| 55 to 64 Years | 86 | 13.4% |
| 65 to 74 Years | 119 | 18.5% |
| 75 to 84 Years | 67 | 10.4% |
| 85 Years and Over | 56 | 8.7% |
| Total | 643 | 100.0% |
Housing Finances in Taliaferro County
Median Income by Occupancy in Taliaferro County
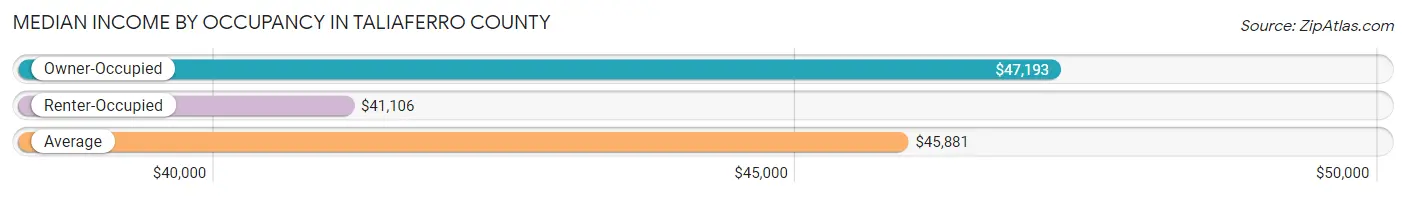
| Occupancy Type | # Households | Median Income |
| Owner-Occupied | 483 (75.1%) | $47,193 |
| Renter-Occupied | 160 (24.9%) | $41,106 |
| Average | 643 (100.0%) | $45,881 |
Occupancy by Householder Income Bracket in Taliaferro County
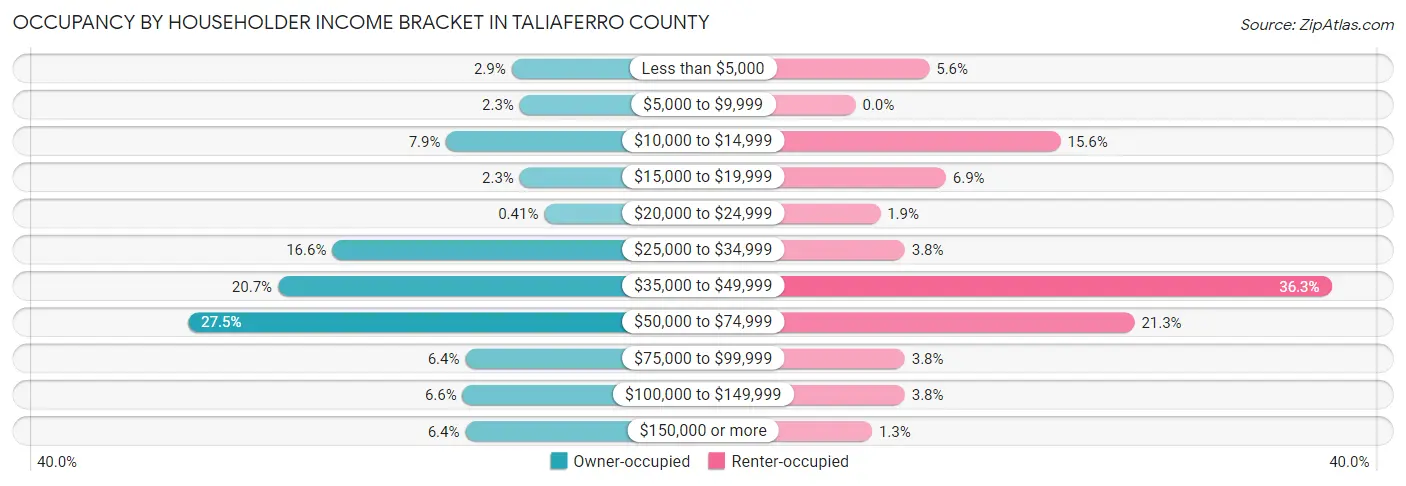
| Income Bracket | Owner-occupied | Renter-occupied |
| Less than $5,000 | 14 (2.9%) | 9 (5.6%) |
| $5,000 to $9,999 | 11 (2.3%) | 0 (0.0%) |
| $10,000 to $14,999 | 38 (7.9%) | 25 (15.6%) |
| $15,000 to $19,999 | 11 (2.3%) | 11 (6.9%) |
| $20,000 to $24,999 | 2 (0.4%) | 3 (1.9%) |
| $25,000 to $34,999 | 80 (16.6%) | 6 (3.7%) |
| $35,000 to $49,999 | 100 (20.7%) | 58 (36.2%) |
| $50,000 to $74,999 | 133 (27.5%) | 34 (21.2%) |
| $75,000 to $99,999 | 31 (6.4%) | 6 (3.7%) |
| $100,000 to $149,999 | 32 (6.6%) | 6 (3.7%) |
| $150,000 or more | 31 (6.4%) | 2 (1.3%) |
| Total | 483 (100.0%) | 160 (100.0%) |
Monthly Housing Cost Tiers in Taliaferro County
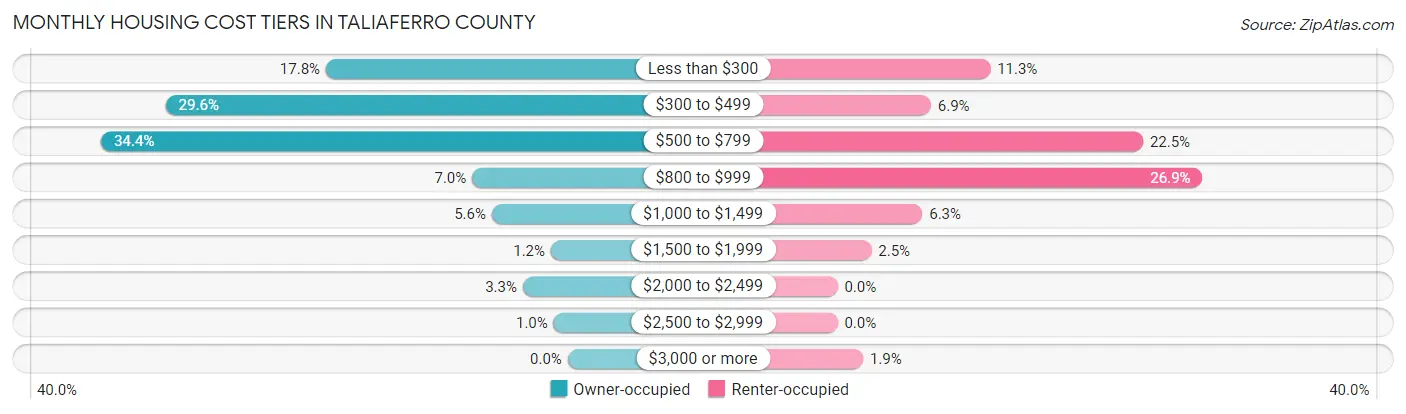
| Monthly Cost | Owner-occupied | Renter-occupied |
| Less than $300 | 86 (17.8%) | 18 (11.3%) |
| $300 to $499 | 143 (29.6%) | 11 (6.9%) |
| $500 to $799 | 166 (34.4%) | 36 (22.5%) |
| $800 to $999 | 34 (7.0%) | 43 (26.9%) |
| $1,000 to $1,499 | 27 (5.6%) | 10 (6.2%) |
| $1,500 to $1,999 | 6 (1.2%) | 4 (2.5%) |
| $2,000 to $2,499 | 16 (3.3%) | 0 (0.0%) |
| $2,500 to $2,999 | 5 (1.0%) | 0 (0.0%) |
| $3,000 or more | 0 (0.0%) | 3 (1.9%) |
| Total | 483 (100.0%) | 160 (100.0%) |
Physical Housing Characteristics in Taliaferro County
Housing Structures in Taliaferro County
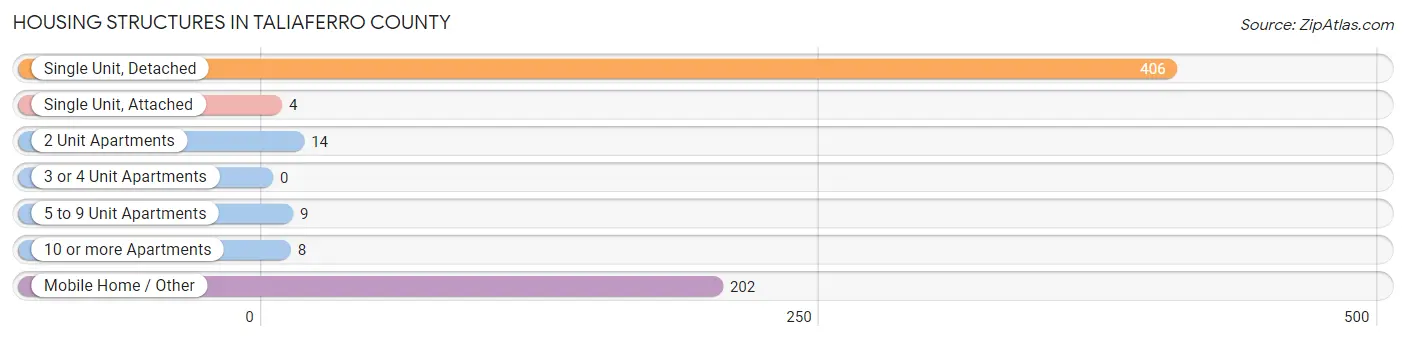
| Structure Type | # Housing Units | % Housing Units |
| Single Unit, Detached | 406 | 63.1% |
| Single Unit, Attached | 4 | 0.6% |
| 2 Unit Apartments | 14 | 2.2% |
| 3 or 4 Unit Apartments | 0 | 0.0% |
| 5 to 9 Unit Apartments | 9 | 1.4% |
| 10 or more Apartments | 8 | 1.2% |
| Mobile Home / Other | 202 | 31.4% |
| Total | 643 | 100.0% |
Housing Structures by Occupancy in Taliaferro County
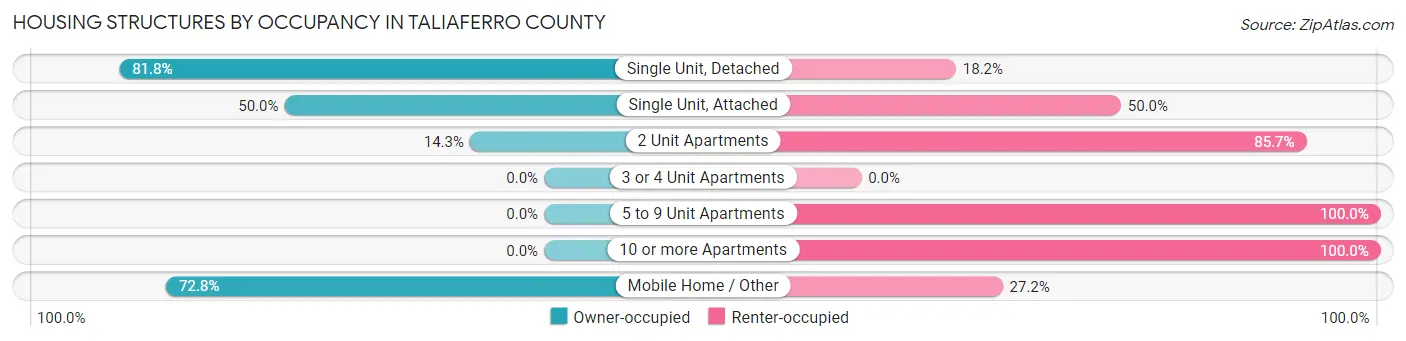
| Structure Type | Owner-occupied | Renter-occupied |
| Single Unit, Detached | 332 (81.8%) | 74 (18.2%) |
| Single Unit, Attached | 2 (50.0%) | 2 (50.0%) |
| 2 Unit Apartments | 2 (14.3%) | 12 (85.7%) |
| 3 or 4 Unit Apartments | 0 (0.0%) | 0 (0.0%) |
| 5 to 9 Unit Apartments | 0 (0.0%) | 9 (100.0%) |
| 10 or more Apartments | 0 (0.0%) | 8 (100.0%) |
| Mobile Home / Other | 147 (72.8%) | 55 (27.2%) |
| Total | 483 (75.1%) | 160 (24.9%) |
Housing Structures by Number of Rooms in Taliaferro County
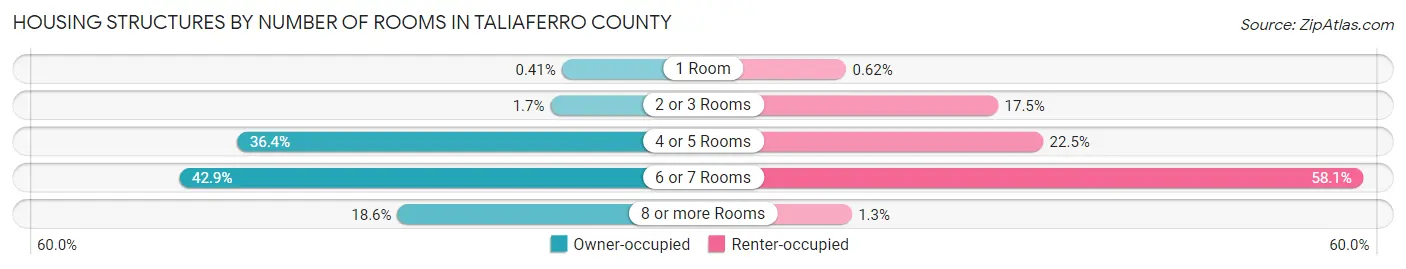
| Number of Rooms | Owner-occupied | Renter-occupied |
| 1 Room | 2 (0.4%) | 1 (0.6%) |
| 2 or 3 Rooms | 8 (1.7%) | 28 (17.5%) |
| 4 or 5 Rooms | 176 (36.4%) | 36 (22.5%) |
| 6 or 7 Rooms | 207 (42.9%) | 93 (58.1%) |
| 8 or more Rooms | 90 (18.6%) | 2 (1.3%) |
| Total | 483 (100.0%) | 160 (100.0%) |
Housing Structure by Heating Type in Taliaferro County
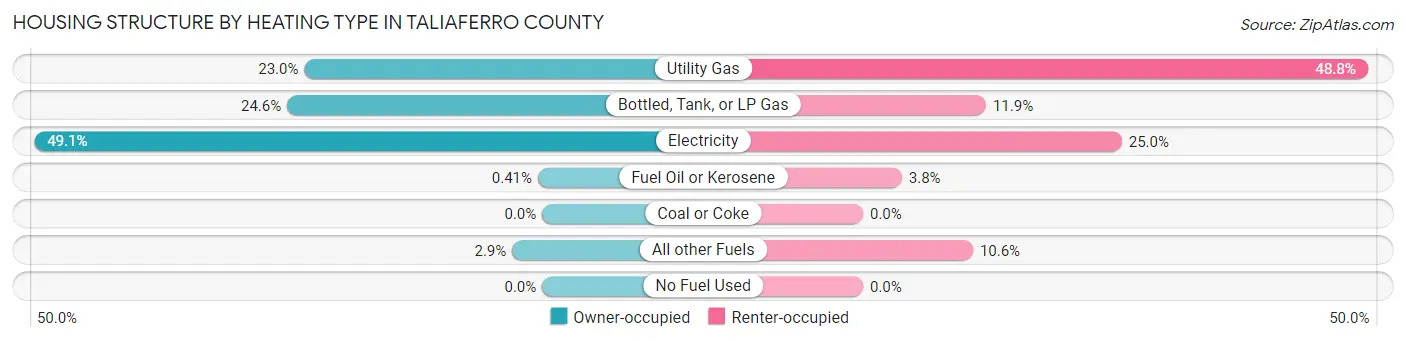
| Heating Type | Owner-occupied | Renter-occupied |
| Utility Gas | 111 (23.0%) | 78 (48.7%) |
| Bottled, Tank, or LP Gas | 119 (24.6%) | 19 (11.9%) |
| Electricity | 237 (49.1%) | 40 (25.0%) |
| Fuel Oil or Kerosene | 2 (0.4%) | 6 (3.7%) |
| Coal or Coke | 0 (0.0%) | 0 (0.0%) |
| All other Fuels | 14 (2.9%) | 17 (10.6%) |
| No Fuel Used | 0 (0.0%) | 0 (0.0%) |
| Total | 483 (100.0%) | 160 (100.0%) |
Household Vehicle Usage in Taliaferro County
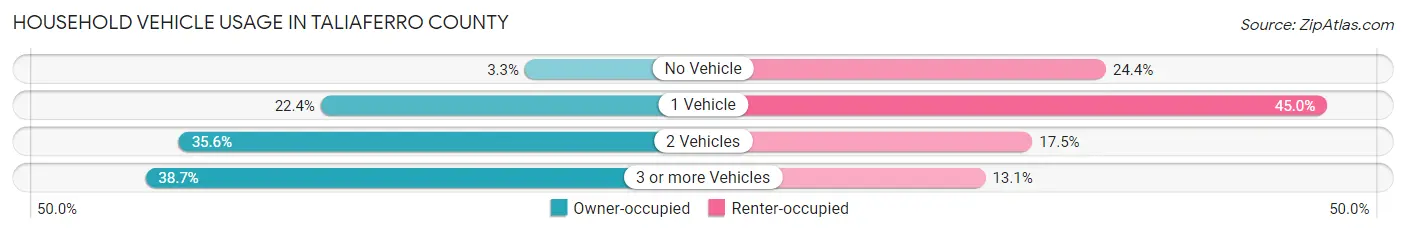
| Vehicles per Household | Owner-occupied | Renter-occupied |
| No Vehicle | 16 (3.3%) | 39 (24.4%) |
| 1 Vehicle | 108 (22.4%) | 72 (45.0%) |
| 2 Vehicles | 172 (35.6%) | 28 (17.5%) |
| 3 or more Vehicles | 187 (38.7%) | 21 (13.1%) |
| Total | 483 (100.0%) | 160 (100.0%) |
Real Estate & Mortgages in Taliaferro County
Real Estate and Mortgage Overview in Taliaferro County
| Characteristic | Without Mortgage | With Mortgage |
| Housing Units | 403 | 80 |
| Median Property Value | $66,800 | $96,000 |
| Median Household Income | $47,478 | $5 |
| Monthly Housing Costs | $449 | $0 |
| Real Estate Taxes | $811 | $6 |
Property Value by Mortgage Status in Taliaferro County
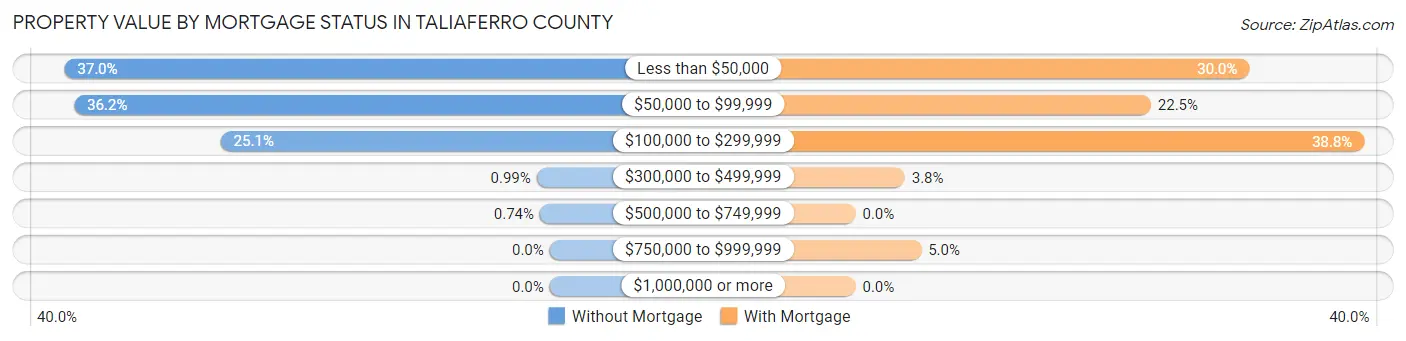
| Property Value | Without Mortgage | With Mortgage |
| Less than $50,000 | 149 (37.0%) | 24 (30.0%) |
| $50,000 to $99,999 | 146 (36.2%) | 18 (22.5%) |
| $100,000 to $299,999 | 101 (25.1%) | 31 (38.8%) |
| $300,000 to $499,999 | 4 (1.0%) | 3 (3.7%) |
| $500,000 to $749,999 | 3 (0.7%) | 0 (0.0%) |
| $750,000 to $999,999 | 0 (0.0%) | 4 (5.0%) |
| $1,000,000 or more | 0 (0.0%) | 0 (0.0%) |
| Total | 403 (100.0%) | 80 (100.0%) |
Household Income by Mortgage Status in Taliaferro County
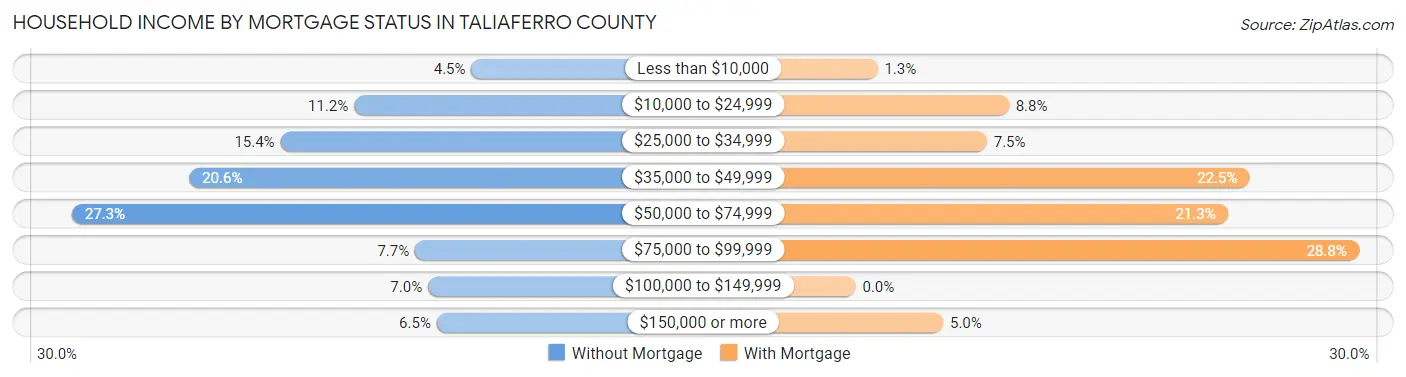
| Household Income | Without Mortgage | With Mortgage |
| Less than $10,000 | 18 (4.5%) | 1 (1.3%) |
| $10,000 to $24,999 | 45 (11.2%) | 7 (8.7%) |
| $25,000 to $34,999 | 62 (15.4%) | 6 (7.5%) |
| $35,000 to $49,999 | 83 (20.6%) | 18 (22.5%) |
| $50,000 to $74,999 | 110 (27.3%) | 17 (21.2%) |
| $75,000 to $99,999 | 31 (7.7%) | 23 (28.7%) |
| $100,000 to $149,999 | 28 (7.0%) | 0 (0.0%) |
| $150,000 or more | 26 (6.5%) | 4 (5.0%) |
| Total | 403 (100.0%) | 80 (100.0%) |
Property Value to Household Income Ratio in Taliaferro County
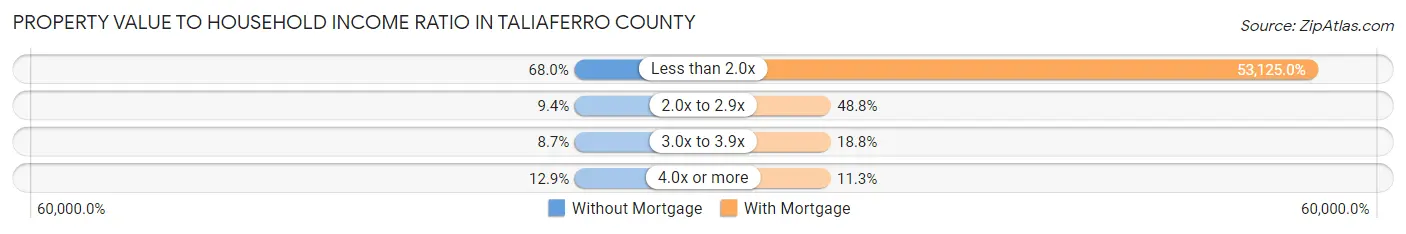
| Value-to-Income Ratio | Without Mortgage | With Mortgage |
| Less than 2.0x | 274 (68.0%) | 42,500 (53,125.0%) |
| 2.0x to 2.9x | 38 (9.4%) | 39 (48.7%) |
| 3.0x to 3.9x | 35 (8.7%) | 15 (18.8%) |
| 4.0x or more | 52 (12.9%) | 9 (11.3%) |
| Total | 403 (100.0%) | 80 (100.0%) |
Real Estate Taxes by Mortgage Status in Taliaferro County
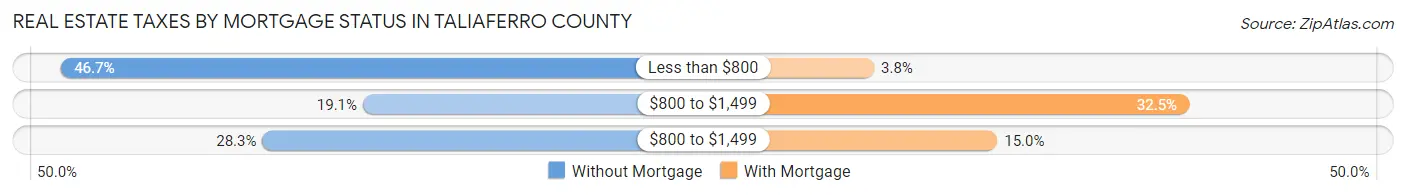
| Property Taxes | Without Mortgage | With Mortgage |
| Less than $800 | 188 (46.7%) | 3 (3.7%) |
| $800 to $1,499 | 77 (19.1%) | 26 (32.5%) |
| $800 to $1,499 | 114 (28.3%) | 12 (15.0%) |
| Total | 403 (100.0%) | 80 (100.0%) |
Health & Disability in Taliaferro County
Health Insurance Coverage by Age in Taliaferro County
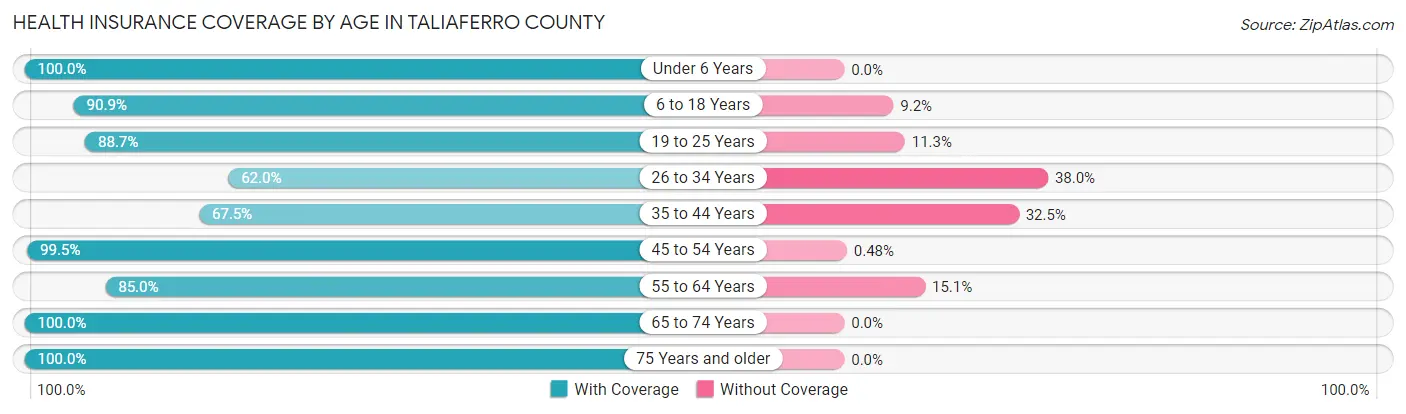
| Age Bracket | With Coverage | Without Coverage |
| Under 6 Years | 80 (100.0%) | 0 (0.0%) |
| 6 to 18 Years | 149 (90.8%) | 15 (9.1%) |
| 19 to 25 Years | 110 (88.7%) | 14 (11.3%) |
| 26 to 34 Years | 129 (62.0%) | 79 (38.0%) |
| 35 to 44 Years | 139 (67.5%) | 67 (32.5%) |
| 45 to 54 Years | 207 (99.5%) | 1 (0.5%) |
| 55 to 64 Years | 158 (85.0%) | 28 (15.0%) |
| 65 to 74 Years | 209 (100.0%) | 0 (0.0%) |
| 75 Years and older | 245 (100.0%) | 0 (0.0%) |
| Total | 1,426 (87.5%) | 204 (12.5%) |
Health Insurance Coverage by Citizenship Status in Taliaferro County
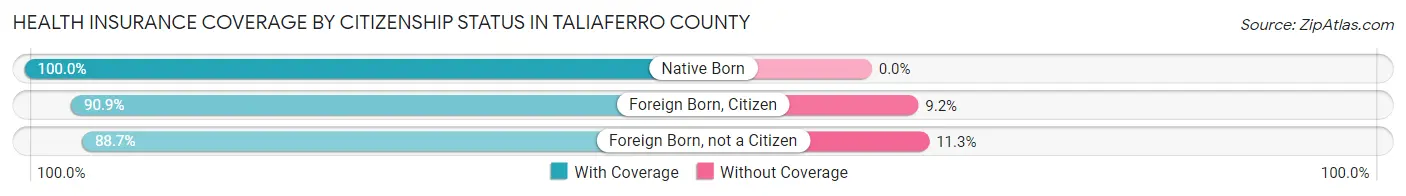
| Citizenship Status | With Coverage | Without Coverage |
| Native Born | 80 (100.0%) | 0 (0.0%) |
| Foreign Born, Citizen | 149 (90.8%) | 15 (9.1%) |
| Foreign Born, not a Citizen | 110 (88.7%) | 14 (11.3%) |
Health Insurance Coverage by Household Income in Taliaferro County
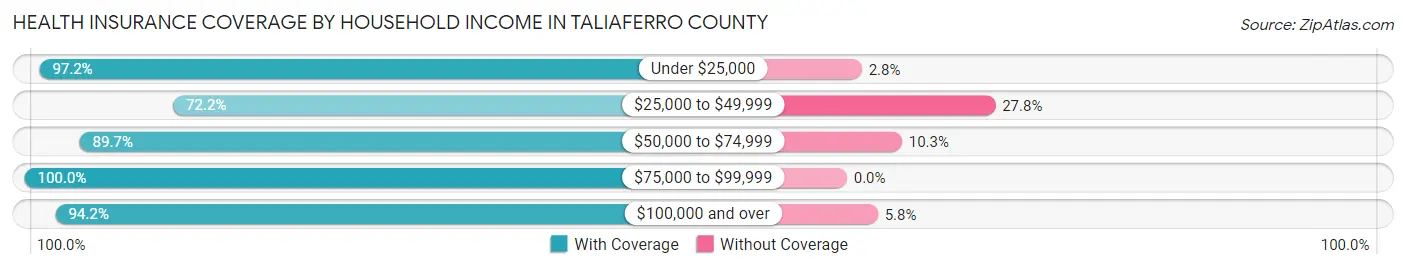
| Household Income | With Coverage | Without Coverage |
| Under $25,000 | 209 (97.2%) | 6 (2.8%) |
| $25,000 to $49,999 | 340 (72.2%) | 131 (27.8%) |
| $50,000 to $74,999 | 400 (89.7%) | 46 (10.3%) |
| $75,000 to $99,999 | 135 (100.0%) | 0 (0.0%) |
| $100,000 and over | 342 (94.2%) | 21 (5.8%) |
Public vs Private Health Insurance Coverage by Age in Taliaferro County
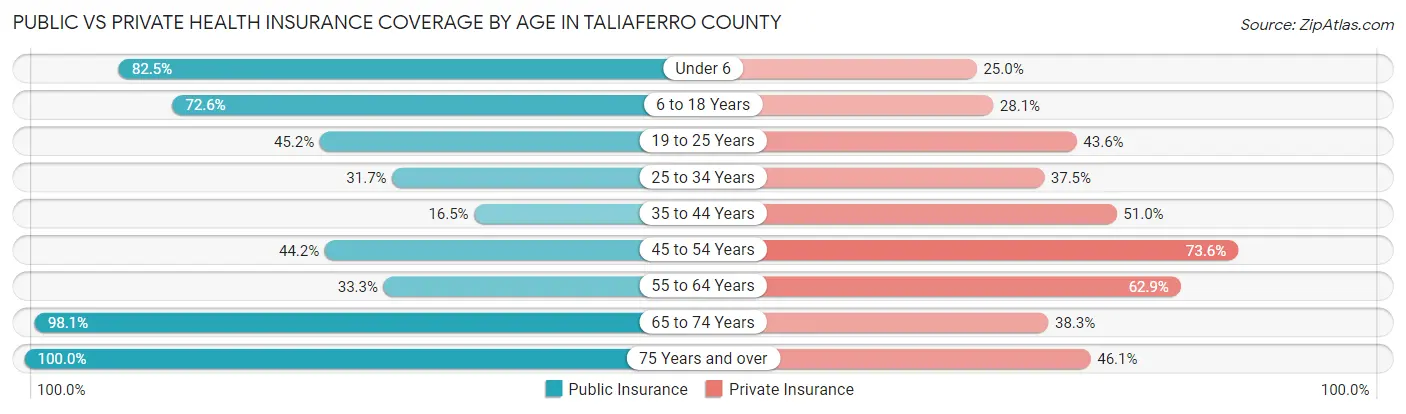
| Age Bracket | Public Insurance | Private Insurance |
| Under 6 | 66 (82.5%) | 20 (25.0%) |
| 6 to 18 Years | 119 (72.6%) | 46 (28.1%) |
| 19 to 25 Years | 56 (45.2%) | 54 (43.5%) |
| 25 to 34 Years | 66 (31.7%) | 78 (37.5%) |
| 35 to 44 Years | 34 (16.5%) | 105 (51.0%) |
| 45 to 54 Years | 92 (44.2%) | 153 (73.6%) |
| 55 to 64 Years | 62 (33.3%) | 117 (62.9%) |
| 65 to 74 Years | 205 (98.1%) | 80 (38.3%) |
| 75 Years and over | 245 (100.0%) | 113 (46.1%) |
| Total | 945 (58.0%) | 766 (47.0%) |
Disability Status by Sex by Age in Taliaferro County
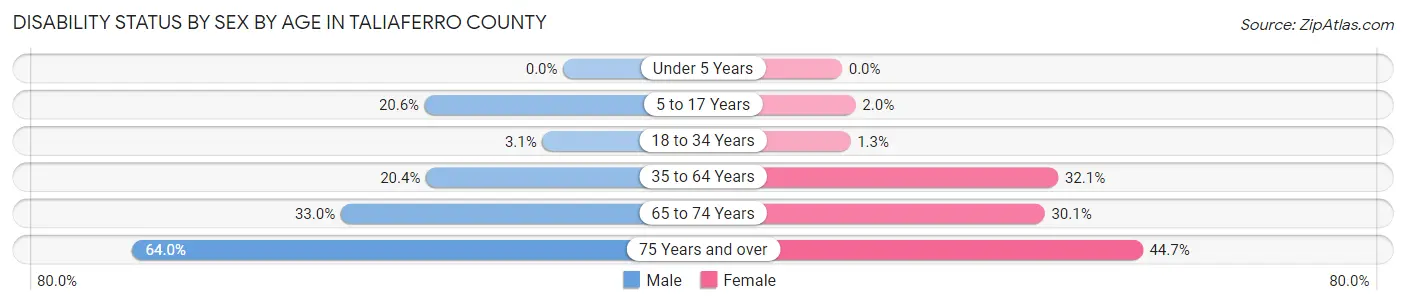
| Age Bracket | Male | Female |
| Under 5 Years | 0 (0.0%) | 0 (0.0%) |
| 5 to 17 Years | 15 (20.5%) | 2 (2.0%) |
| 18 to 34 Years | 3 (3.1%) | 3 (1.3%) |
| 35 to 64 Years | 67 (20.4%) | 87 (32.1%) |
| 65 to 74 Years | 35 (33.0%) | 31 (30.1%) |
| 75 Years and over | 55 (63.9%) | 71 (44.7%) |
Disability Class by Sex by Age in Taliaferro County
Disability Class: Hearing Difficulty
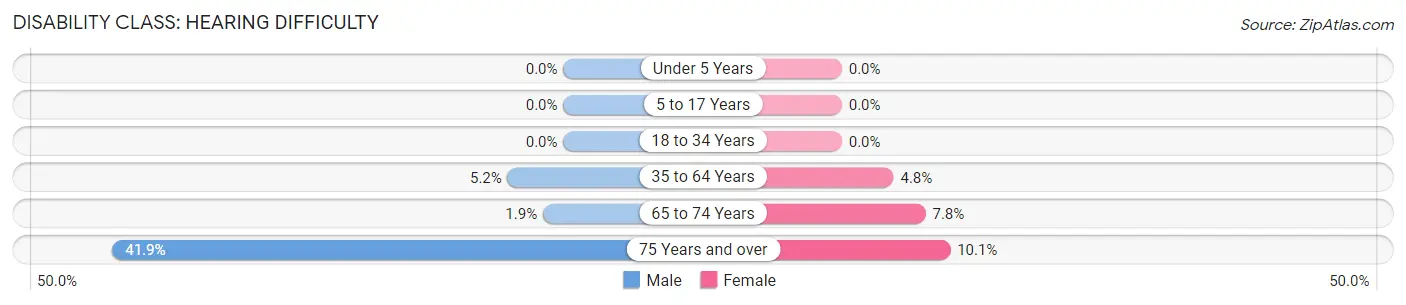
| Age Bracket | Male | Female |
| Under 5 Years | 0 (0.0%) | 0 (0.0%) |
| 5 to 17 Years | 0 (0.0%) | 0 (0.0%) |
| 18 to 34 Years | 0 (0.0%) | 0 (0.0%) |
| 35 to 64 Years | 17 (5.2%) | 13 (4.8%) |
| 65 to 74 Years | 2 (1.9%) | 8 (7.8%) |
| 75 Years and over | 36 (41.9%) | 16 (10.1%) |
Disability Class: Vision Difficulty
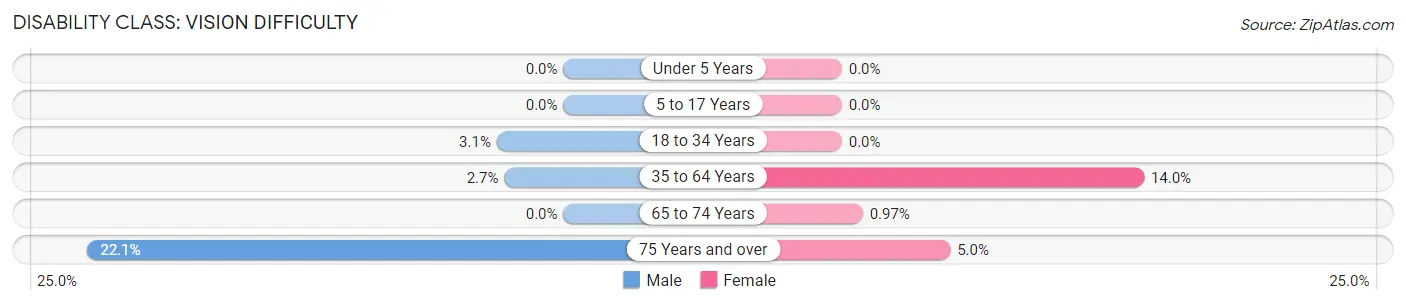
| Age Bracket | Male | Female |
| Under 5 Years | 0 (0.0%) | 0 (0.0%) |
| 5 to 17 Years | 0 (0.0%) | 0 (0.0%) |
| 18 to 34 Years | 3 (3.1%) | 0 (0.0%) |
| 35 to 64 Years | 9 (2.7%) | 38 (14.0%) |
| 65 to 74 Years | 0 (0.0%) | 1 (1.0%) |
| 75 Years and over | 19 (22.1%) | 8 (5.0%) |
Disability Class: Cognitive Difficulty
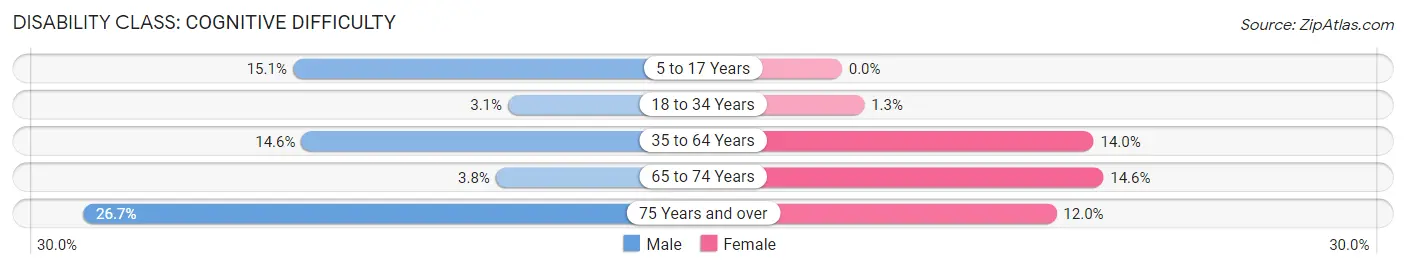
| Age Bracket | Male | Female |
| 5 to 17 Years | 11 (15.1%) | 0 (0.0%) |
| 18 to 34 Years | 3 (3.1%) | 3 (1.3%) |
| 35 to 64 Years | 48 (14.6%) | 38 (14.0%) |
| 65 to 74 Years | 4 (3.8%) | 15 (14.6%) |
| 75 Years and over | 23 (26.7%) | 19 (11.9%) |
Disability Class: Ambulatory Difficulty
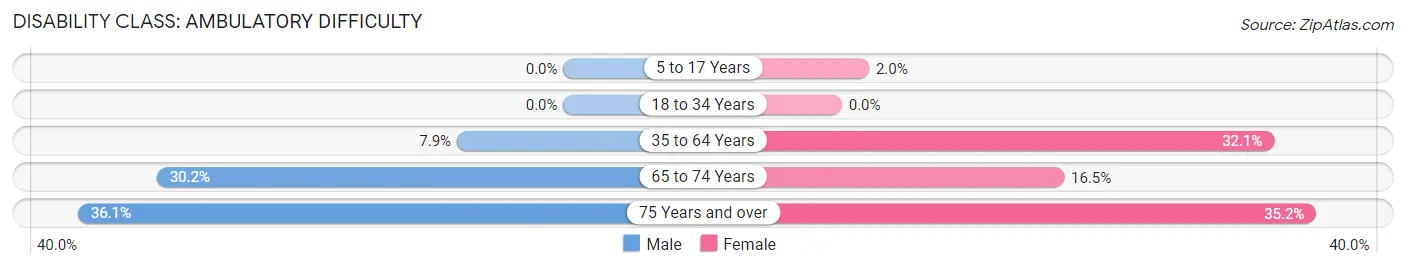
| Age Bracket | Male | Female |
| 5 to 17 Years | 0 (0.0%) | 2 (2.0%) |
| 18 to 34 Years | 0 (0.0%) | 0 (0.0%) |
| 35 to 64 Years | 26 (7.9%) | 87 (32.1%) |
| 65 to 74 Years | 32 (30.2%) | 17 (16.5%) |
| 75 Years and over | 31 (36.0%) | 56 (35.2%) |
Disability Class: Self-Care Difficulty
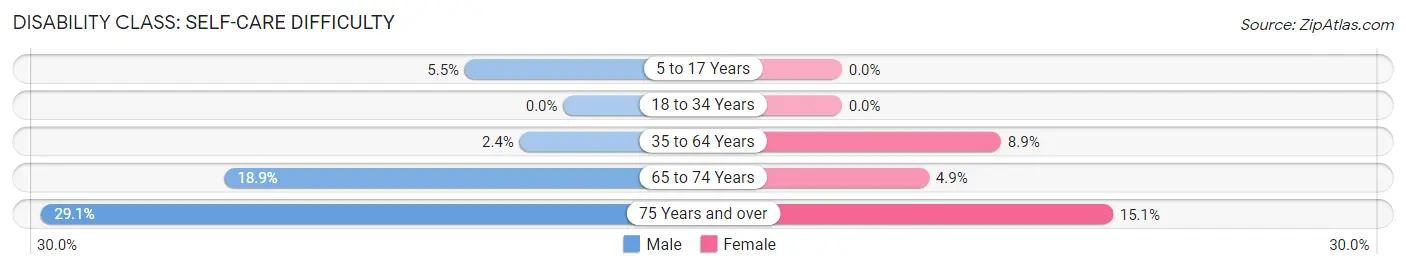
| Age Bracket | Male | Female |
| 5 to 17 Years | 4 (5.5%) | 0 (0.0%) |
| 18 to 34 Years | 0 (0.0%) | 0 (0.0%) |
| 35 to 64 Years | 8 (2.4%) | 24 (8.9%) |
| 65 to 74 Years | 20 (18.9%) | 5 (4.9%) |
| 75 Years and over | 25 (29.1%) | 24 (15.1%) |
Technology Access in Taliaferro County
Computing Device Access in Taliaferro County
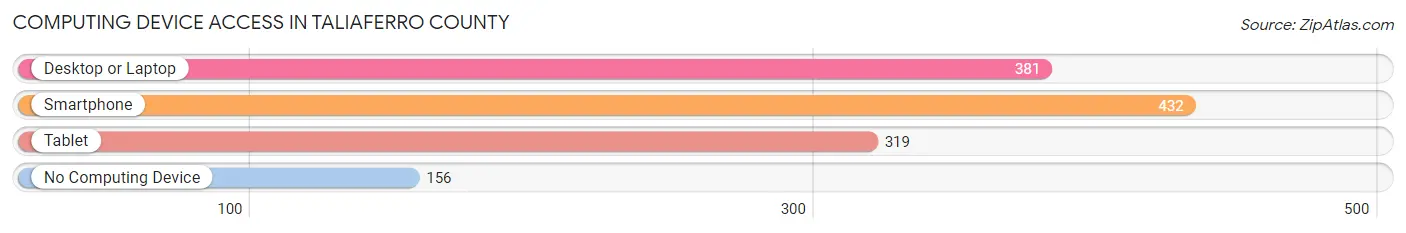
| Device Type | # Households | % Households |
| Desktop or Laptop | 381 | 59.3% |
| Smartphone | 432 | 67.2% |
| Tablet | 319 | 49.6% |
| No Computing Device | 156 | 24.3% |
| Total | 643 | 100.0% |
Internet Access in Taliaferro County
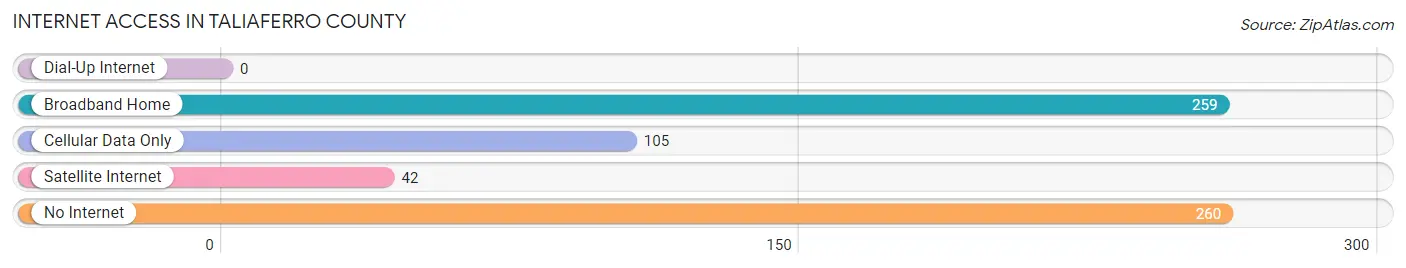
| Internet Type | # Households | % Households |
| Dial-Up Internet | 0 | 0.0% |
| Broadband Home | 259 | 40.3% |
| Cellular Data Only | 105 | 16.3% |
| Satellite Internet | 42 | 6.5% |
| No Internet | 260 | 40.4% |
| Total | 643 | 100.0% |
Taliaferro County Summary
Taliaferro County is a county located in the east-central part of the U.S. state of Georgia. As of the 2010 census, the population was 1,717, making it the least populous county in Georgia. The county seat is Crawfordville. The county was created on December 24, 1825.
History
Taliaferro County was created on December 24, 1825 from parts of Greene, Hancock, and Oglethorpe counties. It was named for Colonel Benjamin Taliaferro, a hero of the American Revolutionary War.
The county was home to the Creek Indians prior to the arrival of European settlers. The first European settlers arrived in the late 1700s and early 1800s. The county was developed for cotton plantations, and the county seat of Crawfordville was established in 1826.
During the American Civil War, Taliaferro County was a major site of the Battle of Griswoldville, which took place on November 22, 1864. The battle was a Confederate victory, and it was the last major battle in the state of Georgia.
Geography
Taliaferro County is located in the east-central part of Georgia. It is bordered by Greene County to the north, Hancock County to the east, Warren County to the south, and Oglethorpe County to the west.
The county has a total area of 181 square miles, of which 180 square miles is land and 1 square mile (0.6%) is water. The county is located in the Piedmont region of Georgia, and the terrain is mostly rolling hills. The county is drained by the Oconee River and its tributaries.
Economy
The economy of Taliaferro County is largely based on agriculture. The county is home to several large farms, and the main crops grown in the county are cotton, corn, soybeans, and peanuts.
The county also has a small manufacturing sector, with several small factories located in the county. The largest employer in the county is the Taliaferro County School System, which employs over 200 people.
Demographics
As of the 2010 census, there were 1,717 people, 690 households, and 486 families living in the county. The population density was 9.5 people per square mile. There were 817 housing units at an average density of 4.5 per square mile.
The racial makeup of the county was 68.2% White, 29.3% Black or African American, 0.2% Native American, 0.2% Asian, 0.1% Pacific Islander, 0.7% from other races, and 1.3% from two or more races. 1.7% of the population were Hispanic or Latino of any race.
The median income for a household in the county was $30,938, and the median income for a family was $37,500. The per capita income for the county was $15,845. About 18.2% of families and 22.2% of the population were below the poverty line, including 28.2% of those under age 18 and 20.2% of those age 65 or over.
Common Questions
What is Per Capita Income in Taliaferro County?
Per Capita income in Taliaferro County is $24,766.
What is the Median Family Income in Taliaferro County?
Median Family Income in Taliaferro County is $45,903.
What is the Median Household income in Taliaferro County?
Median Household Income in Taliaferro County is $45,881.
What is Income or Wage Gap in Taliaferro County?
Income or Wage Gap in Taliaferro County is 16.5%.
Women in Taliaferro County earn 83.5 cents for every dollar earned by a man.
What is Inequality or Gini Index in Taliaferro County?
Inequality or Gini Index in Taliaferro County is 0.38.
What is the Total Population of Taliaferro County?
Total Population of Taliaferro County is 1,635.
What is the Total Male Population of Taliaferro County?
Total Male Population of Taliaferro County is 734.
What is the Total Female Population of Taliaferro County?
Total Female Population of Taliaferro County is 901.
What is the Ratio of Males per 100 Females in Taliaferro County?
There are 81.47 Males per 100 Females in Taliaferro County.
What is the Ratio of Females per 100 Males in Taliaferro County?
There are 122.75 Females per 100 Males in Taliaferro County.
What is the Median Population Age in Taliaferro County?
Median Population Age in Taliaferro County is 47.2 Years.
What is the Average Family Size in Taliaferro County
Average Family Size in Taliaferro County is 3.2 People.
What is the Average Household Size in Taliaferro County
Average Household Size in Taliaferro County is 2.5 People.
How Large is the Labor Force in Taliaferro County?
There are 698 People in the Labor Forcein in Taliaferro County.
What is the Percentage of People in the Labor Force in Taliaferro County?
49.7% of People are in the Labor Force in Taliaferro County.
What is the Unemployment Rate in Taliaferro County?
Unemployment Rate in Taliaferro County is 4.0%.