Talbot County, GA Map & Demographics
Talbot County Map
Talbot County Overview
$28,528
PER CAPITA INCOME
$58,125
AVG FAMILY INCOME
$48,065
AVG HOUSEHOLD INCOME
38.7%
WAGE / INCOME GAP [ % ]
61.3¢/ $1
WAGE / INCOME GAP [ $ ]
0.48
INEQUALITY / GINI INDEX
5,793
TOTAL POPULATION
2,802
MALE POPULATION
2,991
FEMALE POPULATION
93.68
MALES / 100 FEMALES
106.75
FEMALES / 100 MALES
49.9
MEDIAN AGE
2.8
AVG FAMILY SIZE
2.3
AVG HOUSEHOLD SIZE
2,563
LABOR FORCE [ PEOPLE ]
51.8%
PERCENT IN LABOR FORCE
4.3%
UNEMPLOYMENT RATE
Talbot County Area Codes
Income in Talbot County
Income Overview in Talbot County
Per Capita Income in Talbot County is $28,528, while median incomes of families and households are $58,125 and $48,065 respectively.
| Characteristic | Number | Measure |
| Per Capita Income | 5,793 | $28,528 |
| Median Family Income | 1,620 | $58,125 |
| Mean Family Income | 1,620 | $67,631 |
| Median Household Income | 2,538 | $48,065 |
| Mean Household Income | 2,538 | $65,761 |
| Income Deficit | 1,620 | $0 |
| Wage / Income Gap (%) | 5,793 | 38.70% |
| Wage / Income Gap ($) | 5,793 | 61.30¢ per $1 |
| Gini / Inequality Index | 5,793 | 0.48 |
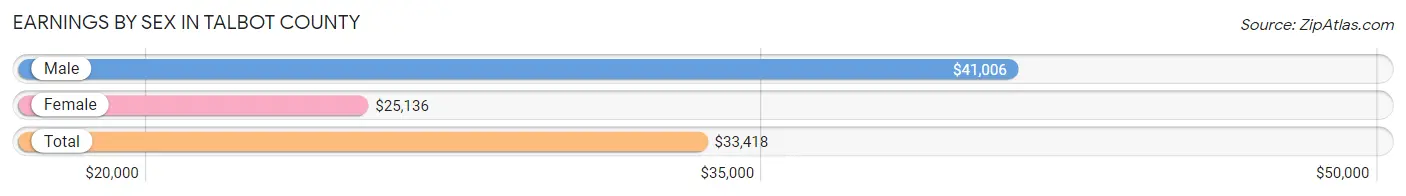
Earnings by Sex in Talbot County
Average Earnings in Talbot County are $33,418, $41,006 for men and $25,136 for women, a difference of 38.7%.
| Sex | Number | Average Earnings |
| Male | 1,365 (51.7%) | $41,006 |
| Female | 1,276 (48.3%) | $25,136 |
| Total | 2,641 (100.0%) | $33,418 |
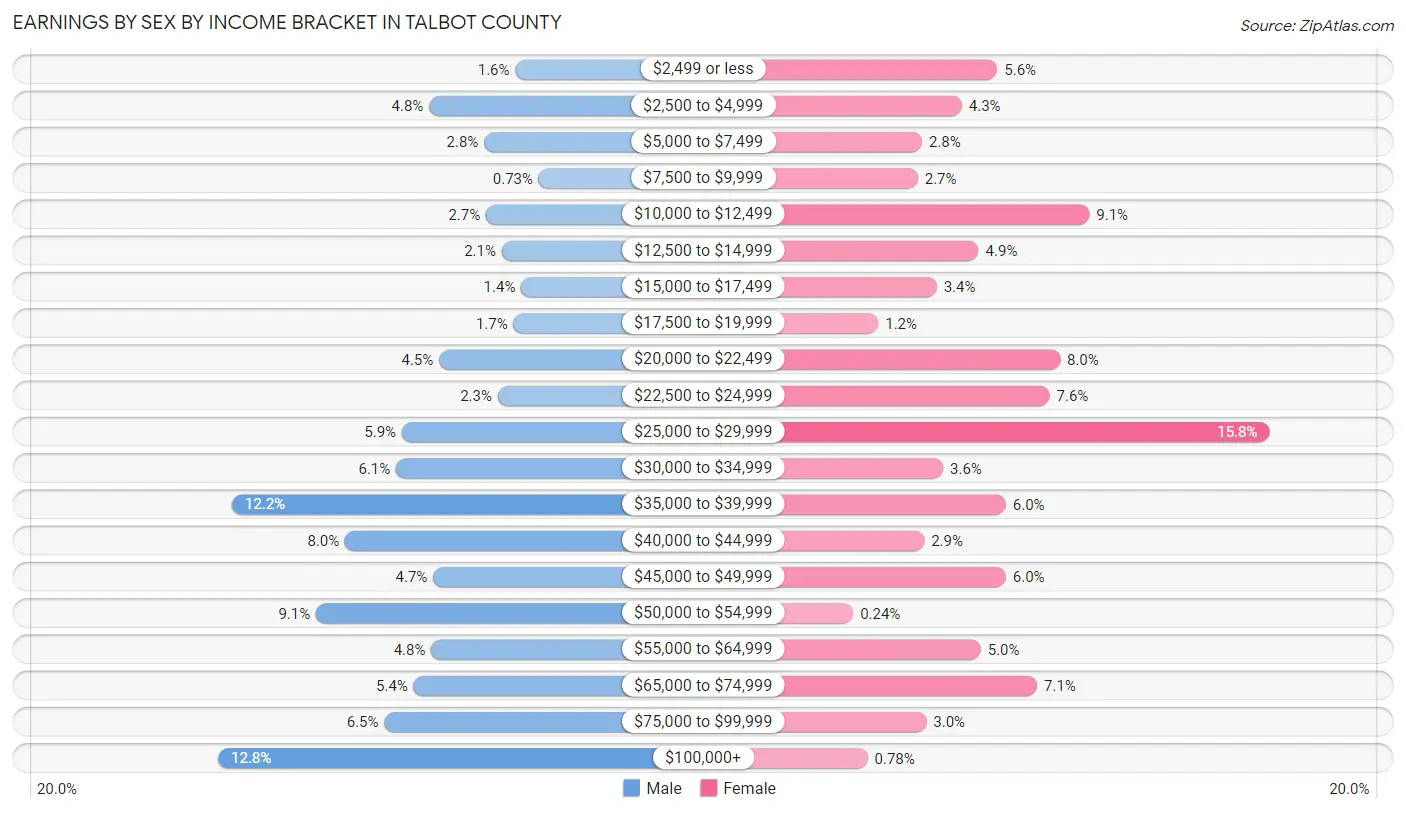
Earnings by Sex by Income Bracket in Talbot County
The most common earnings brackets in Talbot County are $100,000+ for men (174 | 12.8%) and $25,000 to $29,999 for women (202 | 15.8%).
| Income | Male | Female |
| $2,499 or less | 22 (1.6%) | 72 (5.6%) |
| $2,500 to $4,999 | 66 (4.8%) | 55 (4.3%) |
| $5,000 to $7,499 | 38 (2.8%) | 36 (2.8%) |
| $7,500 to $9,999 | 10 (0.7%) | 34 (2.7%) |
| $10,000 to $12,499 | 37 (2.7%) | 116 (9.1%) |
| $12,500 to $14,999 | 29 (2.1%) | 63 (4.9%) |
| $15,000 to $17,499 | 19 (1.4%) | 43 (3.4%) |
| $17,500 to $19,999 | 23 (1.7%) | 15 (1.2%) |
| $20,000 to $22,499 | 61 (4.5%) | 102 (8.0%) |
| $22,500 to $24,999 | 31 (2.3%) | 97 (7.6%) |
| $25,000 to $29,999 | 80 (5.9%) | 202 (15.8%) |
| $30,000 to $34,999 | 83 (6.1%) | 46 (3.6%) |
| $35,000 to $39,999 | 167 (12.2%) | 76 (6.0%) |
| $40,000 to $44,999 | 109 (8.0%) | 37 (2.9%) |
| $45,000 to $49,999 | 64 (4.7%) | 76 (6.0%) |
| $50,000 to $54,999 | 124 (9.1%) | 3 (0.2%) |
| $55,000 to $64,999 | 65 (4.8%) | 64 (5.0%) |
| $65,000 to $74,999 | 74 (5.4%) | 91 (7.1%) |
| $75,000 to $99,999 | 89 (6.5%) | 38 (3.0%) |
| $100,000+ | 174 (12.8%) | 10 (0.8%) |
| Total | 1,365 (100.0%) | 1,276 (100.0%) |
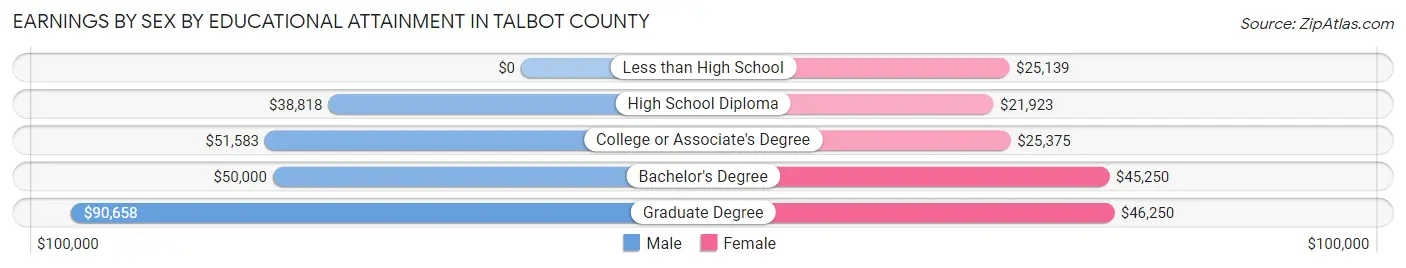
Earnings by Sex by Educational Attainment in Talbot County
Average earnings in Talbot County are $43,805 for men and $26,603 for women, a difference of 39.3%. Men with an educational attainment of graduate degree enjoy the highest average annual earnings of $90,658, while those with high school diploma education earn the least with $38,818. Women with an educational attainment of graduate degree earn the most with the average annual earnings of $46,250, while those with high school diploma education have the smallest earnings of $21,923.
| Educational Attainment | Male Income | Female Income |
| Less than High School | - | - |
| High School Diploma | $38,818 | $21,923 |
| College or Associate's Degree | $51,583 | $25,375 |
| Bachelor's Degree | $50,000 | $45,250 |
| Graduate Degree | $90,658 | $46,250 |
| Total | $43,805 | $26,603 |
Family Income in Talbot County
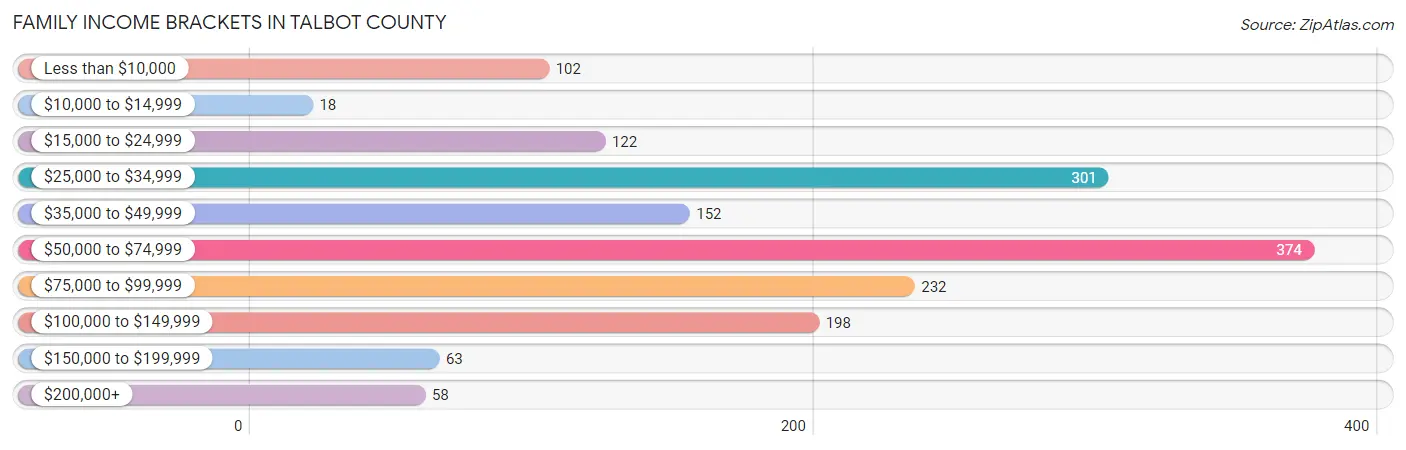
Family Income Brackets in Talbot County
According to the Talbot County family income data, there are 374 families falling into the $50,000 to $74,999 income range, which is the most common income bracket and makes up 23.1% of all families. Conversely, the $10,000 to $14,999 income bracket is the least frequent group with only 18 families (1.1%) belonging to this category.
| Income Bracket | # Families | % Families |
| Less than $10,000 | 102 | 6.3% |
| $10,000 to $14,999 | 18 | 1.1% |
| $15,000 to $24,999 | 122 | 7.5% |
| $25,000 to $34,999 | 301 | 18.6% |
| $35,000 to $49,999 | 152 | 9.4% |
| $50,000 to $74,999 | 374 | 23.1% |
| $75,000 to $99,999 | 232 | 14.3% |
| $100,000 to $149,999 | 198 | 12.2% |
| $150,000 to $199,999 | 63 | 3.9% |
| $200,000+ | 58 | 3.6% |
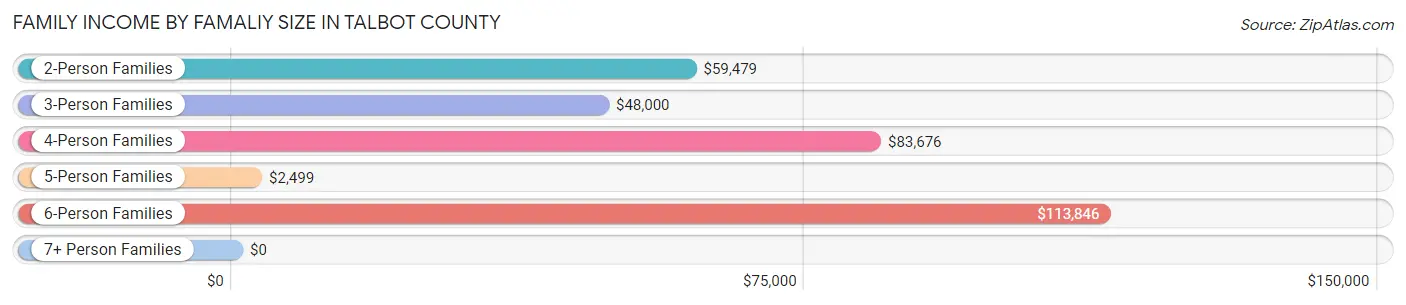
Family Income by Famaliy Size in Talbot County
6-person families (44 | 2.7%) account for the highest median family income in Talbot County with $113,846 per family, while 2-person families (827 | 51.0%) have the highest median income of $29,740 per family member.
| Income Bracket | # Families | Median Income |
| 2-Person Families | 827 (51.0%) | $59,479 |
| 3-Person Families | 546 (33.7%) | $48,000 |
| 4-Person Families | 166 (10.2%) | $83,676 |
| 5-Person Families | 18 (1.1%) | $2,499 |
| 6-Person Families | 44 (2.7%) | $113,846 |
| 7+ Person Families | 19 (1.2%) | $0 |
| Total | 1,620 (100.0%) | $58,125 |
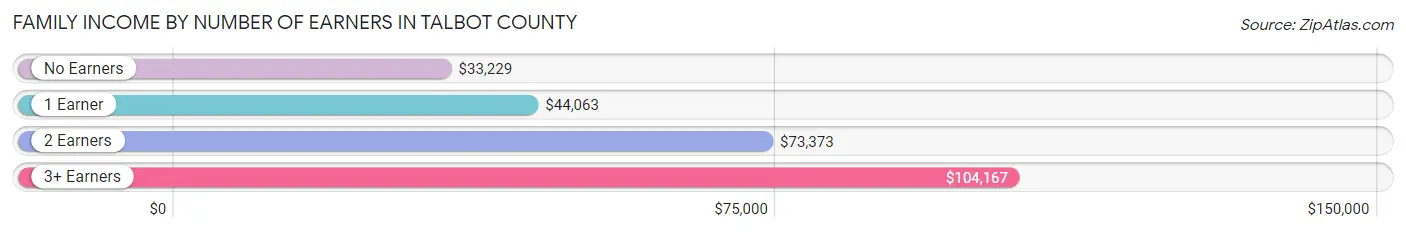
Family Income by Number of Earners in Talbot County
The median family income in Talbot County is $58,125, with families comprising 3+ earners (150) having the highest median family income of $104,167, while families with no earners (348) have the lowest median family income of $33,229, accounting for 9.3% and 21.5% of families, respectively.
| Number of Earners | # Families | Median Income |
| No Earners | 348 (21.5%) | $33,229 |
| 1 Earner | 619 (38.2%) | $44,063 |
| 2 Earners | 503 (31.0%) | $73,373 |
| 3+ Earners | 150 (9.3%) | $104,167 |
| Total | 1,620 (100.0%) | $58,125 |
Household Income in Talbot County
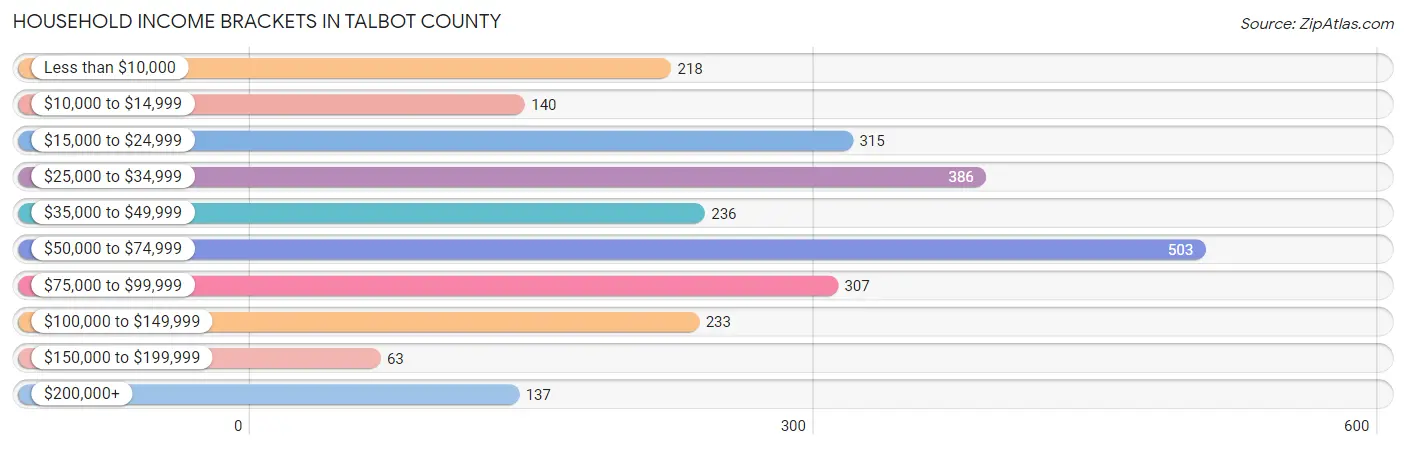
Household Income Brackets in Talbot County
With 503 households falling in the category, the $50,000 to $74,999 income range is the most frequent in Talbot County, accounting for 19.8% of all households. In contrast, only 63 households (2.5%) fall into the $150,000 to $199,999 income bracket, making it the least populous group.
| Income Bracket | # Households | % Households |
| Less than $10,000 | 218 | 8.6% |
| $10,000 to $14,999 | 140 | 5.5% |
| $15,000 to $24,999 | 315 | 12.4% |
| $25,000 to $34,999 | 386 | 15.2% |
| $35,000 to $49,999 | 236 | 9.3% |
| $50,000 to $74,999 | 503 | 19.8% |
| $75,000 to $99,999 | 307 | 12.1% |
| $100,000 to $149,999 | 233 | 9.2% |
| $150,000 to $199,999 | 63 | 2.5% |
| $200,000+ | 137 | 5.4% |
Household Income by Householder Age in Talbot County
The median household income in Talbot County is $48,065, with the highest median household income of $65,734 found in the 45 to 64 years age bracket for the primary householder. A total of 1,065 households (42.0%) fall into this category. Meanwhile, the 65+ years age bracket for the primary householder has the lowest median household income of $30,682, with 1,052 households (41.4%) in this group.
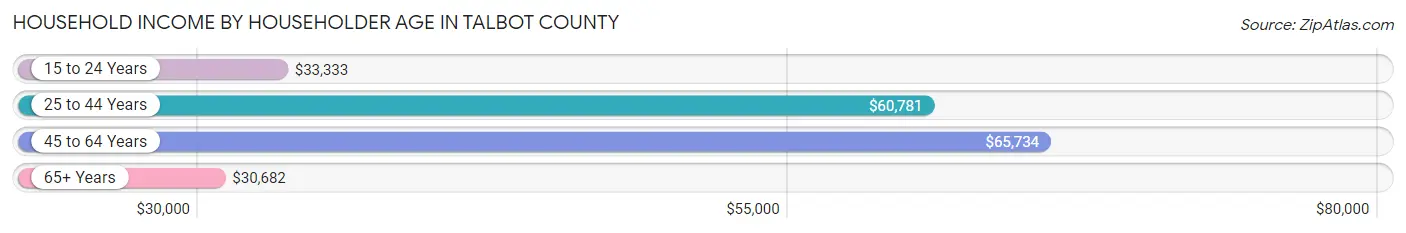
| Income Bracket | # Households | Median Income |
| 15 to 24 Years | 8 (0.3%) | $33,333 |
| 25 to 44 Years | 413 (16.3%) | $60,781 |
| 45 to 64 Years | 1,065 (42.0%) | $65,734 |
| 65+ Years | 1,052 (41.4%) | $30,682 |
| Total | 2,538 (100.0%) | $48,065 |
Poverty in Talbot County
Income Below Poverty by Sex and Age in Talbot County
With 17.3% poverty level for males and 19.4% for females among the residents of Talbot County, 5 year old males and 5 year old females are the most vulnerable to poverty, with 5 males (71.4%) and 3 females (100.0%) in their respective age groups living below the poverty level.
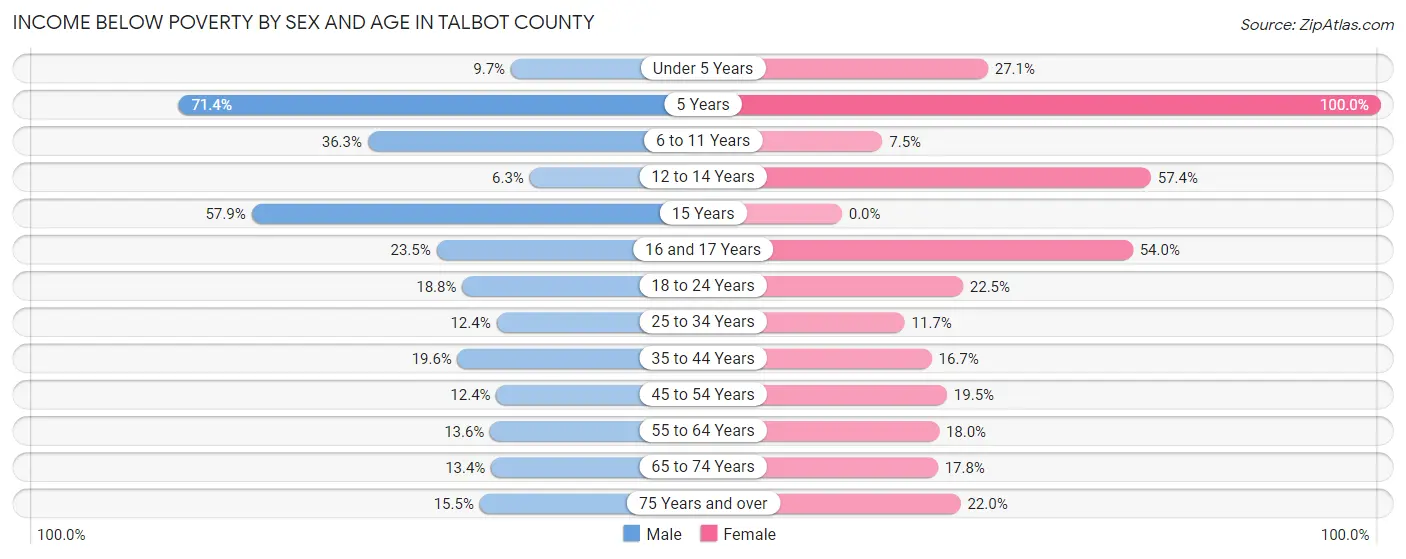
| Age Bracket | Male | Female |
| Under 5 Years | 11 (9.7%) | 29 (27.1%) |
| 5 Years | 5 (71.4%) | 3 (100.0%) |
| 6 to 11 Years | 98 (36.3%) | 14 (7.5%) |
| 12 to 14 Years | 1 (6.2%) | 39 (57.4%) |
| 15 Years | 22 (57.9%) | 0 (0.0%) |
| 16 and 17 Years | 12 (23.5%) | 27 (54.0%) |
| 18 to 24 Years | 39 (18.8%) | 51 (22.5%) |
| 25 to 34 Years | 36 (12.4%) | 33 (11.7%) |
| 35 to 44 Years | 50 (19.6%) | 50 (16.7%) |
| 45 to 54 Years | 42 (12.4%) | 71 (19.5%) |
| 55 to 64 Years | 69 (13.6%) | 99 (18.0%) |
| 65 to 74 Years | 60 (13.4%) | 84 (17.8%) |
| 75 Years and over | 36 (15.5%) | 76 (22.0%) |
| Total | 481 (17.3%) | 576 (19.4%) |
Income Above Poverty by Sex and Age in Talbot County
According to the poverty statistics in Talbot County, males aged 12 to 14 years and females aged 15 years are the age groups that are most secure financially, with 93.8% of males and 100.0% of females in these age groups living above the poverty line.
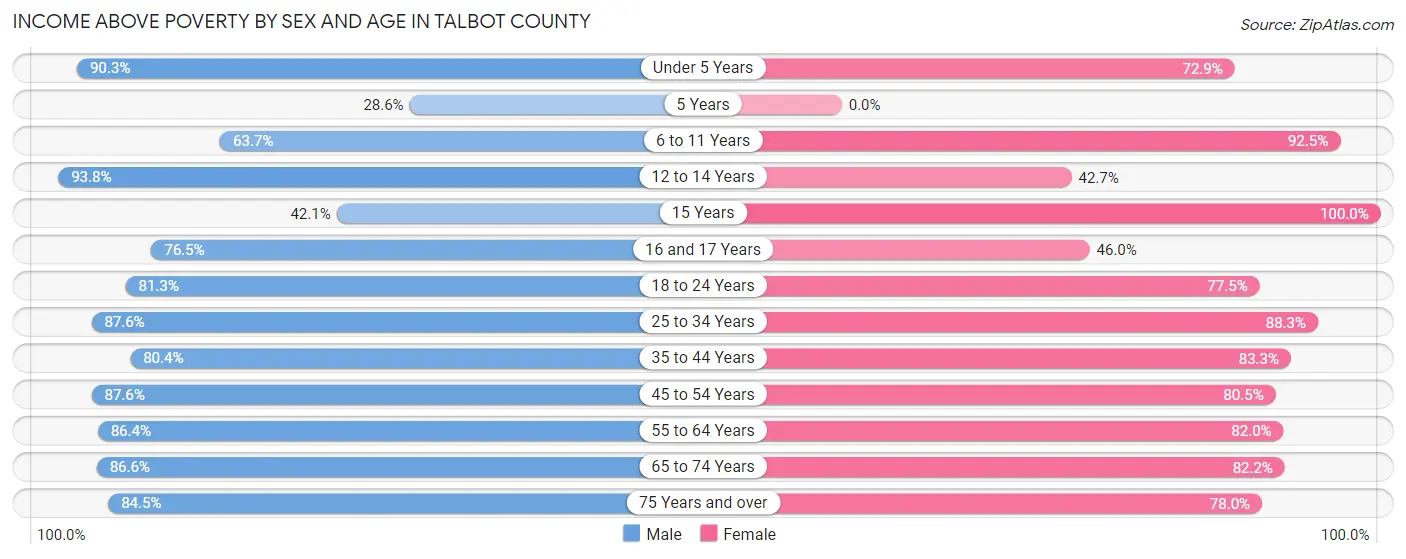
| Age Bracket | Male | Female |
| Under 5 Years | 102 (90.3%) | 78 (72.9%) |
| 5 Years | 2 (28.6%) | 0 (0.0%) |
| 6 to 11 Years | 172 (63.7%) | 172 (92.5%) |
| 12 to 14 Years | 15 (93.8%) | 29 (42.6%) |
| 15 Years | 16 (42.1%) | 14 (100.0%) |
| 16 and 17 Years | 39 (76.5%) | 23 (46.0%) |
| 18 to 24 Years | 169 (81.2%) | 176 (77.5%) |
| 25 to 34 Years | 254 (87.6%) | 250 (88.3%) |
| 35 to 44 Years | 205 (80.4%) | 250 (83.3%) |
| 45 to 54 Years | 296 (87.6%) | 293 (80.5%) |
| 55 to 64 Years | 439 (86.4%) | 450 (82.0%) |
| 65 to 74 Years | 388 (86.6%) | 388 (82.2%) |
| 75 Years and over | 196 (84.5%) | 269 (78.0%) |
| Total | 2,293 (82.7%) | 2,392 (80.6%) |
Income Below Poverty Among Married-Couple Families in Talbot County
The poverty statistics for married-couple families in Talbot County show that 8.9% or 89 of the total 1,005 families live below the poverty line. Families with 5 or more children have the highest poverty rate of 100.0%, comprising of 5 families. On the other hand, families with no children have the lowest poverty rate of 6.7%, which includes 53 families.
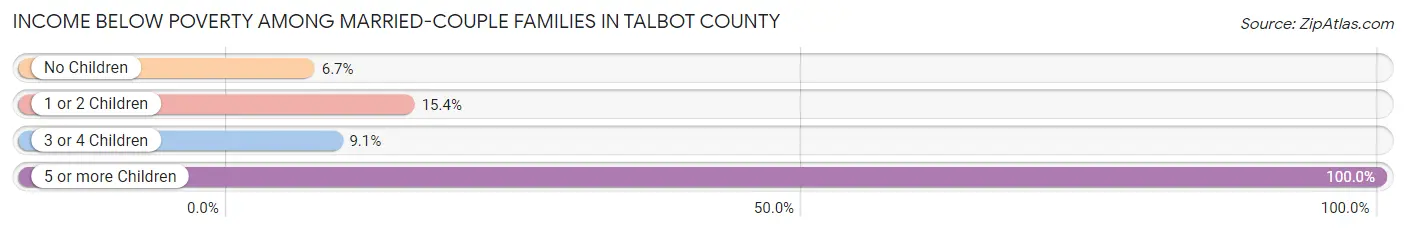
| Children | Above Poverty | Below Poverty |
| No Children | 741 (93.3%) | 53 (6.7%) |
| 1 or 2 Children | 165 (84.6%) | 30 (15.4%) |
| 3 or 4 Children | 10 (90.9%) | 1 (9.1%) |
| 5 or more Children | 0 (0.0%) | 5 (100.0%) |
| Total | 916 (91.1%) | 89 (8.9%) |
Income Below Poverty Among Single-Parent Households in Talbot County
According to the poverty data in Talbot County, 8.0% or 9 single-father households and 29.1% or 146 single-mother households are living below the poverty line. Among single-father households, those with no children have the highest poverty rate, with 9 households (10.1%) experiencing poverty. Likewise, among single-mother households, those with 3 or 4 children have the highest poverty rate, with 17 households (53.1%) falling below the poverty line.
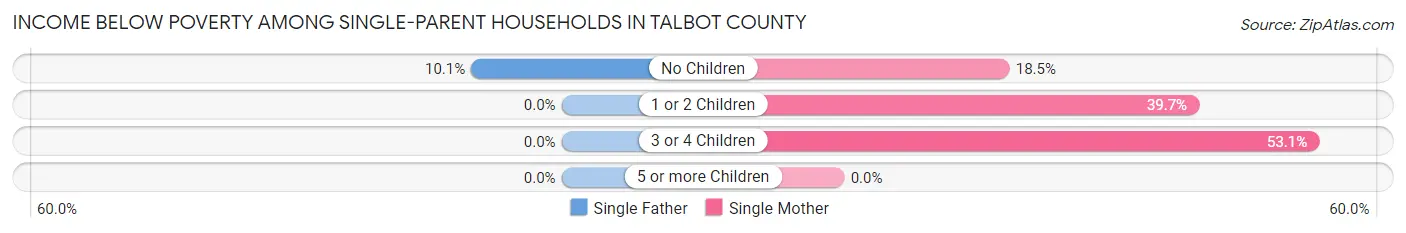
| Children | Single Father | Single Mother |
| No Children | 9 (10.1%) | 50 (18.4%) |
| 1 or 2 Children | 0 (0.0%) | 79 (39.7%) |
| 3 or 4 Children | 0 (0.0%) | 17 (53.1%) |
| 5 or more Children | 0 (0.0%) | 0 (0.0%) |
| Total | 9 (8.0%) | 146 (29.1%) |
Income Below Poverty Among Married-Couple vs Single-Parent Households in Talbot County
The poverty data for Talbot County shows that 89 of the married-couple family households (8.9%) and 155 of the single-parent households (25.2%) are living below the poverty level. Within the married-couple family households, those with 5 or more children have the highest poverty rate, with 5 households (100.0%) falling below the poverty line. Among the single-parent households, those with 3 or 4 children have the highest poverty rate, with 17 household (53.1%) living below poverty.
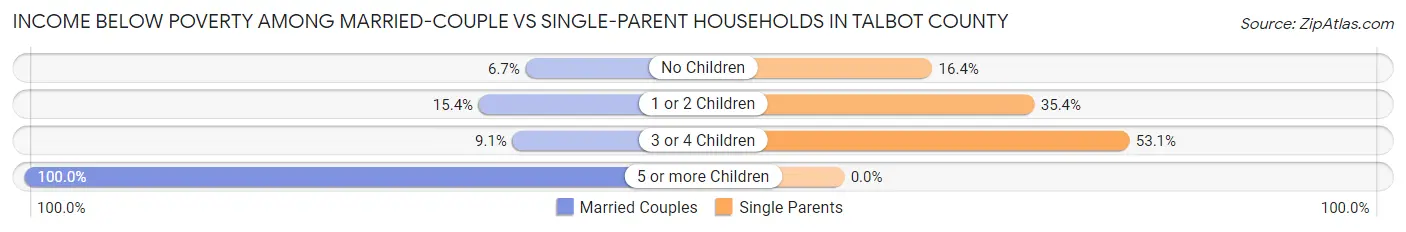
| Children | Married-Couple Families | Single-Parent Households |
| No Children | 53 (6.7%) | 59 (16.4%) |
| 1 or 2 Children | 30 (15.4%) | 79 (35.4%) |
| 3 or 4 Children | 1 (9.1%) | 17 (53.1%) |
| 5 or more Children | 5 (100.0%) | 0 (0.0%) |
| Total | 89 (8.9%) | 155 (25.2%) |
Race in Talbot County
The most populous races in Talbot County are Black / African American (3,275 | 56.5%), White / Caucasian (2,373 | 41.0%), and Two or more Races (89 | 1.5%).
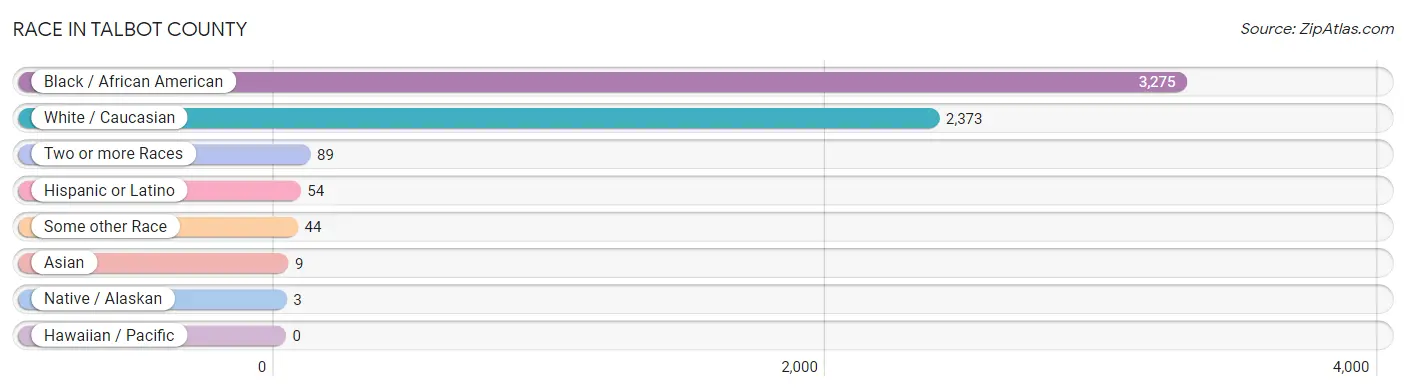
| Race | # Population | % Population |
| Asian | 9 | 0.2% |
| Black / African American | 3,275 | 56.5% |
| Hawaiian / Pacific | 0 | 0.0% |
| Hispanic or Latino | 54 | 0.9% |
| Native / Alaskan | 3 | 0.1% |
| White / Caucasian | 2,373 | 41.0% |
| Two or more Races | 89 | 1.5% |
| Some other Race | 44 | 0.8% |
| Total | 5,793 | 100.0% |
Ancestry in Talbot County
The most populous ancestries reported in Talbot County are American (560 | 9.7%), English (312 | 5.4%), Irish (294 | 5.1%), German (235 | 4.1%), and Scottish (97 | 1.7%), together accounting for 25.9% of all Talbot County residents.
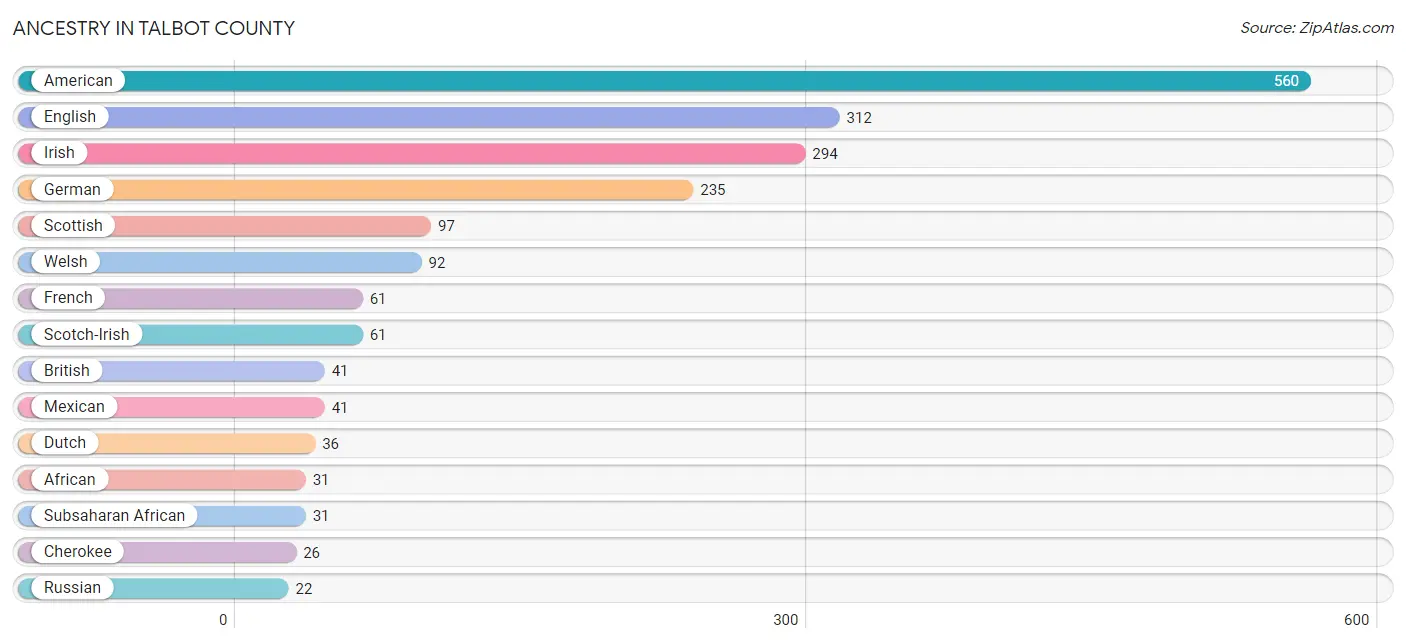
| Ancestry | # Population | % Population |
| African | 31 | 0.5% |
| American | 560 | 9.7% |
| British | 41 | 0.7% |
| Cherokee | 26 | 0.4% |
| Chickasaw | 1 | 0.0% |
| Chippewa | 2 | 0.0% |
| Choctaw | 3 | 0.1% |
| Cuban | 10 | 0.2% |
| Dutch | 36 | 0.6% |
| English | 312 | 5.4% |
| European | 6 | 0.1% |
| French | 61 | 1.1% |
| German | 235 | 4.1% |
| Greek | 2 | 0.0% |
| Irish | 294 | 5.1% |
| Italian | 9 | 0.2% |
| Jamaican | 1 | 0.0% |
| Mexican | 41 | 0.7% |
| Norwegian | 14 | 0.2% |
| Portuguese | 5 | 0.1% |
| Puerto Rican | 3 | 0.1% |
| Russian | 22 | 0.4% |
| Scandinavian | 21 | 0.4% |
| Scotch-Irish | 61 | 1.1% |
| Scottish | 97 | 1.7% |
| Sri Lankan | 9 | 0.2% |
| Subsaharan African | 31 | 0.5% |
| Swedish | 12 | 0.2% |
| Welsh | 92 | 1.6% | View All 29 Rows |
Immigrants in Talbot County
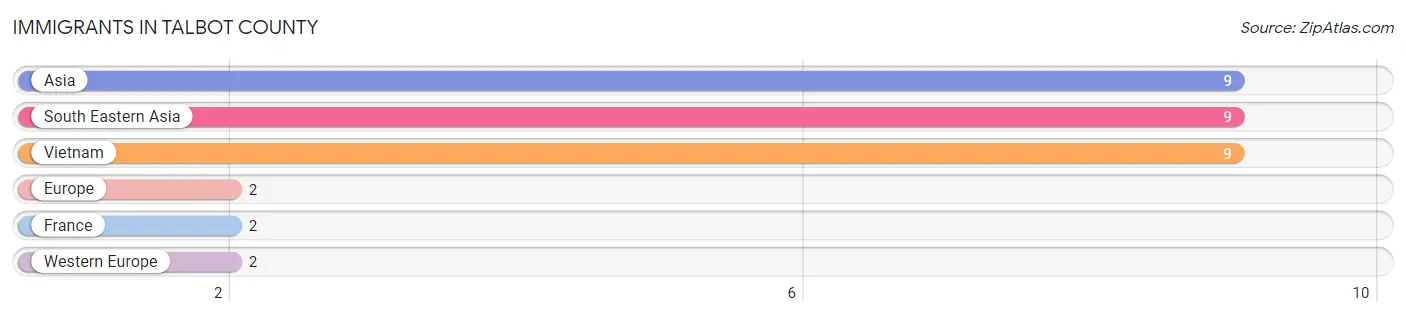
The most numerous immigrant groups reported in Talbot County came from Asia (9 | 0.2%), South Eastern Asia (9 | 0.2%), Vietnam (9 | 0.2%), Europe (2 | 0.0%), and France (2 | 0.0%), together accounting for 0.5% of all Talbot County residents.
| Immigration Origin | # Population | % Population |
| Asia | 9 | 0.2% |
| Europe | 2 | 0.0% |
| France | 2 | 0.0% |
| South Eastern Asia | 9 | 0.2% |
| Vietnam | 9 | 0.2% |
| Western Europe | 2 | 0.0% | View All 6 Rows |
Sex and Age in Talbot County
Sex and Age in Talbot County
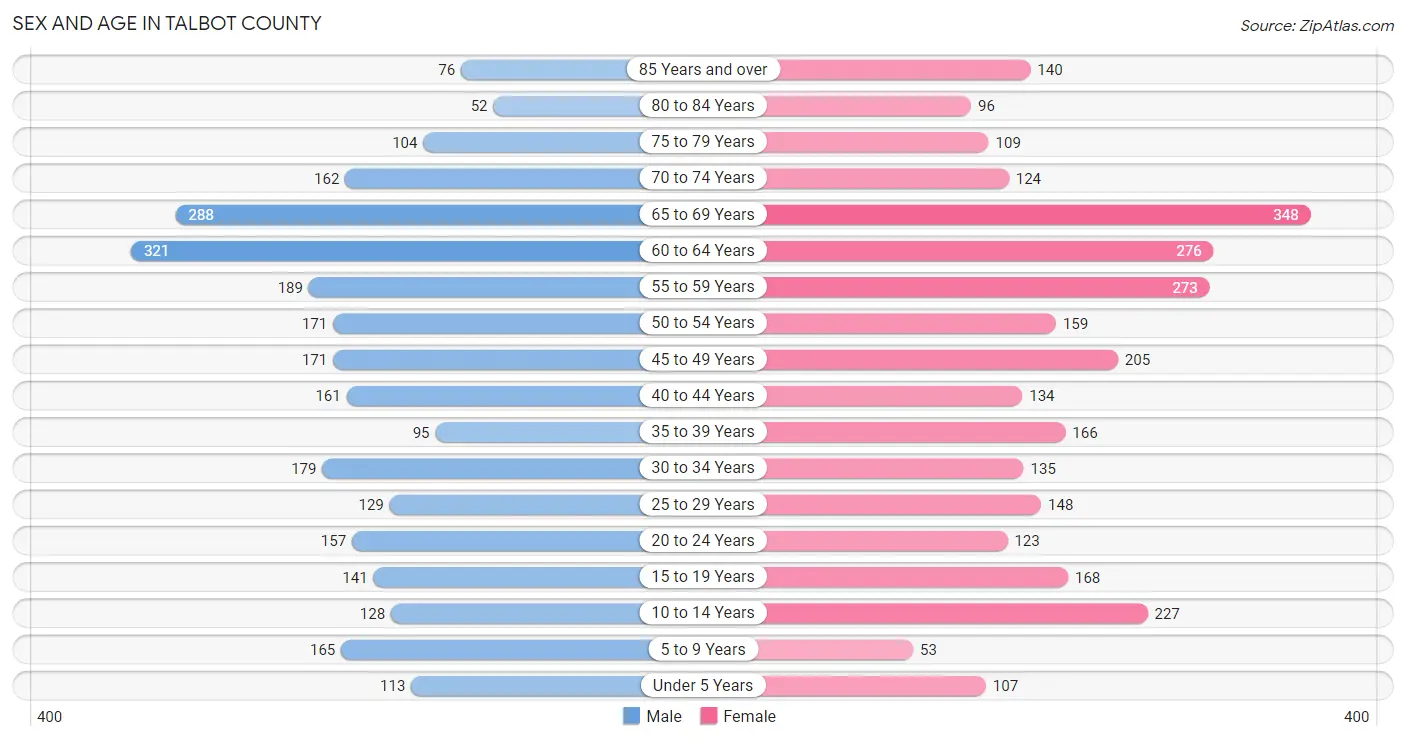
The most populous age groups in Talbot County are 60 to 64 Years (321 | 11.5%) for men and 65 to 69 Years (348 | 11.6%) for women.
| Age Bracket | Male | Female |
| Under 5 Years | 113 (4.0%) | 107 (3.6%) |
| 5 to 9 Years | 165 (5.9%) | 53 (1.8%) |
| 10 to 14 Years | 128 (4.6%) | 227 (7.6%) |
| 15 to 19 Years | 141 (5.0%) | 168 (5.6%) |
| 20 to 24 Years | 157 (5.6%) | 123 (4.1%) |
| 25 to 29 Years | 129 (4.6%) | 148 (5.0%) |
| 30 to 34 Years | 179 (6.4%) | 135 (4.5%) |
| 35 to 39 Years | 95 (3.4%) | 166 (5.6%) |
| 40 to 44 Years | 161 (5.8%) | 134 (4.5%) |
| 45 to 49 Years | 171 (6.1%) | 205 (6.9%) |
| 50 to 54 Years | 171 (6.1%) | 159 (5.3%) |
| 55 to 59 Years | 189 (6.8%) | 273 (9.1%) |
| 60 to 64 Years | 321 (11.5%) | 276 (9.2%) |
| 65 to 69 Years | 288 (10.3%) | 348 (11.6%) |
| 70 to 74 Years | 162 (5.8%) | 124 (4.2%) |
| 75 to 79 Years | 104 (3.7%) | 109 (3.6%) |
| 80 to 84 Years | 52 (1.9%) | 96 (3.2%) |
| 85 Years and over | 76 (2.7%) | 140 (4.7%) |
| Total | 2,802 (100.0%) | 2,991 (100.0%) |
Families and Households in Talbot County
Median Family Size in Talbot County
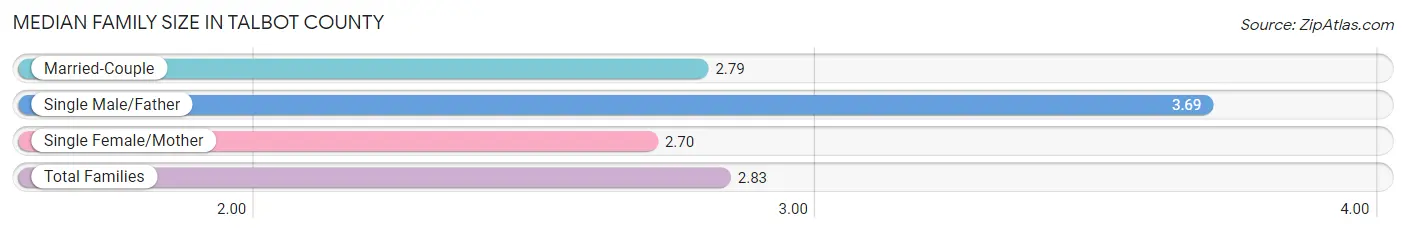
The median family size in Talbot County is 2.83 persons per family, with single male/father families (113 | 7.0%) accounting for the largest median family size of 3.69 persons per family. On the other hand, single female/mother families (502 | 31.0%) represent the smallest median family size with 2.70 persons per family.
| Family Type | # Families | Family Size |
| Married-Couple | 1,005 (62.0%) | 2.79 |
| Single Male/Father | 113 (7.0%) | 3.69 |
| Single Female/Mother | 502 (31.0%) | 2.70 |
| Total Families | 1,620 (100.0%) | 2.83 |
Median Household Size in Talbot County
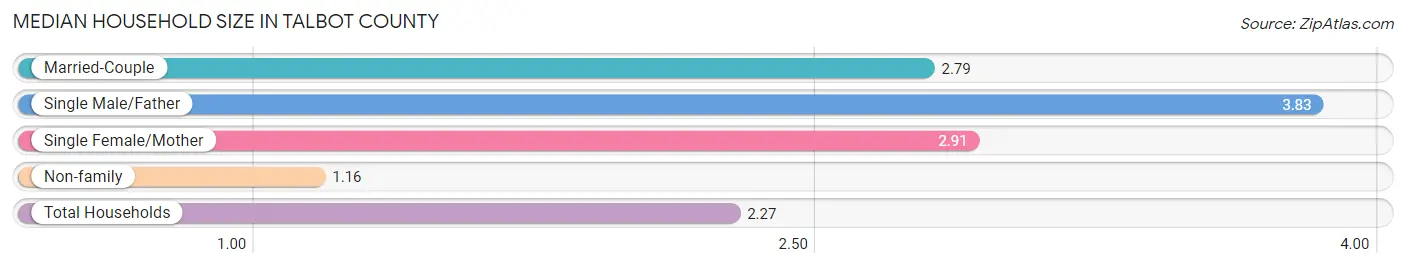
The median household size in Talbot County is 2.27 persons per household, with single male/father households (113 | 4.4%) accounting for the largest median household size of 3.83 persons per household. non-family households (918 | 36.2%) represent the smallest median household size with 1.16 persons per household.
| Household Type | # Households | Household Size |
| Married-Couple | 1,005 (39.6%) | 2.79 |
| Single Male/Father | 113 (4.4%) | 3.83 |
| Single Female/Mother | 502 (19.8%) | 2.91 |
| Non-family | 918 (36.2%) | 1.16 |
| Total Households | 2,538 (100.0%) | 2.27 |
Household Size by Marriage Status in Talbot County
Out of a total of 2,538 households in Talbot County, 1,620 (63.8%) are family households, while 918 (36.2%) are nonfamily households. The most numerous type of family households are 2-person households, comprising 814, and the most common type of nonfamily households are 1-person households, comprising 771.
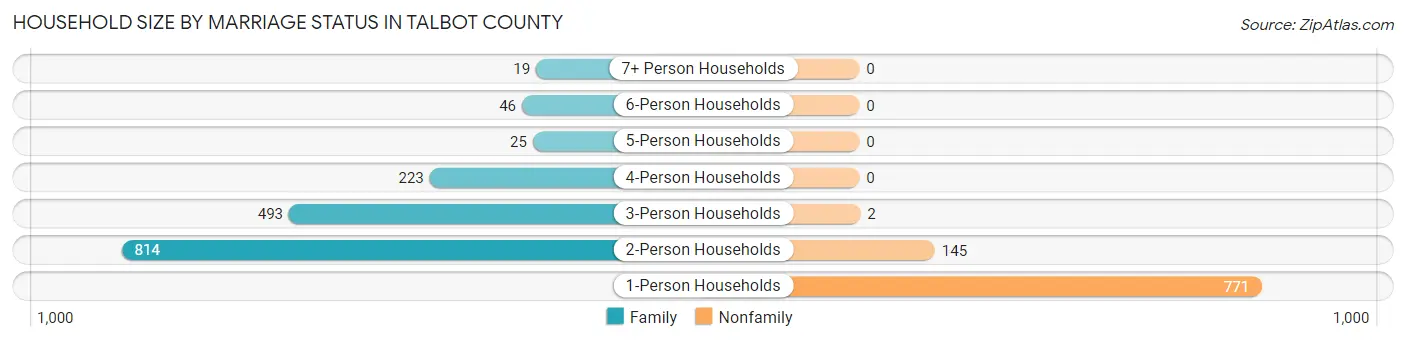
| Household Size | Family Households | Nonfamily Households |
| 1-Person Households | - | 771 (30.4%) |
| 2-Person Households | 814 (32.1%) | 145 (5.7%) |
| 3-Person Households | 493 (19.4%) | 2 (0.1%) |
| 4-Person Households | 223 (8.8%) | 0 (0.0%) |
| 5-Person Households | 25 (1.0%) | 0 (0.0%) |
| 6-Person Households | 46 (1.8%) | 0 (0.0%) |
| 7+ Person Households | 19 (0.7%) | 0 (0.0%) |
| Total | 1,620 (63.8%) | 918 (36.2%) |
Female Fertility in Talbot County
Fertility by Age in Talbot County
Average fertility rate in Talbot County is 47.0 births per 1,000 women. Women in the age bracket of 35 to 50 years have the highest fertility rate with 91.0 births per 1,000 women. Women in the age bracket of 35 to 50 years acount for 92.2% of all women with births.
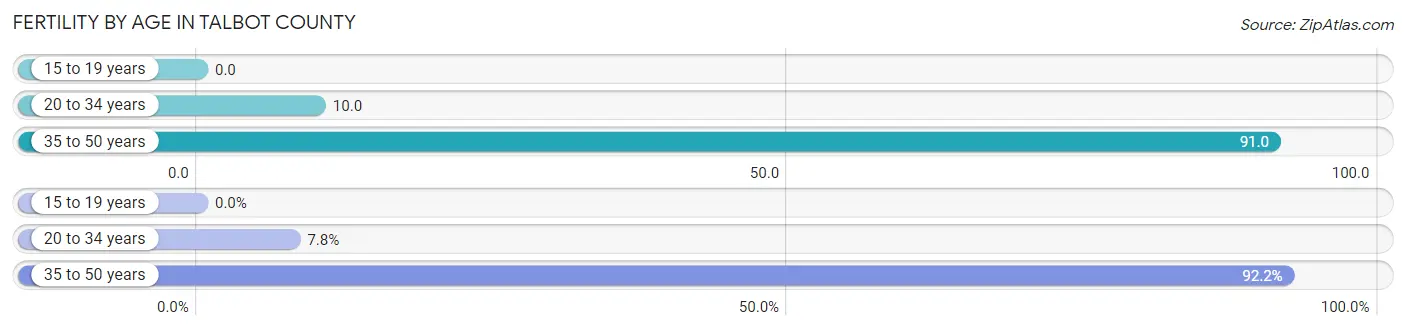
| Age Bracket | Women with Births | Births / 1,000 Women |
| 15 to 19 years | 0 (0.0%) | 0.0 |
| 20 to 34 years | 4 (7.8%) | 10.0 |
| 35 to 50 years | 47 (92.2%) | 91.0 |
| Total | 51 (100.0%) | 47.0 |
Fertility by Age by Marriage Status in Talbot County
7.8% of women with births (51) in Talbot County are married. The highest percentage of unmarried women with births falls into 35 to 50 years age bracket with 100.0% of them unmarried at the time of birth, while the lowest percentage of unmarried women with births belong to 20 to 34 years age bracket with 0.0% of them unmarried.
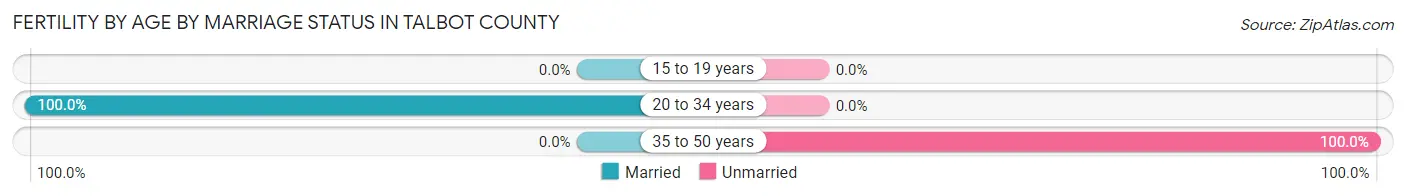
| Age Bracket | Married | Unmarried |
| 15 to 19 years | 0 (0.0%) | 0 (0.0%) |
| 20 to 34 years | 4 (100.0%) | 0 (0.0%) |
| 35 to 50 years | 0 (0.0%) | 47 (100.0%) |
| Total | 4 (7.8%) | 47 (92.2%) |
Fertility by Education in Talbot County
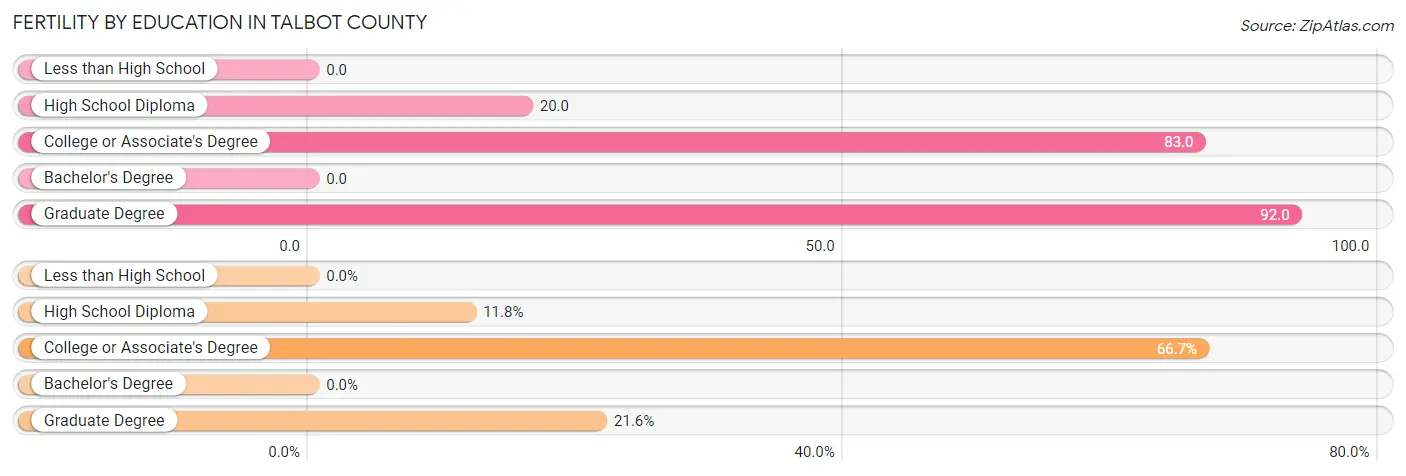
| Educational Attainment | Women with Births | Births / 1,000 Women |
| Less than High School | 0 (0.0%) | 0.0 |
| High School Diploma | 6 (11.8%) | 20.0 |
| College or Associate's Degree | 34 (66.7%) | 83.0 |
| Bachelor's Degree | 0 (0.0%) | 0.0 |
| Graduate Degree | 11 (21.6%) | 92.0 |
| Total | 51 (100.0%) | 47.0 |
Fertility by Education by Marriage Status in Talbot County
92.2% of women with births in Talbot County are unmarried. Women with the educational attainment of college or associate's degree are most likely to be married with 11.8% of them married at childbirth, while women with the educational attainment of high school diploma are least likely to be married with 100.0% of them unmarried at childbirth.
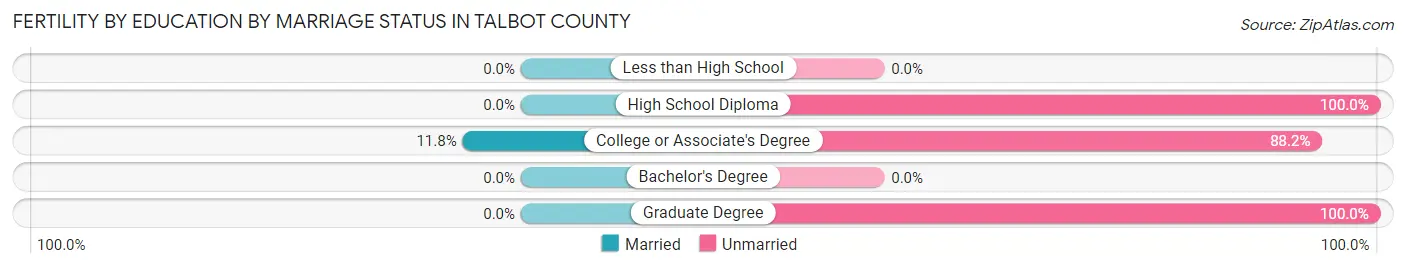
| Educational Attainment | Married | Unmarried |
| Less than High School | 0 (0.0%) | 0 (0.0%) |
| High School Diploma | 0 (0.0%) | 6 (100.0%) |
| College or Associate's Degree | 4 (11.8%) | 30 (88.2%) |
| Bachelor's Degree | 0 (0.0%) | 0 (0.0%) |
| Graduate Degree | 0 (0.0%) | 11 (100.0%) |
| Total | 4 (7.8%) | 47 (92.2%) |
Employment Characteristics in Talbot County
Employment by Class of Employer in Talbot County
Among the 2,420 employed individuals in Talbot County, private company employees (1,543 | 63.8%), state government employees (354 | 14.6%), and local government employees (177 | 7.3%) make up the most common classes of employment.
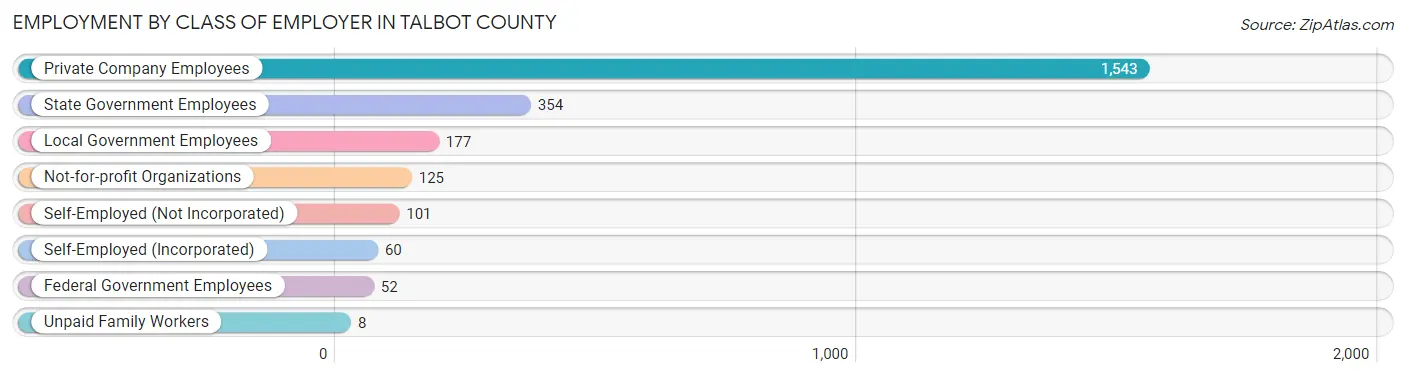
| Employer Class | # Employees | % Employees |
| Private Company Employees | 1,543 | 63.8% |
| Self-Employed (Incorporated) | 60 | 2.5% |
| Self-Employed (Not Incorporated) | 101 | 4.2% |
| Not-for-profit Organizations | 125 | 5.2% |
| Local Government Employees | 177 | 7.3% |
| State Government Employees | 354 | 14.6% |
| Federal Government Employees | 52 | 2.1% |
| Unpaid Family Workers | 8 | 0.3% |
| Total | 2,420 | 100.0% |
Employment Status by Age in Talbot County
According to the labor force statistics for Talbot County, out of the total population over 16 years of age (4,948), 51.8% or 2,563 individuals are in the labor force, with 4.3% or 110 of them unemployed. The age group with the highest labor force participation rate is 35 to 44 years, with 85.8% or 477 individuals in the labor force. Within the labor force, the 16 to 19 years age range has the highest percentage of unemployed individuals, with 54.3% or 63 of them being unemployed.
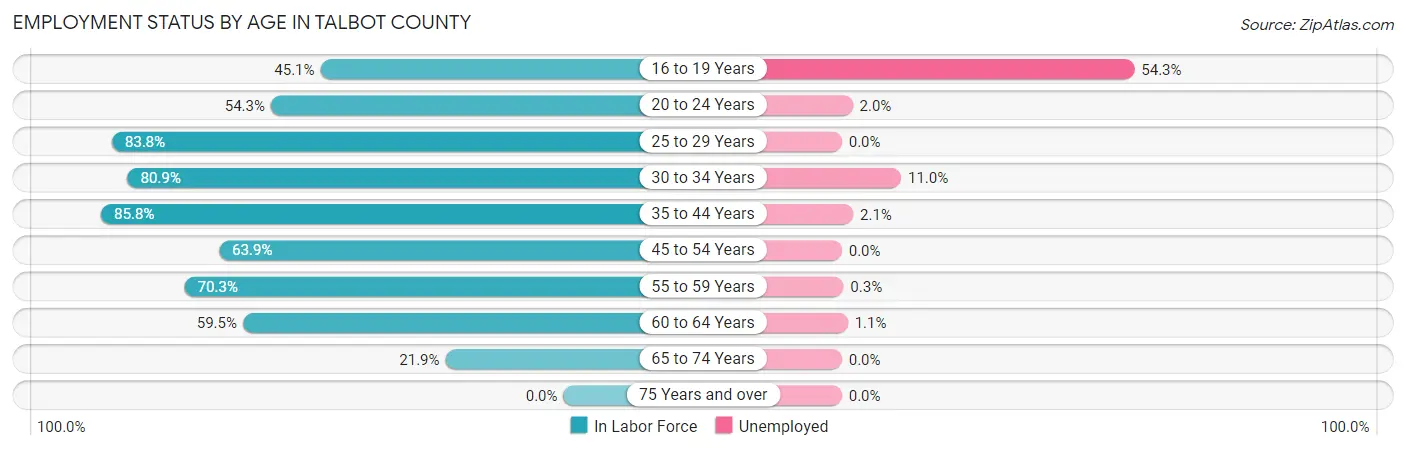
| Age Bracket | In Labor Force | Unemployed |
| 16 to 19 Years | 116 (45.1%) | 63 (54.3%) |
| 20 to 24 Years | 152 (54.3%) | 3 (2.0%) |
| 25 to 29 Years | 232 (83.8%) | 0 (0.0%) |
| 30 to 34 Years | 254 (80.9%) | 28 (11.0%) |
| 35 to 44 Years | 477 (85.8%) | 10 (2.1%) |
| 45 to 54 Years | 451 (63.9%) | 0 (0.0%) |
| 55 to 59 Years | 325 (70.3%) | 1 (0.3%) |
| 60 to 64 Years | 355 (59.5%) | 4 (1.1%) |
| 65 to 74 Years | 202 (21.9%) | 0 (0.0%) |
| 75 Years and over | 0 (0.0%) | 0 (0.0%) |
| Total | 2,563 (51.8%) | 110 (4.3%) |
Employment Status by Educational Attainment in Talbot County
According to labor force statistics for Talbot County, 71.9% of individuals (2,094) out of the total population between 25 and 64 years of age (2,912) are in the labor force, with 2.1% or 44 of them being unemployed. The group with the highest labor force participation rate are those with the educational attainment of bachelor's degree or higher, with 88.5% or 414 individuals in the labor force. Within the labor force, individuals with less than high school education have the highest percentage of unemployment, with 4.6% or 6 of them being unemployed.
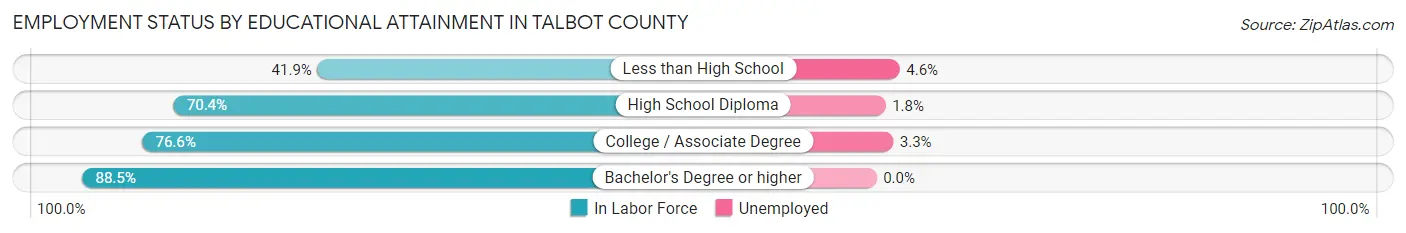
| Educational Attainment | In Labor Force | Unemployed |
| Less than High School | 131 (41.9%) | 14 (4.6%) |
| High School Diploma | 949 (70.4%) | 24 (1.8%) |
| College / Associate Degree | 600 (76.6%) | 26 (3.3%) |
| Bachelor's Degree or higher | 414 (88.5%) | 0 (0.0%) |
| Total | 2,094 (71.9%) | 61 (2.1%) |
Employment Occupations by Sex in Talbot County
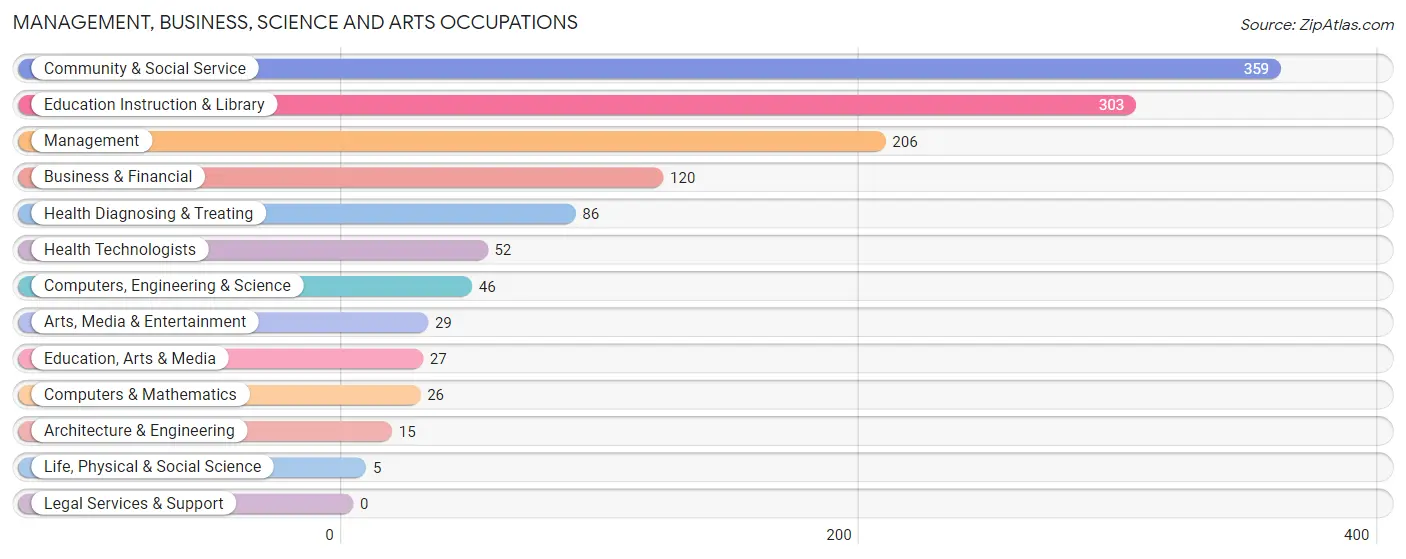
Management, Business, Science and Arts Occupations
The most common Management, Business, Science and Arts occupations in Talbot County are Community & Social Service (359 | 14.6%), Education Instruction & Library (303 | 12.3%), Management (206 | 8.4%), Business & Financial (120 | 4.9%), and Health Diagnosing & Treating (86 | 3.5%).
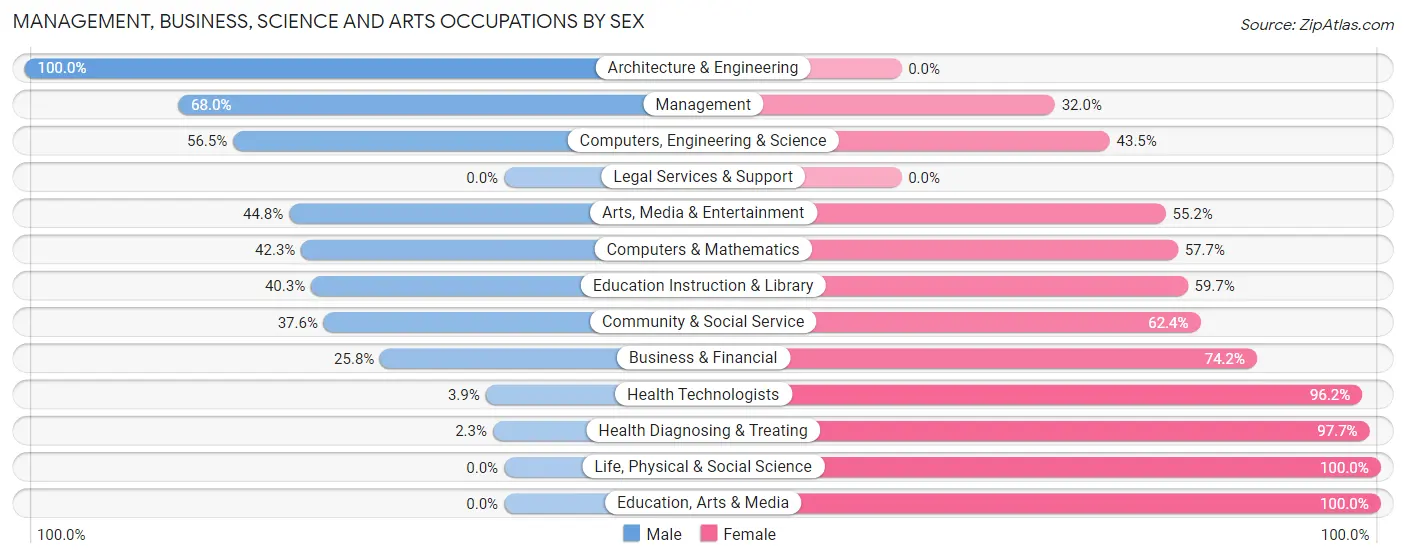
Management, Business, Science and Arts Occupations by Sex
Within the Management, Business, Science and Arts occupations in Talbot County, the most male-oriented occupations are Architecture & Engineering (100.0%), Management (68.0%), and Computers, Engineering & Science (56.5%), while the most female-oriented occupations are Life, Physical & Social Science (100.0%), Education, Arts & Media (100.0%), and Health Diagnosing & Treating (97.7%).
| Occupation | Male | Female |
| Management | 140 (68.0%) | 66 (32.0%) |
| Business & Financial | 31 (25.8%) | 89 (74.2%) |
| Computers, Engineering & Science | 26 (56.5%) | 20 (43.5%) |
| Computers & Mathematics | 11 (42.3%) | 15 (57.7%) |
| Architecture & Engineering | 15 (100.0%) | 0 (0.0%) |
| Life, Physical & Social Science | 0 (0.0%) | 5 (100.0%) |
| Community & Social Service | 135 (37.6%) | 224 (62.4%) |
| Education, Arts & Media | 0 (0.0%) | 27 (100.0%) |
| Legal Services & Support | 0 (0.0%) | 0 (0.0%) |
| Education Instruction & Library | 122 (40.3%) | 181 (59.7%) |
| Arts, Media & Entertainment | 13 (44.8%) | 16 (55.2%) |
| Health Diagnosing & Treating | 2 (2.3%) | 84 (97.7%) |
| Health Technologists | 2 (3.8%) | 50 (96.2%) |
| Total (Category) | 334 (40.9%) | 483 (59.1%) |
| Total (Overall) | 1,248 (50.8%) | 1,207 (49.2%) |
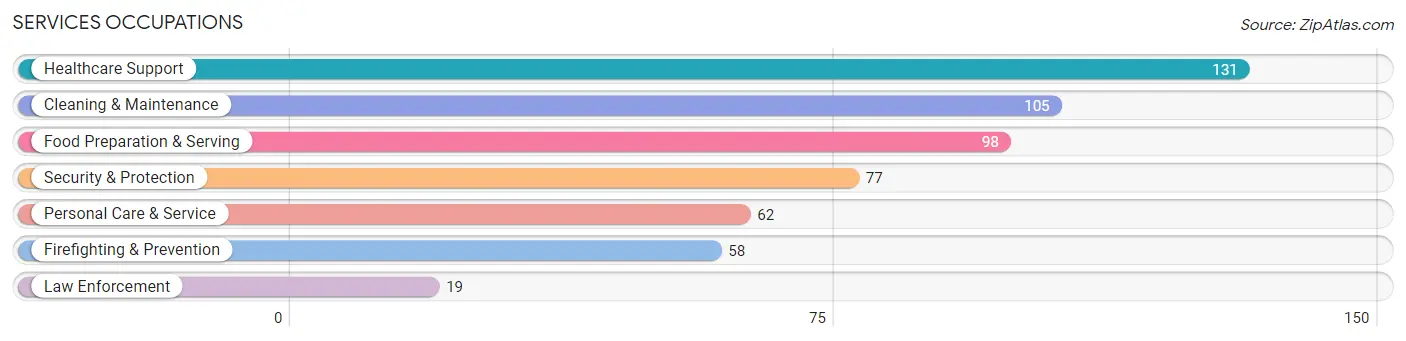
Services Occupations
The most common Services occupations in Talbot County are Healthcare Support (131 | 5.3%), Cleaning & Maintenance (105 | 4.3%), Food Preparation & Serving (98 | 4.0%), Security & Protection (77 | 3.1%), and Personal Care & Service (62 | 2.5%).
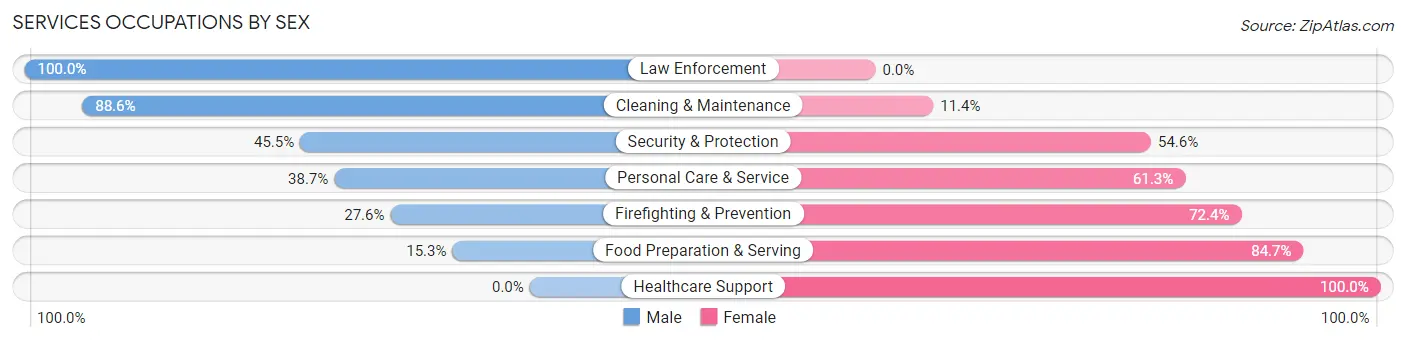
Services Occupations by Sex
Within the Services occupations in Talbot County, the most male-oriented occupations are Law Enforcement (100.0%), Cleaning & Maintenance (88.6%), and Security & Protection (45.5%), while the most female-oriented occupations are Healthcare Support (100.0%), Food Preparation & Serving (84.7%), and Firefighting & Prevention (72.4%).
| Occupation | Male | Female |
| Healthcare Support | 0 (0.0%) | 131 (100.0%) |
| Security & Protection | 35 (45.5%) | 42 (54.5%) |
| Firefighting & Prevention | 16 (27.6%) | 42 (72.4%) |
| Law Enforcement | 19 (100.0%) | 0 (0.0%) |
| Food Preparation & Serving | 15 (15.3%) | 83 (84.7%) |
| Cleaning & Maintenance | 93 (88.6%) | 12 (11.4%) |
| Personal Care & Service | 24 (38.7%) | 38 (61.3%) |
| Total (Category) | 167 (35.3%) | 306 (64.7%) |
| Total (Overall) | 1,248 (50.8%) | 1,207 (49.2%) |
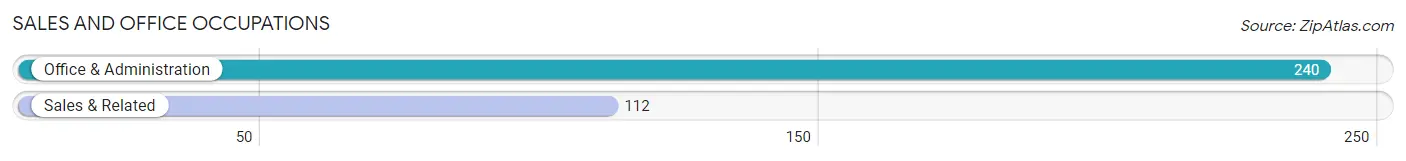
Sales and Office Occupations
The most common Sales and Office occupations in Talbot County are Office & Administration (240 | 9.8%), and Sales & Related (112 | 4.6%).
Sales and Office Occupations by Sex
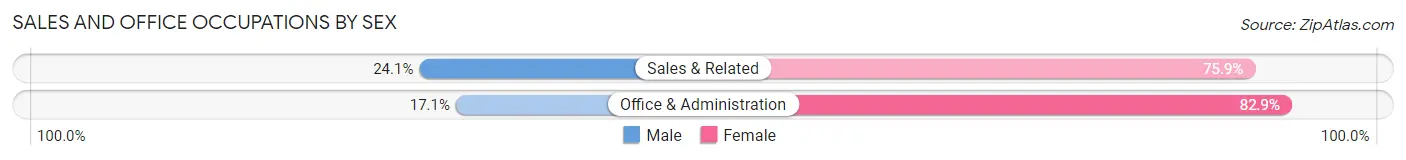
| Occupation | Male | Female |
| Sales & Related | 27 (24.1%) | 85 (75.9%) |
| Office & Administration | 41 (17.1%) | 199 (82.9%) |
| Total (Category) | 68 (19.3%) | 284 (80.7%) |
| Total (Overall) | 1,248 (50.8%) | 1,207 (49.2%) |
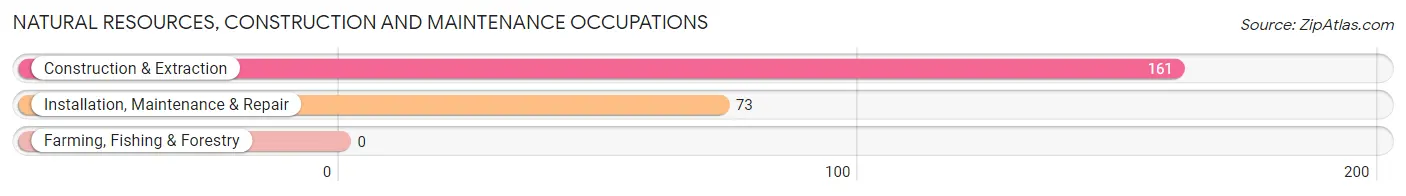
Natural Resources, Construction and Maintenance Occupations
The most common Natural Resources, Construction and Maintenance occupations in Talbot County are Construction & Extraction (161 | 6.6%), and Installation, Maintenance & Repair (73 | 3.0%).
Natural Resources, Construction and Maintenance Occupations by Sex
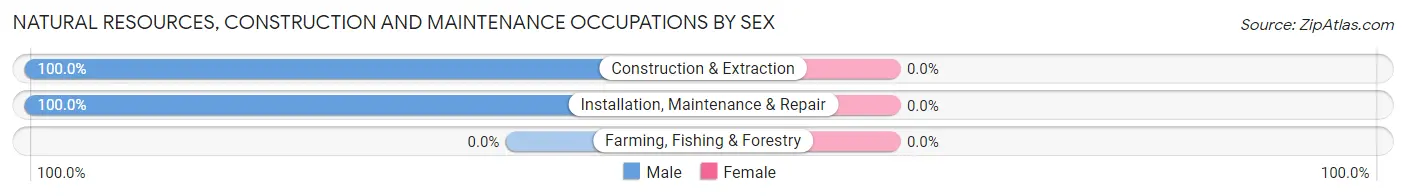
| Occupation | Male | Female |
| Farming, Fishing & Forestry | 0 (0.0%) | 0 (0.0%) |
| Construction & Extraction | 161 (100.0%) | 0 (0.0%) |
| Installation, Maintenance & Repair | 73 (100.0%) | 0 (0.0%) |
| Total (Category) | 234 (100.0%) | 0 (0.0%) |
| Total (Overall) | 1,248 (50.8%) | 1,207 (49.2%) |
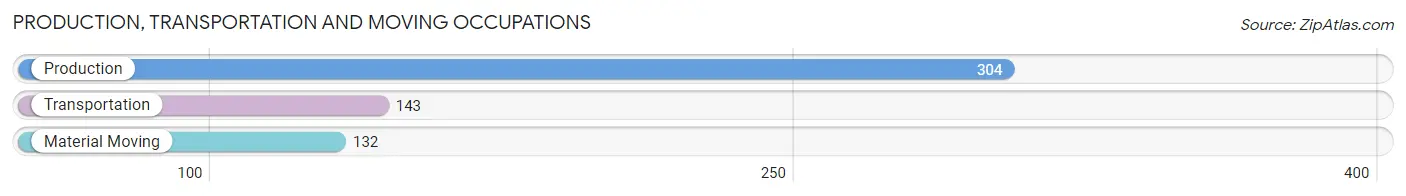
Production, Transportation and Moving Occupations
The most common Production, Transportation and Moving occupations in Talbot County are Production (304 | 12.4%), Transportation (143 | 5.8%), and Material Moving (132 | 5.4%).
Production, Transportation and Moving Occupations by Sex
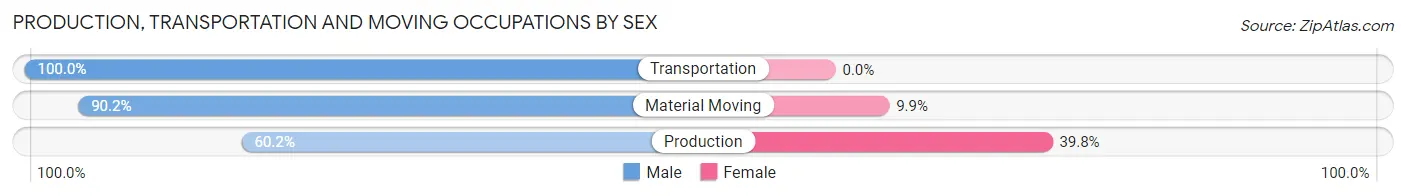
| Occupation | Male | Female |
| Production | 183 (60.2%) | 121 (39.8%) |
| Transportation | 143 (100.0%) | 0 (0.0%) |
| Material Moving | 119 (90.1%) | 13 (9.9%) |
| Total (Category) | 445 (76.9%) | 134 (23.1%) |
| Total (Overall) | 1,248 (50.8%) | 1,207 (49.2%) |
Employment Industries by Sex in Talbot County
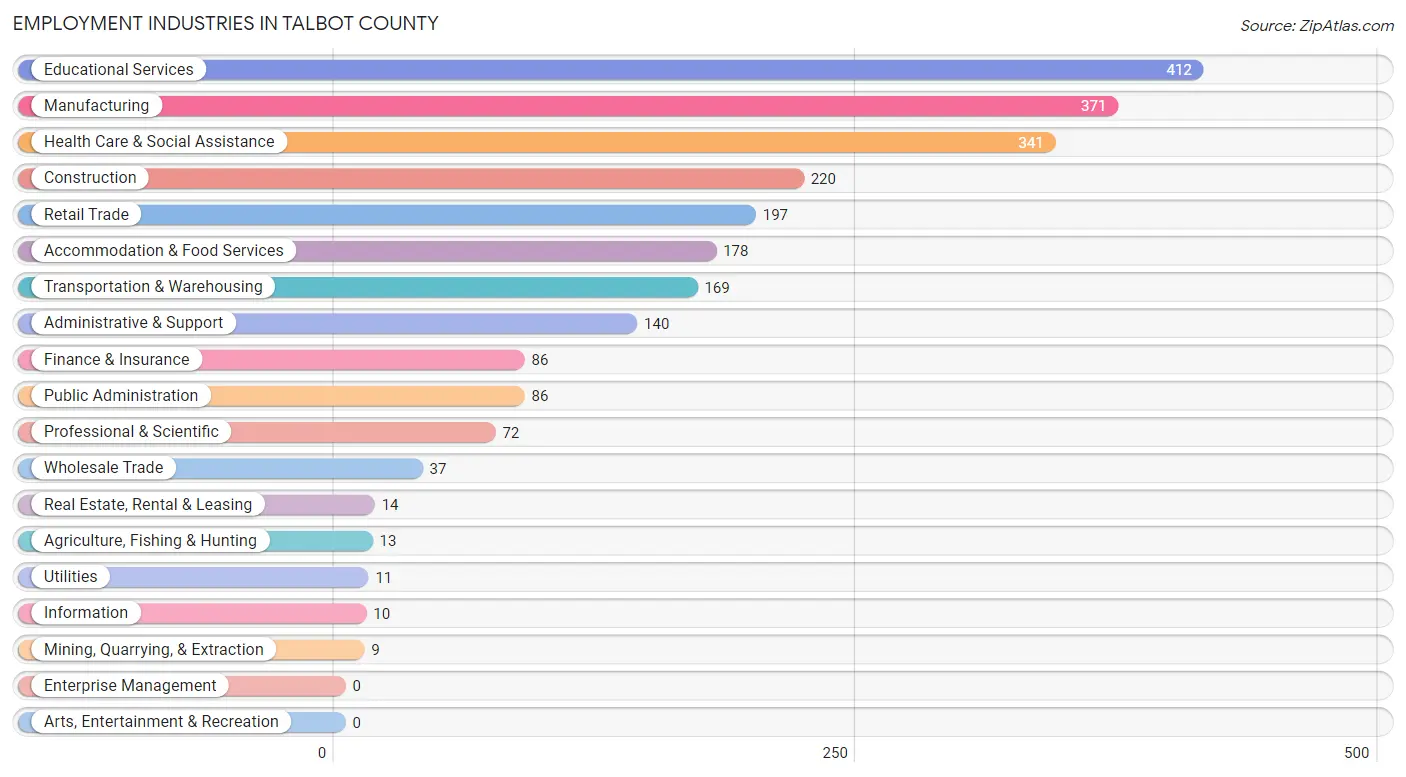
Employment Industries in Talbot County
The major employment industries in Talbot County include Educational Services (412 | 16.8%), Manufacturing (371 | 15.1%), Health Care & Social Assistance (341 | 13.9%), Construction (220 | 9.0%), and Retail Trade (197 | 8.0%).
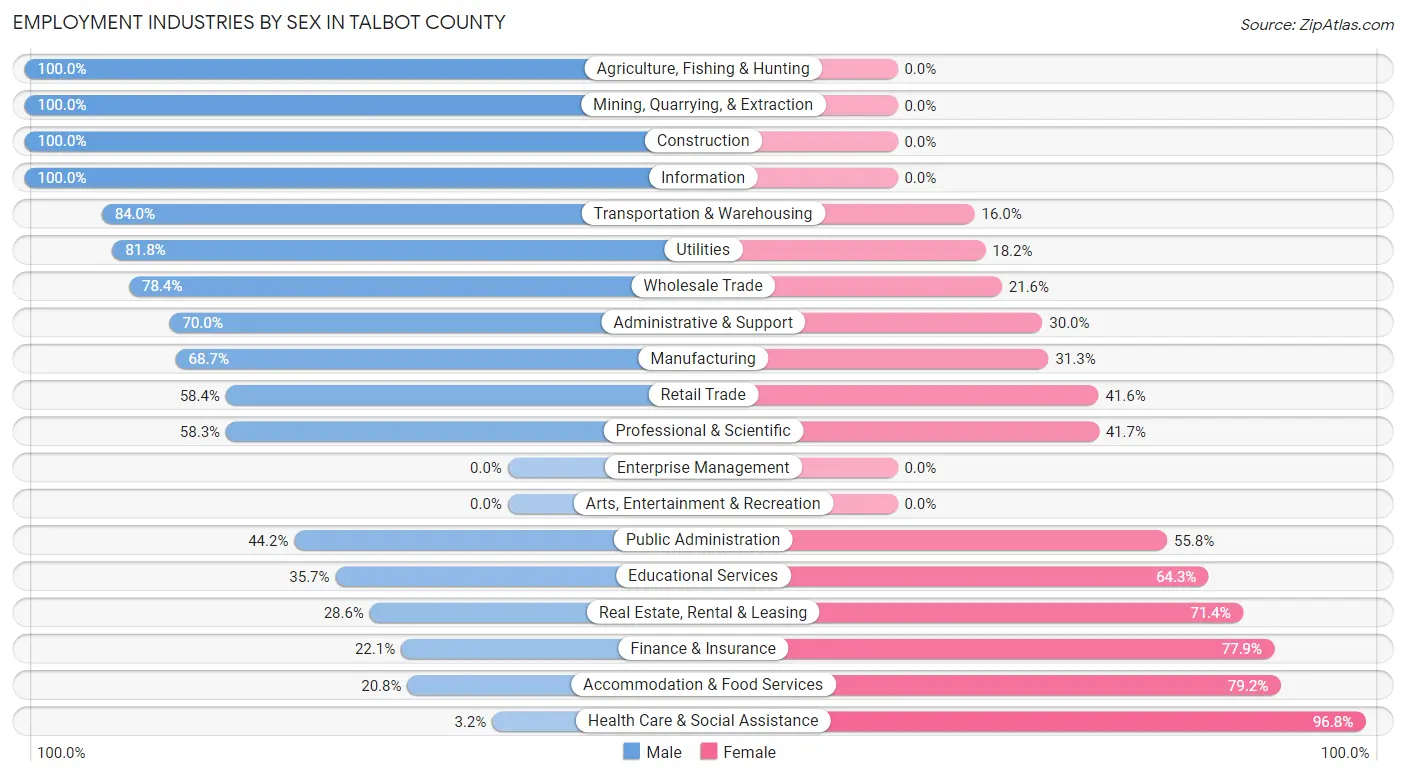
Employment Industries by Sex in Talbot County
The Talbot County industries that see more men than women are Agriculture, Fishing & Hunting (100.0%), Mining, Quarrying, & Extraction (100.0%), and Construction (100.0%), whereas the industries that tend to have a higher number of women are Health Care & Social Assistance (96.8%), Accommodation & Food Services (79.2%), and Finance & Insurance (77.9%).
| Industry | Male | Female |
| Agriculture, Fishing & Hunting | 13 (100.0%) | 0 (0.0%) |
| Mining, Quarrying, & Extraction | 9 (100.0%) | 0 (0.0%) |
| Construction | 220 (100.0%) | 0 (0.0%) |
| Manufacturing | 255 (68.7%) | 116 (31.3%) |
| Wholesale Trade | 29 (78.4%) | 8 (21.6%) |
| Retail Trade | 115 (58.4%) | 82 (41.6%) |
| Transportation & Warehousing | 142 (84.0%) | 27 (16.0%) |
| Utilities | 9 (81.8%) | 2 (18.2%) |
| Information | 10 (100.0%) | 0 (0.0%) |
| Finance & Insurance | 19 (22.1%) | 67 (77.9%) |
| Real Estate, Rental & Leasing | 4 (28.6%) | 10 (71.4%) |
| Professional & Scientific | 42 (58.3%) | 30 (41.7%) |
| Enterprise Management | 0 (0.0%) | 0 (0.0%) |
| Administrative & Support | 98 (70.0%) | 42 (30.0%) |
| Educational Services | 147 (35.7%) | 265 (64.3%) |
| Health Care & Social Assistance | 11 (3.2%) | 330 (96.8%) |
| Arts, Entertainment & Recreation | 0 (0.0%) | 0 (0.0%) |
| Accommodation & Food Services | 37 (20.8%) | 141 (79.2%) |
| Public Administration | 38 (44.2%) | 48 (55.8%) |
| Total | 1,248 (50.8%) | 1,207 (49.2%) |
Education in Talbot County
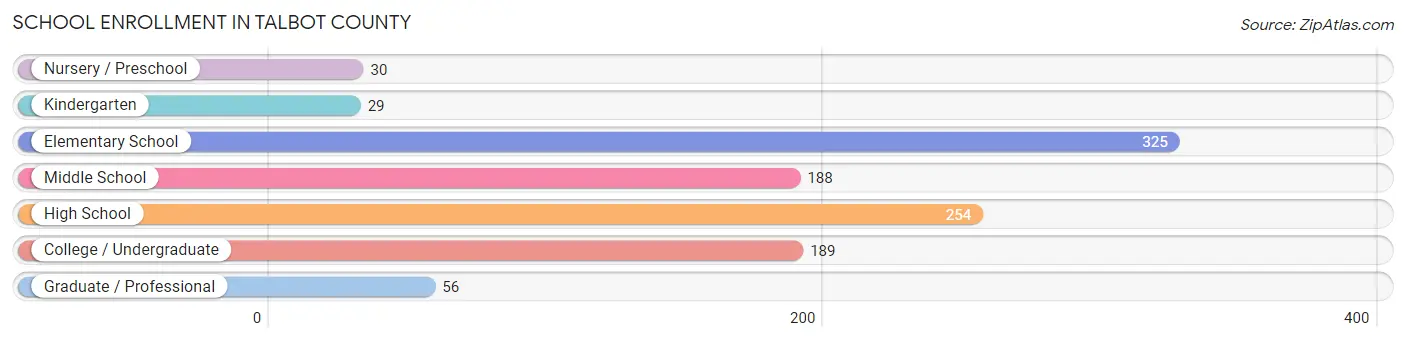
School Enrollment in Talbot County
The most common levels of schooling among the 1,071 students in Talbot County are elementary school (325 | 30.3%), high school (254 | 23.7%), and college / undergraduate (189 | 17.6%).
| School Level | # Students | % Students |
| Nursery / Preschool | 30 | 2.8% |
| Kindergarten | 29 | 2.7% |
| Elementary School | 325 | 30.3% |
| Middle School | 188 | 17.5% |
| High School | 254 | 23.7% |
| College / Undergraduate | 189 | 17.6% |
| Graduate / Professional | 56 | 5.2% |
| Total | 1,071 | 100.0% |
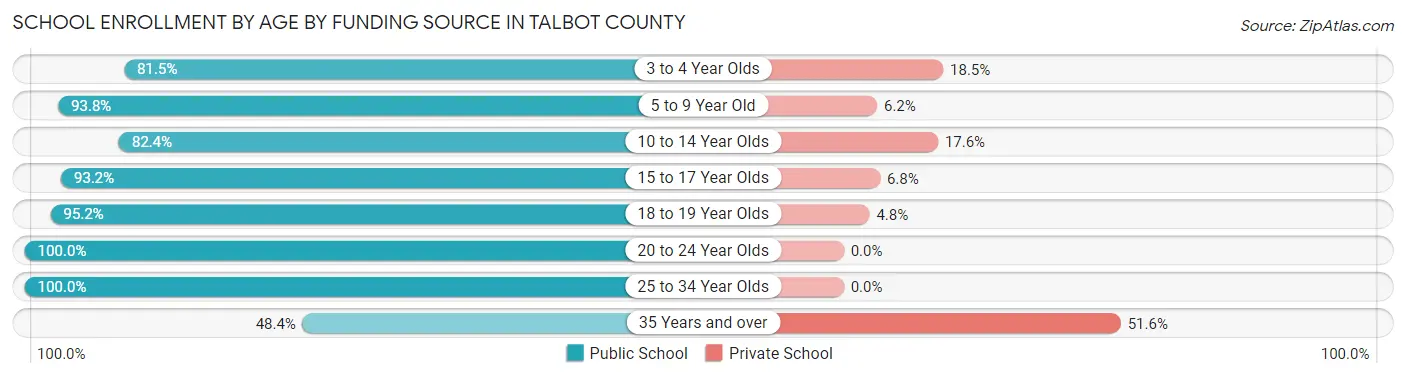
School Enrollment by Age by Funding Source in Talbot County
Out of a total of 1,071 students who are enrolled in schools in Talbot County, 144 (13.4%) attend a private institution, while the remaining 927 (86.6%) are enrolled in public schools. The age group of 35 years and over has the highest likelihood of being enrolled in private schools, with 48 (51.6% in the age bracket) enrolled. Conversely, the age group of 20 to 24 year olds has the lowest likelihood of being enrolled in a private school, with 93 (100.0% in the age bracket) attending a public institution.
| Age Bracket | Public School | Private School |
| 3 to 4 Year Olds | 22 (81.5%) | 5 (18.5%) |
| 5 to 9 Year Old | 196 (93.8%) | 13 (6.2%) |
| 10 to 14 Year Olds | 291 (82.4%) | 62 (17.6%) |
| 15 to 17 Year Olds | 138 (93.2%) | 10 (6.8%) |
| 18 to 19 Year Olds | 99 (95.2%) | 5 (4.8%) |
| 20 to 24 Year Olds | 93 (100.0%) | 0 (0.0%) |
| 25 to 34 Year Olds | 44 (100.0%) | 0 (0.0%) |
| 35 Years and over | 45 (48.4%) | 48 (51.6%) |
| Total | 927 (86.6%) | 144 (13.4%) |
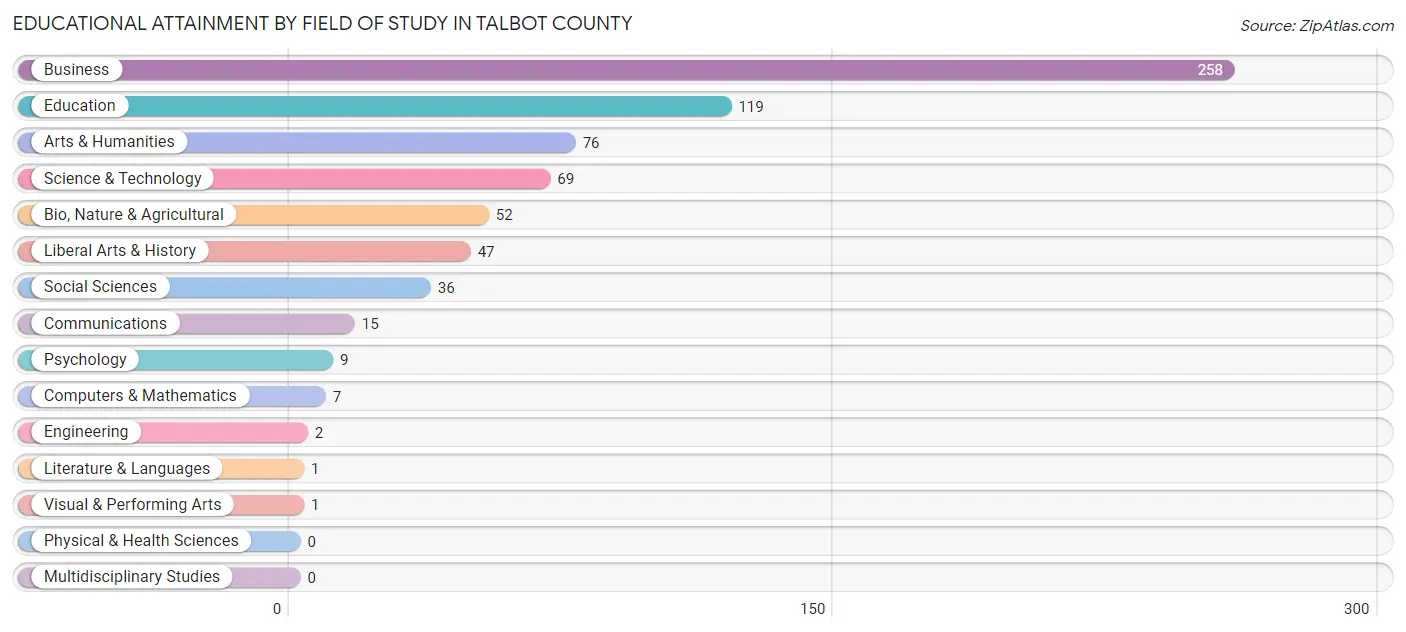
Educational Attainment by Field of Study in Talbot County
Business (258 | 37.3%), education (119 | 17.2%), arts & humanities (76 | 11.0%), science & technology (69 | 10.0%), and bio, nature & agricultural (52 | 7.5%) are the most common fields of study among 692 individuals in Talbot County who have obtained a bachelor's degree or higher.
| Field of Study | # Graduates | % Graduates |
| Computers & Mathematics | 7 | 1.0% |
| Bio, Nature & Agricultural | 52 | 7.5% |
| Physical & Health Sciences | 0 | 0.0% |
| Psychology | 9 | 1.3% |
| Social Sciences | 36 | 5.2% |
| Engineering | 2 | 0.3% |
| Multidisciplinary Studies | 0 | 0.0% |
| Science & Technology | 69 | 10.0% |
| Business | 258 | 37.3% |
| Education | 119 | 17.2% |
| Literature & Languages | 1 | 0.1% |
| Liberal Arts & History | 47 | 6.8% |
| Visual & Performing Arts | 1 | 0.1% |
| Communications | 15 | 2.2% |
| Arts & Humanities | 76 | 11.0% |
| Total | 692 | 100.0% |
Transportation & Commute in Talbot County
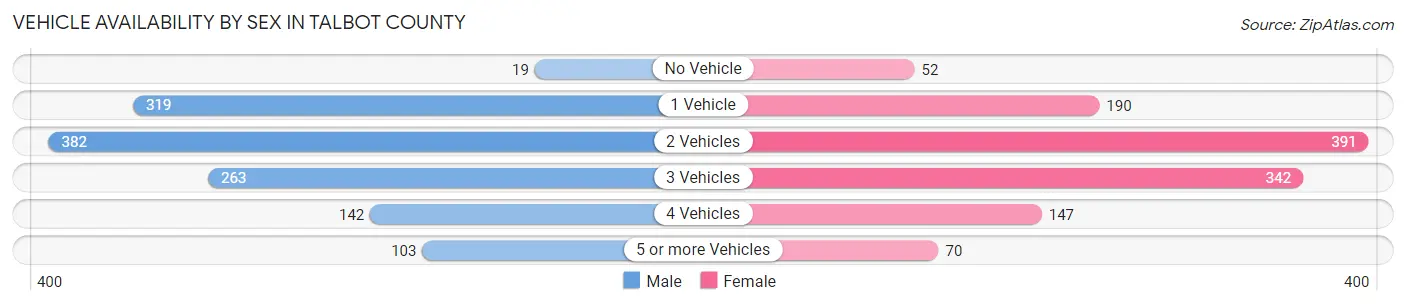
Vehicle Availability by Sex in Talbot County
The most prevalent vehicle ownership categories in Talbot County are males with 2 vehicles (382, accounting for 31.1%) and females with 2 vehicles (391, making up 32.1%).
| Vehicles Available | Male | Female |
| No Vehicle | 19 (1.5%) | 52 (4.4%) |
| 1 Vehicle | 319 (26.0%) | 190 (15.9%) |
| 2 Vehicles | 382 (31.1%) | 391 (32.8%) |
| 3 Vehicles | 263 (21.4%) | 342 (28.7%) |
| 4 Vehicles | 142 (11.6%) | 147 (12.3%) |
| 5 or more Vehicles | 103 (8.4%) | 70 (5.9%) |
| Total | 1,228 (100.0%) | 1,192 (100.0%) |
Commute Time in Talbot County
The most frequently occuring commute durations in Talbot County are 30 to 34 minutes (357 commuters, 15.5%), 40 to 44 minutes (356 commuters, 15.5%), and 45 to 59 minutes (326 commuters, 14.2%).
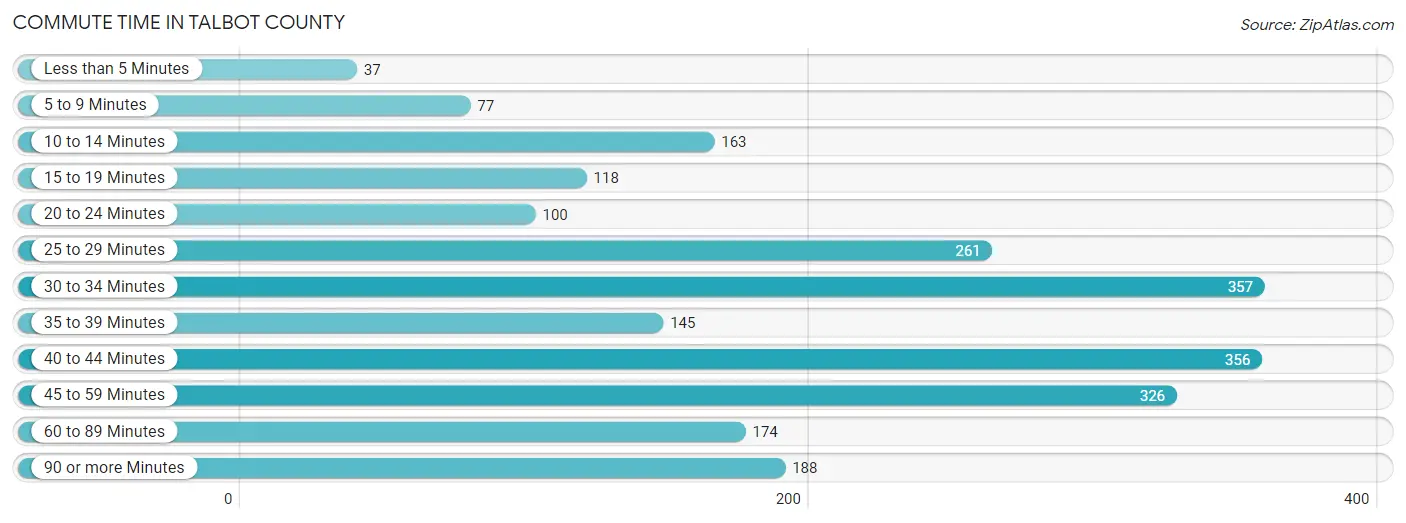
| Commute Time | # Commuters | % Commuters |
| Less than 5 Minutes | 37 | 1.6% |
| 5 to 9 Minutes | 77 | 3.3% |
| 10 to 14 Minutes | 163 | 7.1% |
| 15 to 19 Minutes | 118 | 5.1% |
| 20 to 24 Minutes | 100 | 4.3% |
| 25 to 29 Minutes | 261 | 11.3% |
| 30 to 34 Minutes | 357 | 15.5% |
| 35 to 39 Minutes | 145 | 6.3% |
| 40 to 44 Minutes | 356 | 15.5% |
| 45 to 59 Minutes | 326 | 14.2% |
| 60 to 89 Minutes | 174 | 7.6% |
| 90 or more Minutes | 188 | 8.2% |
Commute Time by Sex in Talbot County
The most common commute times in Talbot County are 40 to 44 minutes (205 commuters, 17.2%) for males and 30 to 34 minutes (198 commuters, 17.8%) for females.
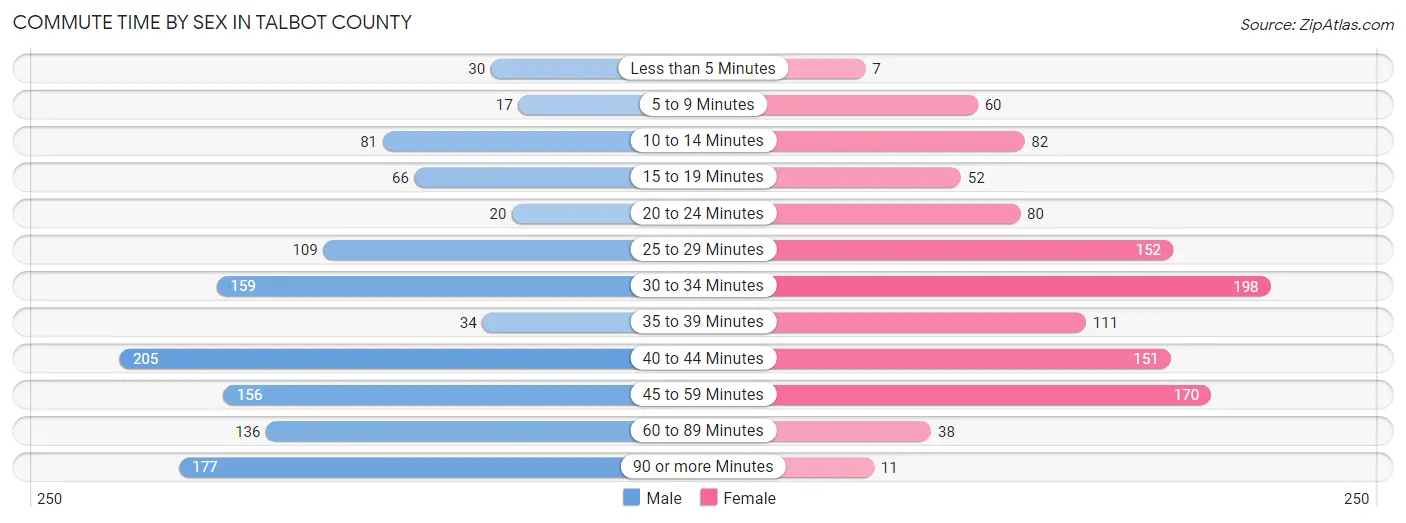
| Commute Time | Male | Female |
| Less than 5 Minutes | 30 (2.5%) | 7 (0.6%) |
| 5 to 9 Minutes | 17 (1.4%) | 60 (5.4%) |
| 10 to 14 Minutes | 81 (6.8%) | 82 (7.4%) |
| 15 to 19 Minutes | 66 (5.6%) | 52 (4.7%) |
| 20 to 24 Minutes | 20 (1.7%) | 80 (7.2%) |
| 25 to 29 Minutes | 109 (9.2%) | 152 (13.7%) |
| 30 to 34 Minutes | 159 (13.4%) | 198 (17.8%) |
| 35 to 39 Minutes | 34 (2.9%) | 111 (10.0%) |
| 40 to 44 Minutes | 205 (17.2%) | 151 (13.6%) |
| 45 to 59 Minutes | 156 (13.1%) | 170 (15.3%) |
| 60 to 89 Minutes | 136 (11.4%) | 38 (3.4%) |
| 90 or more Minutes | 177 (14.9%) | 11 (1.0%) |
Time of Departure to Work by Sex in Talbot County
The most frequent times of departure to work in Talbot County are 6:30 AM to 6:59 AM (226, 19.0%) for males and 7:00 AM to 7:29 AM (230, 20.7%) for females.
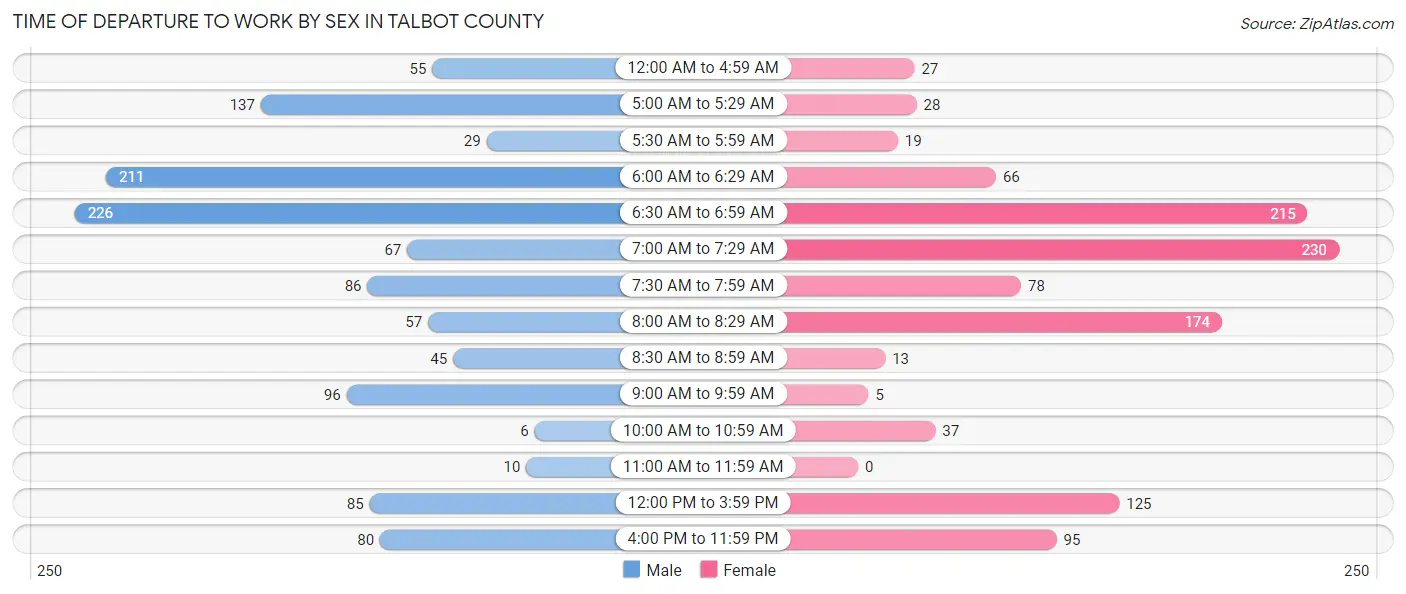
| Time of Departure | Male | Female |
| 12:00 AM to 4:59 AM | 55 (4.6%) | 27 (2.4%) |
| 5:00 AM to 5:29 AM | 137 (11.5%) | 28 (2.5%) |
| 5:30 AM to 5:59 AM | 29 (2.4%) | 19 (1.7%) |
| 6:00 AM to 6:29 AM | 211 (17.7%) | 66 (5.9%) |
| 6:30 AM to 6:59 AM | 226 (19.0%) | 215 (19.3%) |
| 7:00 AM to 7:29 AM | 67 (5.6%) | 230 (20.7%) |
| 7:30 AM to 7:59 AM | 86 (7.2%) | 78 (7.0%) |
| 8:00 AM to 8:29 AM | 57 (4.8%) | 174 (15.7%) |
| 8:30 AM to 8:59 AM | 45 (3.8%) | 13 (1.2%) |
| 9:00 AM to 9:59 AM | 96 (8.1%) | 5 (0.4%) |
| 10:00 AM to 10:59 AM | 6 (0.5%) | 37 (3.3%) |
| 11:00 AM to 11:59 AM | 10 (0.8%) | 0 (0.0%) |
| 12:00 PM to 3:59 PM | 85 (7.1%) | 125 (11.2%) |
| 4:00 PM to 11:59 PM | 80 (6.7%) | 95 (8.5%) |
| Total | 1,190 (100.0%) | 1,112 (100.0%) |
Housing Occupancy in Talbot County
Occupancy by Ownership in Talbot County
Of the total 2,538 dwellings in Talbot County, owner-occupied units account for 2,083 (82.1%), while renter-occupied units make up 455 (17.9%).
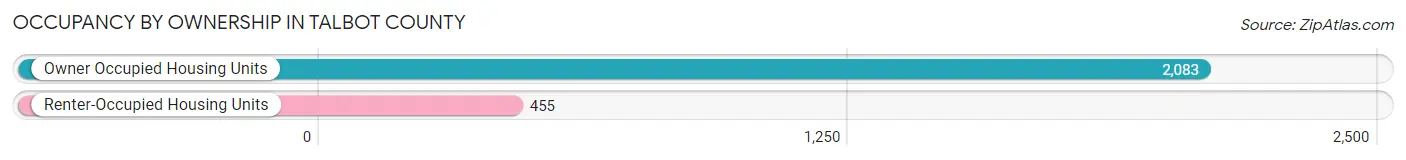
| Occupancy | # Housing Units | % Housing Units |
| Owner Occupied Housing Units | 2,083 | 82.1% |
| Renter-Occupied Housing Units | 455 | 17.9% |
| Total Occupied Housing Units | 2,538 | 100.0% |
Occupancy by Household Size in Talbot County
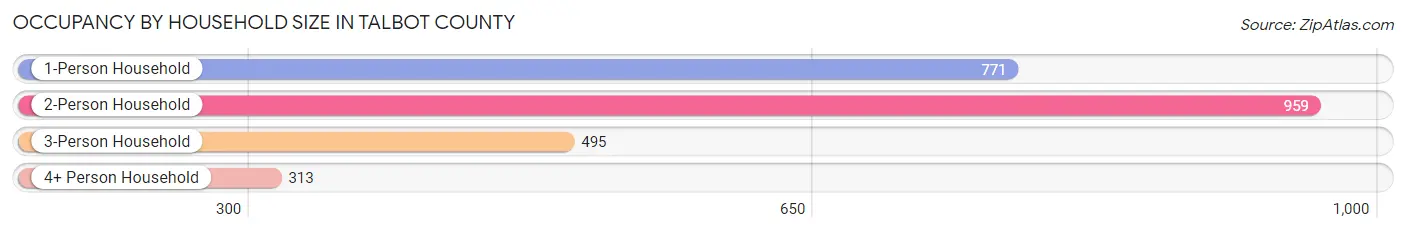
| Household Size | # Housing Units | % Housing Units |
| 1-Person Household | 771 | 30.4% |
| 2-Person Household | 959 | 37.8% |
| 3-Person Household | 495 | 19.5% |
| 4+ Person Household | 313 | 12.3% |
| Total Housing Units | 2,538 | 100.0% |
Occupancy by Ownership by Household Size in Talbot County
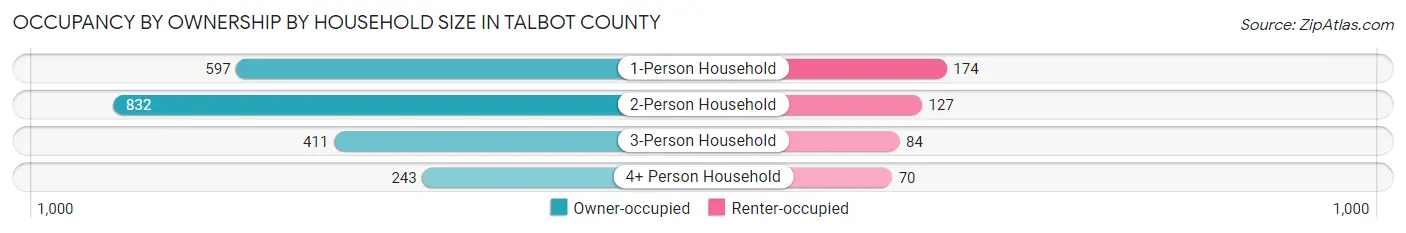
| Household Size | Owner-occupied | Renter-occupied |
| 1-Person Household | 597 (77.4%) | 174 (22.6%) |
| 2-Person Household | 832 (86.8%) | 127 (13.2%) |
| 3-Person Household | 411 (83.0%) | 84 (17.0%) |
| 4+ Person Household | 243 (77.6%) | 70 (22.4%) |
| Total Housing Units | 2,083 (82.1%) | 455 (17.9%) |
Occupancy by Educational Attainment in Talbot County
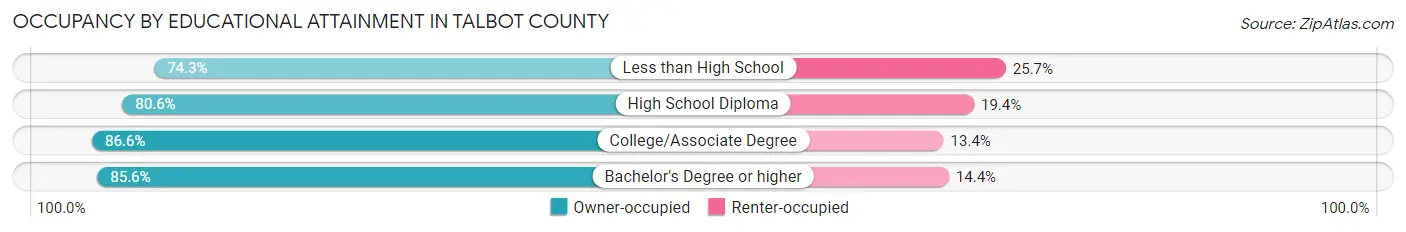
| Household Size | Owner-occupied | Renter-occupied |
| Less than High School | 289 (74.3%) | 100 (25.7%) |
| High School Diploma | 835 (80.6%) | 201 (19.4%) |
| College/Associate Degree | 544 (86.6%) | 84 (13.4%) |
| Bachelor's Degree or higher | 415 (85.6%) | 70 (14.4%) |
Occupancy by Age of Householder in Talbot County
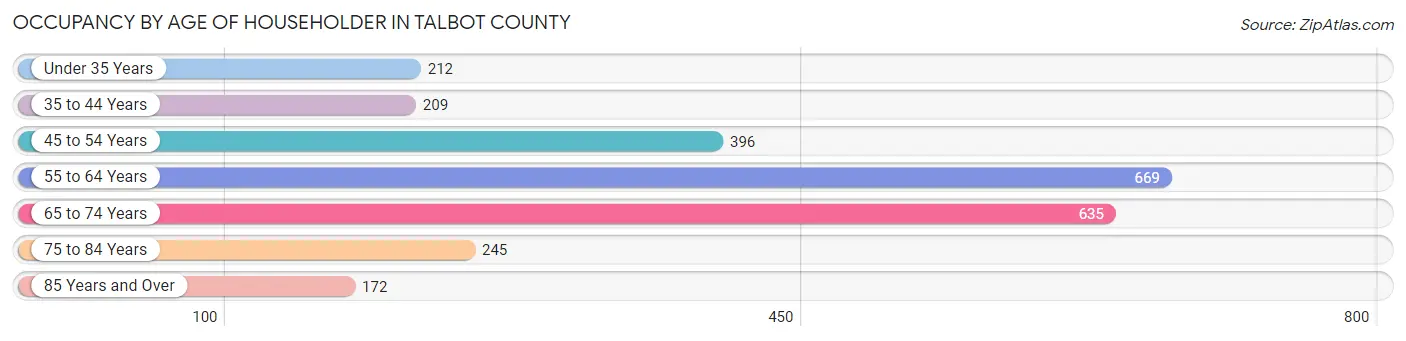
| Age Bracket | # Households | % Households |
| Under 35 Years | 212 | 8.4% |
| 35 to 44 Years | 209 | 8.2% |
| 45 to 54 Years | 396 | 15.6% |
| 55 to 64 Years | 669 | 26.4% |
| 65 to 74 Years | 635 | 25.0% |
| 75 to 84 Years | 245 | 9.7% |
| 85 Years and Over | 172 | 6.8% |
| Total | 2,538 | 100.0% |
Housing Finances in Talbot County
Median Income by Occupancy in Talbot County
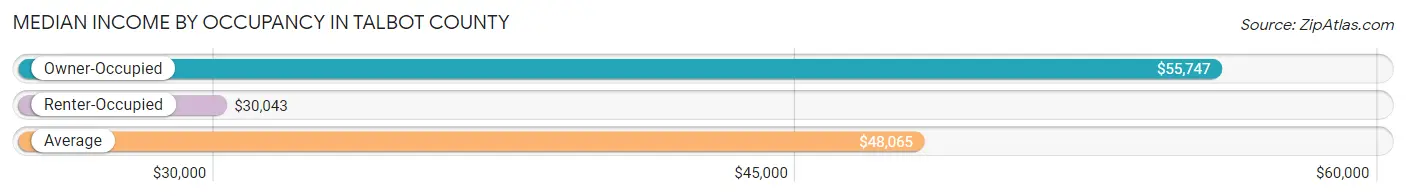
| Occupancy Type | # Households | Median Income |
| Owner-Occupied | 2,083 (82.1%) | $55,747 |
| Renter-Occupied | 455 (17.9%) | $30,043 |
| Average | 2,538 (100.0%) | $48,065 |
Occupancy by Householder Income Bracket in Talbot County
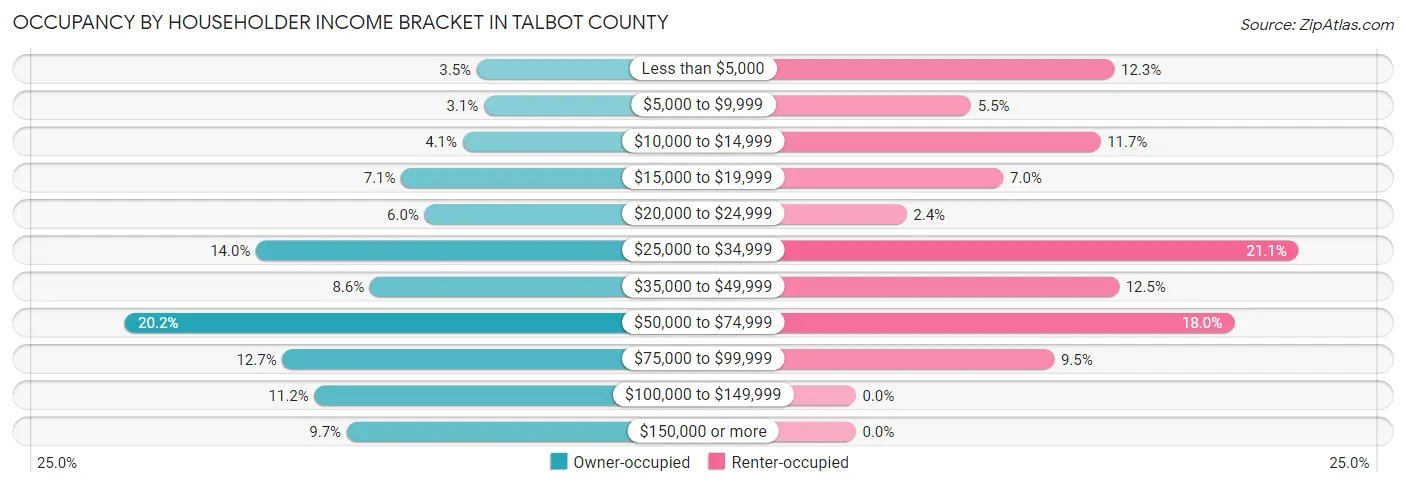
| Income Bracket | Owner-occupied | Renter-occupied |
| Less than $5,000 | 72 (3.5%) | 56 (12.3%) |
| $5,000 to $9,999 | 65 (3.1%) | 25 (5.5%) |
| $10,000 to $14,999 | 86 (4.1%) | 53 (11.7%) |
| $15,000 to $19,999 | 147 (7.1%) | 32 (7.0%) |
| $20,000 to $24,999 | 124 (5.9%) | 11 (2.4%) |
| $25,000 to $34,999 | 291 (14.0%) | 96 (21.1%) |
| $35,000 to $49,999 | 178 (8.6%) | 57 (12.5%) |
| $50,000 to $74,999 | 421 (20.2%) | 82 (18.0%) |
| $75,000 to $99,999 | 265 (12.7%) | 43 (9.5%) |
| $100,000 to $149,999 | 233 (11.2%) | 0 (0.0%) |
| $150,000 or more | 201 (9.7%) | 0 (0.0%) |
| Total | 2,083 (100.0%) | 455 (100.0%) |
Monthly Housing Cost Tiers in Talbot County
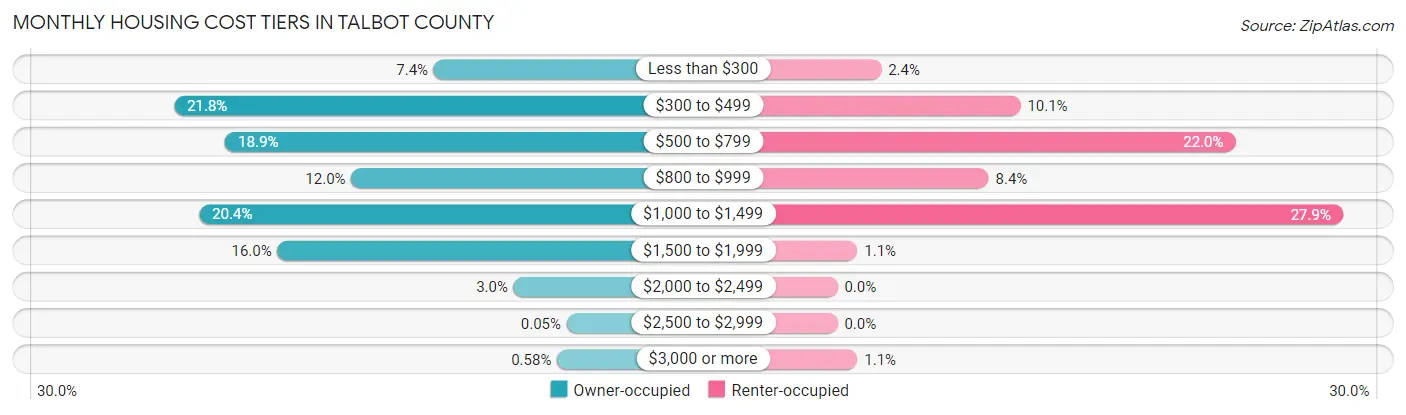
| Monthly Cost | Owner-occupied | Renter-occupied |
| Less than $300 | 154 (7.4%) | 11 (2.4%) |
| $300 to $499 | 453 (21.7%) | 46 (10.1%) |
| $500 to $799 | 394 (18.9%) | 100 (22.0%) |
| $800 to $999 | 249 (11.9%) | 38 (8.4%) |
| $1,000 to $1,499 | 424 (20.4%) | 127 (27.9%) |
| $1,500 to $1,999 | 334 (16.0%) | 5 (1.1%) |
| $2,000 to $2,499 | 62 (3.0%) | 0 (0.0%) |
| $2,500 to $2,999 | 1 (0.1%) | 0 (0.0%) |
| $3,000 or more | 12 (0.6%) | 5 (1.1%) |
| Total | 2,083 (100.0%) | 455 (100.0%) |
Physical Housing Characteristics in Talbot County
Housing Structures in Talbot County
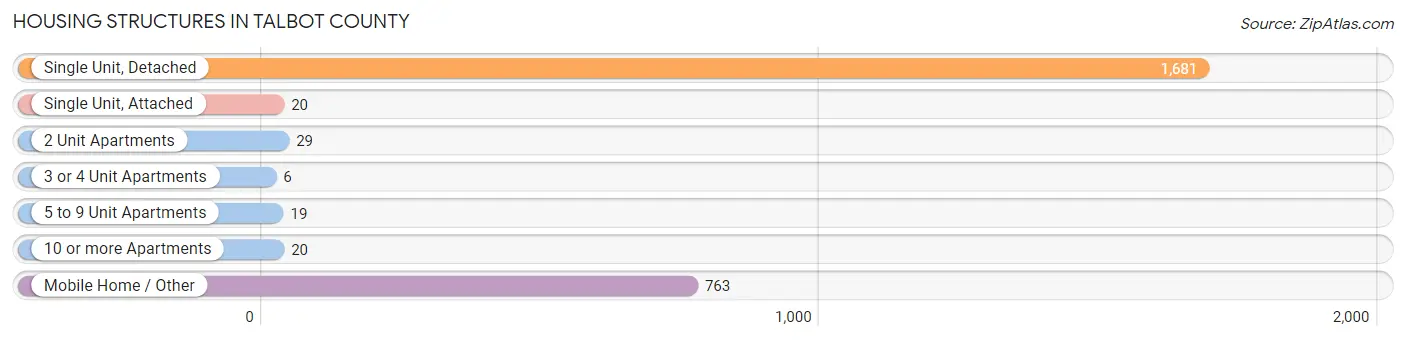
| Structure Type | # Housing Units | % Housing Units |
| Single Unit, Detached | 1,681 | 66.2% |
| Single Unit, Attached | 20 | 0.8% |
| 2 Unit Apartments | 29 | 1.1% |
| 3 or 4 Unit Apartments | 6 | 0.2% |
| 5 to 9 Unit Apartments | 19 | 0.7% |
| 10 or more Apartments | 20 | 0.8% |
| Mobile Home / Other | 763 | 30.1% |
| Total | 2,538 | 100.0% |
Housing Structures by Occupancy in Talbot County
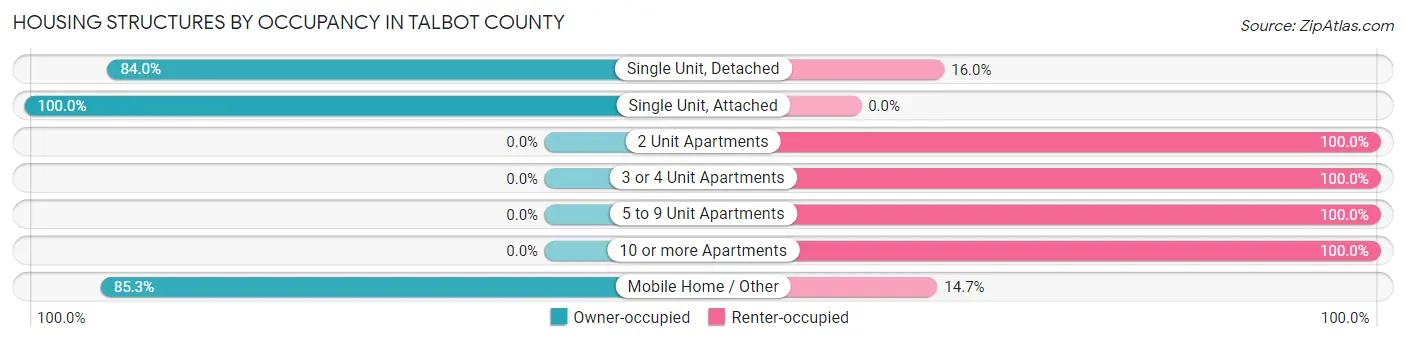
| Structure Type | Owner-occupied | Renter-occupied |
| Single Unit, Detached | 1,412 (84.0%) | 269 (16.0%) |
| Single Unit, Attached | 20 (100.0%) | 0 (0.0%) |
| 2 Unit Apartments | 0 (0.0%) | 29 (100.0%) |
| 3 or 4 Unit Apartments | 0 (0.0%) | 6 (100.0%) |
| 5 to 9 Unit Apartments | 0 (0.0%) | 19 (100.0%) |
| 10 or more Apartments | 0 (0.0%) | 20 (100.0%) |
| Mobile Home / Other | 651 (85.3%) | 112 (14.7%) |
| Total | 2,083 (82.1%) | 455 (17.9%) |
Housing Structures by Number of Rooms in Talbot County
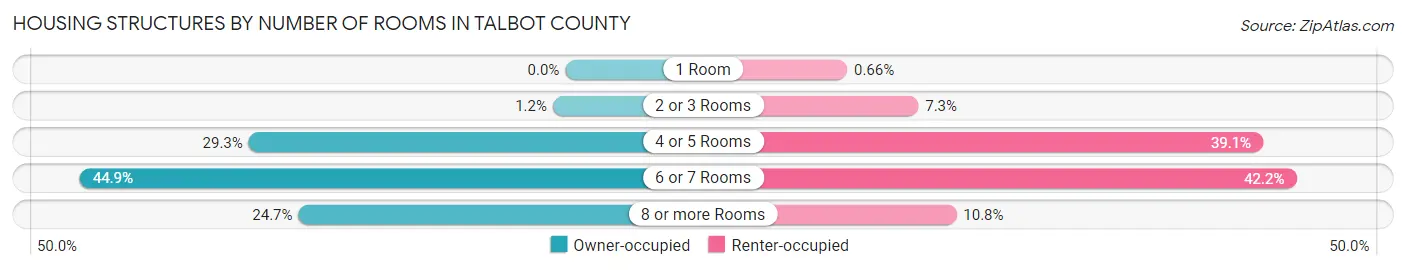
| Number of Rooms | Owner-occupied | Renter-occupied |
| 1 Room | 0 (0.0%) | 3 (0.7%) |
| 2 or 3 Rooms | 24 (1.1%) | 33 (7.2%) |
| 4 or 5 Rooms | 610 (29.3%) | 178 (39.1%) |
| 6 or 7 Rooms | 935 (44.9%) | 192 (42.2%) |
| 8 or more Rooms | 514 (24.7%) | 49 (10.8%) |
| Total | 2,083 (100.0%) | 455 (100.0%) |
Housing Structure by Heating Type in Talbot County
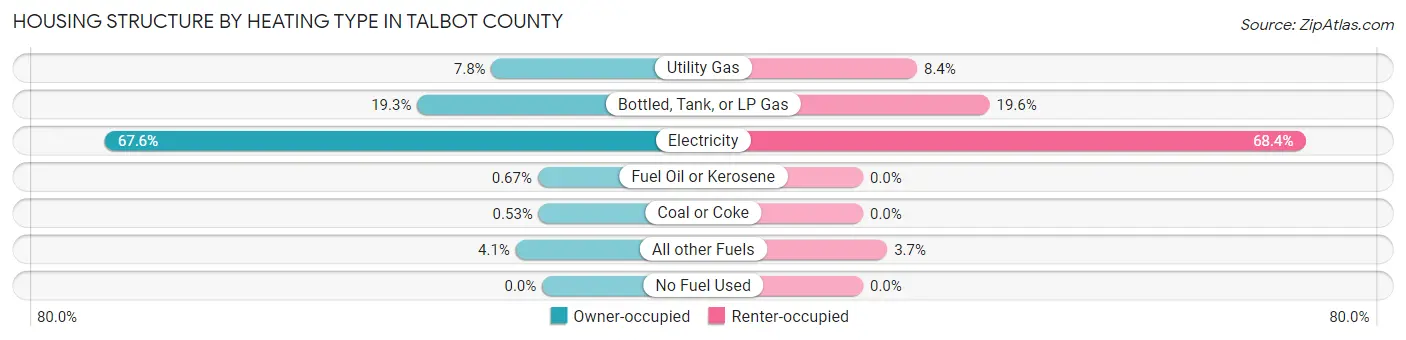
| Heating Type | Owner-occupied | Renter-occupied |
| Utility Gas | 163 (7.8%) | 38 (8.4%) |
| Bottled, Tank, or LP Gas | 402 (19.3%) | 89 (19.6%) |
| Electricity | 1,408 (67.6%) | 311 (68.3%) |
| Fuel Oil or Kerosene | 14 (0.7%) | 0 (0.0%) |
| Coal or Coke | 11 (0.5%) | 0 (0.0%) |
| All other Fuels | 85 (4.1%) | 17 (3.7%) |
| No Fuel Used | 0 (0.0%) | 0 (0.0%) |
| Total | 2,083 (100.0%) | 455 (100.0%) |
Household Vehicle Usage in Talbot County
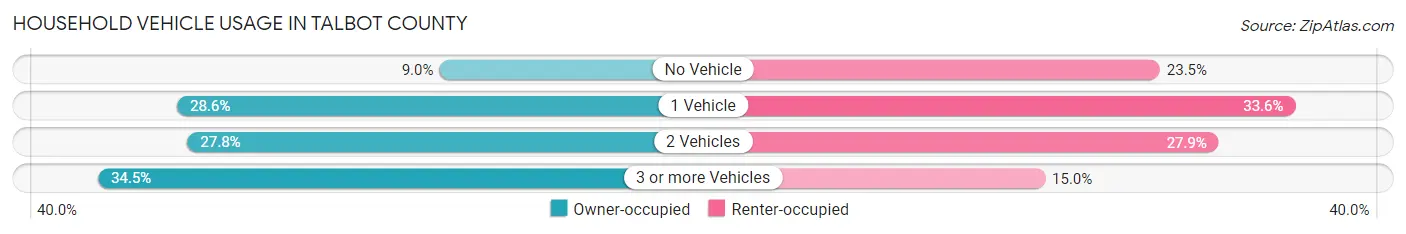
| Vehicles per Household | Owner-occupied | Renter-occupied |
| No Vehicle | 188 (9.0%) | 107 (23.5%) |
| 1 Vehicle | 596 (28.6%) | 153 (33.6%) |
| 2 Vehicles | 580 (27.8%) | 127 (27.9%) |
| 3 or more Vehicles | 719 (34.5%) | 68 (14.9%) |
| Total | 2,083 (100.0%) | 455 (100.0%) |
Real Estate & Mortgages in Talbot County
Real Estate and Mortgage Overview in Talbot County
| Characteristic | Without Mortgage | With Mortgage |
| Housing Units | 1,058 | 1,025 |
| Median Property Value | $74,700 | $163,300 |
| Median Household Income | $32,399 | $160 |
| Monthly Housing Costs | $468 | $12 |
| Real Estate Taxes | $1,031 | $71 |
Property Value by Mortgage Status in Talbot County
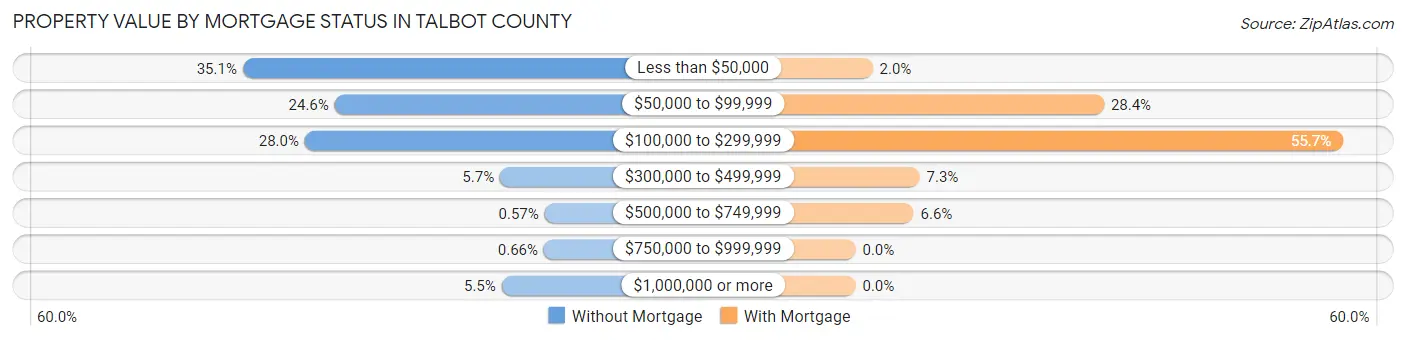
| Property Value | Without Mortgage | With Mortgage |
| Less than $50,000 | 371 (35.1%) | 20 (1.9%) |
| $50,000 to $99,999 | 260 (24.6%) | 291 (28.4%) |
| $100,000 to $299,999 | 296 (28.0%) | 571 (55.7%) |
| $300,000 to $499,999 | 60 (5.7%) | 75 (7.3%) |
| $500,000 to $749,999 | 6 (0.6%) | 68 (6.6%) |
| $750,000 to $999,999 | 7 (0.7%) | 0 (0.0%) |
| $1,000,000 or more | 58 (5.5%) | 0 (0.0%) |
| Total | 1,058 (100.0%) | 1,025 (100.0%) |
Household Income by Mortgage Status in Talbot County
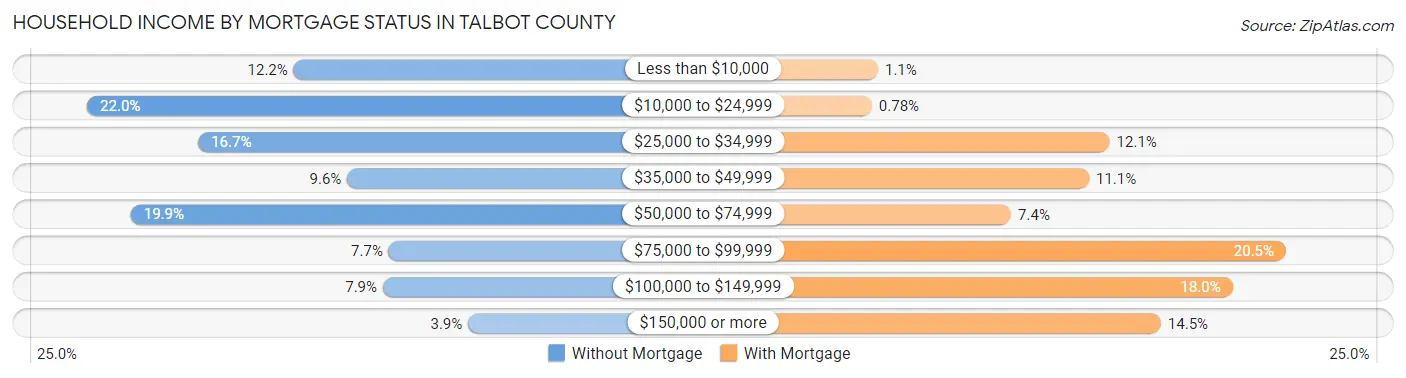
| Household Income | Without Mortgage | With Mortgage |
| Less than $10,000 | 129 (12.2%) | 11 (1.1%) |
| $10,000 to $24,999 | 233 (22.0%) | 8 (0.8%) |
| $25,000 to $34,999 | 177 (16.7%) | 124 (12.1%) |
| $35,000 to $49,999 | 102 (9.6%) | 114 (11.1%) |
| $50,000 to $74,999 | 211 (19.9%) | 76 (7.4%) |
| $75,000 to $99,999 | 81 (7.7%) | 210 (20.5%) |
| $100,000 to $149,999 | 84 (7.9%) | 184 (17.9%) |
| $150,000 or more | 41 (3.9%) | 149 (14.5%) |
| Total | 1,058 (100.0%) | 1,025 (100.0%) |
Property Value to Household Income Ratio in Talbot County
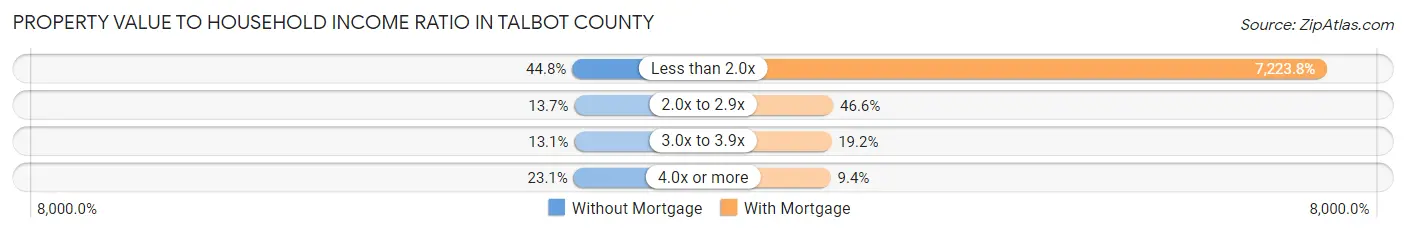
| Value-to-Income Ratio | Without Mortgage | With Mortgage |
| Less than 2.0x | 474 (44.8%) | 74,044 (7,223.8%) |
| 2.0x to 2.9x | 145 (13.7%) | 478 (46.6%) |
| 3.0x to 3.9x | 139 (13.1%) | 197 (19.2%) |
| 4.0x or more | 244 (23.1%) | 96 (9.4%) |
| Total | 1,058 (100.0%) | 1,025 (100.0%) |
Real Estate Taxes by Mortgage Status in Talbot County
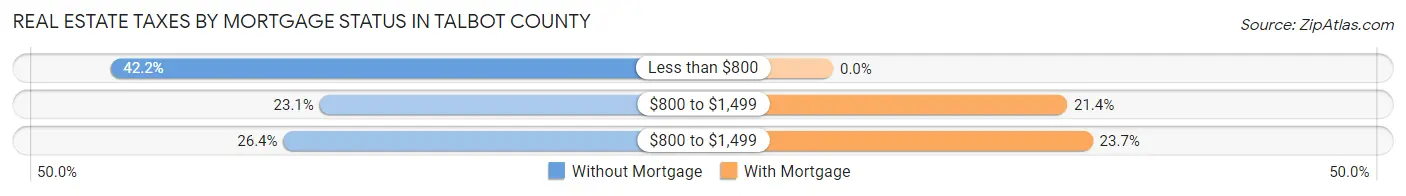
| Property Taxes | Without Mortgage | With Mortgage |
| Less than $800 | 446 (42.2%) | 0 (0.0%) |
| $800 to $1,499 | 244 (23.1%) | 219 (21.4%) |
| $800 to $1,499 | 279 (26.4%) | 243 (23.7%) |
| Total | 1,058 (100.0%) | 1,025 (100.0%) |
Health & Disability in Talbot County
Health Insurance Coverage by Age in Talbot County
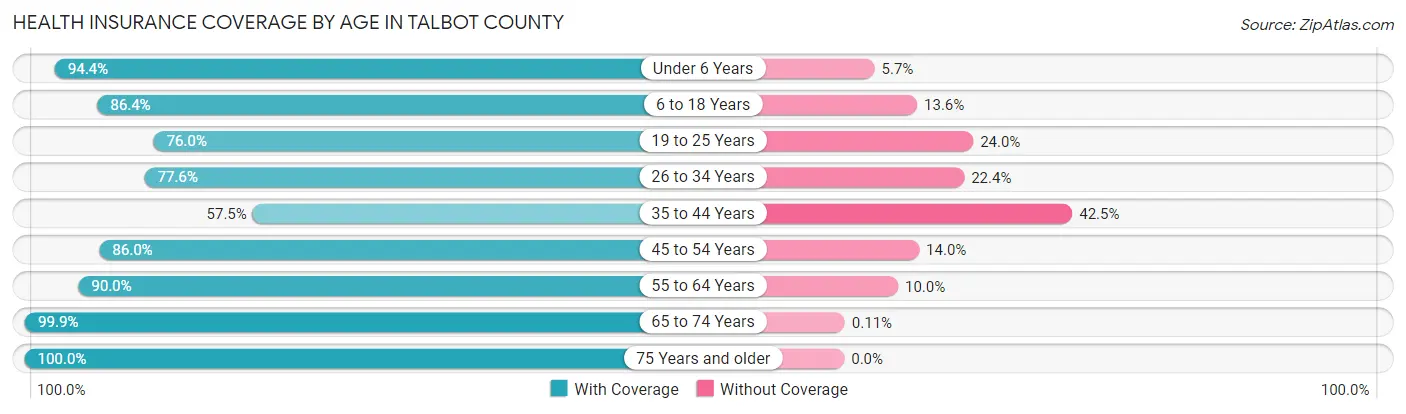
| Age Bracket | With Coverage | Without Coverage |
| Under 6 Years | 217 (94.4%) | 13 (5.7%) |
| 6 to 18 Years | 700 (86.4%) | 110 (13.6%) |
| 19 to 25 Years | 297 (76.0%) | 94 (24.0%) |
| 26 to 34 Years | 406 (77.6%) | 117 (22.4%) |
| 35 to 44 Years | 319 (57.5%) | 236 (42.5%) |
| 45 to 54 Years | 604 (86.0%) | 98 (14.0%) |
| 55 to 64 Years | 951 (90.0%) | 106 (10.0%) |
| 65 to 74 Years | 919 (99.9%) | 1 (0.1%) |
| 75 Years and older | 577 (100.0%) | 0 (0.0%) |
| Total | 4,990 (86.6%) | 775 (13.4%) |
Health Insurance Coverage by Citizenship Status in Talbot County
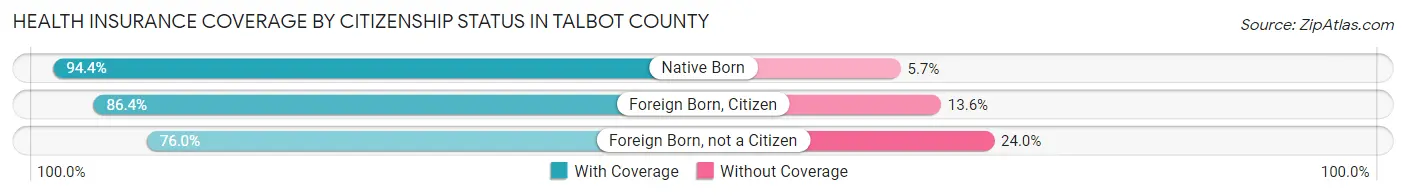
| Citizenship Status | With Coverage | Without Coverage |
| Native Born | 217 (94.4%) | 13 (5.7%) |
| Foreign Born, Citizen | 700 (86.4%) | 110 (13.6%) |
| Foreign Born, not a Citizen | 297 (76.0%) | 94 (24.0%) |
Health Insurance Coverage by Household Income in Talbot County
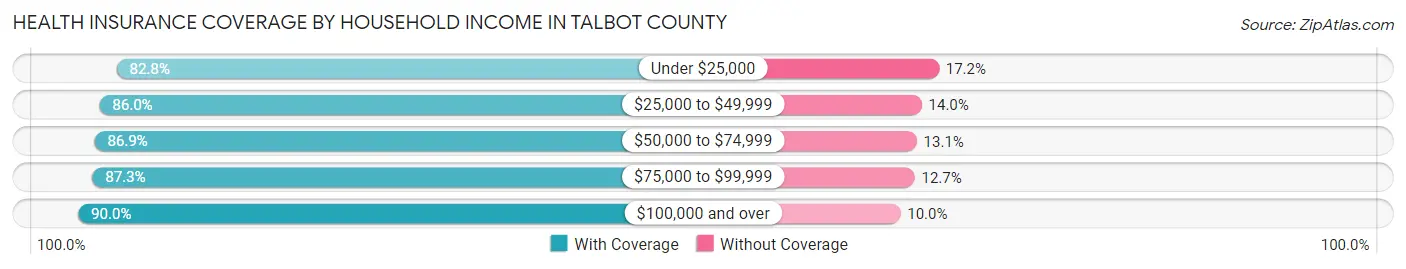
| Household Income | With Coverage | Without Coverage |
| Under $25,000 | 913 (82.8%) | 190 (17.2%) |
| $25,000 to $49,999 | 1,257 (86.0%) | 205 (14.0%) |
| $50,000 to $74,999 | 1,049 (86.9%) | 158 (13.1%) |
| $75,000 to $99,999 | 729 (87.3%) | 106 (12.7%) |
| $100,000 and over | 1,042 (90.0%) | 116 (10.0%) |
Public vs Private Health Insurance Coverage by Age in Talbot County
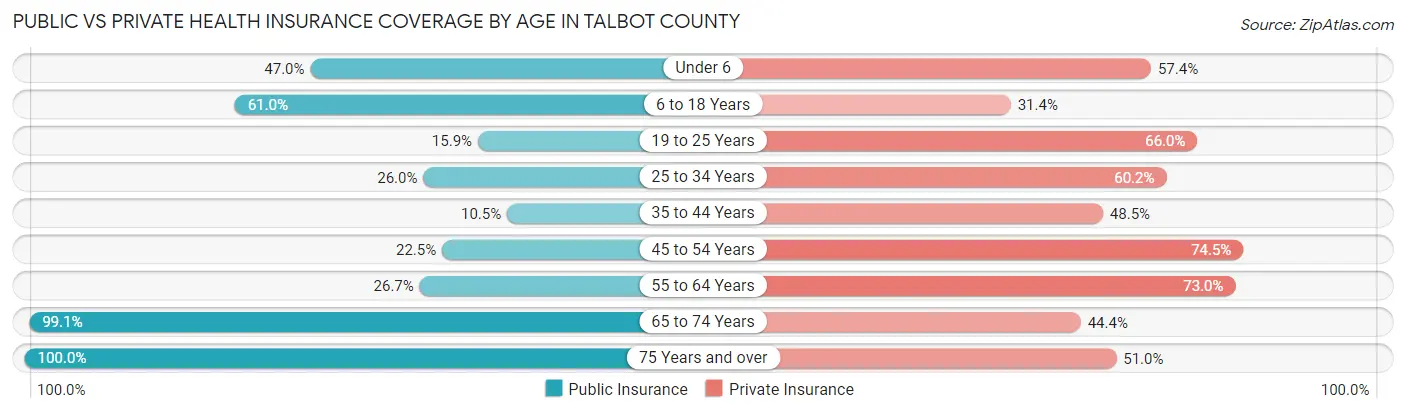
| Age Bracket | Public Insurance | Private Insurance |
| Under 6 | 108 (47.0%) | 132 (57.4%) |
| 6 to 18 Years | 494 (61.0%) | 254 (31.4%) |
| 19 to 25 Years | 62 (15.9%) | 258 (66.0%) |
| 25 to 34 Years | 136 (26.0%) | 315 (60.2%) |
| 35 to 44 Years | 58 (10.4%) | 269 (48.5%) |
| 45 to 54 Years | 158 (22.5%) | 523 (74.5%) |
| 55 to 64 Years | 282 (26.7%) | 772 (73.0%) |
| 65 to 74 Years | 912 (99.1%) | 408 (44.4%) |
| 75 Years and over | 577 (100.0%) | 294 (50.9%) |
| Total | 2,787 (48.3%) | 3,225 (55.9%) |
Disability Status by Sex by Age in Talbot County
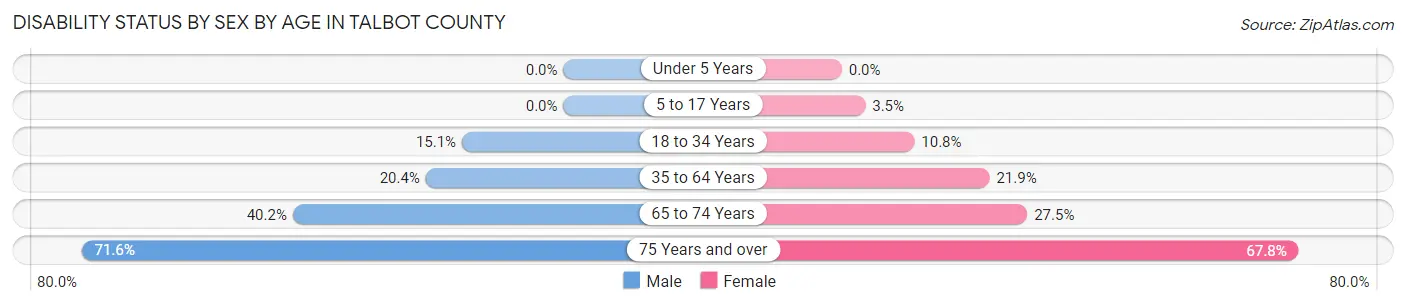
| Age Bracket | Male | Female |
| Under 5 Years | 0 (0.0%) | 0 (0.0%) |
| 5 to 17 Years | 0 (0.0%) | 12 (3.5%) |
| 18 to 34 Years | 75 (15.1%) | 55 (10.8%) |
| 35 to 64 Years | 225 (20.4%) | 266 (21.9%) |
| 65 to 74 Years | 180 (40.2%) | 130 (27.5%) |
| 75 Years and over | 166 (71.6%) | 234 (67.8%) |
Disability Class by Sex by Age in Talbot County
Disability Class: Hearing Difficulty
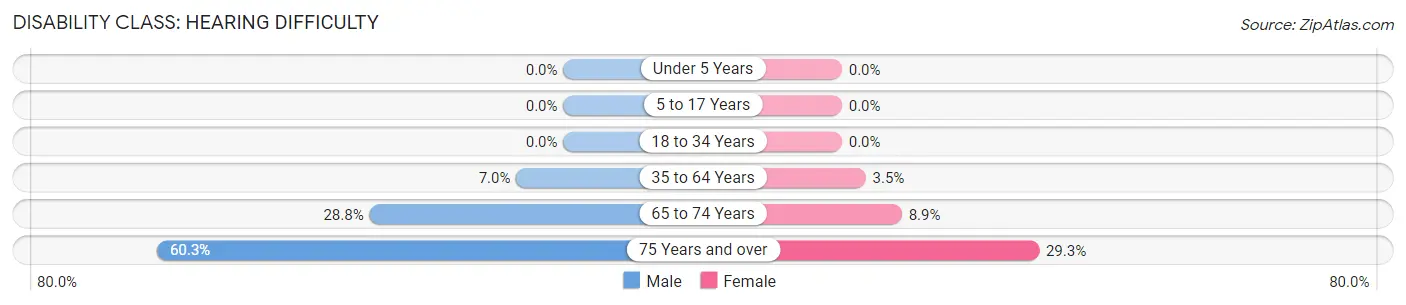
| Age Bracket | Male | Female |
| Under 5 Years | 0 (0.0%) | 0 (0.0%) |
| 5 to 17 Years | 0 (0.0%) | 0 (0.0%) |
| 18 to 34 Years | 0 (0.0%) | 0 (0.0%) |
| 35 to 64 Years | 77 (7.0%) | 43 (3.5%) |
| 65 to 74 Years | 129 (28.8%) | 42 (8.9%) |
| 75 Years and over | 140 (60.3%) | 101 (29.3%) |
Disability Class: Vision Difficulty
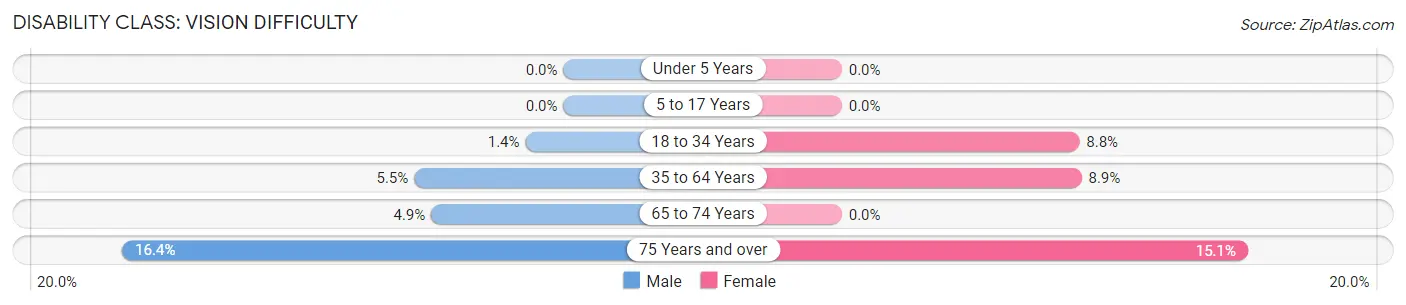
| Age Bracket | Male | Female |
| Under 5 Years | 0 (0.0%) | 0 (0.0%) |
| 5 to 17 Years | 0 (0.0%) | 0 (0.0%) |
| 18 to 34 Years | 7 (1.4%) | 45 (8.8%) |
| 35 to 64 Years | 61 (5.5%) | 108 (8.9%) |
| 65 to 74 Years | 22 (4.9%) | 0 (0.0%) |
| 75 Years and over | 38 (16.4%) | 52 (15.1%) |
Disability Class: Cognitive Difficulty
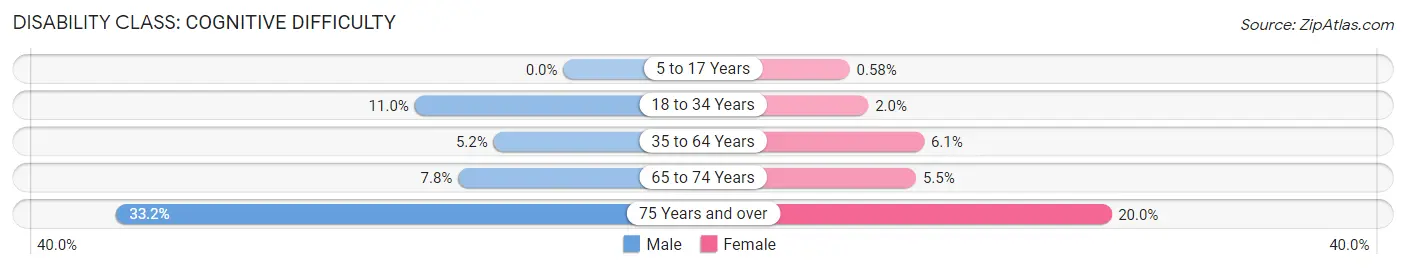
| Age Bracket | Male | Female |
| 5 to 17 Years | 0 (0.0%) | 2 (0.6%) |
| 18 to 34 Years | 55 (11.0%) | 10 (2.0%) |
| 35 to 64 Years | 57 (5.2%) | 74 (6.1%) |
| 65 to 74 Years | 35 (7.8%) | 26 (5.5%) |
| 75 Years and over | 77 (33.2%) | 69 (20.0%) |
Disability Class: Ambulatory Difficulty
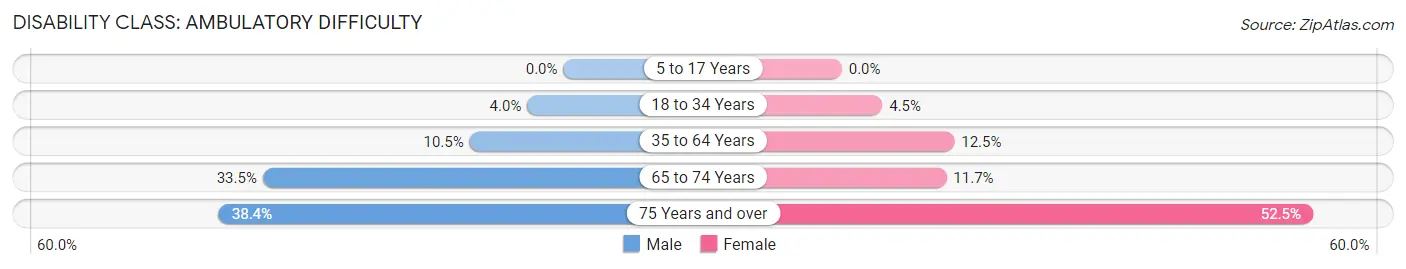
| Age Bracket | Male | Female |
| 5 to 17 Years | 0 (0.0%) | 0 (0.0%) |
| 18 to 34 Years | 20 (4.0%) | 23 (4.5%) |
| 35 to 64 Years | 115 (10.4%) | 152 (12.5%) |
| 65 to 74 Years | 150 (33.5%) | 55 (11.7%) |
| 75 Years and over | 89 (38.4%) | 181 (52.5%) |
Disability Class: Self-Care Difficulty
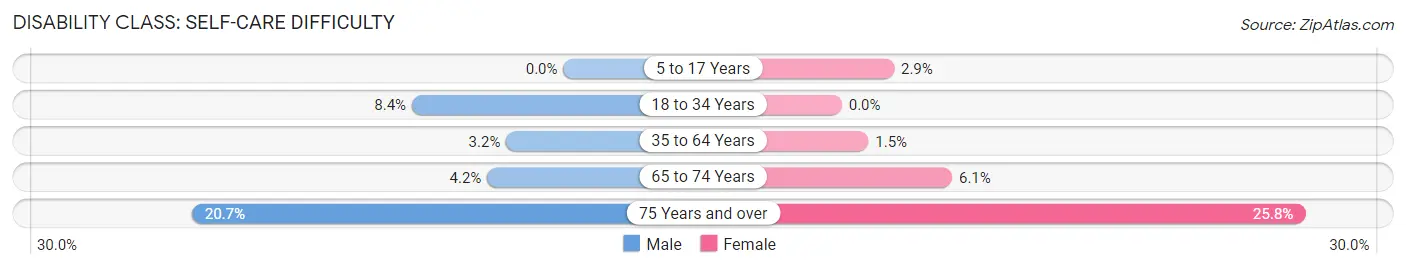
| Age Bracket | Male | Female |
| 5 to 17 Years | 0 (0.0%) | 10 (2.9%) |
| 18 to 34 Years | 42 (8.4%) | 0 (0.0%) |
| 35 to 64 Years | 35 (3.2%) | 18 (1.5%) |
| 65 to 74 Years | 19 (4.2%) | 29 (6.1%) |
| 75 Years and over | 48 (20.7%) | 89 (25.8%) |
Technology Access in Talbot County
Computing Device Access in Talbot County
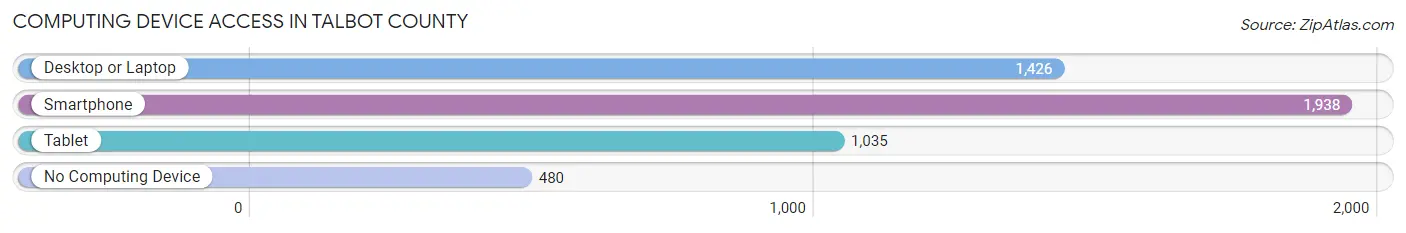
| Device Type | # Households | % Households |
| Desktop or Laptop | 1,426 | 56.2% |
| Smartphone | 1,938 | 76.4% |
| Tablet | 1,035 | 40.8% |
| No Computing Device | 480 | 18.9% |
| Total | 2,538 | 100.0% |
Internet Access in Talbot County
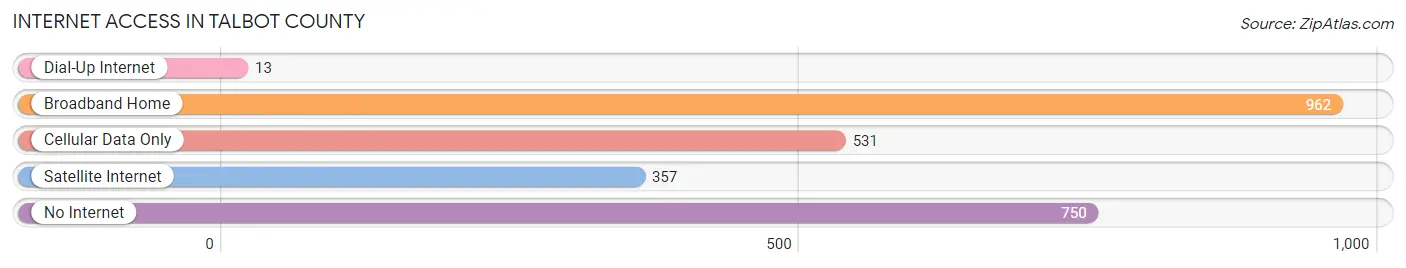
| Internet Type | # Households | % Households |
| Dial-Up Internet | 13 | 0.5% |
| Broadband Home | 962 | 37.9% |
| Cellular Data Only | 531 | 20.9% |
| Satellite Internet | 357 | 14.1% |
| No Internet | 750 | 29.5% |
| Total | 2,538 | 100.0% |
Talbot County Summary
Talbot County is located in the west-central part of the state of Georgia, in the United States. It is bordered by Upson, Meriwether, and Troup counties to the north, Harris and Muscogee counties to the east, Taylor and Marion counties to the south, and Heard and Coweta counties to the west. The county seat is Talbotton, and the county has a total area of 441 square miles.
History
Talbot County was created in 1827 from parts of Muscogee and Troup counties. It was named for Colonel Matthew Talbot, a Revolutionary War hero who served in the Georgia militia. The county was originally part of the Creek Nation, and the area was home to several Native American tribes, including the Creek, Cherokee, and Choctaw.
The first settlers in the area were mostly farmers, and the county quickly became an agricultural center. Cotton was the main crop, and the county was home to several large plantations. The county also had a thriving timber industry, and the town of Talbotton was established in 1828.
Geography
Talbot County is located in the Piedmont region of Georgia, and is mostly flat with rolling hills. The county is drained by the Flint River, which flows through the county from north to south. The county is mostly forested, with pine and hardwood trees.
The county has a humid subtropical climate, with hot, humid summers and mild winters. The average annual temperature is around 64 degrees Fahrenheit, and the average annual precipitation is around 50 inches.
Economy
The economy of Talbot County is largely based on agriculture. The county is home to several large farms, and the main crops are cotton, corn, soybeans, and peanuts. The county also has a thriving timber industry, and there are several sawmills in the area.
The county also has a growing manufacturing sector, with several factories producing furniture, textiles, and other products. The county is also home to several small businesses, including restaurants, retail stores, and service providers.
Demographics
As of the 2010 census, Talbot County had a population of 6,865. The racial makeup of the county was 68.3% White, 28.2% African American, 0.3% Native American, 0.3% Asian, 0.1% Pacific Islander, and 2.8% from other races. Hispanic or Latino of any race were 2.7% of the population.
The median income for a household in the county was $31,944, and the median income for a family was $37,917. The per capita income for the county was $16,845. About 18.2% of the population was below the poverty line.
Common Questions
What is Per Capita Income in Talbot County?
Per Capita income in Talbot County is $28,528.
What is the Median Family Income in Talbot County?
Median Family Income in Talbot County is $58,125.
What is the Median Household income in Talbot County?
Median Household Income in Talbot County is $48,065.
What is Income or Wage Gap in Talbot County?
Income or Wage Gap in Talbot County is 38.7%.
Women in Talbot County earn 61.3 cents for every dollar earned by a man.
What is Inequality or Gini Index in Talbot County?
Inequality or Gini Index in Talbot County is 0.48.
What is the Total Population of Talbot County?
Total Population of Talbot County is 5,793.
What is the Total Male Population of Talbot County?
Total Male Population of Talbot County is 2,802.
What is the Total Female Population of Talbot County?
Total Female Population of Talbot County is 2,991.
What is the Ratio of Males per 100 Females in Talbot County?
There are 93.68 Males per 100 Females in Talbot County.
What is the Ratio of Females per 100 Males in Talbot County?
There are 106.75 Females per 100 Males in Talbot County.
What is the Median Population Age in Talbot County?
Median Population Age in Talbot County is 49.9 Years.
What is the Average Family Size in Talbot County
Average Family Size in Talbot County is 2.8 People.
What is the Average Household Size in Talbot County
Average Household Size in Talbot County is 2.3 People.
How Large is the Labor Force in Talbot County?
There are 2,563 People in the Labor Forcein in Talbot County.
What is the Percentage of People in the Labor Force in Talbot County?
51.8% of People are in the Labor Force in Talbot County.
What is the Unemployment Rate in Talbot County?
Unemployment Rate in Talbot County is 4.3%.