Rabun County, GA Map & Demographics
Rabun County Map
Rabun County Overview
$35,889
PER CAPITA INCOME
$71,985
AVG FAMILY INCOME
$57,261
AVG HOUSEHOLD INCOME
15.0%
WAGE / INCOME GAP [ % ]
85.0¢/ $1
WAGE / INCOME GAP [ $ ]
0.49
INEQUALITY / GINI INDEX
16,915
TOTAL POPULATION
8,264
MALE POPULATION
8,651
FEMALE POPULATION
95.53
MALES / 100 FEMALES
104.68
FEMALES / 100 MALES
49.4
MEDIAN AGE
2.8
AVG FAMILY SIZE
2.4
AVG HOUSEHOLD SIZE
7,043
LABOR FORCE [ PEOPLE ]
48.2%
PERCENT IN LABOR FORCE
2.6%
UNEMPLOYMENT RATE
Rabun County Area Codes
Income in Rabun County
Income Overview in Rabun County
Per Capita Income in Rabun County is $35,889, while median incomes of families and households are $71,985 and $57,261 respectively.
| Characteristic | Number | Measure |
| Per Capita Income | 16,915 | $35,889 |
| Median Family Income | 4,581 | $71,985 |
| Mean Family Income | 4,581 | $102,790 |
| Median Household Income | 7,020 | $57,261 |
| Mean Household Income | 7,020 | $83,513 |
| Income Deficit | 4,581 | $0 |
| Wage / Income Gap (%) | 16,915 | 14.99% |
| Wage / Income Gap ($) | 16,915 | 85.01¢ per $1 |
| Gini / Inequality Index | 16,915 | 0.49 |
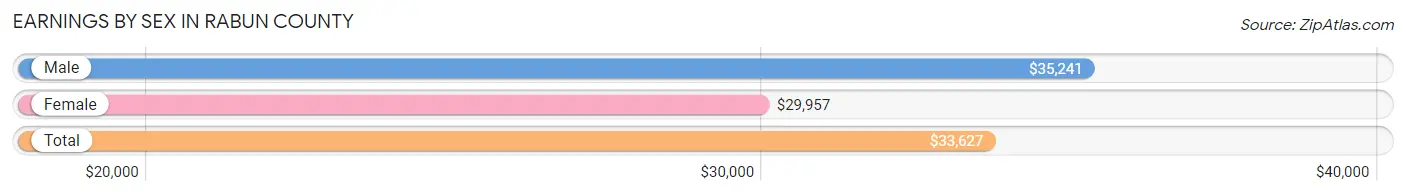
Earnings by Sex in Rabun County
Average Earnings in Rabun County are $33,627, $35,241 for men and $29,957 for women, a difference of 15.0%.
| Sex | Number | Average Earnings |
| Male | 3,916 (51.3%) | $35,241 |
| Female | 3,720 (48.7%) | $29,957 |
| Total | 7,636 (100.0%) | $33,627 |
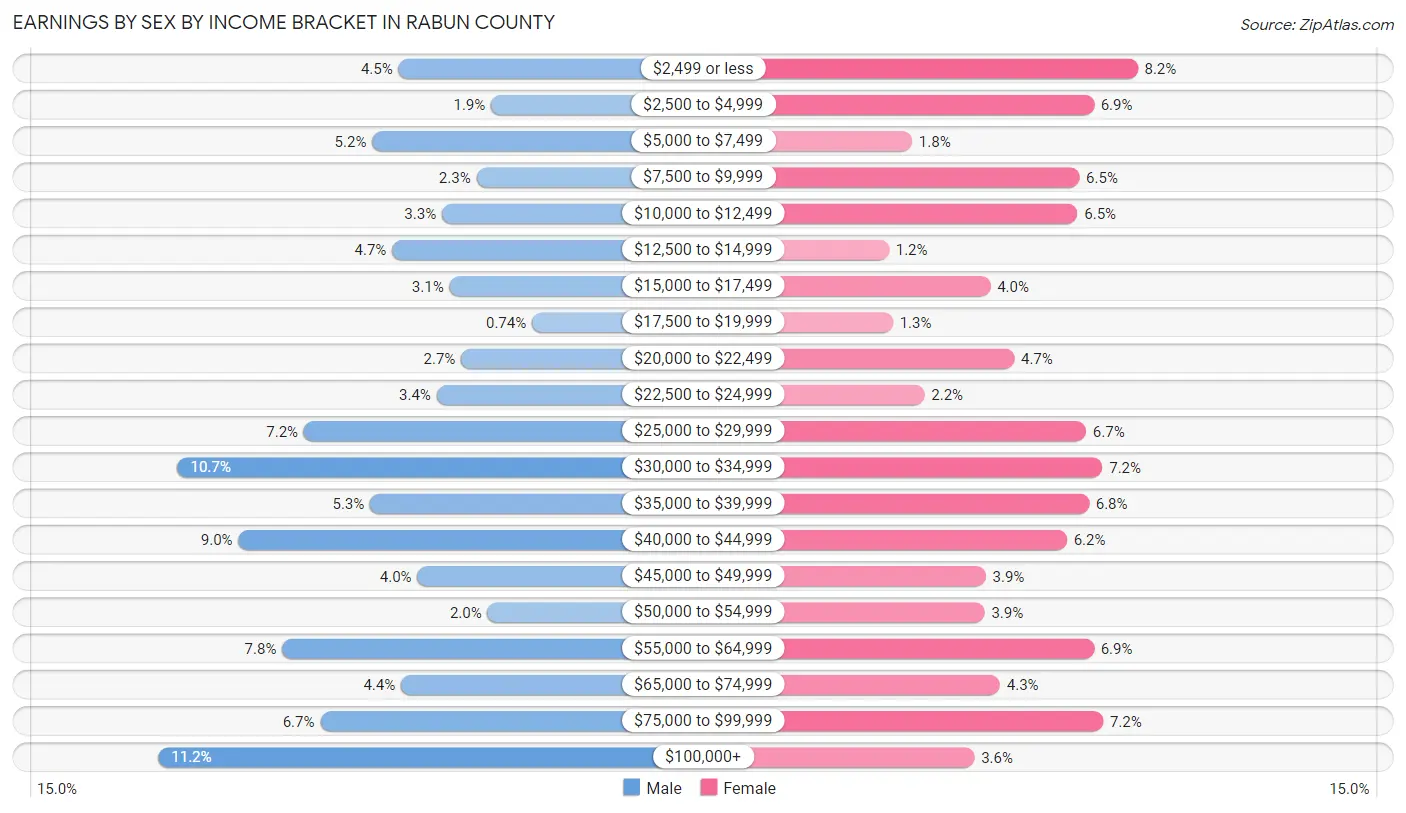
Earnings by Sex by Income Bracket in Rabun County
The most common earnings brackets in Rabun County are $100,000+ for men (440 | 11.2%) and $2,499 or less for women (304 | 8.2%).
| Income | Male | Female |
| $2,499 or less | 176 (4.5%) | 304 (8.2%) |
| $2,500 to $4,999 | 74 (1.9%) | 258 (6.9%) |
| $5,000 to $7,499 | 205 (5.2%) | 68 (1.8%) |
| $7,500 to $9,999 | 90 (2.3%) | 243 (6.5%) |
| $10,000 to $12,499 | 128 (3.3%) | 241 (6.5%) |
| $12,500 to $14,999 | 183 (4.7%) | 44 (1.2%) |
| $15,000 to $17,499 | 120 (3.1%) | 150 (4.0%) |
| $17,500 to $19,999 | 29 (0.7%) | 48 (1.3%) |
| $20,000 to $22,499 | 107 (2.7%) | 175 (4.7%) |
| $22,500 to $24,999 | 134 (3.4%) | 81 (2.2%) |
| $25,000 to $29,999 | 280 (7.1%) | 250 (6.7%) |
| $30,000 to $34,999 | 419 (10.7%) | 267 (7.2%) |
| $35,000 to $39,999 | 207 (5.3%) | 253 (6.8%) |
| $40,000 to $44,999 | 352 (9.0%) | 230 (6.2%) |
| $45,000 to $49,999 | 155 (4.0%) | 145 (3.9%) |
| $50,000 to $54,999 | 78 (2.0%) | 144 (3.9%) |
| $55,000 to $64,999 | 304 (7.8%) | 258 (6.9%) |
| $65,000 to $74,999 | 173 (4.4%) | 160 (4.3%) |
| $75,000 to $99,999 | 262 (6.7%) | 268 (7.2%) |
| $100,000+ | 440 (11.2%) | 133 (3.6%) |
| Total | 3,916 (100.0%) | 3,720 (100.0%) |
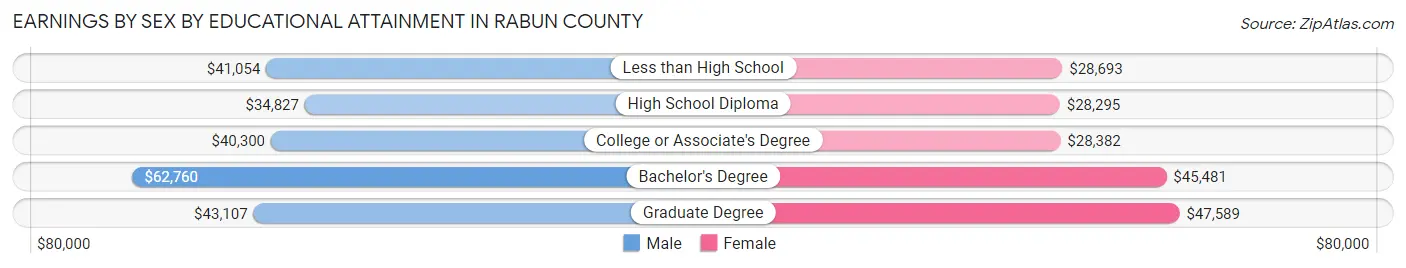
Earnings by Sex by Educational Attainment in Rabun County
Average earnings in Rabun County are $39,873 for men and $32,433 for women, a difference of 18.7%. Men with an educational attainment of bachelor's degree enjoy the highest average annual earnings of $62,760, while those with high school diploma education earn the least with $34,827. Women with an educational attainment of graduate degree earn the most with the average annual earnings of $47,589, while those with high school diploma education have the smallest earnings of $28,295.
| Educational Attainment | Male Income | Female Income |
| Less than High School | $41,054 | $28,693 |
| High School Diploma | $34,827 | $28,295 |
| College or Associate's Degree | $40,300 | $28,382 |
| Bachelor's Degree | $62,760 | $45,481 |
| Graduate Degree | $43,107 | $47,589 |
| Total | $39,873 | $32,433 |
Family Income in Rabun County
Family Income Brackets in Rabun County
According to the Rabun County family income data, there are 893 families falling into the $50,000 to $74,999 income range, which is the most common income bracket and makes up 19.5% of all families. Conversely, the less than $10,000 income bracket is the least frequent group with only 32 families (0.7%) belonging to this category.
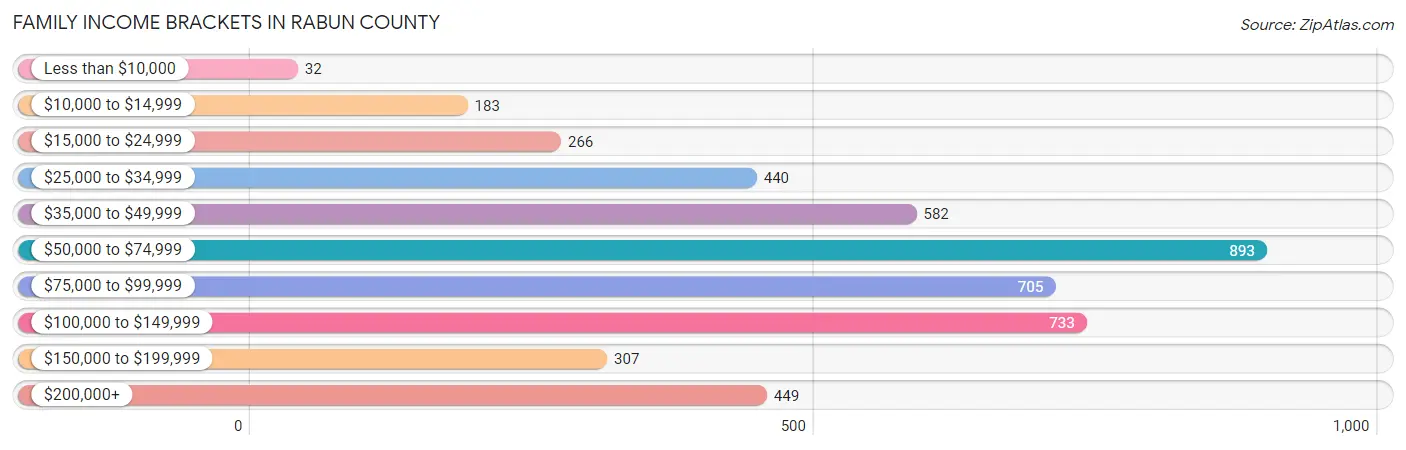
| Income Bracket | # Families | % Families |
| Less than $10,000 | 32 | 0.7% |
| $10,000 to $14,999 | 183 | 4.0% |
| $15,000 to $24,999 | 266 | 5.8% |
| $25,000 to $34,999 | 440 | 9.6% |
| $35,000 to $49,999 | 582 | 12.7% |
| $50,000 to $74,999 | 893 | 19.5% |
| $75,000 to $99,999 | 705 | 15.4% |
| $100,000 to $149,999 | 733 | 16.0% |
| $150,000 to $199,999 | 307 | 6.7% |
| $200,000+ | 449 | 9.8% |
Family Income by Famaliy Size in Rabun County
6-person families (89 | 1.9%) account for the highest median family income in Rabun County with $164,028 per family, while 2-person families (2,977 | 65.0%) have the highest median income of $35,418 per family member.
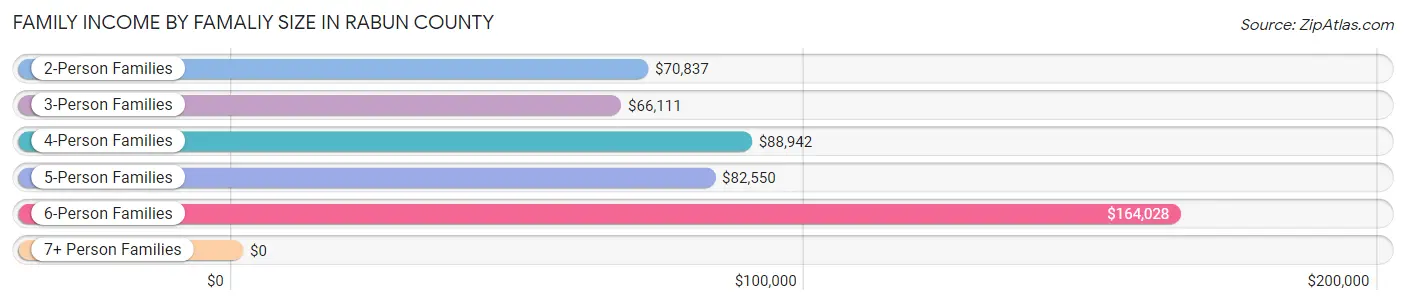
| Income Bracket | # Families | Median Income |
| 2-Person Families | 2,977 (65.0%) | $70,837 |
| 3-Person Families | 810 (17.7%) | $66,111 |
| 4-Person Families | 473 (10.3%) | $88,942 |
| 5-Person Families | 213 (4.6%) | $82,550 |
| 6-Person Families | 89 (1.9%) | $164,028 |
| 7+ Person Families | 19 (0.4%) | $0 |
| Total | 4,581 (100.0%) | $71,985 |
Family Income by Number of Earners in Rabun County
The median family income in Rabun County is $71,985, with families comprising 3+ earners (265) having the highest median family income of $126,375, while families with no earners (1,414) have the lowest median family income of $54,784, accounting for 5.8% and 30.9% of families, respectively.
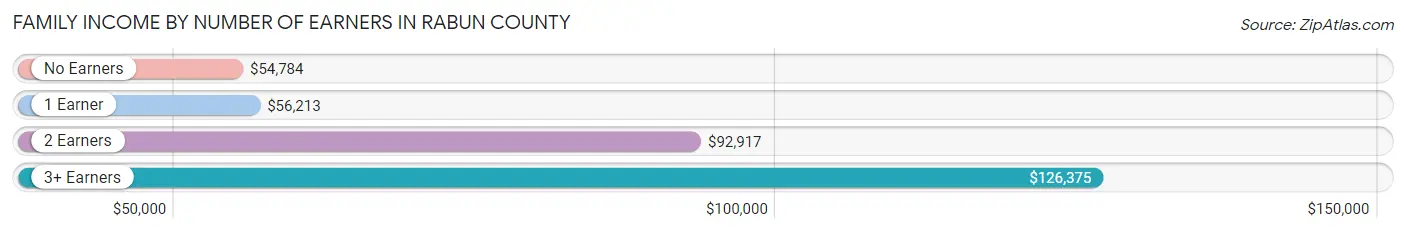
| Number of Earners | # Families | Median Income |
| No Earners | 1,414 (30.9%) | $54,784 |
| 1 Earner | 1,393 (30.4%) | $56,213 |
| 2 Earners | 1,509 (32.9%) | $92,917 |
| 3+ Earners | 265 (5.8%) | $126,375 |
| Total | 4,581 (100.0%) | $71,985 |
Household Income in Rabun County
Household Income Brackets in Rabun County
With 1,151 households falling in the category, the $50,000 to $74,999 income range is the most frequent in Rabun County, accounting for 16.4% of all households. In contrast, only 281 households (4.0%) fall into the less than $10,000 income bracket, making it the least populous group.
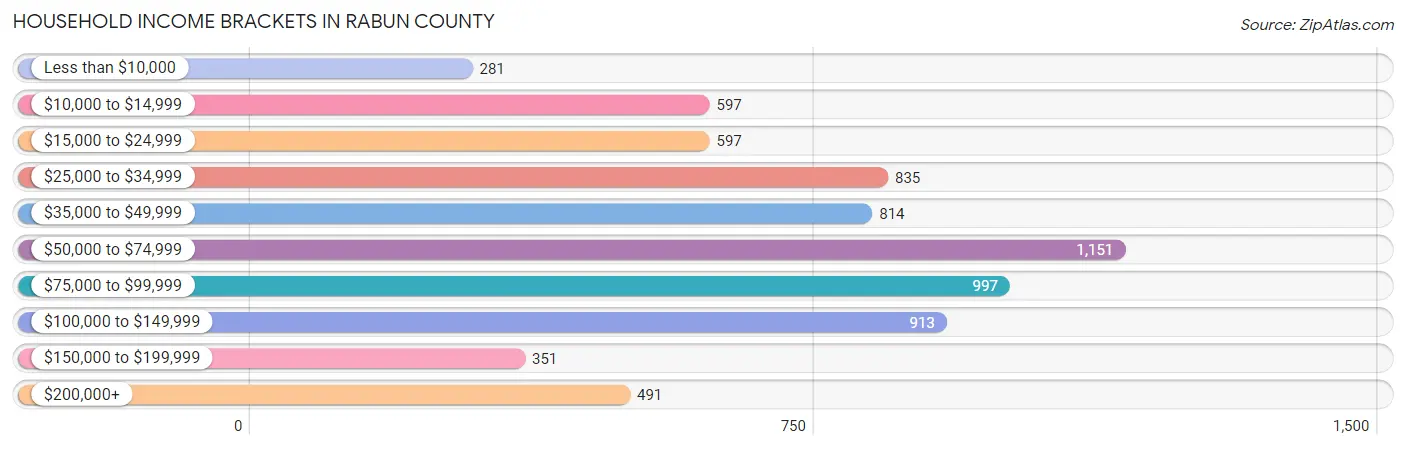
| Income Bracket | # Households | % Households |
| Less than $10,000 | 281 | 4.0% |
| $10,000 to $14,999 | 597 | 8.5% |
| $15,000 to $24,999 | 597 | 8.5% |
| $25,000 to $34,999 | 835 | 11.9% |
| $35,000 to $49,999 | 814 | 11.6% |
| $50,000 to $74,999 | 1,151 | 16.4% |
| $75,000 to $99,999 | 997 | 14.2% |
| $100,000 to $149,999 | 913 | 13.0% |
| $150,000 to $199,999 | 351 | 5.0% |
| $200,000+ | 491 | 7.0% |
Household Income by Householder Age in Rabun County
The median household income in Rabun County is $57,261, with the highest median household income of $78,792 found in the 45 to 64 years age bracket for the primary householder. A total of 2,375 households (33.8%) fall into this category. Meanwhile, the 15 to 24 years age bracket for the primary householder has the lowest median household income of $39,255, with 230 households (3.3%) in this group.
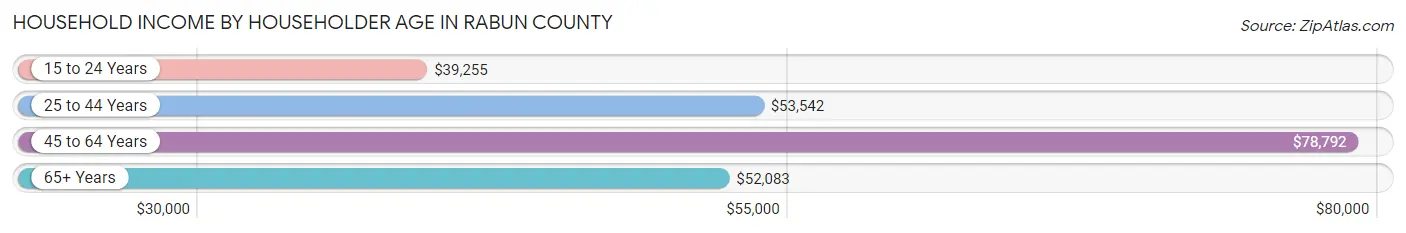
| Income Bracket | # Households | Median Income |
| 15 to 24 Years | 230 (3.3%) | $39,255 |
| 25 to 44 Years | 1,557 (22.2%) | $53,542 |
| 45 to 64 Years | 2,375 (33.8%) | $78,792 |
| 65+ Years | 2,858 (40.7%) | $52,083 |
| Total | 7,020 (100.0%) | $57,261 |
Poverty in Rabun County
Income Below Poverty by Sex and Age in Rabun County
With 13.2% poverty level for males and 15.7% for females among the residents of Rabun County, 6 to 11 year old males and under 5 year old females are the most vulnerable to poverty, with 178 males (45.1%) and 167 females (48.1%) in their respective age groups living below the poverty level.
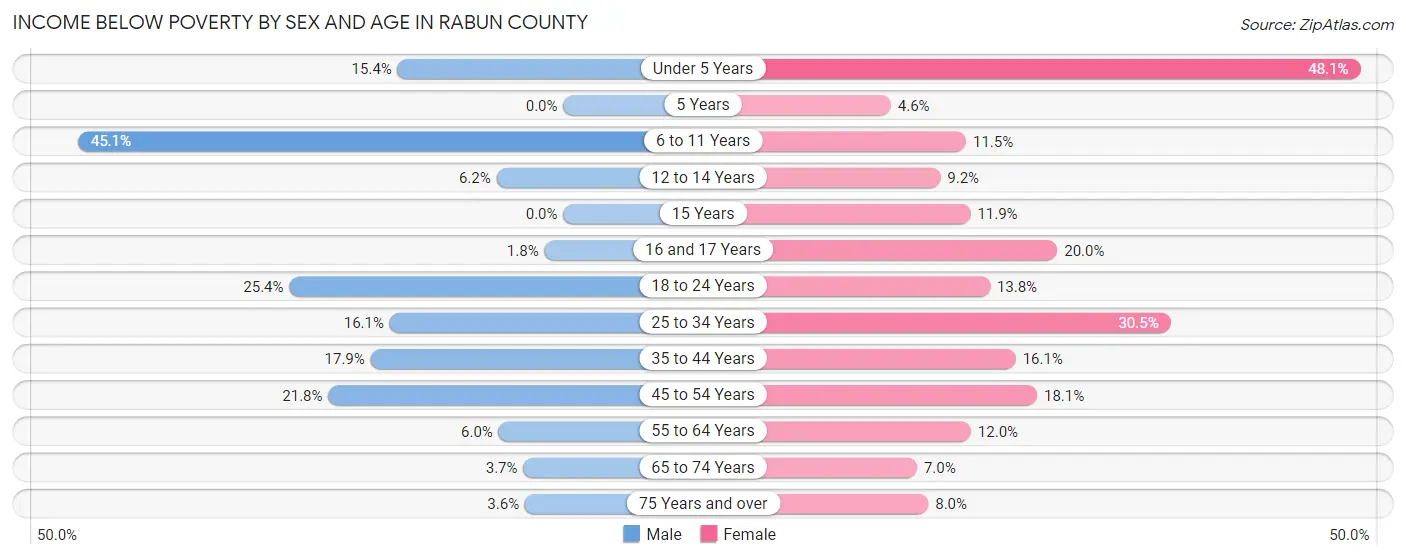
| Age Bracket | Male | Female |
| Under 5 Years | 52 (15.4%) | 167 (48.1%) |
| 5 Years | 0 (0.0%) | 2 (4.5%) |
| 6 to 11 Years | 178 (45.1%) | 34 (11.5%) |
| 12 to 14 Years | 16 (6.2%) | 30 (9.1%) |
| 15 Years | 0 (0.0%) | 8 (11.9%) |
| 16 and 17 Years | 3 (1.8%) | 30 (20.0%) |
| 18 to 24 Years | 148 (25.4%) | 70 (13.8%) |
| 25 to 34 Years | 140 (16.1%) | 316 (30.5%) |
| 35 to 44 Years | 149 (17.9%) | 139 (16.1%) |
| 45 to 54 Years | 222 (21.8%) | 197 (18.1%) |
| 55 to 64 Years | 74 (6.0%) | 161 (12.0%) |
| 65 to 74 Years | 50 (3.7%) | 100 (7.0%) |
| 75 Years and over | 32 (3.6%) | 79 (8.0%) |
| Total | 1,064 (13.2%) | 1,333 (15.7%) |
Income Above Poverty by Sex and Age in Rabun County
According to the poverty statistics in Rabun County, males aged 5 years and females aged 5 years are the age groups that are most secure financially, with 100.0% of males and 95.5% of females in these age groups living above the poverty line.
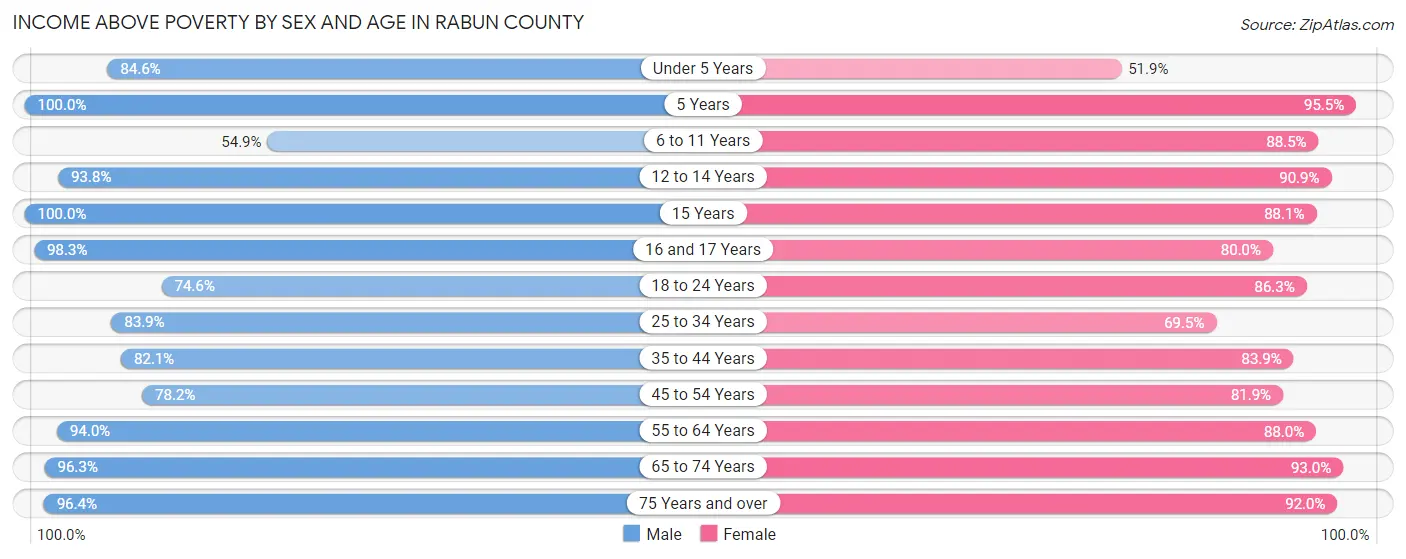
| Age Bracket | Male | Female |
| Under 5 Years | 286 (84.6%) | 180 (51.9%) |
| 5 Years | 47 (100.0%) | 42 (95.5%) |
| 6 to 11 Years | 217 (54.9%) | 261 (88.5%) |
| 12 to 14 Years | 242 (93.8%) | 298 (90.8%) |
| 15 Years | 74 (100.0%) | 59 (88.1%) |
| 16 and 17 Years | 168 (98.3%) | 120 (80.0%) |
| 18 to 24 Years | 434 (74.6%) | 439 (86.3%) |
| 25 to 34 Years | 729 (83.9%) | 720 (69.5%) |
| 35 to 44 Years | 684 (82.1%) | 722 (83.9%) |
| 45 to 54 Years | 796 (78.2%) | 890 (81.9%) |
| 55 to 64 Years | 1,159 (94.0%) | 1,183 (88.0%) |
| 65 to 74 Years | 1,298 (96.3%) | 1,333 (93.0%) |
| 75 Years and over | 866 (96.4%) | 905 (92.0%) |
| Total | 7,000 (86.8%) | 7,152 (84.3%) |
Income Below Poverty Among Married-Couple Families in Rabun County
The poverty statistics for married-couple families in Rabun County show that 6.0% or 219 of the total 3,657 families live below the poverty line. Families with 3 or 4 children have the highest poverty rate of 23.4%, comprising of 40 families. On the other hand, families with no children have the lowest poverty rate of 3.0%, which includes 86 families.
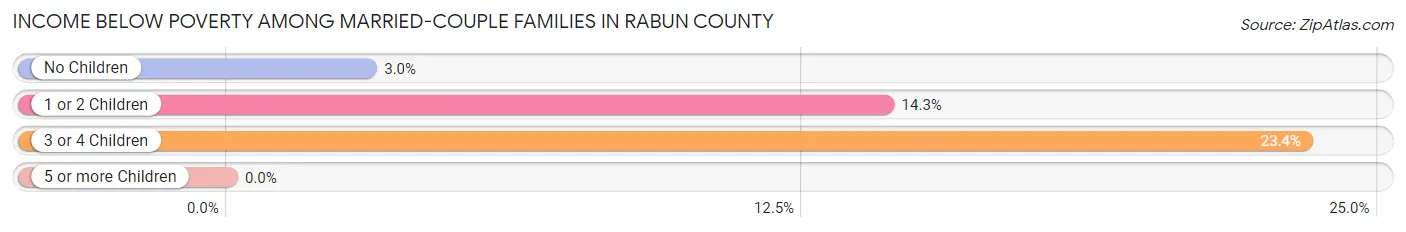
| Children | Above Poverty | Below Poverty |
| No Children | 2,749 (97.0%) | 86 (3.0%) |
| 1 or 2 Children | 558 (85.7%) | 93 (14.3%) |
| 3 or 4 Children | 131 (76.6%) | 40 (23.4%) |
| 5 or more Children | 0 (0.0%) | 0 (0.0%) |
| Total | 3,438 (94.0%) | 219 (6.0%) |
Income Below Poverty Among Single-Parent Households in Rabun County
According to the poverty data in Rabun County, 4.2% or 13 single-father households and 23.9% or 147 single-mother households are living below the poverty line. Among single-father households, those with 1 or 2 children have the highest poverty rate, with 13 households (6.5%) experiencing poverty. Likewise, among single-mother households, those with 1 or 2 children have the highest poverty rate, with 113 households (40.4%) falling below the poverty line.
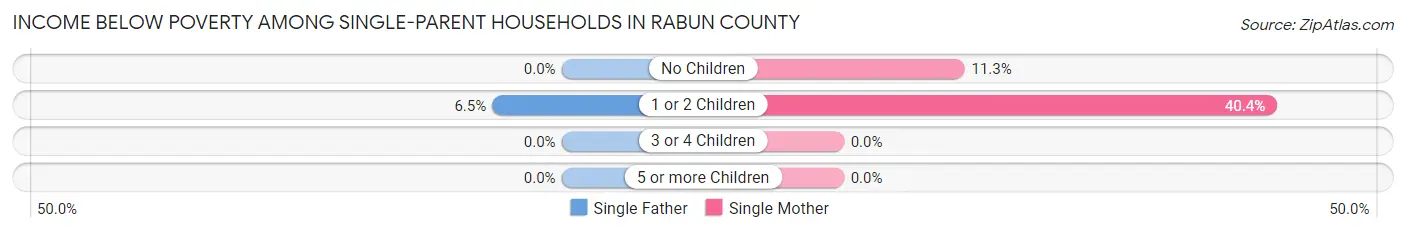
| Children | Single Father | Single Mother |
| No Children | 0 (0.0%) | 34 (11.3%) |
| 1 or 2 Children | 13 (6.5%) | 113 (40.4%) |
| 3 or 4 Children | 0 (0.0%) | 0 (0.0%) |
| 5 or more Children | 0 (0.0%) | 0 (0.0%) |
| Total | 13 (4.2%) | 147 (23.9%) |
Income Below Poverty Among Married-Couple vs Single-Parent Households in Rabun County
The poverty data for Rabun County shows that 219 of the married-couple family households (6.0%) and 160 of the single-parent households (17.3%) are living below the poverty level. Within the married-couple family households, those with 3 or 4 children have the highest poverty rate, with 40 households (23.4%) falling below the poverty line. Among the single-parent households, those with 1 or 2 children have the highest poverty rate, with 126 household (26.2%) living below poverty.
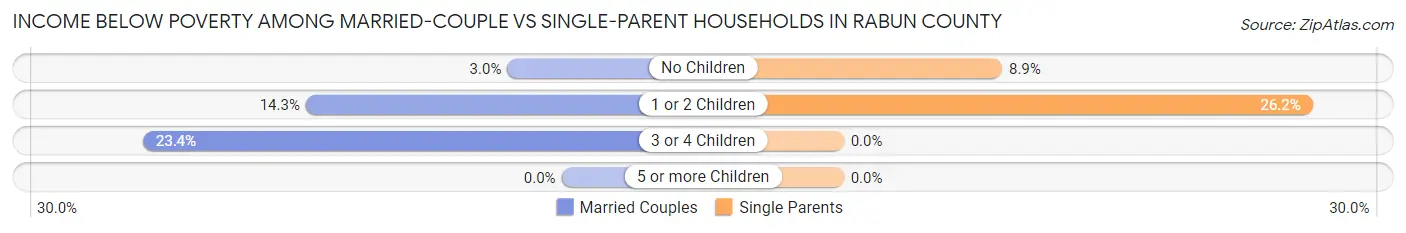
| Children | Married-Couple Families | Single-Parent Households |
| No Children | 86 (3.0%) | 34 (8.8%) |
| 1 or 2 Children | 93 (14.3%) | 126 (26.2%) |
| 3 or 4 Children | 40 (23.4%) | 0 (0.0%) |
| 5 or more Children | 0 (0.0%) | 0 (0.0%) |
| Total | 219 (6.0%) | 160 (17.3%) |
Race in Rabun County
The most populous races in Rabun County are White / Caucasian (15,171 | 89.7%), Hispanic or Latino (1,350 | 8.0%), and Two or more Races (873 | 5.2%).
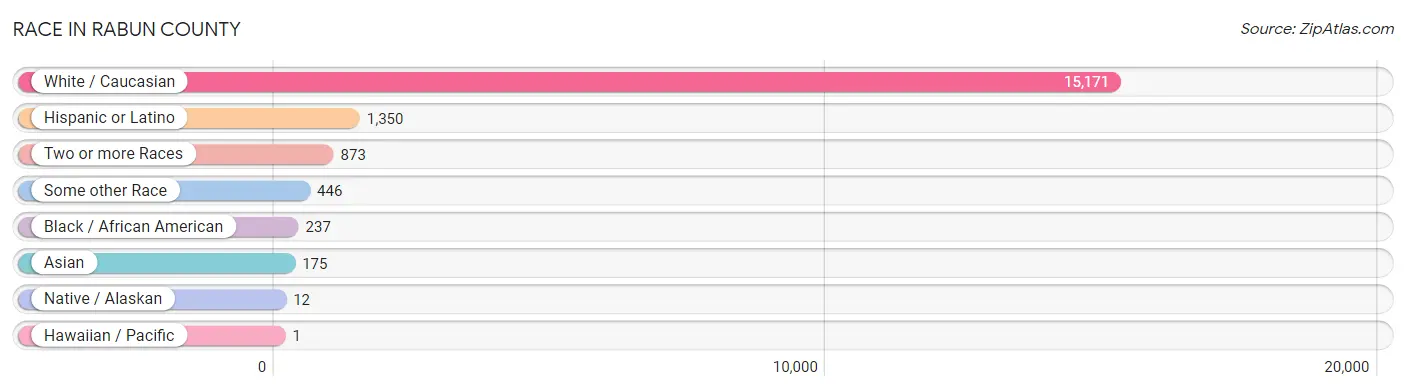
| Race | # Population | % Population |
| Asian | 175 | 1.0% |
| Black / African American | 237 | 1.4% |
| Hawaiian / Pacific | 1 | 0.0% |
| Hispanic or Latino | 1,350 | 8.0% |
| Native / Alaskan | 12 | 0.1% |
| White / Caucasian | 15,171 | 89.7% |
| Two or more Races | 873 | 5.2% |
| Some other Race | 446 | 2.6% |
| Total | 16,915 | 100.0% |
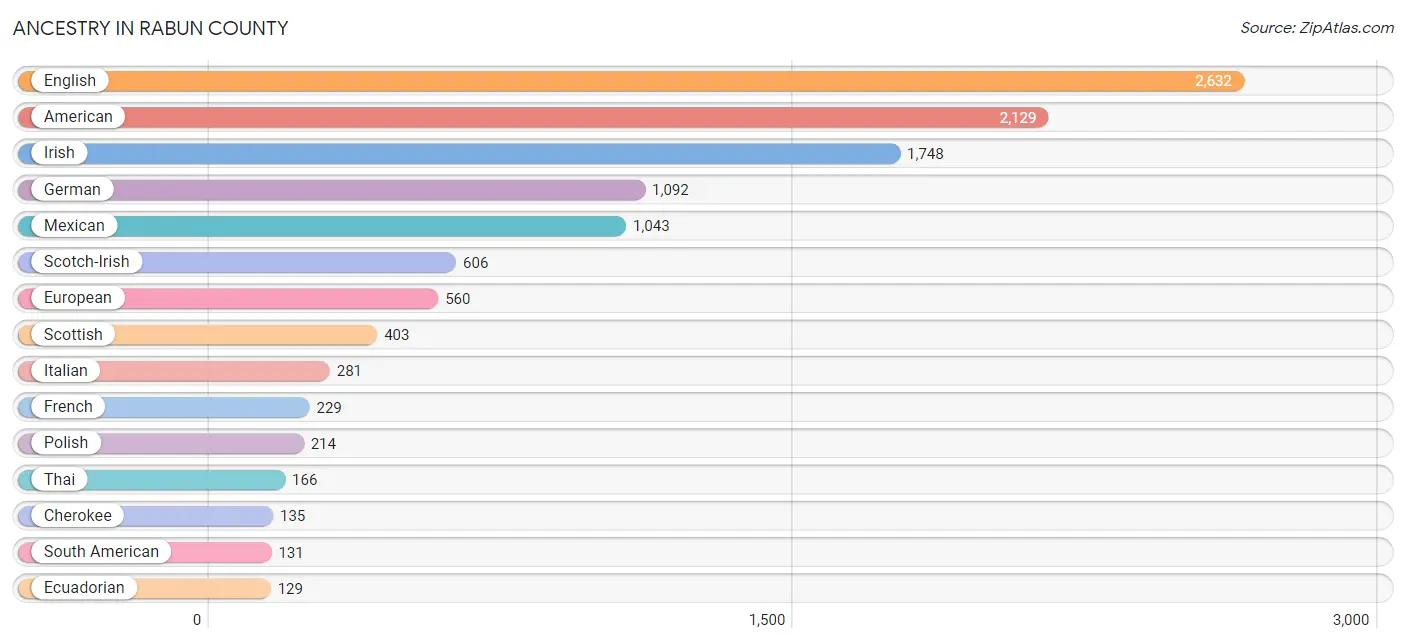
Ancestry in Rabun County
The most populous ancestries reported in Rabun County are English (2,632 | 15.6%), American (2,129 | 12.6%), Irish (1,748 | 10.3%), German (1,092 | 6.5%), and Mexican (1,043 | 6.2%), together accounting for 51.1% of all Rabun County residents.
| Ancestry | # Population | % Population |
| American | 2,129 | 12.6% |
| Arab | 5 | 0.0% |
| Armenian | 13 | 0.1% |
| Austrian | 29 | 0.2% |
| Belgian | 31 | 0.2% |
| Bhutanese | 36 | 0.2% |
| British | 82 | 0.5% |
| Cajun | 13 | 0.1% |
| Canadian | 46 | 0.3% |
| Central American | 59 | 0.4% |
| Central American Indian | 7 | 0.0% |
| Cherokee | 135 | 0.8% |
| Choctaw | 28 | 0.2% |
| Colombian | 2 | 0.0% |
| Cuban | 36 | 0.2% |
| Czech | 36 | 0.2% |
| Dominican | 2 | 0.0% |
| Dutch | 117 | 0.7% |
| Eastern European | 25 | 0.2% |
| Ecuadorian | 129 | 0.8% |
| English | 2,632 | 15.6% |
| European | 560 | 3.3% |
| Filipino | 4 | 0.0% |
| Finnish | 18 | 0.1% |
| French | 229 | 1.3% |
| French American Indian | 4 | 0.0% |
| French Canadian | 30 | 0.2% |
| German | 1,092 | 6.5% |
| Greek | 8 | 0.1% |
| Guamanian / Chamorro | 1 | 0.0% |
| Honduran | 2 | 0.0% |
| Hungarian | 41 | 0.2% |
| Irish | 1,748 | 10.3% |
| Italian | 281 | 1.7% |
| Korean | 5 | 0.0% |
| Latvian | 36 | 0.2% |
| Lebanese | 4 | 0.0% |
| Mexican | 1,043 | 6.2% |
| Mexican American Indian | 7 | 0.0% |
| Northern European | 19 | 0.1% |
| Norwegian | 76 | 0.4% |
| Panamanian | 57 | 0.3% |
| Polish | 214 | 1.3% |
| Puerto Rican | 47 | 0.3% |
| Russian | 18 | 0.1% |
| Scandinavian | 60 | 0.4% |
| Scotch-Irish | 606 | 3.6% |
| Scottish | 403 | 2.4% |
| Serbian | 5 | 0.0% |
| Slovak | 17 | 0.1% |
| South American | 131 | 0.8% |
| Spaniard | 14 | 0.1% |
| Spanish | 18 | 0.1% |
| Subsaharan African | 2 | 0.0% |
| Swedish | 125 | 0.7% |
| Swiss | 57 | 0.3% |
| Thai | 166 | 1.0% |
| Ukrainian | 6 | 0.0% |
| Welsh | 41 | 0.2% | View All 59 Rows |
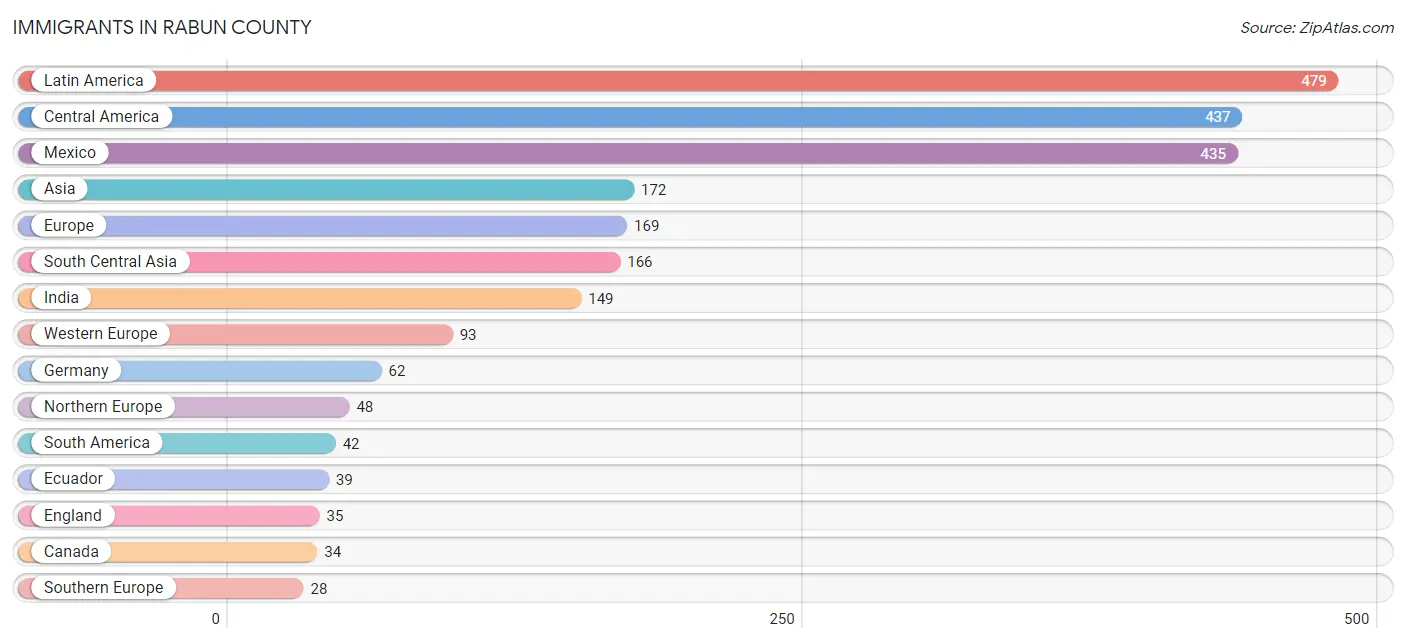
Immigrants in Rabun County
The most numerous immigrant groups reported in Rabun County came from Latin America (479 | 2.8%), Central America (437 | 2.6%), Mexico (435 | 2.6%), Asia (172 | 1.0%), and Europe (169 | 1.0%), together accounting for 10.0% of all Rabun County residents.
| Immigration Origin | # Population | % Population |
| Africa | 2 | 0.0% |
| Asia | 172 | 1.0% |
| Bangladesh | 17 | 0.1% |
| Belgium | 20 | 0.1% |
| Canada | 34 | 0.2% |
| Central America | 437 | 2.6% |
| Colombia | 2 | 0.0% |
| Eastern Africa | 2 | 0.0% |
| Ecuador | 39 | 0.2% |
| England | 35 | 0.2% |
| Europe | 169 | 1.0% |
| France | 4 | 0.0% |
| Germany | 62 | 0.4% |
| Honduras | 2 | 0.0% |
| India | 149 | 0.9% |
| Iraq | 1 | 0.0% |
| Ireland | 6 | 0.0% |
| Latin America | 479 | 2.8% |
| Mexico | 435 | 2.6% |
| Netherlands | 7 | 0.0% |
| Northern Europe | 48 | 0.3% |
| Oceania | 9 | 0.1% |
| Philippines | 5 | 0.0% |
| South America | 42 | 0.3% |
| South Central Asia | 166 | 1.0% |
| South Eastern Asia | 5 | 0.0% |
| Southern Europe | 28 | 0.2% |
| Spain | 28 | 0.2% |
| Uganda | 2 | 0.0% |
| Venezuela | 1 | 0.0% |
| Western Asia | 1 | 0.0% |
| Western Europe | 93 | 0.5% | View All 32 Rows |
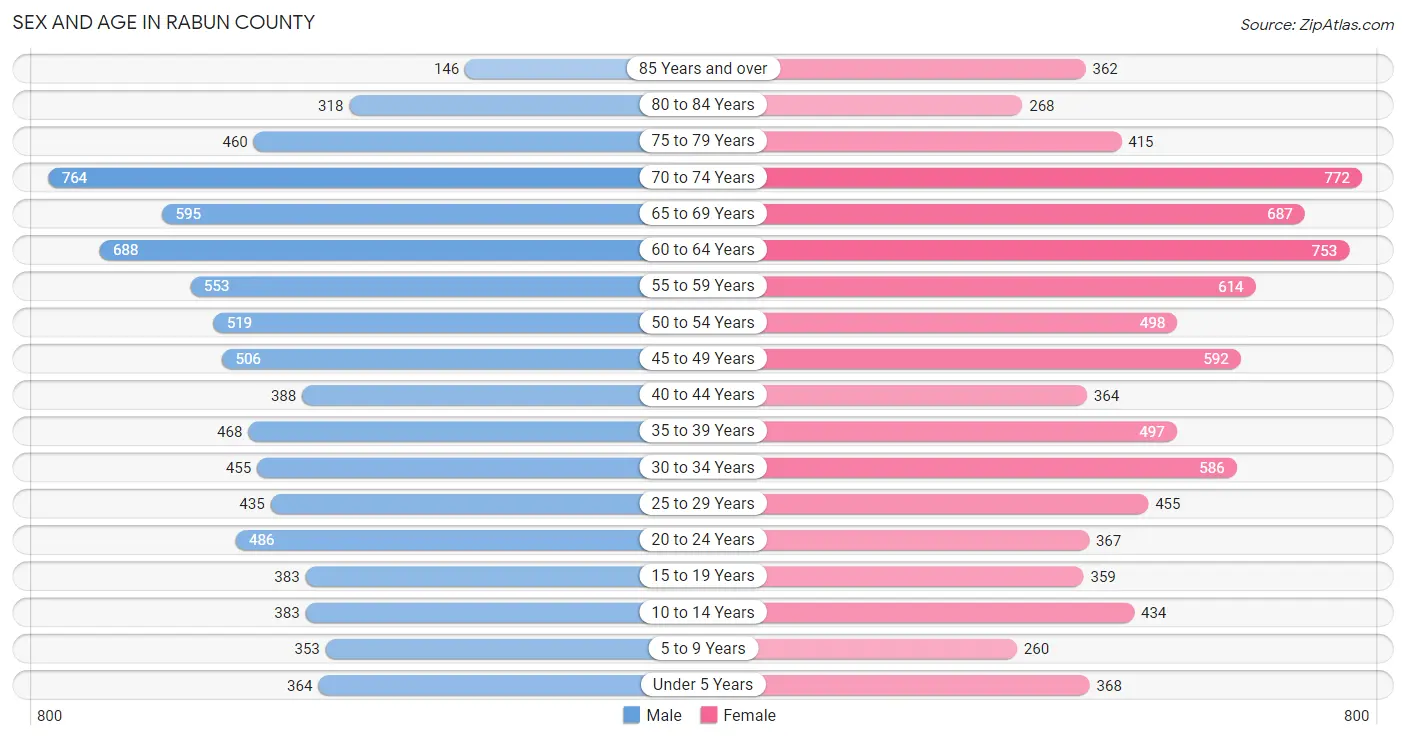
Sex and Age in Rabun County
Sex and Age in Rabun County
The most populous age groups in Rabun County are 70 to 74 Years (764 | 9.2%) for men and 70 to 74 Years (772 | 8.9%) for women.
| Age Bracket | Male | Female |
| Under 5 Years | 364 (4.4%) | 368 (4.3%) |
| 5 to 9 Years | 353 (4.3%) | 260 (3.0%) |
| 10 to 14 Years | 383 (4.6%) | 434 (5.0%) |
| 15 to 19 Years | 383 (4.6%) | 359 (4.2%) |
| 20 to 24 Years | 486 (5.9%) | 367 (4.2%) |
| 25 to 29 Years | 435 (5.3%) | 455 (5.3%) |
| 30 to 34 Years | 455 (5.5%) | 586 (6.8%) |
| 35 to 39 Years | 468 (5.7%) | 497 (5.8%) |
| 40 to 44 Years | 388 (4.7%) | 364 (4.2%) |
| 45 to 49 Years | 506 (6.1%) | 592 (6.8%) |
| 50 to 54 Years | 519 (6.3%) | 498 (5.8%) |
| 55 to 59 Years | 553 (6.7%) | 614 (7.1%) |
| 60 to 64 Years | 688 (8.3%) | 753 (8.7%) |
| 65 to 69 Years | 595 (7.2%) | 687 (7.9%) |
| 70 to 74 Years | 764 (9.2%) | 772 (8.9%) |
| 75 to 79 Years | 460 (5.6%) | 415 (4.8%) |
| 80 to 84 Years | 318 (3.8%) | 268 (3.1%) |
| 85 Years and over | 146 (1.8%) | 362 (4.2%) |
| Total | 8,264 (100.0%) | 8,651 (100.0%) |
Families and Households in Rabun County
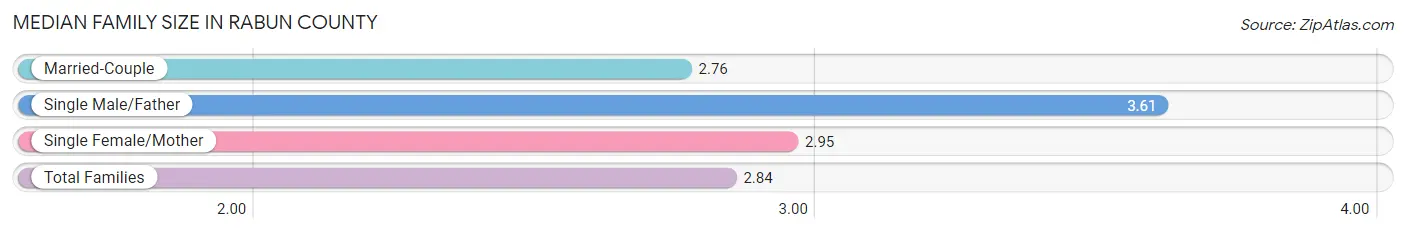
Median Family Size in Rabun County
The median family size in Rabun County is 2.84 persons per family, with single male/father families (309 | 6.8%) accounting for the largest median family size of 3.61 persons per family. On the other hand, married-couple families (3,657 | 79.8%) represent the smallest median family size with 2.76 persons per family.
| Family Type | # Families | Family Size |
| Married-Couple | 3,657 (79.8%) | 2.76 |
| Single Male/Father | 309 (6.8%) | 3.61 |
| Single Female/Mother | 615 (13.4%) | 2.95 |
| Total Families | 4,581 (100.0%) | 2.84 |
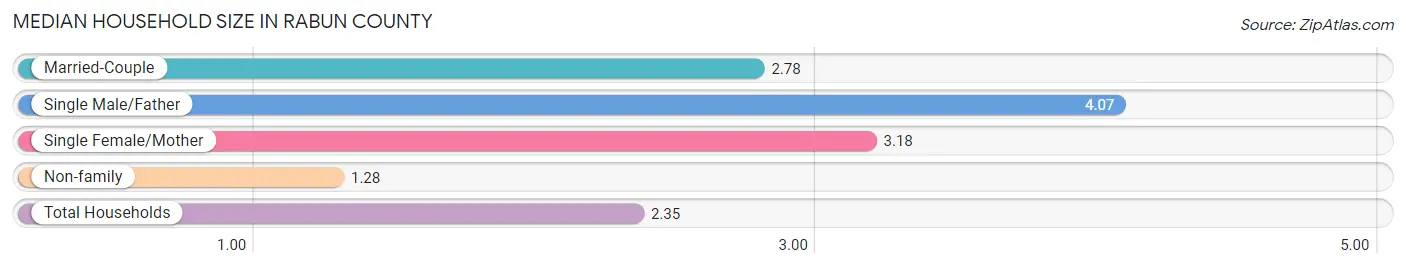
Median Household Size in Rabun County
The median household size in Rabun County is 2.35 persons per household, with single male/father households (309 | 4.4%) accounting for the largest median household size of 4.07 persons per household. non-family households (2,439 | 34.7%) represent the smallest median household size with 1.28 persons per household.
| Household Type | # Households | Household Size |
| Married-Couple | 3,657 (52.1%) | 2.78 |
| Single Male/Father | 309 (4.4%) | 4.07 |
| Single Female/Mother | 615 (8.8%) | 3.18 |
| Non-family | 2,439 (34.7%) | 1.28 |
| Total Households | 7,020 (100.0%) | 2.35 |
Household Size by Marriage Status in Rabun County
Out of a total of 7,020 households in Rabun County, 4,581 (65.3%) are family households, while 2,439 (34.7%) are nonfamily households. The most numerous type of family households are 2-person households, comprising 2,876, and the most common type of nonfamily households are 1-person households, comprising 2,060.
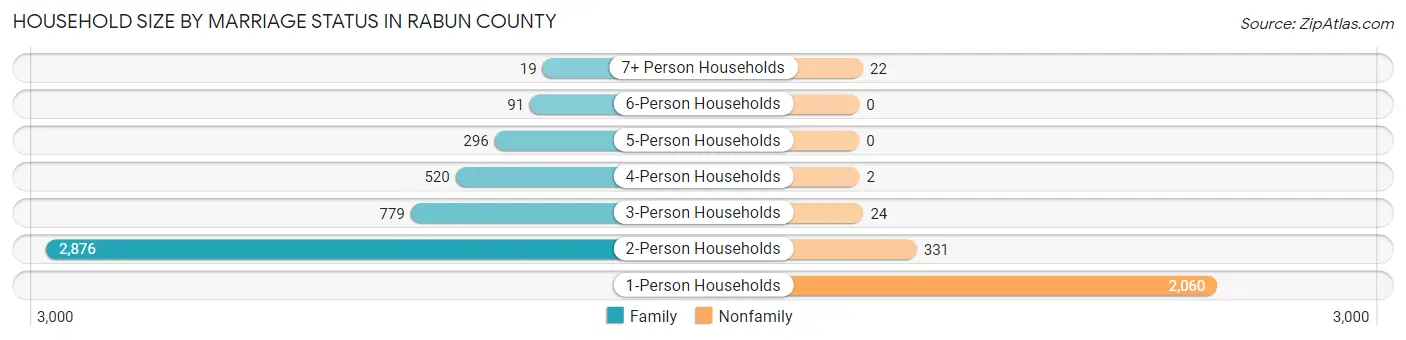
| Household Size | Family Households | Nonfamily Households |
| 1-Person Households | - | 2,060 (29.3%) |
| 2-Person Households | 2,876 (41.0%) | 331 (4.7%) |
| 3-Person Households | 779 (11.1%) | 24 (0.3%) |
| 4-Person Households | 520 (7.4%) | 2 (0.0%) |
| 5-Person Households | 296 (4.2%) | 0 (0.0%) |
| 6-Person Households | 91 (1.3%) | 0 (0.0%) |
| 7+ Person Households | 19 (0.3%) | 22 (0.3%) |
| Total | 4,581 (65.3%) | 2,439 (34.7%) |
Female Fertility in Rabun County
Fertility by Age in Rabun County
Average fertility rate in Rabun County is 33.0 births per 1,000 women. Women in the age bracket of 20 to 34 years have the highest fertility rate with 58.0 births per 1,000 women. Women in the age bracket of 20 to 34 years acount for 75.0% of all women with births.
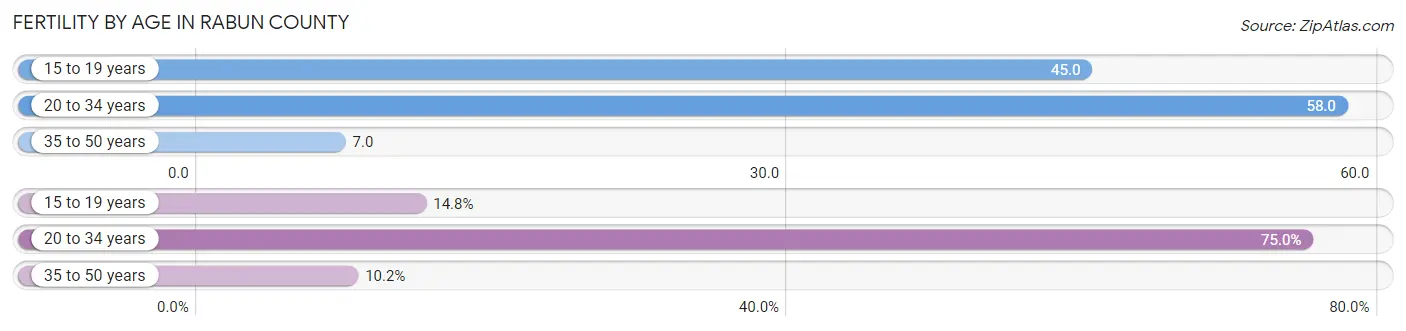
| Age Bracket | Women with Births | Births / 1,000 Women |
| 15 to 19 years | 16 (14.8%) | 45.0 |
| 20 to 34 years | 81 (75.0%) | 58.0 |
| 35 to 50 years | 11 (10.2%) | 7.0 |
| Total | 108 (100.0%) | 33.0 |
Fertility by Age by Marriage Status in Rabun County
48.1% of women with births (108) in Rabun County are married. The highest percentage of unmarried women with births falls into 35 to 50 years age bracket with 100.0% of them unmarried at the time of birth, while the lowest percentage of unmarried women with births belong to 15 to 19 years age bracket with 0.0% of them unmarried.
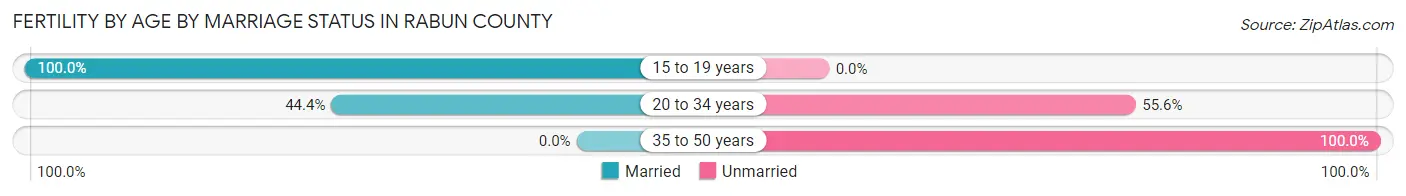
| Age Bracket | Married | Unmarried |
| 15 to 19 years | 16 (100.0%) | 0 (0.0%) |
| 20 to 34 years | 36 (44.4%) | 45 (55.6%) |
| 35 to 50 years | 0 (0.0%) | 11 (100.0%) |
| Total | 52 (48.1%) | 56 (51.8%) |
Fertility by Education in Rabun County
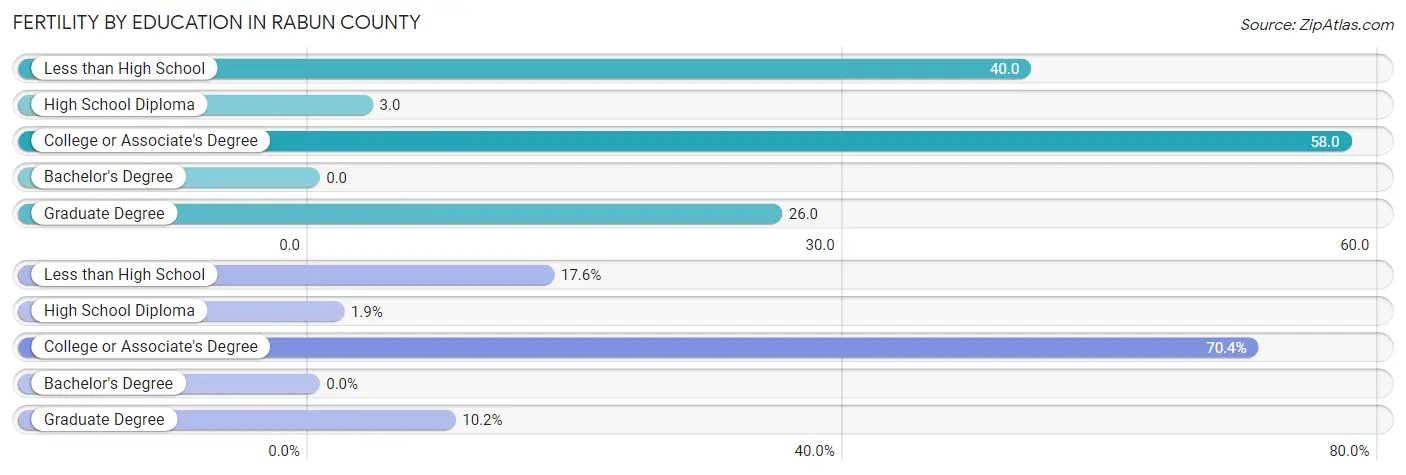
| Educational Attainment | Women with Births | Births / 1,000 Women |
| Less than High School | 19 (17.6%) | 40.0 |
| High School Diploma | 2 (1.8%) | 3.0 |
| College or Associate's Degree | 76 (70.4%) | 58.0 |
| Bachelor's Degree | 0 (0.0%) | 0.0 |
| Graduate Degree | 11 (10.2%) | 26.0 |
| Total | 108 (100.0%) | 33.0 |
Fertility by Education by Marriage Status in Rabun County
51.8% of women with births in Rabun County are unmarried. Women with the educational attainment of high school diploma are most likely to be married with 100.0% of them married at childbirth, while women with the educational attainment of college or associate's degree are least likely to be married with 69.7% of them unmarried at childbirth.
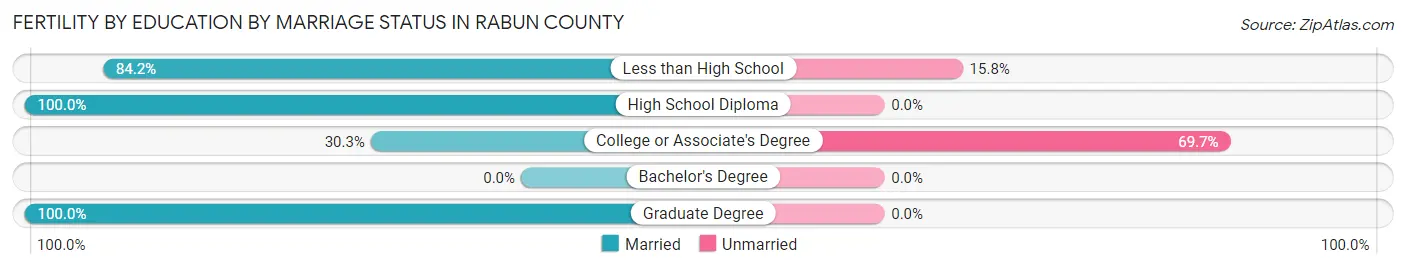
| Educational Attainment | Married | Unmarried |
| Less than High School | 16 (84.2%) | 3 (15.8%) |
| High School Diploma | 2 (100.0%) | 0 (0.0%) |
| College or Associate's Degree | 23 (30.3%) | 53 (69.7%) |
| Bachelor's Degree | 0 (0.0%) | 0 (0.0%) |
| Graduate Degree | 11 (100.0%) | 0 (0.0%) |
| Total | 52 (48.1%) | 56 (51.8%) |
Employment Characteristics in Rabun County
Employment by Class of Employer in Rabun County
Among the 6,735 employed individuals in Rabun County, private company employees (4,309 | 64.0%), self-employed (not incorporated) (761 | 11.3%), and local government employees (568 | 8.4%) make up the most common classes of employment.
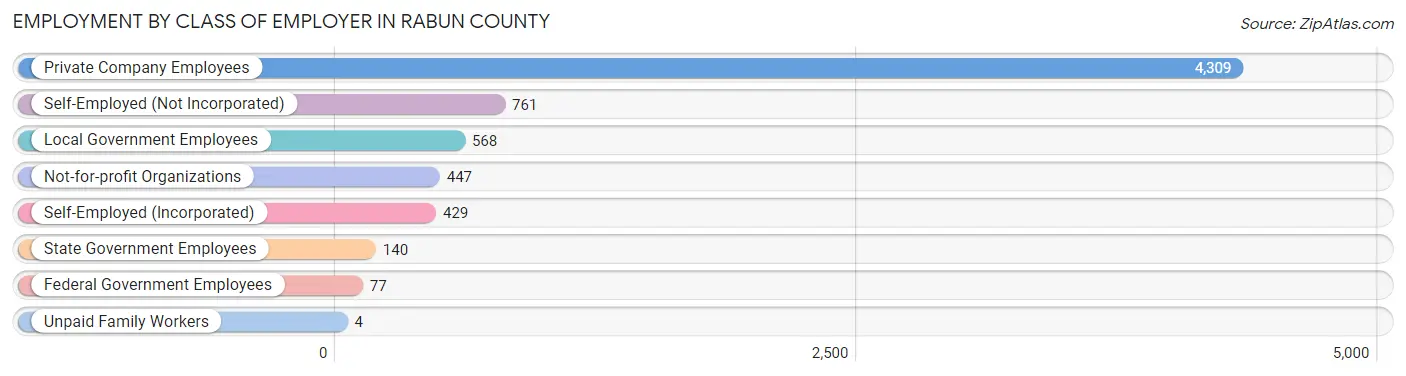
| Employer Class | # Employees | % Employees |
| Private Company Employees | 4,309 | 64.0% |
| Self-Employed (Incorporated) | 429 | 6.4% |
| Self-Employed (Not Incorporated) | 761 | 11.3% |
| Not-for-profit Organizations | 447 | 6.6% |
| Local Government Employees | 568 | 8.4% |
| State Government Employees | 140 | 2.1% |
| Federal Government Employees | 77 | 1.1% |
| Unpaid Family Workers | 4 | 0.1% |
| Total | 6,735 | 100.0% |
Employment Status by Age in Rabun County
According to the labor force statistics for Rabun County, out of the total population over 16 years of age (14,612), 48.2% or 7,043 individuals are in the labor force, with 2.6% or 183 of them unemployed. The age group with the highest labor force participation rate is 30 to 34 years, with 86.3% or 898 individuals in the labor force. Within the labor force, the 16 to 19 years age range has the highest percentage of unemployed individuals, with 16.6% or 35 of them being unemployed.
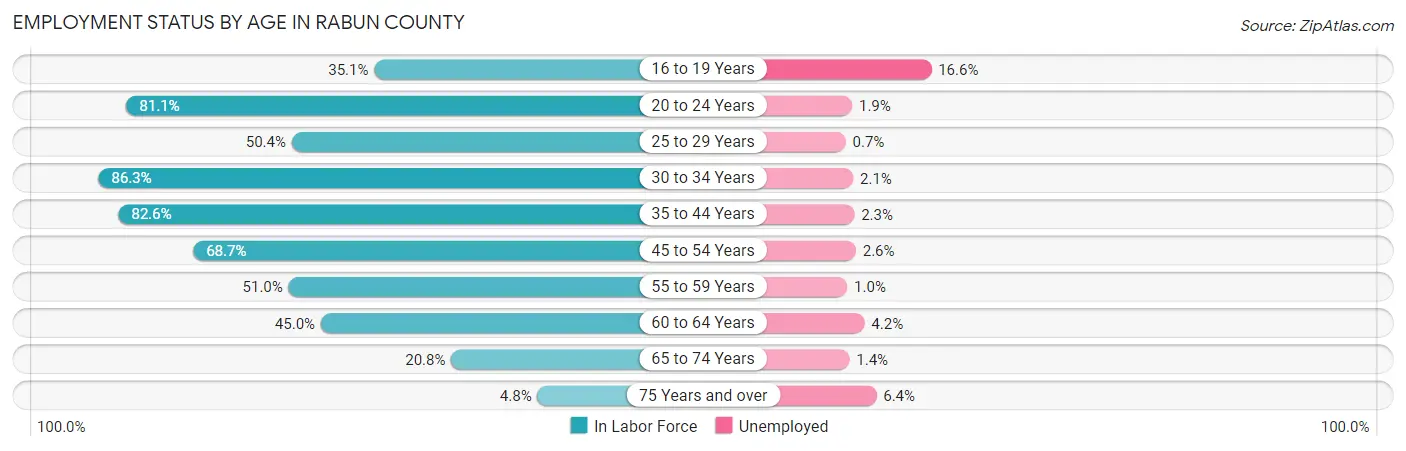
| Age Bracket | In Labor Force | Unemployed |
| 16 to 19 Years | 211 (35.1%) | 35 (16.6%) |
| 20 to 24 Years | 692 (81.1%) | 13 (1.9%) |
| 25 to 29 Years | 449 (50.4%) | 3 (0.7%) |
| 30 to 34 Years | 898 (86.3%) | 19 (2.1%) |
| 35 to 44 Years | 1,418 (82.6%) | 33 (2.3%) |
| 45 to 54 Years | 1,453 (68.7%) | 38 (2.6%) |
| 55 to 59 Years | 595 (51.0%) | 6 (1.0%) |
| 60 to 64 Years | 648 (45.0%) | 27 (4.2%) |
| 65 to 74 Years | 586 (20.8%) | 8 (1.4%) |
| 75 Years and over | 95 (4.8%) | 6 (6.4%) |
| Total | 7,043 (48.2%) | 183 (2.6%) |
Employment Status by Educational Attainment in Rabun County
According to labor force statistics for Rabun County, 65.3% of individuals (5,466) out of the total population between 25 and 64 years of age (8,371) are in the labor force, with 2.3% or 126 of them being unemployed. The group with the highest labor force participation rate are those with the educational attainment of bachelor's degree or higher, with 76.0% or 1,556 individuals in the labor force. Within the labor force, individuals with college / associate degree education have the highest percentage of unemployment, with 3.8% or 66 of them being unemployed.
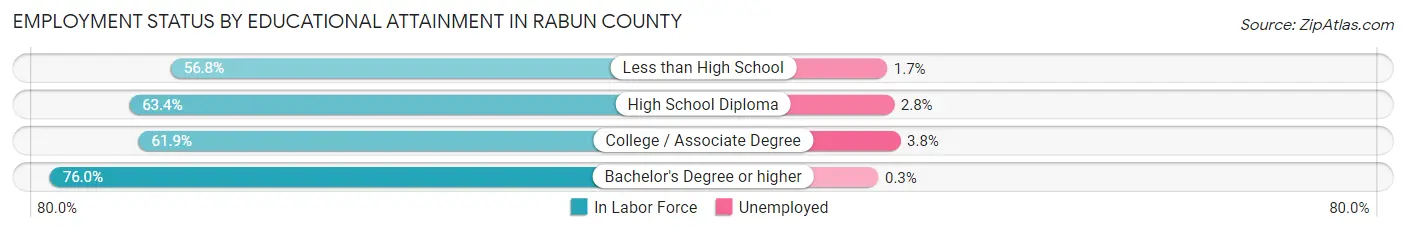
| Educational Attainment | In Labor Force | Unemployed |
| Less than High School | 523 (56.8%) | 16 (1.7%) |
| High School Diploma | 1,659 (63.4%) | 73 (2.8%) |
| College / Associate Degree | 1,725 (61.9%) | 106 (3.8%) |
| Bachelor's Degree or higher | 1,556 (76.0%) | 6 (0.3%) |
| Total | 5,466 (65.3%) | 193 (2.3%) |
Employment Occupations by Sex in Rabun County
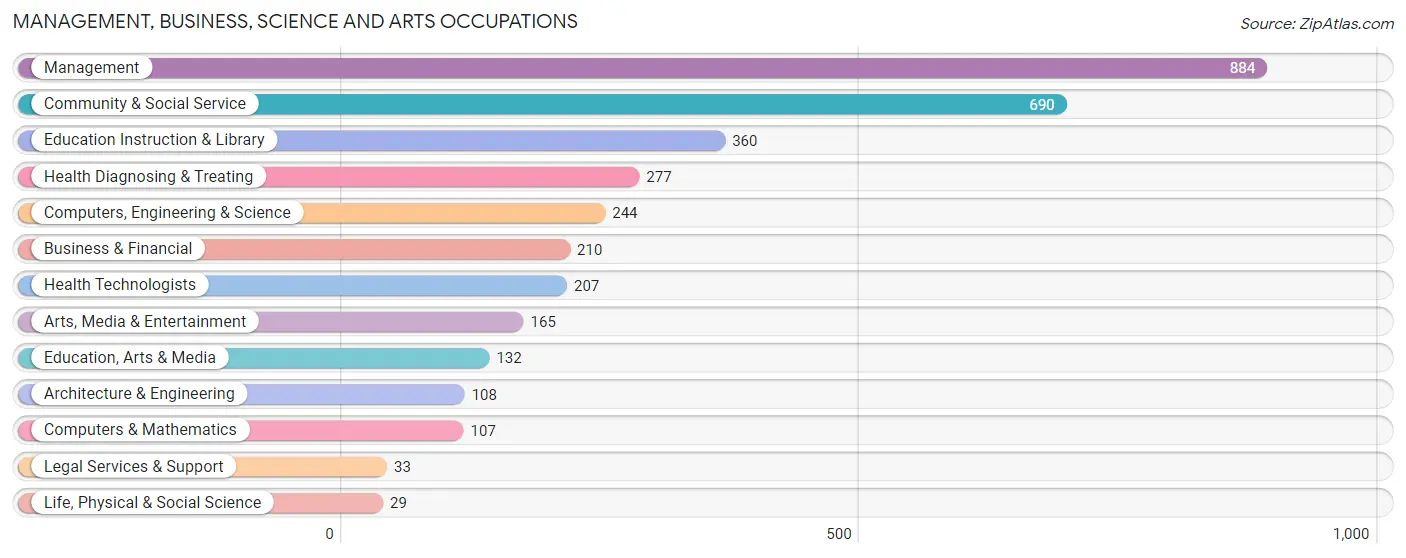
Management, Business, Science and Arts Occupations
The most common Management, Business, Science and Arts occupations in Rabun County are Management (884 | 12.9%), Community & Social Service (690 | 10.1%), Education Instruction & Library (360 | 5.3%), Health Diagnosing & Treating (277 | 4.0%), and Computers, Engineering & Science (244 | 3.6%).
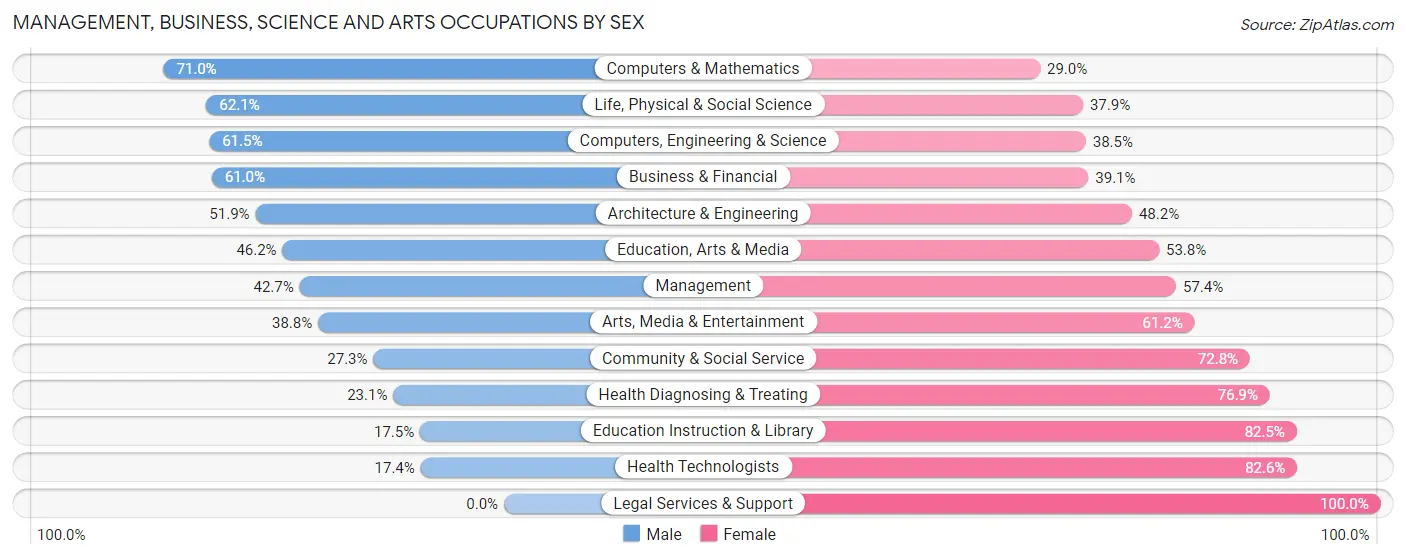
Management, Business, Science and Arts Occupations by Sex
Within the Management, Business, Science and Arts occupations in Rabun County, the most male-oriented occupations are Computers & Mathematics (71.0%), Life, Physical & Social Science (62.1%), and Computers, Engineering & Science (61.5%), while the most female-oriented occupations are Legal Services & Support (100.0%), Health Technologists (82.6%), and Education Instruction & Library (82.5%).
| Occupation | Male | Female |
| Management | 377 (42.6%) | 507 (57.4%) |
| Business & Financial | 128 (61.0%) | 82 (39.1%) |
| Computers, Engineering & Science | 150 (61.5%) | 94 (38.5%) |
| Computers & Mathematics | 76 (71.0%) | 31 (29.0%) |
| Architecture & Engineering | 56 (51.8%) | 52 (48.1%) |
| Life, Physical & Social Science | 18 (62.1%) | 11 (37.9%) |
| Community & Social Service | 188 (27.3%) | 502 (72.8%) |
| Education, Arts & Media | 61 (46.2%) | 71 (53.8%) |
| Legal Services & Support | 0 (0.0%) | 33 (100.0%) |
| Education Instruction & Library | 63 (17.5%) | 297 (82.5%) |
| Arts, Media & Entertainment | 64 (38.8%) | 101 (61.2%) |
| Health Diagnosing & Treating | 64 (23.1%) | 213 (76.9%) |
| Health Technologists | 36 (17.4%) | 171 (82.6%) |
| Total (Category) | 907 (39.4%) | 1,398 (60.7%) |
| Total (Overall) | 3,600 (52.6%) | 3,249 (47.4%) |
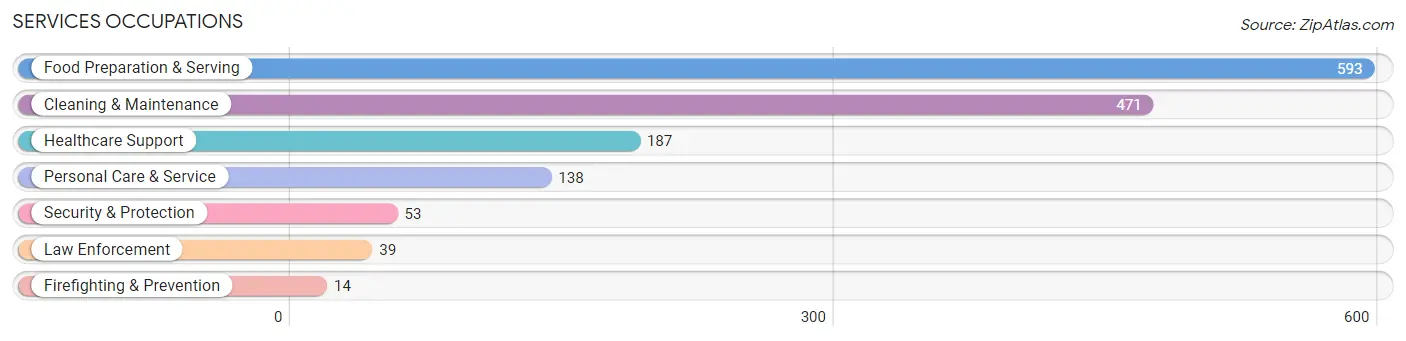
Services Occupations
The most common Services occupations in Rabun County are Food Preparation & Serving (593 | 8.7%), Cleaning & Maintenance (471 | 6.9%), Healthcare Support (187 | 2.7%), Personal Care & Service (138 | 2.0%), and Security & Protection (53 | 0.8%).
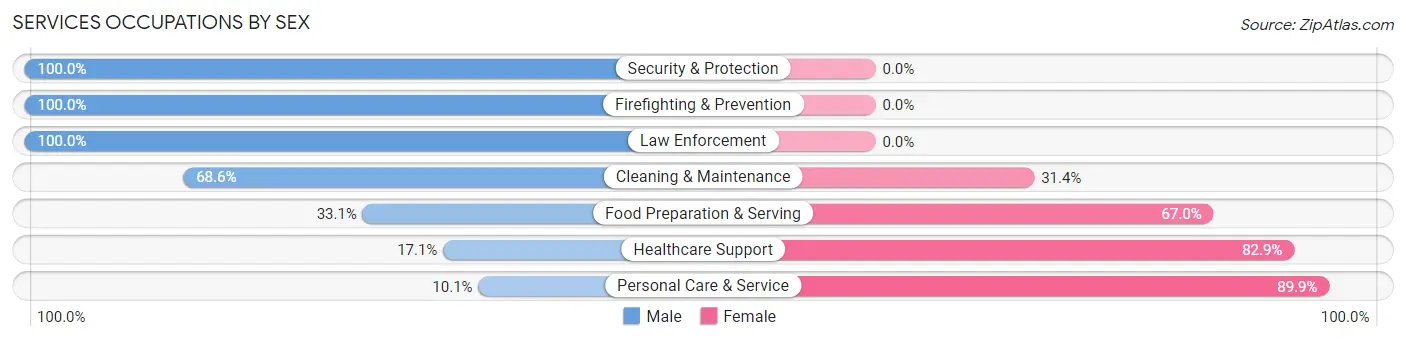
Services Occupations by Sex
Within the Services occupations in Rabun County, the most male-oriented occupations are Security & Protection (100.0%), Firefighting & Prevention (100.0%), and Law Enforcement (100.0%), while the most female-oriented occupations are Personal Care & Service (89.9%), Healthcare Support (82.9%), and Food Preparation & Serving (66.9%).
| Occupation | Male | Female |
| Healthcare Support | 32 (17.1%) | 155 (82.9%) |
| Security & Protection | 53 (100.0%) | 0 (0.0%) |
| Firefighting & Prevention | 14 (100.0%) | 0 (0.0%) |
| Law Enforcement | 39 (100.0%) | 0 (0.0%) |
| Food Preparation & Serving | 196 (33.1%) | 397 (66.9%) |
| Cleaning & Maintenance | 323 (68.6%) | 148 (31.4%) |
| Personal Care & Service | 14 (10.1%) | 124 (89.9%) |
| Total (Category) | 618 (42.9%) | 824 (57.1%) |
| Total (Overall) | 3,600 (52.6%) | 3,249 (47.4%) |
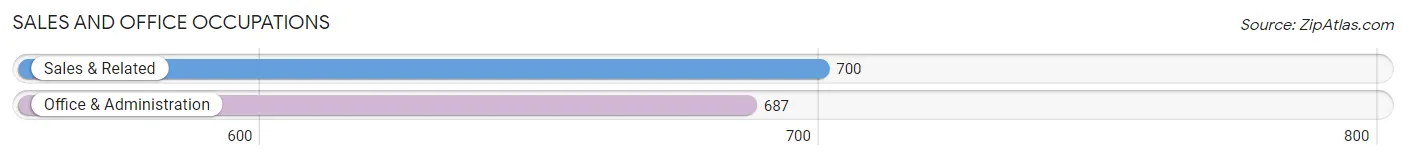
Sales and Office Occupations
The most common Sales and Office occupations in Rabun County are Sales & Related (700 | 10.2%), and Office & Administration (687 | 10.0%).
Sales and Office Occupations by Sex
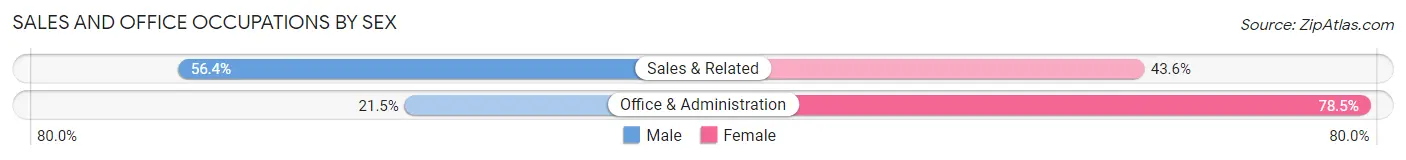
| Occupation | Male | Female |
| Sales & Related | 395 (56.4%) | 305 (43.6%) |
| Office & Administration | 148 (21.5%) | 539 (78.5%) |
| Total (Category) | 543 (39.2%) | 844 (60.9%) |
| Total (Overall) | 3,600 (52.6%) | 3,249 (47.4%) |
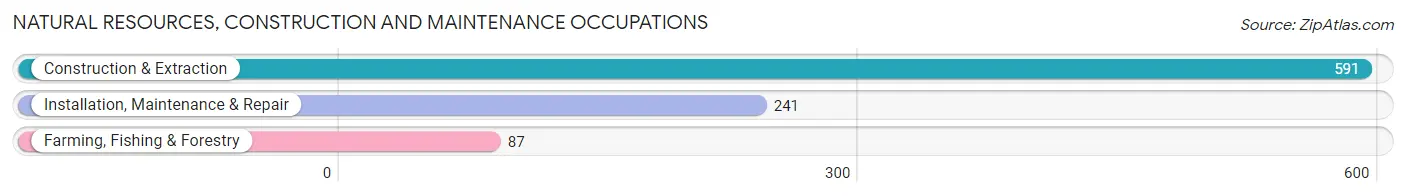
Natural Resources, Construction and Maintenance Occupations
The most common Natural Resources, Construction and Maintenance occupations in Rabun County are Construction & Extraction (591 | 8.6%), Installation, Maintenance & Repair (241 | 3.5%), and Farming, Fishing & Forestry (87 | 1.3%).
Natural Resources, Construction and Maintenance Occupations by Sex
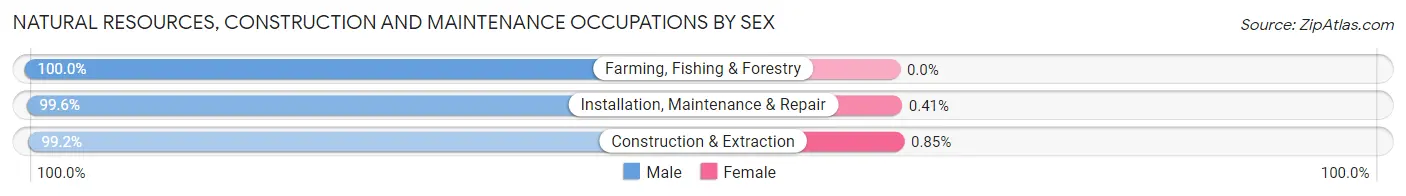
| Occupation | Male | Female |
| Farming, Fishing & Forestry | 87 (100.0%) | 0 (0.0%) |
| Construction & Extraction | 586 (99.2%) | 5 (0.9%) |
| Installation, Maintenance & Repair | 240 (99.6%) | 1 (0.4%) |
| Total (Category) | 913 (99.4%) | 6 (0.6%) |
| Total (Overall) | 3,600 (52.6%) | 3,249 (47.4%) |
Production, Transportation and Moving Occupations
The most common Production, Transportation and Moving occupations in Rabun County are Material Moving (302 | 4.4%), Transportation (287 | 4.2%), and Production (207 | 3.0%).
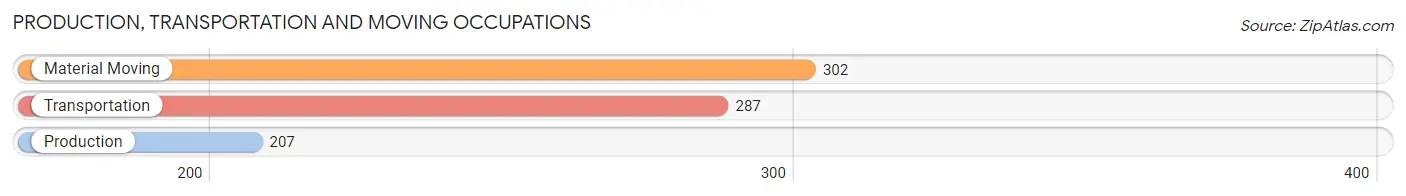
Production, Transportation and Moving Occupations by Sex
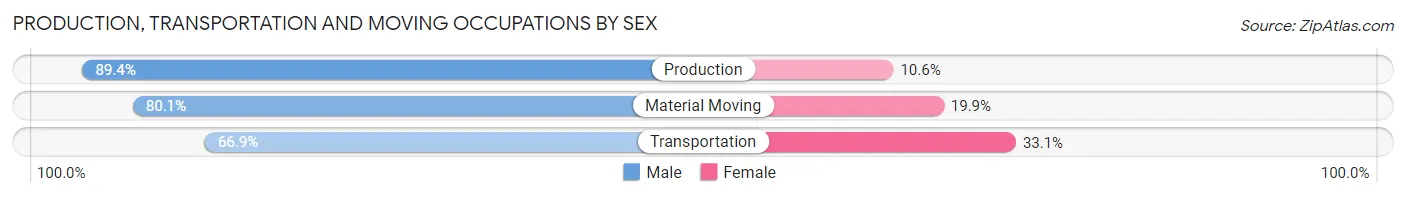
| Occupation | Male | Female |
| Production | 185 (89.4%) | 22 (10.6%) |
| Transportation | 192 (66.9%) | 95 (33.1%) |
| Material Moving | 242 (80.1%) | 60 (19.9%) |
| Total (Category) | 619 (77.8%) | 177 (22.2%) |
| Total (Overall) | 3,600 (52.6%) | 3,249 (47.4%) |
Employment Industries by Sex in Rabun County
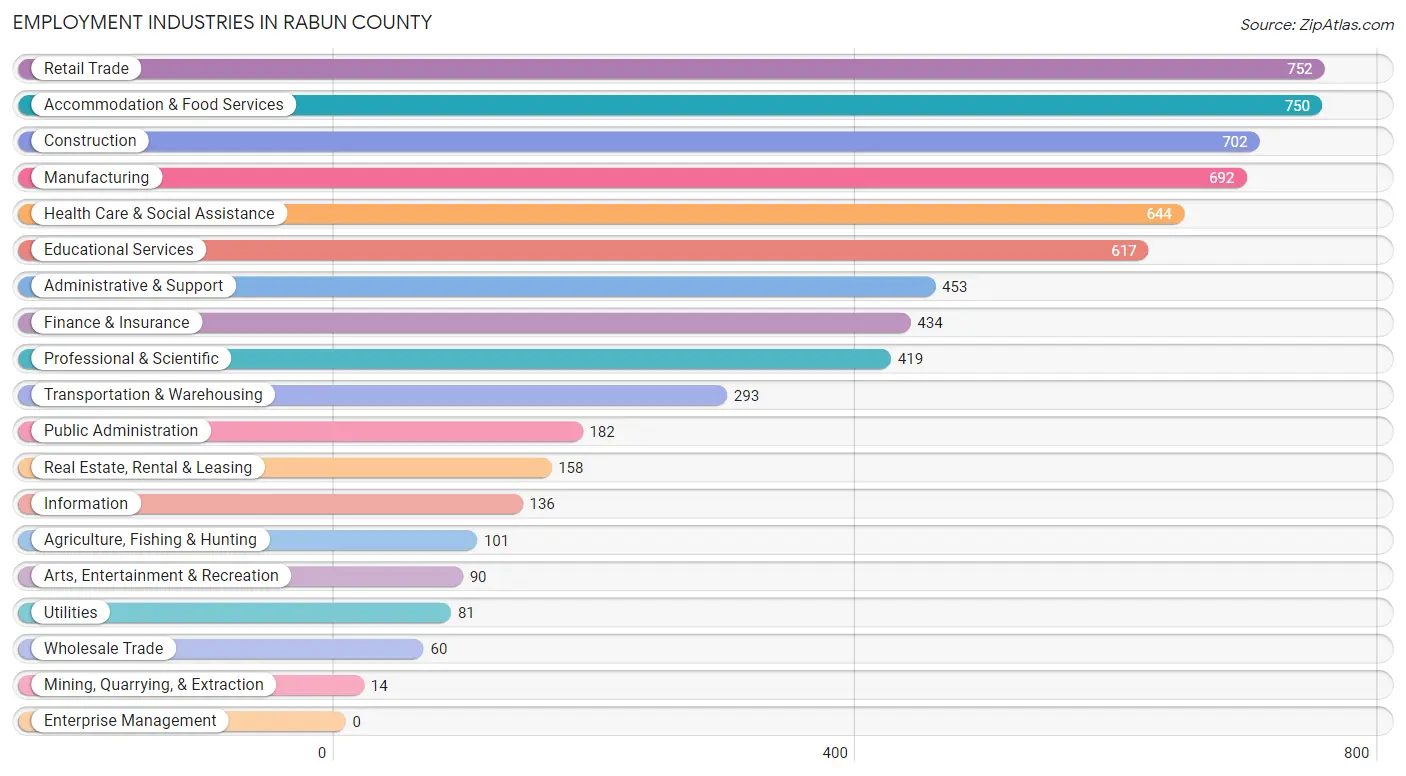
Employment Industries in Rabun County
The major employment industries in Rabun County include Retail Trade (752 | 11.0%), Accommodation & Food Services (750 | 11.0%), Construction (702 | 10.2%), Manufacturing (692 | 10.1%), and Health Care & Social Assistance (644 | 9.4%).
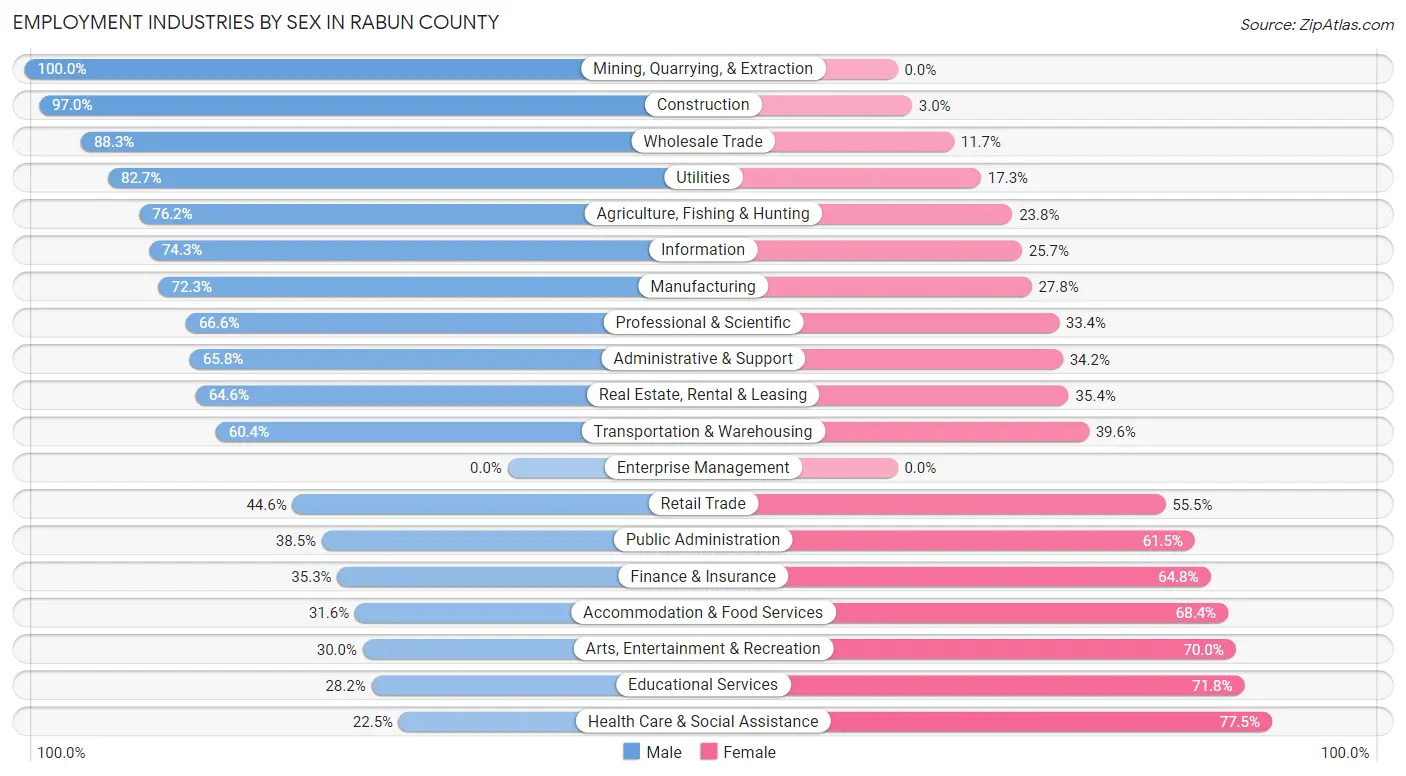
Employment Industries by Sex in Rabun County
The Rabun County industries that see more men than women are Mining, Quarrying, & Extraction (100.0%), Construction (97.0%), and Wholesale Trade (88.3%), whereas the industries that tend to have a higher number of women are Health Care & Social Assistance (77.5%), Educational Services (71.8%), and Arts, Entertainment & Recreation (70.0%).
| Industry | Male | Female |
| Agriculture, Fishing & Hunting | 77 (76.2%) | 24 (23.8%) |
| Mining, Quarrying, & Extraction | 14 (100.0%) | 0 (0.0%) |
| Construction | 681 (97.0%) | 21 (3.0%) |
| Manufacturing | 500 (72.3%) | 192 (27.8%) |
| Wholesale Trade | 53 (88.3%) | 7 (11.7%) |
| Retail Trade | 335 (44.6%) | 417 (55.4%) |
| Transportation & Warehousing | 177 (60.4%) | 116 (39.6%) |
| Utilities | 67 (82.7%) | 14 (17.3%) |
| Information | 101 (74.3%) | 35 (25.7%) |
| Finance & Insurance | 153 (35.2%) | 281 (64.7%) |
| Real Estate, Rental & Leasing | 102 (64.6%) | 56 (35.4%) |
| Professional & Scientific | 279 (66.6%) | 140 (33.4%) |
| Enterprise Management | 0 (0.0%) | 0 (0.0%) |
| Administrative & Support | 298 (65.8%) | 155 (34.2%) |
| Educational Services | 174 (28.2%) | 443 (71.8%) |
| Health Care & Social Assistance | 145 (22.5%) | 499 (77.5%) |
| Arts, Entertainment & Recreation | 27 (30.0%) | 63 (70.0%) |
| Accommodation & Food Services | 237 (31.6%) | 513 (68.4%) |
| Public Administration | 70 (38.5%) | 112 (61.5%) |
| Total | 3,600 (52.6%) | 3,249 (47.4%) |
Education in Rabun County
School Enrollment in Rabun County
The most common levels of schooling among the 2,659 students in Rabun County are elementary school (633 | 23.8%), high school (623 | 23.4%), and middle school (617 | 23.2%).
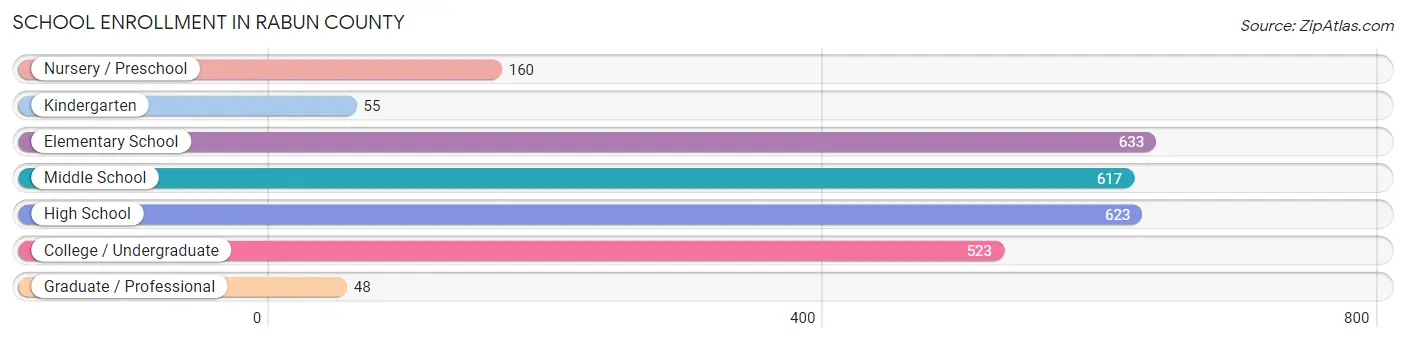
| School Level | # Students | % Students |
| Nursery / Preschool | 160 | 6.0% |
| Kindergarten | 55 | 2.1% |
| Elementary School | 633 | 23.8% |
| Middle School | 617 | 23.2% |
| High School | 623 | 23.4% |
| College / Undergraduate | 523 | 19.7% |
| Graduate / Professional | 48 | 1.8% |
| Total | 2,659 | 100.0% |
School Enrollment by Age by Funding Source in Rabun County
Out of a total of 2,659 students who are enrolled in schools in Rabun County, 428 (16.1%) attend a private institution, while the remaining 2,231 (83.9%) are enrolled in public schools. The age group of 25 to 34 year olds has the highest likelihood of being enrolled in private schools, with 141 (64.7% in the age bracket) enrolled. Conversely, the age group of 3 to 4 year olds has the lowest likelihood of being enrolled in a private school, with 108 (100.0% in the age bracket) attending a public institution.
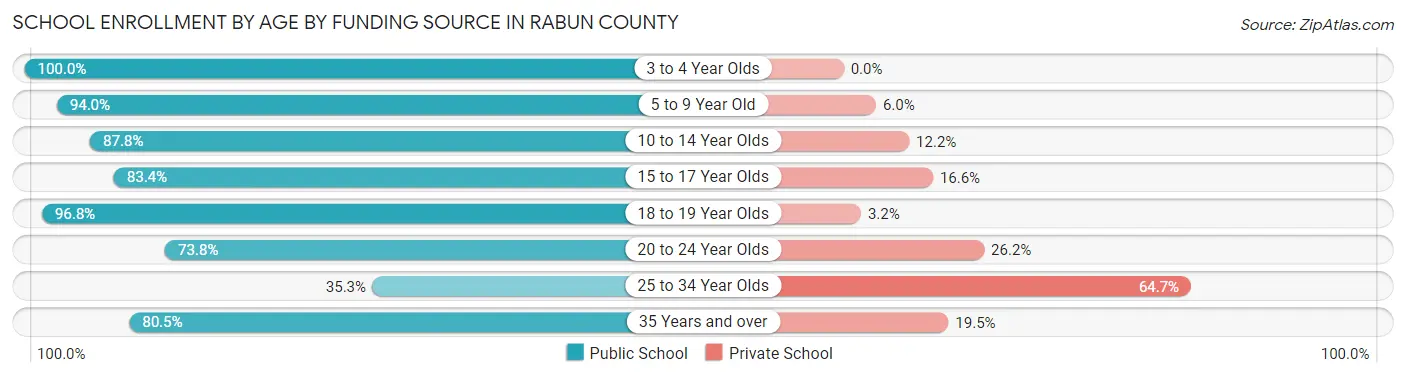
| Age Bracket | Public School | Private School |
| 3 to 4 Year Olds | 108 (100.0%) | 0 (0.0%) |
| 5 to 9 Year Old | 563 (94.0%) | 36 (6.0%) |
| 10 to 14 Year Olds | 698 (87.8%) | 97 (12.2%) |
| 15 to 17 Year Olds | 381 (83.4%) | 76 (16.6%) |
| 18 to 19 Year Olds | 180 (96.8%) | 6 (3.2%) |
| 20 to 24 Year Olds | 158 (73.8%) | 56 (26.2%) |
| 25 to 34 Year Olds | 77 (35.3%) | 141 (64.7%) |
| 35 Years and over | 66 (80.5%) | 16 (19.5%) |
| Total | 2,231 (83.9%) | 428 (16.1%) |
Educational Attainment by Field of Study in Rabun County
Business (981 | 24.4%), education (536 | 13.3%), science & technology (401 | 10.0%), social sciences (356 | 8.9%), and engineering (290 | 7.2%) are the most common fields of study among 4,017 individuals in Rabun County who have obtained a bachelor's degree or higher.
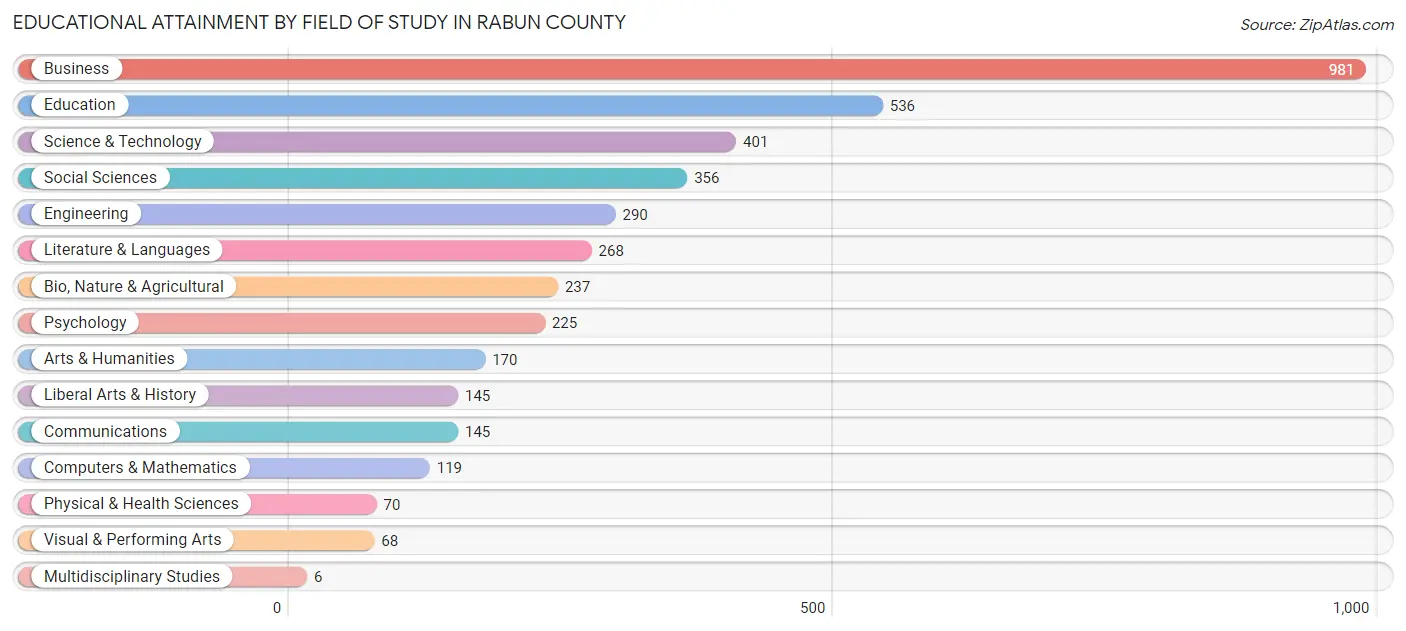
| Field of Study | # Graduates | % Graduates |
| Computers & Mathematics | 119 | 3.0% |
| Bio, Nature & Agricultural | 237 | 5.9% |
| Physical & Health Sciences | 70 | 1.7% |
| Psychology | 225 | 5.6% |
| Social Sciences | 356 | 8.9% |
| Engineering | 290 | 7.2% |
| Multidisciplinary Studies | 6 | 0.2% |
| Science & Technology | 401 | 10.0% |
| Business | 981 | 24.4% |
| Education | 536 | 13.3% |
| Literature & Languages | 268 | 6.7% |
| Liberal Arts & History | 145 | 3.6% |
| Visual & Performing Arts | 68 | 1.7% |
| Communications | 145 | 3.6% |
| Arts & Humanities | 170 | 4.2% |
| Total | 4,017 | 100.0% |
Transportation & Commute in Rabun County
Vehicle Availability by Sex in Rabun County
The most prevalent vehicle ownership categories in Rabun County are males with 2 vehicles (1,281, accounting for 36.0%) and females with 2 vehicles (1,163, making up 40.8%).
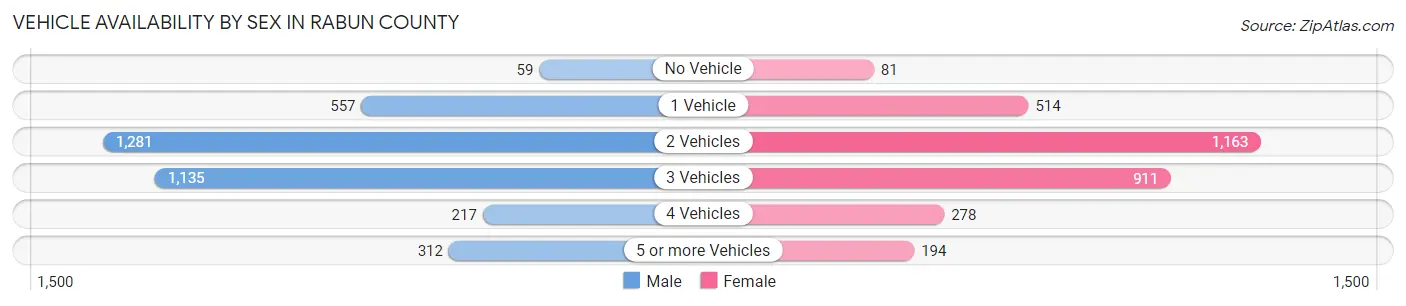
| Vehicles Available | Male | Female |
| No Vehicle | 59 (1.7%) | 81 (2.6%) |
| 1 Vehicle | 557 (15.6%) | 514 (16.4%) |
| 2 Vehicles | 1,281 (36.0%) | 1,163 (37.0%) |
| 3 Vehicles | 1,135 (31.9%) | 911 (29.0%) |
| 4 Vehicles | 217 (6.1%) | 278 (8.8%) |
| 5 or more Vehicles | 312 (8.8%) | 194 (6.2%) |
| Total | 3,561 (100.0%) | 3,141 (100.0%) |
Commute Time in Rabun County
The most frequently occuring commute durations in Rabun County are 10 to 14 minutes (1,065 commuters, 18.2%), 15 to 19 minutes (804 commuters, 13.8%), and 20 to 24 minutes (742 commuters, 12.7%).
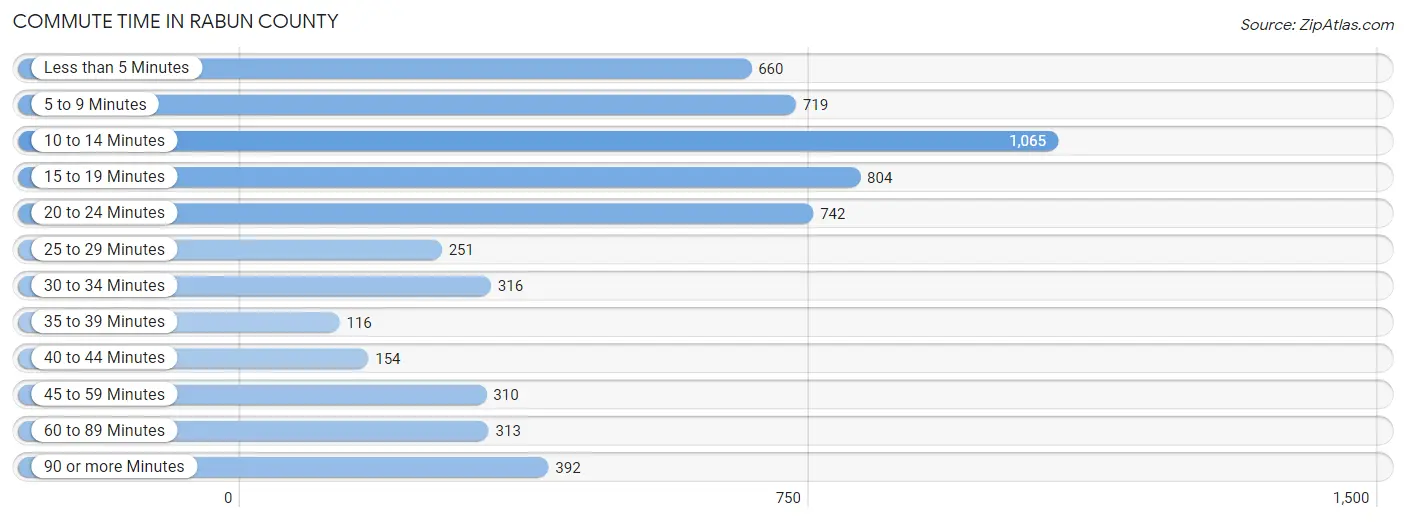
| Commute Time | # Commuters | % Commuters |
| Less than 5 Minutes | 660 | 11.3% |
| 5 to 9 Minutes | 719 | 12.3% |
| 10 to 14 Minutes | 1,065 | 18.2% |
| 15 to 19 Minutes | 804 | 13.8% |
| 20 to 24 Minutes | 742 | 12.7% |
| 25 to 29 Minutes | 251 | 4.3% |
| 30 to 34 Minutes | 316 | 5.4% |
| 35 to 39 Minutes | 116 | 2.0% |
| 40 to 44 Minutes | 154 | 2.6% |
| 45 to 59 Minutes | 310 | 5.3% |
| 60 to 89 Minutes | 313 | 5.4% |
| 90 or more Minutes | 392 | 6.7% |
Commute Time by Sex in Rabun County
The most common commute times in Rabun County are 10 to 14 minutes (544 commuters, 17.6%) for males and 10 to 14 minutes (521 commuters, 19.0%) for females.
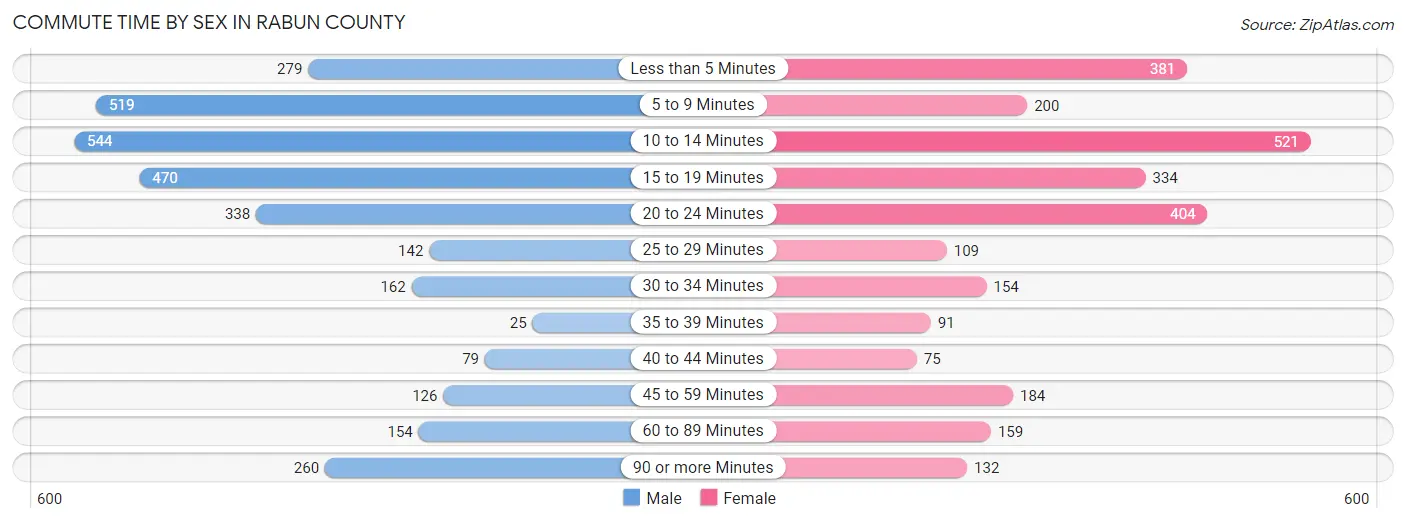
| Commute Time | Male | Female |
| Less than 5 Minutes | 279 (9.0%) | 381 (13.9%) |
| 5 to 9 Minutes | 519 (16.8%) | 200 (7.3%) |
| 10 to 14 Minutes | 544 (17.6%) | 521 (19.0%) |
| 15 to 19 Minutes | 470 (15.2%) | 334 (12.2%) |
| 20 to 24 Minutes | 338 (10.9%) | 404 (14.7%) |
| 25 to 29 Minutes | 142 (4.6%) | 109 (4.0%) |
| 30 to 34 Minutes | 162 (5.2%) | 154 (5.6%) |
| 35 to 39 Minutes | 25 (0.8%) | 91 (3.3%) |
| 40 to 44 Minutes | 79 (2.5%) | 75 (2.7%) |
| 45 to 59 Minutes | 126 (4.1%) | 184 (6.7%) |
| 60 to 89 Minutes | 154 (5.0%) | 159 (5.8%) |
| 90 or more Minutes | 260 (8.4%) | 132 (4.8%) |
Time of Departure to Work by Sex in Rabun County
The most frequent times of departure to work in Rabun County are 7:00 AM to 7:29 AM (505, 16.3%) for males and 7:30 AM to 7:59 AM (422, 15.4%) for females.
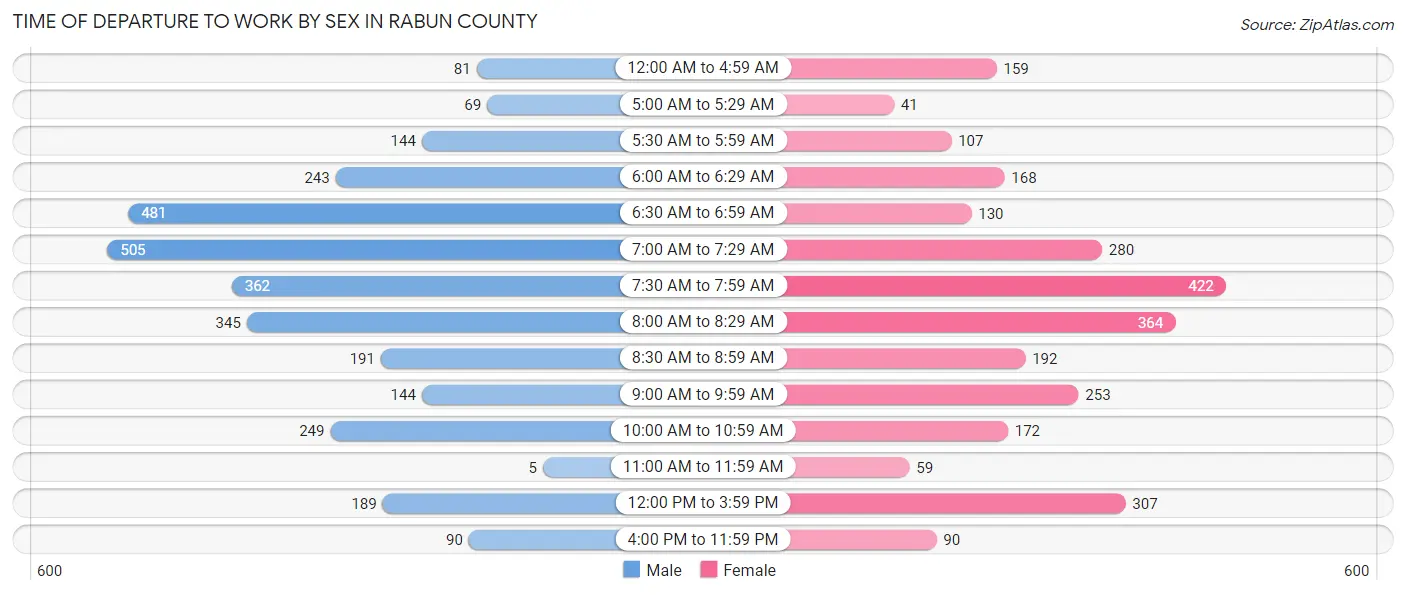
| Time of Departure | Male | Female |
| 12:00 AM to 4:59 AM | 81 (2.6%) | 159 (5.8%) |
| 5:00 AM to 5:29 AM | 69 (2.2%) | 41 (1.5%) |
| 5:30 AM to 5:59 AM | 144 (4.6%) | 107 (3.9%) |
| 6:00 AM to 6:29 AM | 243 (7.8%) | 168 (6.1%) |
| 6:30 AM to 6:59 AM | 481 (15.5%) | 130 (4.7%) |
| 7:00 AM to 7:29 AM | 505 (16.3%) | 280 (10.2%) |
| 7:30 AM to 7:59 AM | 362 (11.7%) | 422 (15.4%) |
| 8:00 AM to 8:29 AM | 345 (11.1%) | 364 (13.3%) |
| 8:30 AM to 8:59 AM | 191 (6.2%) | 192 (7.0%) |
| 9:00 AM to 9:59 AM | 144 (4.6%) | 253 (9.2%) |
| 10:00 AM to 10:59 AM | 249 (8.0%) | 172 (6.3%) |
| 11:00 AM to 11:59 AM | 5 (0.2%) | 59 (2.1%) |
| 12:00 PM to 3:59 PM | 189 (6.1%) | 307 (11.2%) |
| 4:00 PM to 11:59 PM | 90 (2.9%) | 90 (3.3%) |
| Total | 3,098 (100.0%) | 2,744 (100.0%) |
Housing Occupancy in Rabun County
Occupancy by Ownership in Rabun County
Of the total 7,020 dwellings in Rabun County, owner-occupied units account for 5,385 (76.7%), while renter-occupied units make up 1,635 (23.3%).
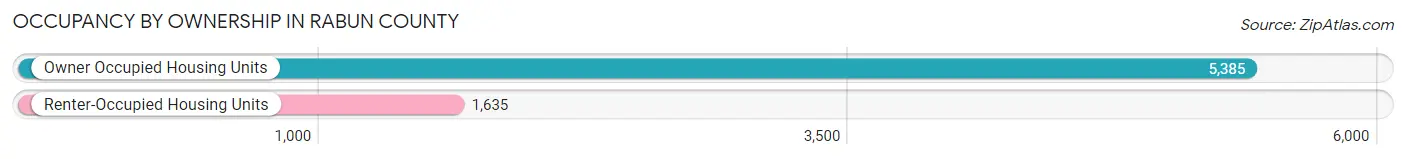
| Occupancy | # Housing Units | % Housing Units |
| Owner Occupied Housing Units | 5,385 | 76.7% |
| Renter-Occupied Housing Units | 1,635 | 23.3% |
| Total Occupied Housing Units | 7,020 | 100.0% |
Occupancy by Household Size in Rabun County
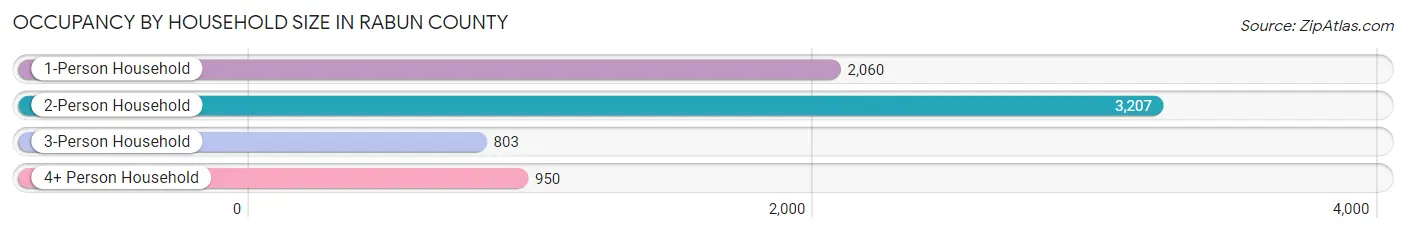
| Household Size | # Housing Units | % Housing Units |
| 1-Person Household | 2,060 | 29.3% |
| 2-Person Household | 3,207 | 45.7% |
| 3-Person Household | 803 | 11.4% |
| 4+ Person Household | 950 | 13.5% |
| Total Housing Units | 7,020 | 100.0% |
Occupancy by Ownership by Household Size in Rabun County
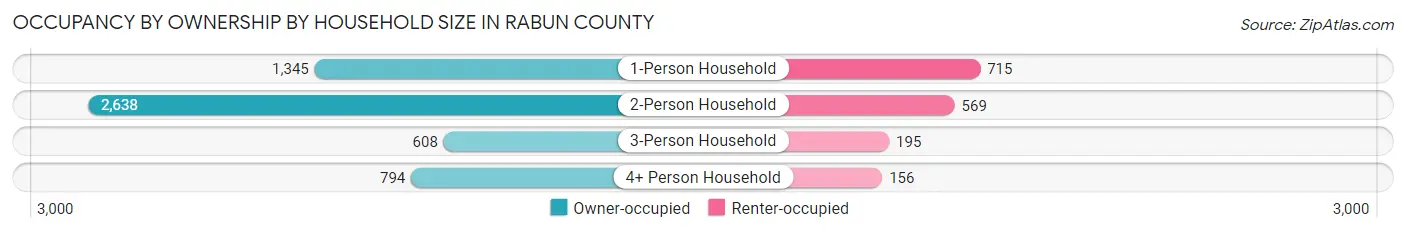
| Household Size | Owner-occupied | Renter-occupied |
| 1-Person Household | 1,345 (65.3%) | 715 (34.7%) |
| 2-Person Household | 2,638 (82.3%) | 569 (17.7%) |
| 3-Person Household | 608 (75.7%) | 195 (24.3%) |
| 4+ Person Household | 794 (83.6%) | 156 (16.4%) |
| Total Housing Units | 5,385 (76.7%) | 1,635 (23.3%) |
Occupancy by Educational Attainment in Rabun County
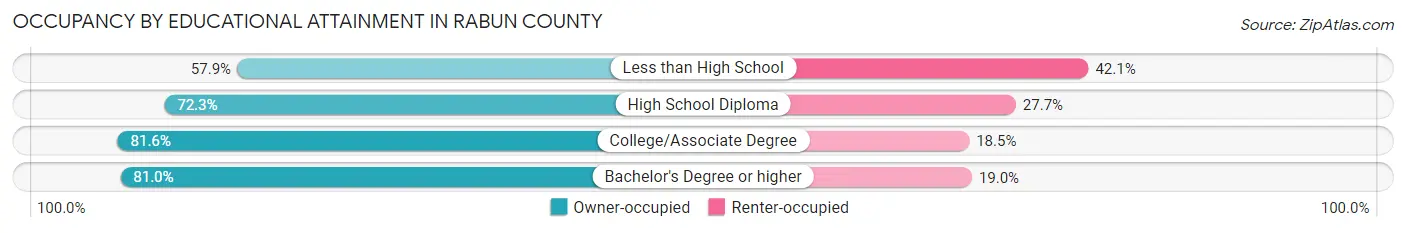
| Household Size | Owner-occupied | Renter-occupied |
| Less than High School | 399 (57.9%) | 290 (42.1%) |
| High School Diploma | 1,286 (72.3%) | 493 (27.7%) |
| College/Associate Degree | 1,900 (81.6%) | 430 (18.4%) |
| Bachelor's Degree or higher | 1,800 (81.0%) | 422 (19.0%) |
Occupancy by Age of Householder in Rabun County
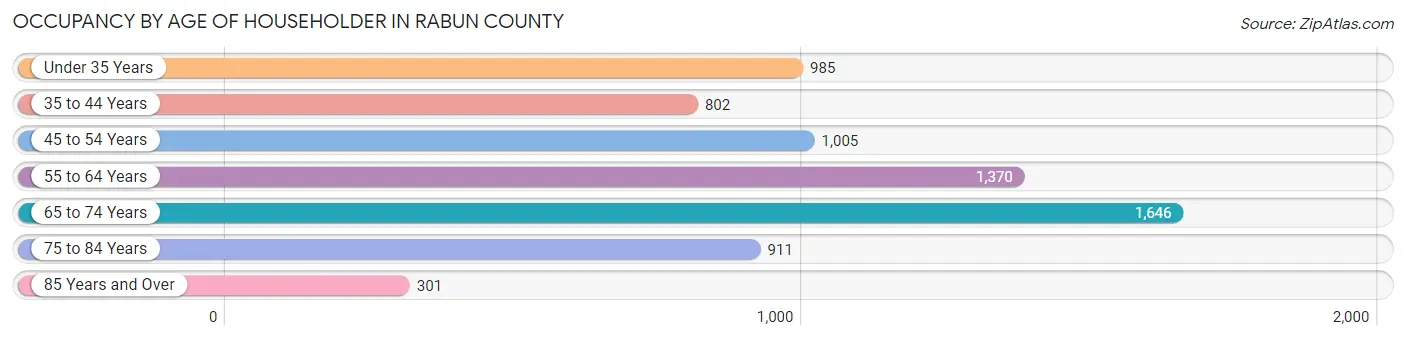
| Age Bracket | # Households | % Households |
| Under 35 Years | 985 | 14.0% |
| 35 to 44 Years | 802 | 11.4% |
| 45 to 54 Years | 1,005 | 14.3% |
| 55 to 64 Years | 1,370 | 19.5% |
| 65 to 74 Years | 1,646 | 23.4% |
| 75 to 84 Years | 911 | 13.0% |
| 85 Years and Over | 301 | 4.3% |
| Total | 7,020 | 100.0% |
Housing Finances in Rabun County
Median Income by Occupancy in Rabun County
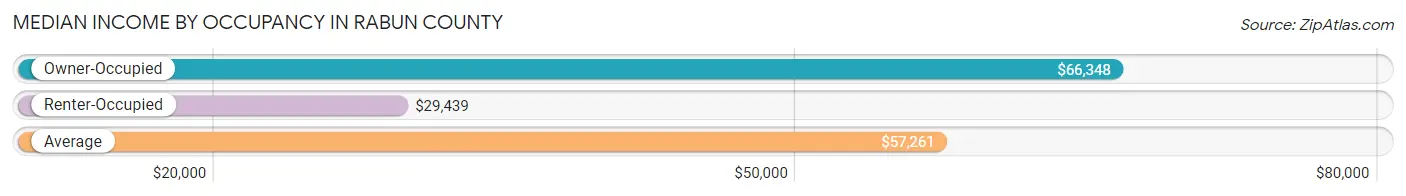
| Occupancy Type | # Households | Median Income |
| Owner-Occupied | 5,385 (76.7%) | $66,348 |
| Renter-Occupied | 1,635 (23.3%) | $29,439 |
| Average | 7,020 (100.0%) | $57,261 |
Occupancy by Householder Income Bracket in Rabun County
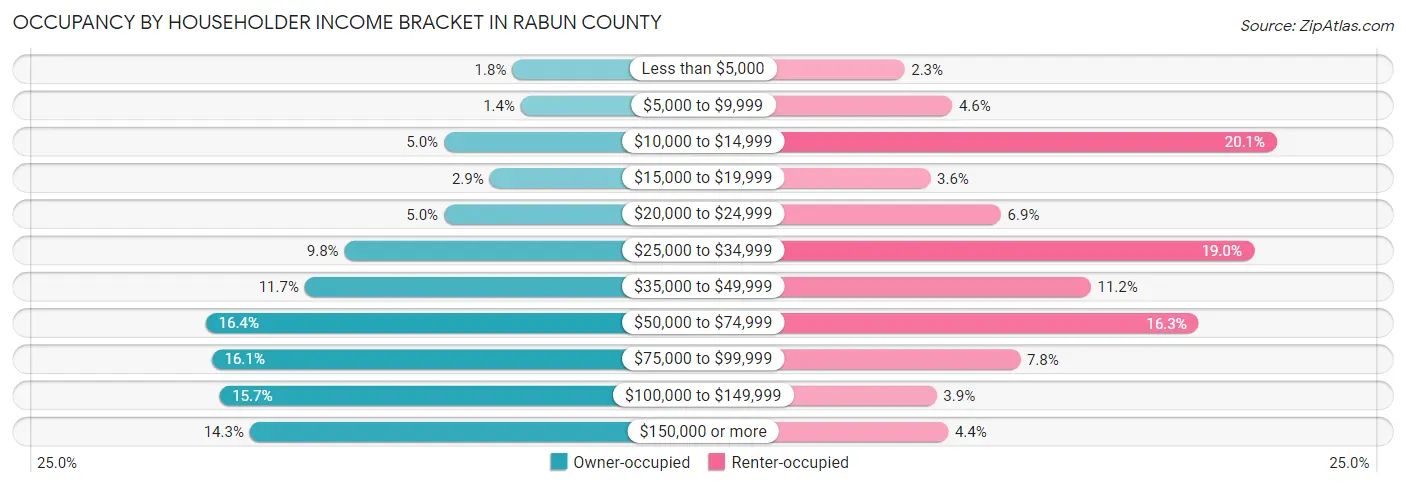
| Income Bracket | Owner-occupied | Renter-occupied |
| Less than $5,000 | 96 (1.8%) | 38 (2.3%) |
| $5,000 to $9,999 | 74 (1.4%) | 75 (4.6%) |
| $10,000 to $14,999 | 271 (5.0%) | 328 (20.1%) |
| $15,000 to $19,999 | 154 (2.9%) | 58 (3.5%) |
| $20,000 to $24,999 | 271 (5.0%) | 113 (6.9%) |
| $25,000 to $34,999 | 526 (9.8%) | 310 (19.0%) |
| $35,000 to $49,999 | 628 (11.7%) | 183 (11.2%) |
| $50,000 to $74,999 | 882 (16.4%) | 267 (16.3%) |
| $75,000 to $99,999 | 867 (16.1%) | 128 (7.8%) |
| $100,000 to $149,999 | 847 (15.7%) | 63 (3.8%) |
| $150,000 or more | 769 (14.3%) | 72 (4.4%) |
| Total | 5,385 (100.0%) | 1,635 (100.0%) |
Monthly Housing Cost Tiers in Rabun County
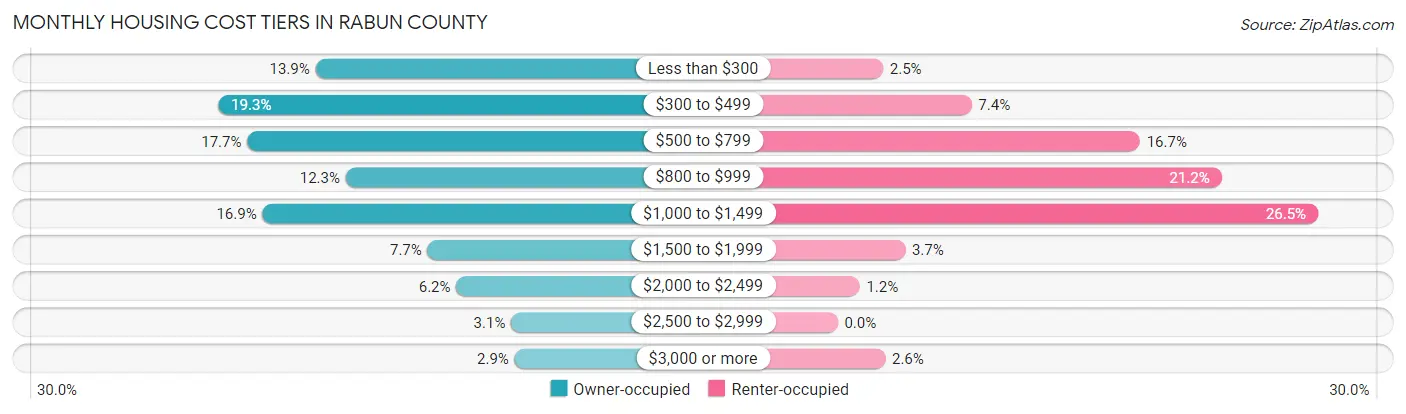
| Monthly Cost | Owner-occupied | Renter-occupied |
| Less than $300 | 750 (13.9%) | 41 (2.5%) |
| $300 to $499 | 1,040 (19.3%) | 121 (7.4%) |
| $500 to $799 | 953 (17.7%) | 273 (16.7%) |
| $800 to $999 | 660 (12.3%) | 347 (21.2%) |
| $1,000 to $1,499 | 908 (16.9%) | 434 (26.5%) |
| $1,500 to $1,999 | 417 (7.7%) | 61 (3.7%) |
| $2,000 to $2,499 | 331 (6.1%) | 20 (1.2%) |
| $2,500 to $2,999 | 168 (3.1%) | 0 (0.0%) |
| $3,000 or more | 158 (2.9%) | 43 (2.6%) |
| Total | 5,385 (100.0%) | 1,635 (100.0%) |
Physical Housing Characteristics in Rabun County
Housing Structures in Rabun County
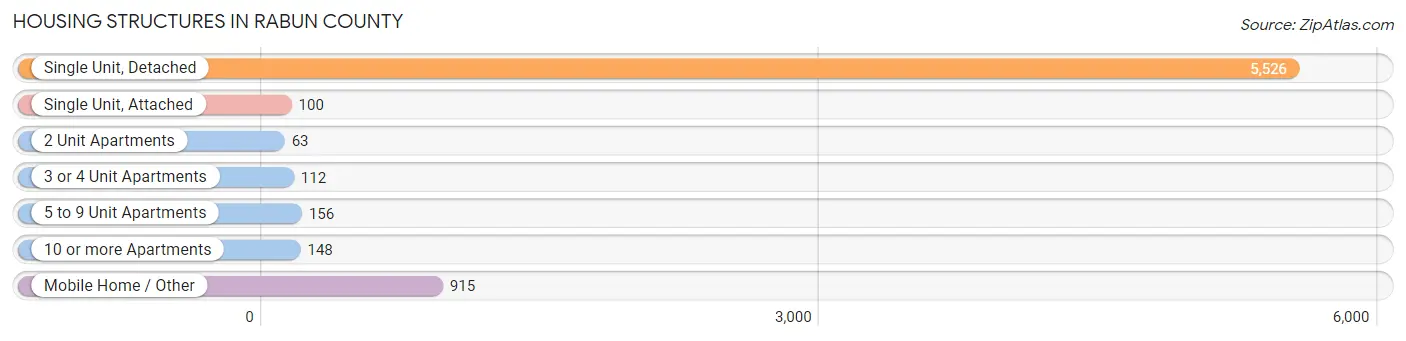
| Structure Type | # Housing Units | % Housing Units |
| Single Unit, Detached | 5,526 | 78.7% |
| Single Unit, Attached | 100 | 1.4% |
| 2 Unit Apartments | 63 | 0.9% |
| 3 or 4 Unit Apartments | 112 | 1.6% |
| 5 to 9 Unit Apartments | 156 | 2.2% |
| 10 or more Apartments | 148 | 2.1% |
| Mobile Home / Other | 915 | 13.0% |
| Total | 7,020 | 100.0% |
Housing Structures by Occupancy in Rabun County
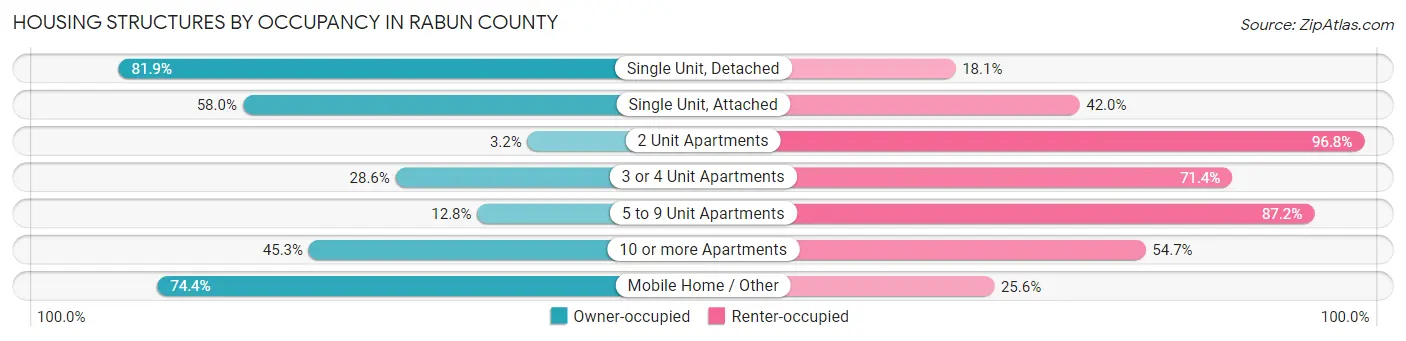
| Structure Type | Owner-occupied | Renter-occupied |
| Single Unit, Detached | 4,525 (81.9%) | 1,001 (18.1%) |
| Single Unit, Attached | 58 (58.0%) | 42 (42.0%) |
| 2 Unit Apartments | 2 (3.2%) | 61 (96.8%) |
| 3 or 4 Unit Apartments | 32 (28.6%) | 80 (71.4%) |
| 5 to 9 Unit Apartments | 20 (12.8%) | 136 (87.2%) |
| 10 or more Apartments | 67 (45.3%) | 81 (54.7%) |
| Mobile Home / Other | 681 (74.4%) | 234 (25.6%) |
| Total | 5,385 (76.7%) | 1,635 (23.3%) |
Housing Structures by Number of Rooms in Rabun County
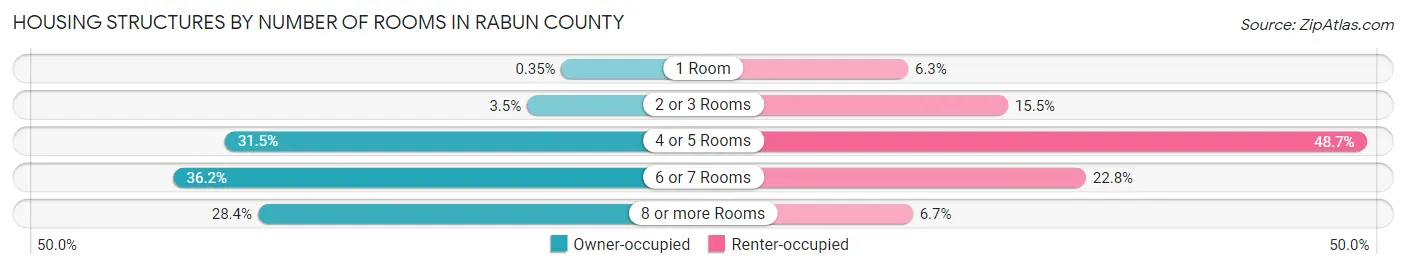
| Number of Rooms | Owner-occupied | Renter-occupied |
| 1 Room | 19 (0.4%) | 103 (6.3%) |
| 2 or 3 Rooms | 190 (3.5%) | 254 (15.5%) |
| 4 or 5 Rooms | 1,695 (31.5%) | 796 (48.7%) |
| 6 or 7 Rooms | 1,950 (36.2%) | 372 (22.8%) |
| 8 or more Rooms | 1,531 (28.4%) | 110 (6.7%) |
| Total | 5,385 (100.0%) | 1,635 (100.0%) |
Housing Structure by Heating Type in Rabun County
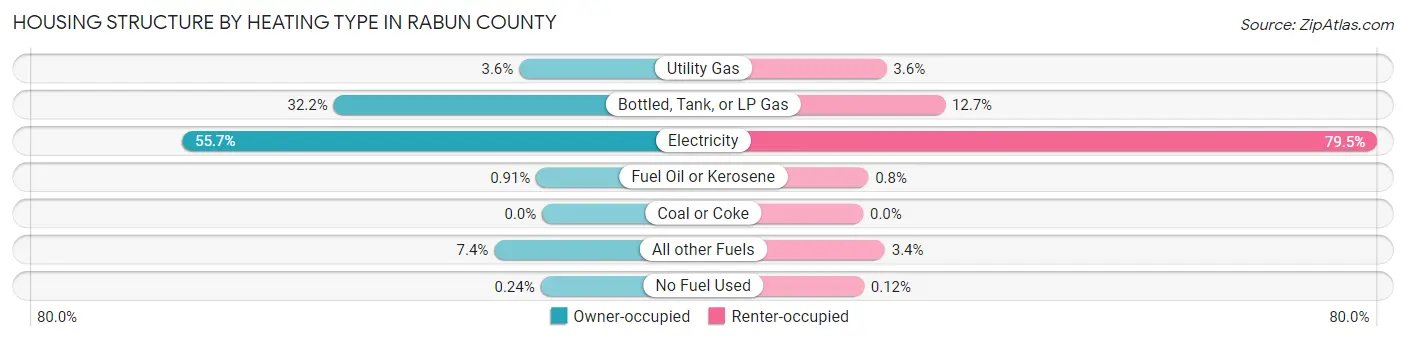
| Heating Type | Owner-occupied | Renter-occupied |
| Utility Gas | 191 (3.5%) | 59 (3.6%) |
| Bottled, Tank, or LP Gas | 1,736 (32.2%) | 207 (12.7%) |
| Electricity | 2,997 (55.6%) | 1,299 (79.4%) |
| Fuel Oil or Kerosene | 49 (0.9%) | 13 (0.8%) |
| Coal or Coke | 0 (0.0%) | 0 (0.0%) |
| All other Fuels | 399 (7.4%) | 55 (3.4%) |
| No Fuel Used | 13 (0.2%) | 2 (0.1%) |
| Total | 5,385 (100.0%) | 1,635 (100.0%) |
Household Vehicle Usage in Rabun County
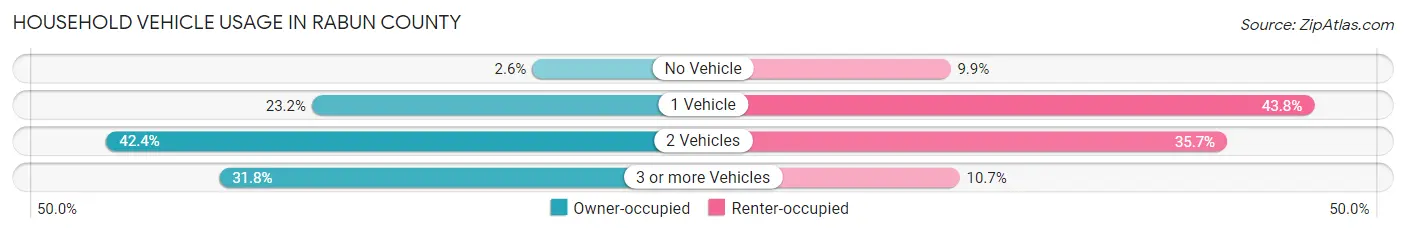
| Vehicles per Household | Owner-occupied | Renter-occupied |
| No Vehicle | 141 (2.6%) | 161 (9.9%) |
| 1 Vehicle | 1,249 (23.2%) | 716 (43.8%) |
| 2 Vehicles | 2,281 (42.4%) | 583 (35.7%) |
| 3 or more Vehicles | 1,714 (31.8%) | 175 (10.7%) |
| Total | 5,385 (100.0%) | 1,635 (100.0%) |
Real Estate & Mortgages in Rabun County
Real Estate and Mortgage Overview in Rabun County
| Characteristic | Without Mortgage | With Mortgage |
| Housing Units | 2,903 | 2,482 |
| Median Property Value | $222,900 | $252,600 |
| Median Household Income | $59,577 | $406 |
| Monthly Housing Costs | $432 | $158 |
| Real Estate Taxes | $1,178 | $28 |
Property Value by Mortgage Status in Rabun County
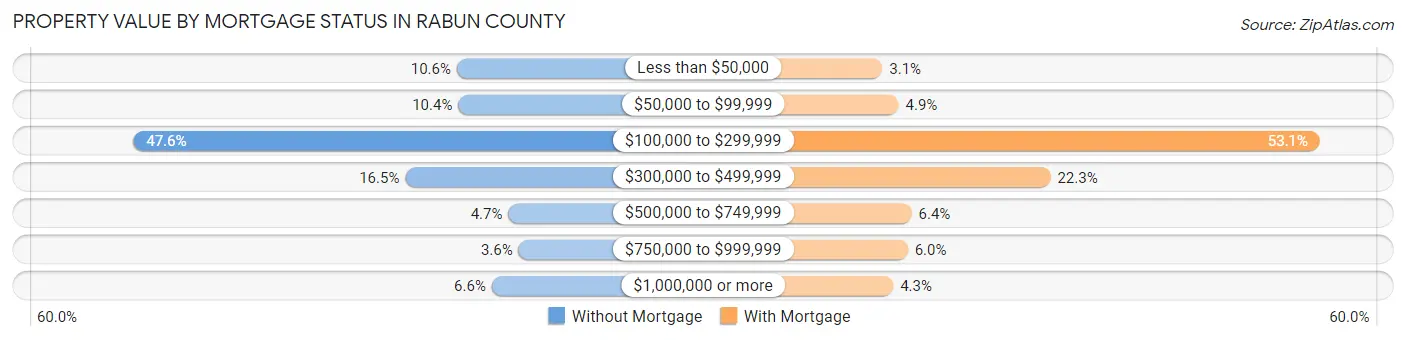
| Property Value | Without Mortgage | With Mortgage |
| Less than $50,000 | 308 (10.6%) | 76 (3.1%) |
| $50,000 to $99,999 | 303 (10.4%) | 122 (4.9%) |
| $100,000 to $299,999 | 1,381 (47.6%) | 1,317 (53.1%) |
| $300,000 to $499,999 | 479 (16.5%) | 553 (22.3%) |
| $500,000 to $749,999 | 137 (4.7%) | 159 (6.4%) |
| $750,000 to $999,999 | 103 (3.5%) | 148 (6.0%) |
| $1,000,000 or more | 192 (6.6%) | 107 (4.3%) |
| Total | 2,903 (100.0%) | 2,482 (100.0%) |
Household Income by Mortgage Status in Rabun County
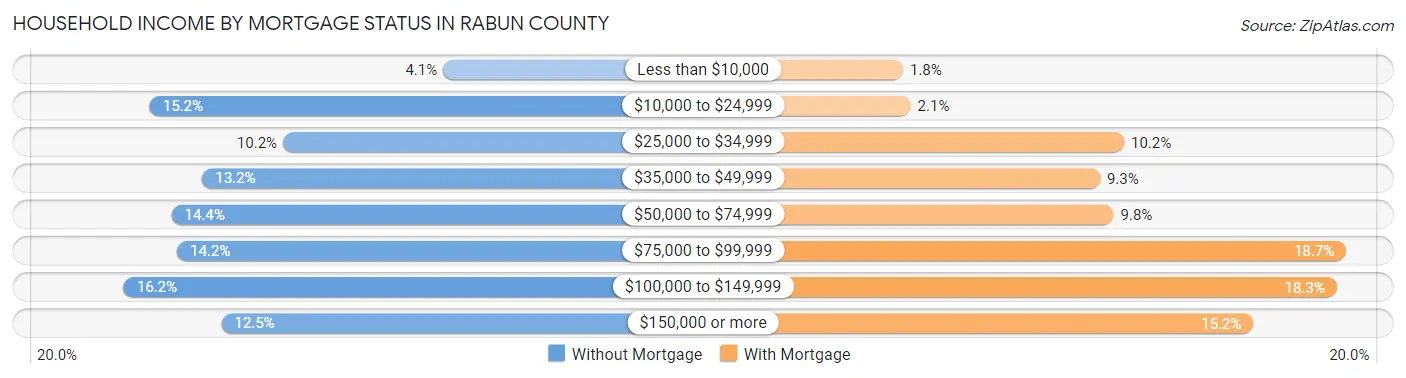
| Household Income | Without Mortgage | With Mortgage |
| Less than $10,000 | 118 (4.1%) | 45 (1.8%) |
| $10,000 to $24,999 | 442 (15.2%) | 52 (2.1%) |
| $25,000 to $34,999 | 295 (10.2%) | 254 (10.2%) |
| $35,000 to $49,999 | 384 (13.2%) | 231 (9.3%) |
| $50,000 to $74,999 | 418 (14.4%) | 244 (9.8%) |
| $75,000 to $99,999 | 412 (14.2%) | 464 (18.7%) |
| $100,000 to $149,999 | 471 (16.2%) | 455 (18.3%) |
| $150,000 or more | 363 (12.5%) | 376 (15.1%) |
| Total | 2,903 (100.0%) | 2,482 (100.0%) |
Property Value to Household Income Ratio in Rabun County
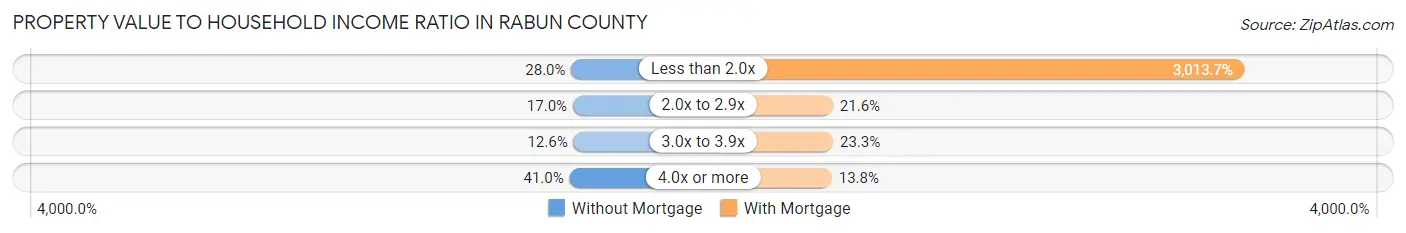
| Value-to-Income Ratio | Without Mortgage | With Mortgage |
| Less than 2.0x | 812 (28.0%) | 74,800 (3,013.7%) |
| 2.0x to 2.9x | 492 (17.0%) | 537 (21.6%) |
| 3.0x to 3.9x | 365 (12.6%) | 579 (23.3%) |
| 4.0x or more | 1,191 (41.0%) | 343 (13.8%) |
| Total | 2,903 (100.0%) | 2,482 (100.0%) |
Real Estate Taxes by Mortgage Status in Rabun County
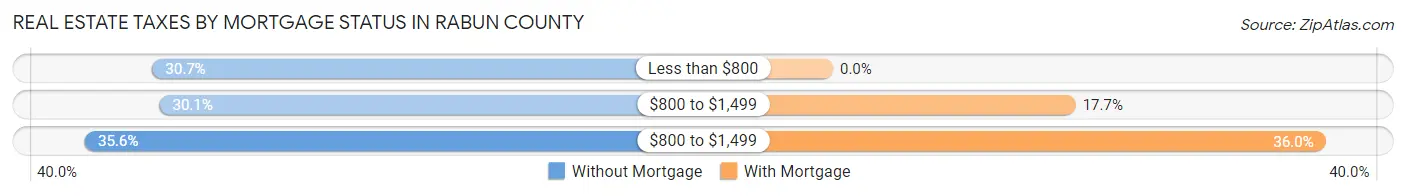
| Property Taxes | Without Mortgage | With Mortgage |
| Less than $800 | 890 (30.7%) | 0 (0.0%) |
| $800 to $1,499 | 875 (30.1%) | 440 (17.7%) |
| $800 to $1,499 | 1,033 (35.6%) | 893 (36.0%) |
| Total | 2,903 (100.0%) | 2,482 (100.0%) |
Health & Disability in Rabun County
Health Insurance Coverage by Age in Rabun County
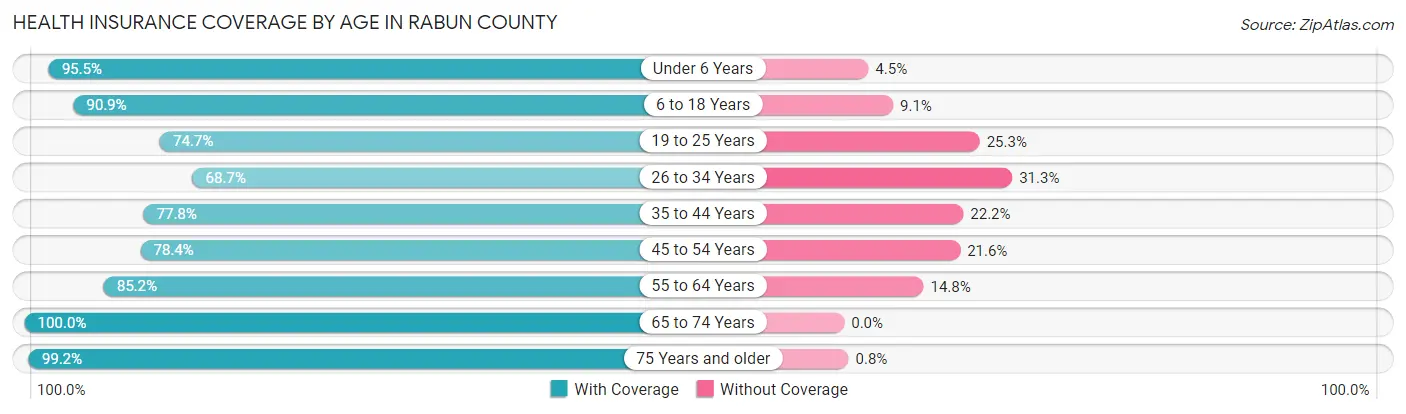
| Age Bracket | With Coverage | Without Coverage |
| Under 6 Years | 786 (95.5%) | 37 (4.5%) |
| 6 to 18 Years | 1,768 (90.9%) | 177 (9.1%) |
| 19 to 25 Years | 870 (74.7%) | 294 (25.3%) |
| 26 to 34 Years | 1,182 (68.7%) | 539 (31.3%) |
| 35 to 44 Years | 1,318 (77.8%) | 376 (22.2%) |
| 45 to 54 Years | 1,643 (78.4%) | 453 (21.6%) |
| 55 to 64 Years | 2,196 (85.2%) | 381 (14.8%) |
| 65 to 74 Years | 2,781 (100.0%) | 0 (0.0%) |
| 75 Years and older | 1,867 (99.2%) | 15 (0.8%) |
| Total | 14,411 (86.4%) | 2,272 (13.6%) |
Health Insurance Coverage by Citizenship Status in Rabun County
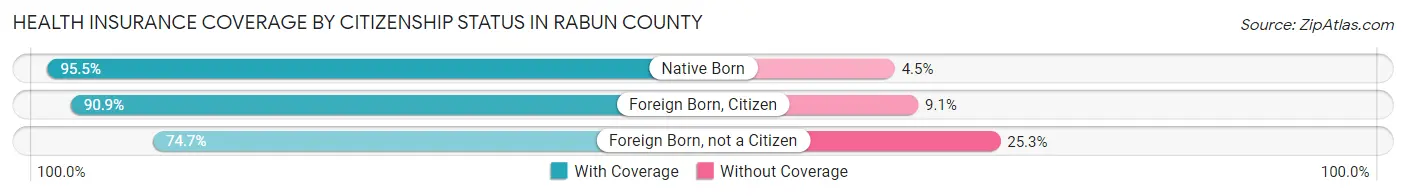
| Citizenship Status | With Coverage | Without Coverage |
| Native Born | 786 (95.5%) | 37 (4.5%) |
| Foreign Born, Citizen | 1,768 (90.9%) | 177 (9.1%) |
| Foreign Born, not a Citizen | 870 (74.7%) | 294 (25.3%) |
Health Insurance Coverage by Household Income in Rabun County
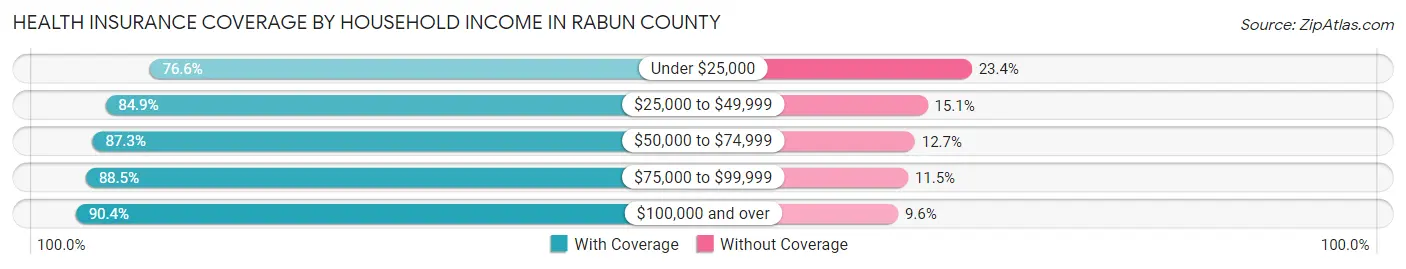
| Household Income | With Coverage | Without Coverage |
| Under $25,000 | 1,758 (76.6%) | 537 (23.4%) |
| $25,000 to $49,999 | 3,012 (84.9%) | 537 (15.1%) |
| $50,000 to $74,999 | 2,541 (87.3%) | 371 (12.7%) |
| $75,000 to $99,999 | 2,311 (88.5%) | 299 (11.5%) |
| $100,000 and over | 4,646 (90.4%) | 492 (9.6%) |
Public vs Private Health Insurance Coverage by Age in Rabun County
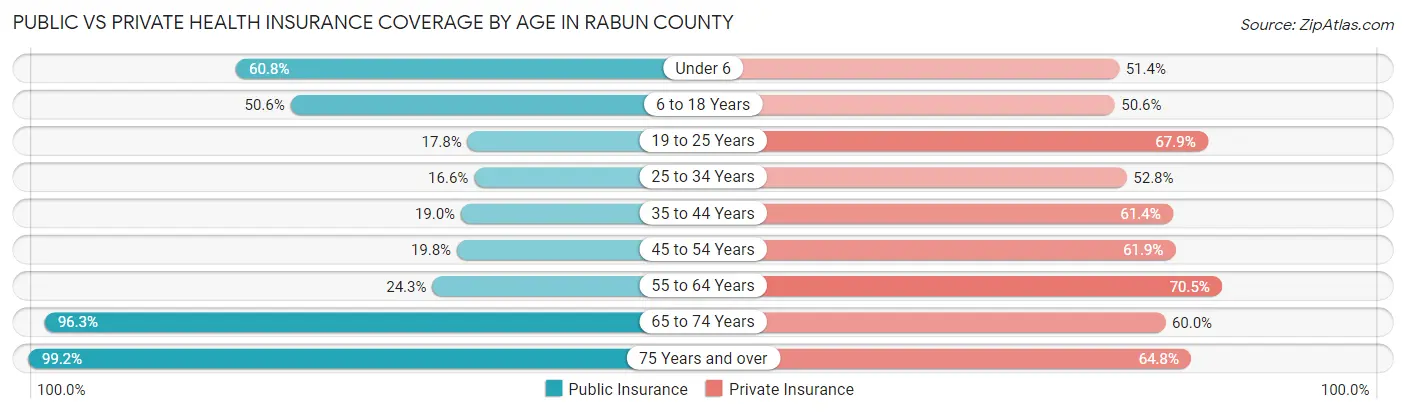
| Age Bracket | Public Insurance | Private Insurance |
| Under 6 | 500 (60.8%) | 423 (51.4%) |
| 6 to 18 Years | 985 (50.6%) | 984 (50.6%) |
| 19 to 25 Years | 207 (17.8%) | 790 (67.9%) |
| 25 to 34 Years | 285 (16.6%) | 909 (52.8%) |
| 35 to 44 Years | 322 (19.0%) | 1,040 (61.4%) |
| 45 to 54 Years | 414 (19.8%) | 1,297 (61.9%) |
| 55 to 64 Years | 627 (24.3%) | 1,817 (70.5%) |
| 65 to 74 Years | 2,677 (96.3%) | 1,668 (60.0%) |
| 75 Years and over | 1,867 (99.2%) | 1,219 (64.8%) |
| Total | 7,884 (47.3%) | 10,147 (60.8%) |
Disability Status by Sex by Age in Rabun County
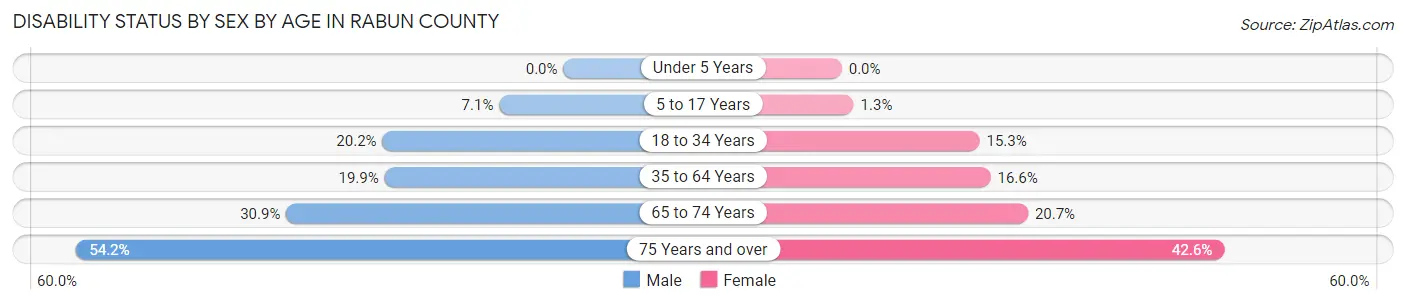
| Age Bracket | Male | Female |
| Under 5 Years | 0 (0.0%) | 0 (0.0%) |
| 5 to 17 Years | 70 (7.1%) | 12 (1.3%) |
| 18 to 34 Years | 299 (20.2%) | 237 (15.3%) |
| 35 to 64 Years | 614 (19.9%) | 544 (16.6%) |
| 65 to 74 Years | 416 (30.9%) | 297 (20.7%) |
| 75 Years and over | 487 (54.2%) | 419 (42.6%) |
Disability Class by Sex by Age in Rabun County
Disability Class: Hearing Difficulty
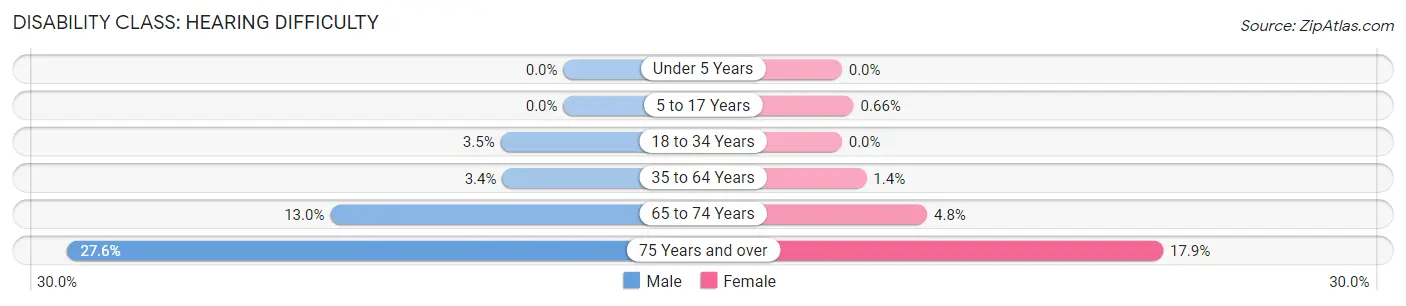
| Age Bracket | Male | Female |
| Under 5 Years | 0 (0.0%) | 0 (0.0%) |
| 5 to 17 Years | 0 (0.0%) | 6 (0.7%) |
| 18 to 34 Years | 52 (3.5%) | 0 (0.0%) |
| 35 to 64 Years | 105 (3.4%) | 45 (1.4%) |
| 65 to 74 Years | 175 (13.0%) | 68 (4.8%) |
| 75 Years and over | 248 (27.6%) | 176 (17.9%) |
Disability Class: Vision Difficulty
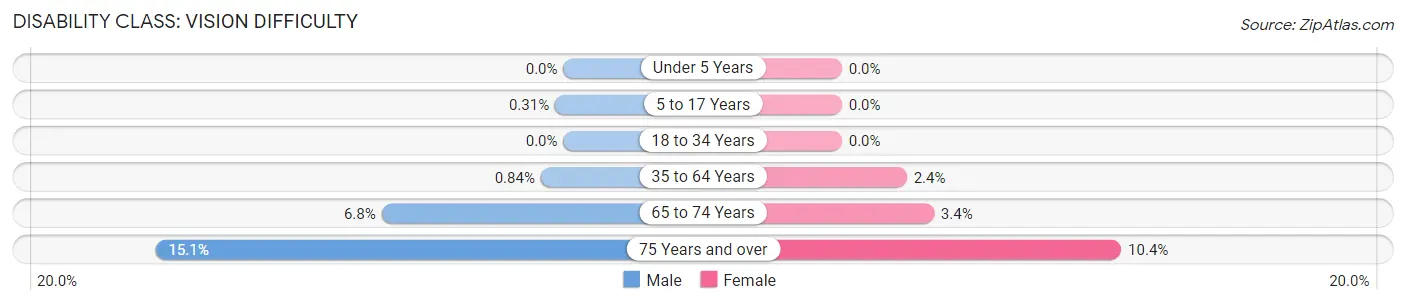
| Age Bracket | Male | Female |
| Under 5 Years | 0 (0.0%) | 0 (0.0%) |
| 5 to 17 Years | 3 (0.3%) | 0 (0.0%) |
| 18 to 34 Years | 0 (0.0%) | 0 (0.0%) |
| 35 to 64 Years | 26 (0.8%) | 79 (2.4%) |
| 65 to 74 Years | 91 (6.8%) | 49 (3.4%) |
| 75 Years and over | 136 (15.1%) | 102 (10.4%) |
Disability Class: Cognitive Difficulty
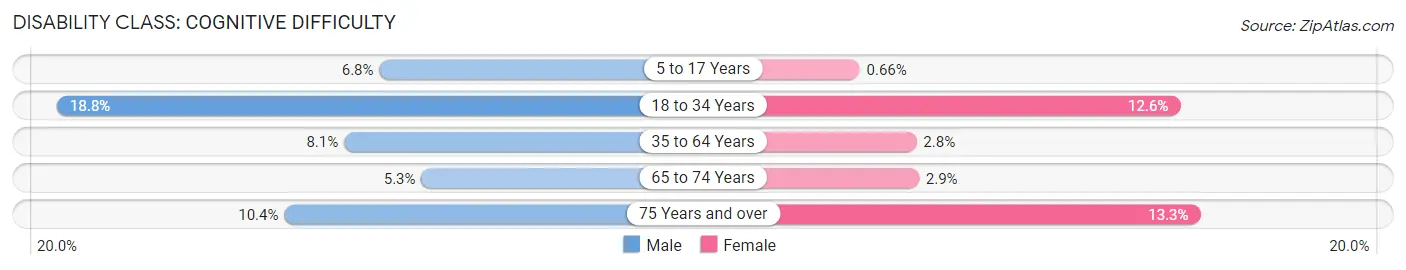
| Age Bracket | Male | Female |
| 5 to 17 Years | 67 (6.8%) | 6 (0.7%) |
| 18 to 34 Years | 279 (18.8%) | 194 (12.6%) |
| 35 to 64 Years | 251 (8.1%) | 91 (2.8%) |
| 65 to 74 Years | 71 (5.3%) | 41 (2.9%) |
| 75 Years and over | 93 (10.4%) | 131 (13.3%) |
Disability Class: Ambulatory Difficulty
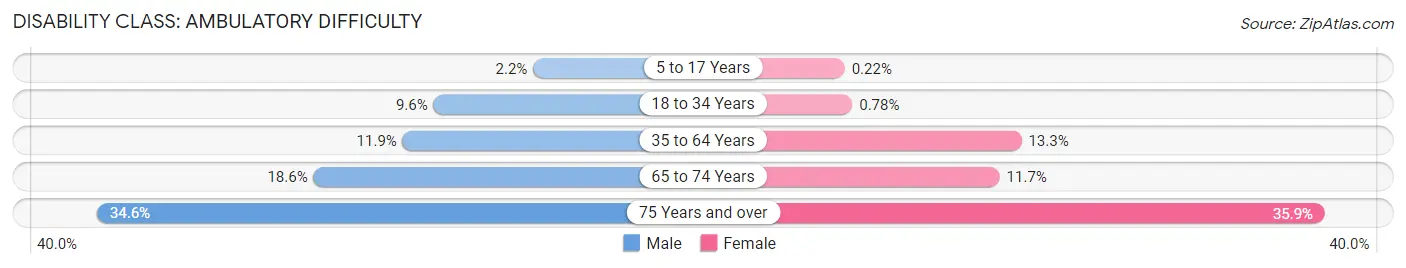
| Age Bracket | Male | Female |
| 5 to 17 Years | 22 (2.2%) | 2 (0.2%) |
| 18 to 34 Years | 143 (9.6%) | 12 (0.8%) |
| 35 to 64 Years | 368 (11.9%) | 438 (13.3%) |
| 65 to 74 Years | 250 (18.5%) | 168 (11.7%) |
| 75 Years and over | 311 (34.6%) | 353 (35.9%) |
Disability Class: Self-Care Difficulty
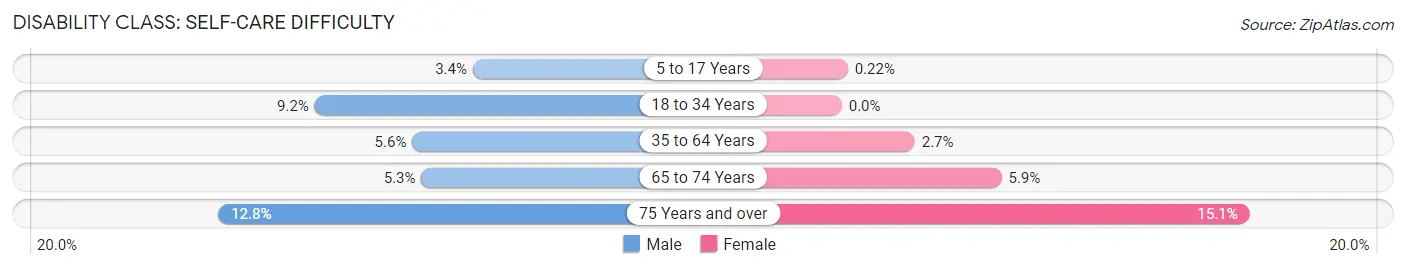
| Age Bracket | Male | Female |
| 5 to 17 Years | 33 (3.4%) | 2 (0.2%) |
| 18 to 34 Years | 137 (9.2%) | 0 (0.0%) |
| 35 to 64 Years | 173 (5.6%) | 89 (2.7%) |
| 65 to 74 Years | 71 (5.3%) | 85 (5.9%) |
| 75 Years and over | 115 (12.8%) | 149 (15.1%) |
Technology Access in Rabun County
Computing Device Access in Rabun County
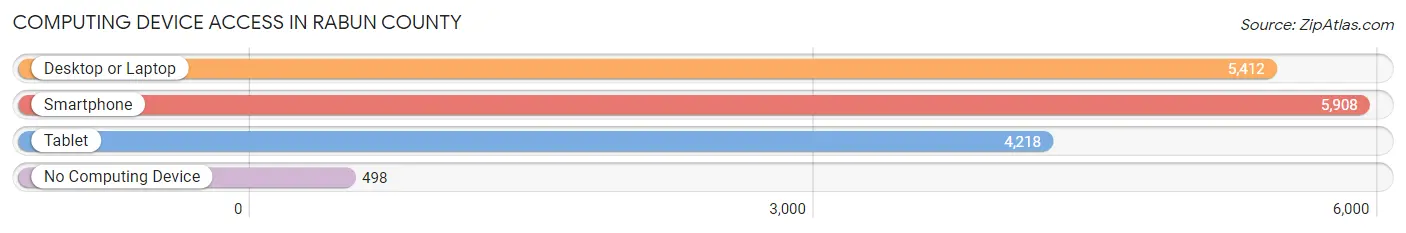
| Device Type | # Households | % Households |
| Desktop or Laptop | 5,412 | 77.1% |
| Smartphone | 5,908 | 84.2% |
| Tablet | 4,218 | 60.1% |
| No Computing Device | 498 | 7.1% |
| Total | 7,020 | 100.0% |
Internet Access in Rabun County
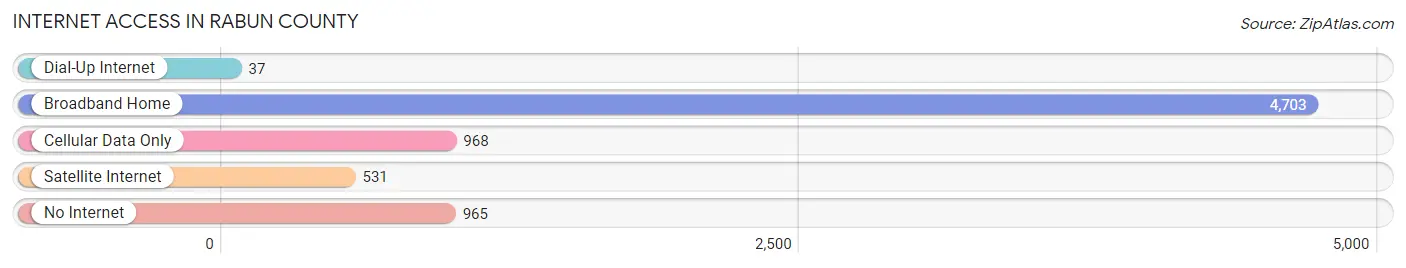
| Internet Type | # Households | % Households |
| Dial-Up Internet | 37 | 0.5% |
| Broadband Home | 4,703 | 67.0% |
| Cellular Data Only | 968 | 13.8% |
| Satellite Internet | 531 | 7.6% |
| No Internet | 965 | 13.8% |
| Total | 7,020 | 100.0% |
Rabun County Summary
Rabun County is located in the northeastern corner of the state of Georgia, and is part of the Blue Ridge Mountains. It is bordered by North Carolina to the north, South Carolina to the east, Habersham County to the south, and Towns County to the west. Rabun County is the second smallest county in Georgia, with an area of just 151 square miles.
History
Rabun County was created in 1819 from parts of Habersham and Cherokee counties. It was named for William Rabun, the Governor of Georgia from 1817 to 1819. The county seat is Clayton, which was established in 1823.
Rabun County was home to the Cherokee Nation prior to the Trail of Tears in the 1830s. The county was also home to the first gold rush in the United States, which began in 1828. The gold rush brought many settlers to the area, and the county grew rapidly.
In the late 19th century, Rabun County was a popular tourist destination, due to its scenic beauty and mild climate. The county was home to several resorts, including the famous Sky Valley Resort, which opened in the 1920s.
Geography
Rabun County is located in the Blue Ridge Mountains of northern Georgia. The county is mostly mountainous, with elevations ranging from 1,000 to 4,000 feet. The highest point in the county is Rabun Bald, which has an elevation of 4,696 feet.
The county is home to several rivers and streams, including the Chattooga River, which forms the county's northern border. The county is also home to several lakes, including Lake Burton, Lake Rabun, and Lake Seed.
The county is mostly forested, with the majority of the land being owned by the U.S. Forest Service. The county is home to several state parks, including Black Rock Mountain State Park, Tallulah Gorge State Park, and Moccasin Creek State Park.
Economy
Rabun County has a diverse economy, with the largest industries being tourism, manufacturing, and agriculture. The county is home to several manufacturing companies, including a carpet mill, a furniture factory, and a paper mill.
Agriculture is also an important part of the county's economy. The county is home to several farms, which produce a variety of crops, including corn, soybeans, hay, and tobacco.
Tourism is the county's largest industry, and is a major source of income for the county. The county is home to several resorts, including the famous Sky Valley Resort. The county is also home to several state parks, which attract visitors from all over the country.
Demographics
As of the 2010 census, Rabun County had a population of 16,276. The population is mostly white (94.3%), with small percentages of African Americans (2.7%), Hispanics (1.3%), and Asians (0.7%).
The median household income in the county is $37,845, and the median home value is $179,400. The unemployment rate in the county is 5.2%.
Rabun County is home to several colleges and universities, including Truett McConnell University and North Georgia Technical College. The county is also home to several public schools, including Rabun County High School and Rabun Gap-Nacoochee School.
Common Questions
What is Per Capita Income in Rabun County?
Per Capita income in Rabun County is $35,889.
What is the Median Family Income in Rabun County?
Median Family Income in Rabun County is $71,985.
What is the Median Household income in Rabun County?
Median Household Income in Rabun County is $57,261.
What is Income or Wage Gap in Rabun County?
Income or Wage Gap in Rabun County is 15.0%.
Women in Rabun County earn 85.0 cents for every dollar earned by a man.
What is Inequality or Gini Index in Rabun County?
Inequality or Gini Index in Rabun County is 0.49.
What is the Total Population of Rabun County?
Total Population of Rabun County is 16,915.
What is the Total Male Population of Rabun County?
Total Male Population of Rabun County is 8,264.
What is the Total Female Population of Rabun County?
Total Female Population of Rabun County is 8,651.
What is the Ratio of Males per 100 Females in Rabun County?
There are 95.53 Males per 100 Females in Rabun County.
What is the Ratio of Females per 100 Males in Rabun County?
There are 104.68 Females per 100 Males in Rabun County.
What is the Median Population Age in Rabun County?
Median Population Age in Rabun County is 49.4 Years.
What is the Average Family Size in Rabun County
Average Family Size in Rabun County is 2.8 People.
What is the Average Household Size in Rabun County
Average Household Size in Rabun County is 2.4 People.
How Large is the Labor Force in Rabun County?
There are 7,043 People in the Labor Forcein in Rabun County.
What is the Percentage of People in the Labor Force in Rabun County?
48.2% of People are in the Labor Force in Rabun County.
What is the Unemployment Rate in Rabun County?
Unemployment Rate in Rabun County is 2.6%.