Pulaski County, GA Map & Demographics
Pulaski County Map
Pulaski County Overview
$23,007
PER CAPITA INCOME
$54,886
AVG FAMILY INCOME
$42,545
AVG HOUSEHOLD INCOME
30.5%
WAGE / INCOME GAP [ % ]
69.5¢/ $1
WAGE / INCOME GAP [ $ ]
0.45
INEQUALITY / GINI INDEX
9,887
TOTAL POPULATION
4,339
MALE POPULATION
5,548
FEMALE POPULATION
78.21
MALES / 100 FEMALES
127.86
FEMALES / 100 MALES
42.2
MEDIAN AGE
3.5
AVG FAMILY SIZE
2.8
AVG HOUSEHOLD SIZE
3,937
LABOR FORCE [ PEOPLE ]
47.9%
PERCENT IN LABOR FORCE
3.9%
UNEMPLOYMENT RATE
Pulaski County Area Codes
Income in Pulaski County
Income Overview in Pulaski County
Per Capita Income in Pulaski County is $23,007, while median incomes of families and households are $54,886 and $42,545 respectively.
| Characteristic | Number | Measure |
| Per Capita Income | 9,887 | $23,007 |
| Median Family Income | 1,938 | $54,886 |
| Mean Family Income | 1,938 | $74,232 |
| Median Household Income | 3,117 | $42,545 |
| Mean Household Income | 3,117 | $62,414 |
| Income Deficit | 1,938 | $0 |
| Wage / Income Gap (%) | 9,887 | 30.52% |
| Wage / Income Gap ($) | 9,887 | 69.48¢ per $1 |
| Gini / Inequality Index | 9,887 | 0.45 |
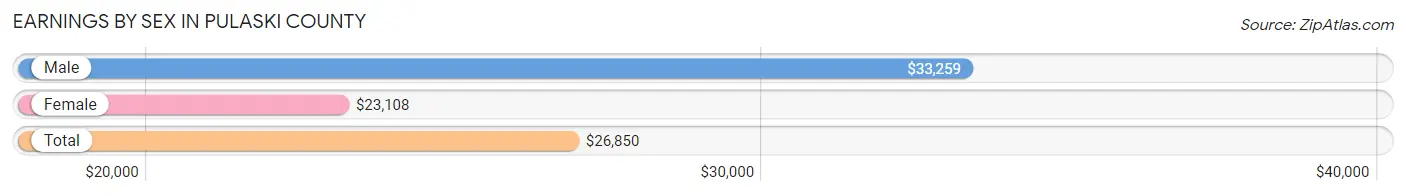
Earnings by Sex in Pulaski County
Average Earnings in Pulaski County are $26,850, $33,259 for men and $23,108 for women, a difference of 30.5%.
| Sex | Number | Average Earnings |
| Male | 2,044 (49.6%) | $33,259 |
| Female | 2,073 (50.3%) | $23,108 |
| Total | 4,117 (100.0%) | $26,850 |
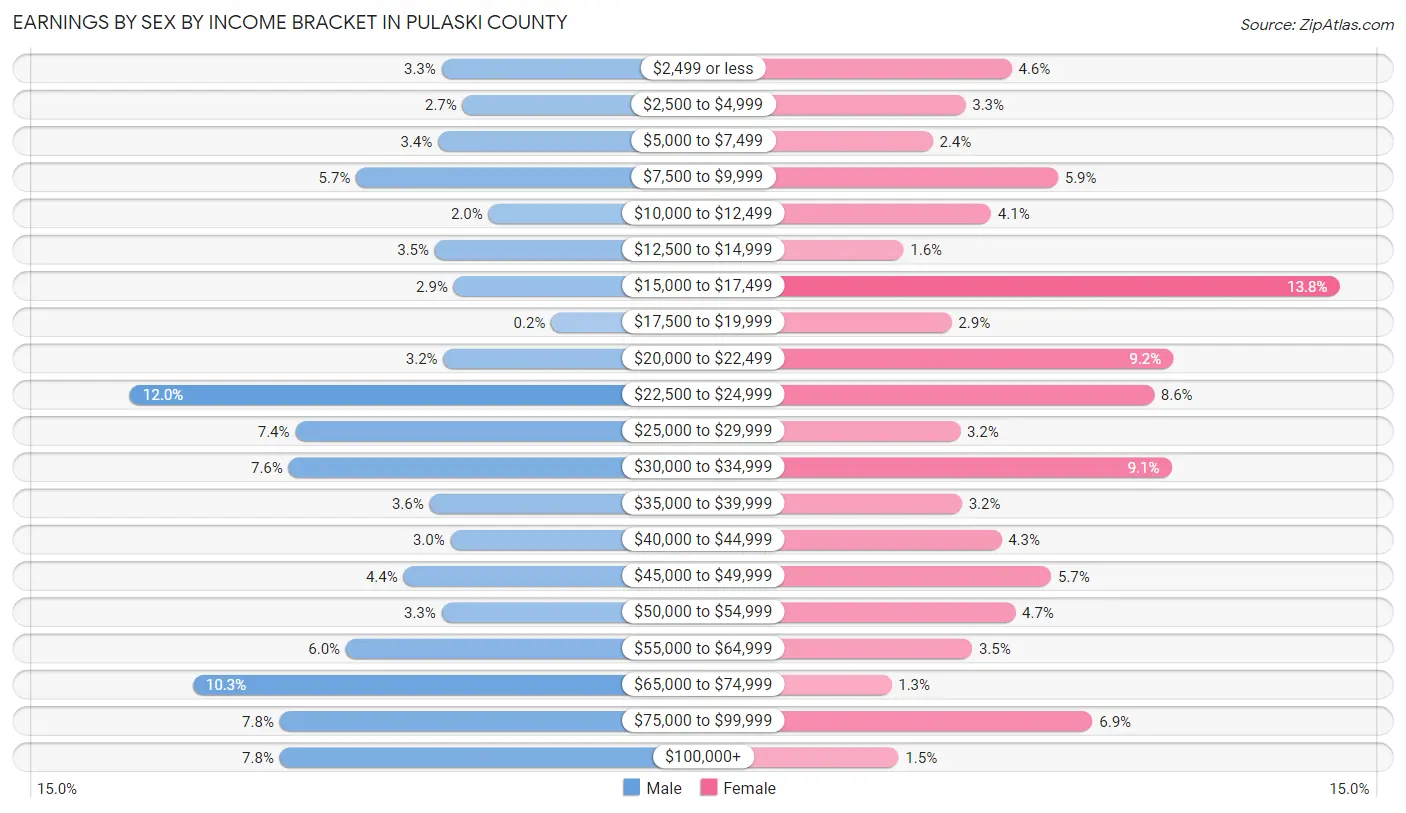
Earnings by Sex by Income Bracket in Pulaski County
The most common earnings brackets in Pulaski County are $22,500 to $24,999 for men (246 | 12.0%) and $15,000 to $17,499 for women (287 | 13.8%).
| Income | Male | Female |
| $2,499 or less | 67 (3.3%) | 96 (4.6%) |
| $2,500 to $4,999 | 55 (2.7%) | 69 (3.3%) |
| $5,000 to $7,499 | 69 (3.4%) | 50 (2.4%) |
| $7,500 to $9,999 | 116 (5.7%) | 123 (5.9%) |
| $10,000 to $12,499 | 40 (2.0%) | 84 (4.1%) |
| $12,500 to $14,999 | 71 (3.5%) | 33 (1.6%) |
| $15,000 to $17,499 | 60 (2.9%) | 287 (13.8%) |
| $17,500 to $19,999 | 4 (0.2%) | 61 (2.9%) |
| $20,000 to $22,499 | 66 (3.2%) | 190 (9.2%) |
| $22,500 to $24,999 | 246 (12.0%) | 179 (8.6%) |
| $25,000 to $29,999 | 151 (7.4%) | 66 (3.2%) |
| $30,000 to $34,999 | 155 (7.6%) | 189 (9.1%) |
| $35,000 to $39,999 | 74 (3.6%) | 67 (3.2%) |
| $40,000 to $44,999 | 62 (3.0%) | 90 (4.3%) |
| $45,000 to $49,999 | 89 (4.3%) | 119 (5.7%) |
| $50,000 to $54,999 | 67 (3.3%) | 98 (4.7%) |
| $55,000 to $64,999 | 122 (6.0%) | 73 (3.5%) |
| $65,000 to $74,999 | 210 (10.3%) | 26 (1.3%) |
| $75,000 to $99,999 | 160 (7.8%) | 143 (6.9%) |
| $100,000+ | 160 (7.8%) | 30 (1.5%) |
| Total | 2,044 (100.0%) | 2,073 (100.0%) |
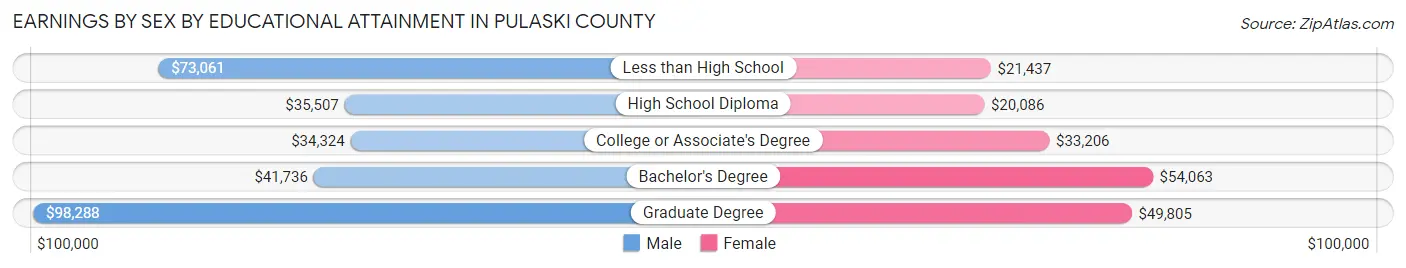
Earnings by Sex by Educational Attainment in Pulaski County
Average earnings in Pulaski County are $41,934 for men and $23,801 for women, a difference of 43.2%. Men with an educational attainment of graduate degree enjoy the highest average annual earnings of $98,288, while those with college or associate's degree education earn the least with $34,324. Women with an educational attainment of bachelor's degree earn the most with the average annual earnings of $54,063, while those with high school diploma education have the smallest earnings of $20,086.
| Educational Attainment | Male Income | Female Income |
| Less than High School | $73,061 | $21,437 |
| High School Diploma | $35,507 | $20,086 |
| College or Associate's Degree | $34,324 | $33,206 |
| Bachelor's Degree | $41,736 | $54,063 |
| Graduate Degree | $98,288 | $49,805 |
| Total | $41,934 | $23,801 |
Family Income in Pulaski County
Family Income Brackets in Pulaski County
According to the Pulaski County family income data, there are 409 families falling into the $100,000 to $149,999 income range, which is the most common income bracket and makes up 21.1% of all families. Conversely, the $200,000+ income bracket is the least frequent group with only 29 families (1.5%) belonging to this category.
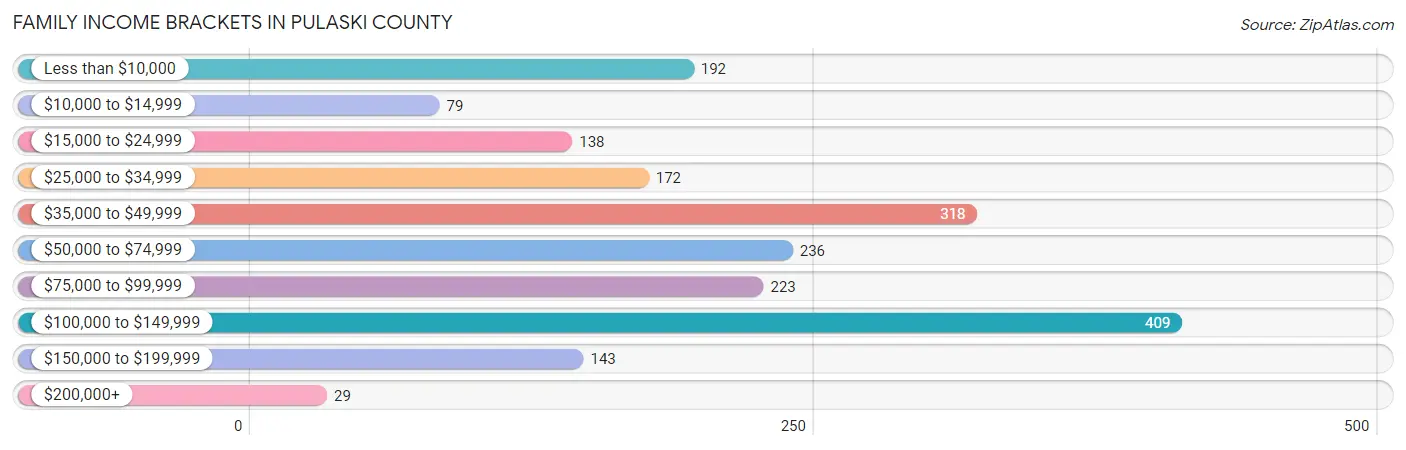
| Income Bracket | # Families | % Families |
| Less than $10,000 | 192 | 9.9% |
| $10,000 to $14,999 | 79 | 4.1% |
| $15,000 to $24,999 | 138 | 7.1% |
| $25,000 to $34,999 | 172 | 8.9% |
| $35,000 to $49,999 | 318 | 16.4% |
| $50,000 to $74,999 | 236 | 12.2% |
| $75,000 to $99,999 | 223 | 11.5% |
| $100,000 to $149,999 | 409 | 21.1% |
| $150,000 to $199,999 | 143 | 7.4% |
| $200,000+ | 29 | 1.5% |
Family Income by Famaliy Size in Pulaski County
4-person families (323 | 16.7%) account for the highest median family income in Pulaski County with $142,721 per family, while 4-person families (323 | 16.7%) have the highest median income of $35,680 per family member.
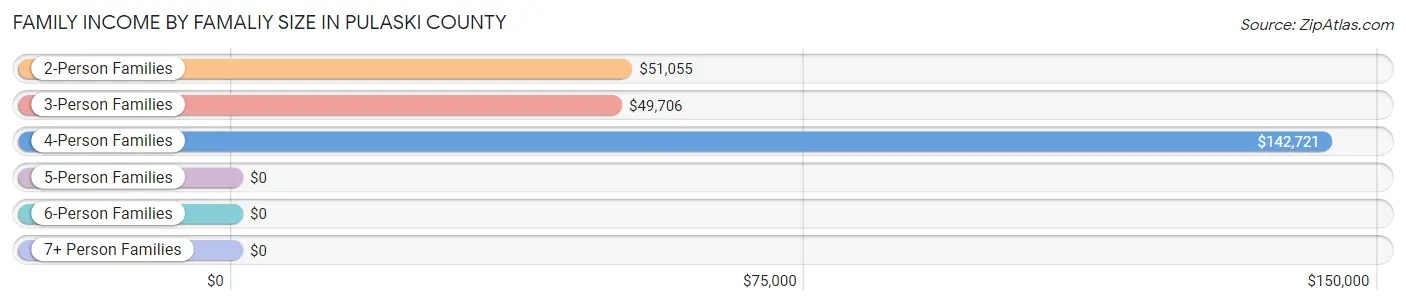
| Income Bracket | # Families | Median Income |
| 2-Person Families | 1,067 (55.1%) | $51,055 |
| 3-Person Families | 308 (15.9%) | $49,706 |
| 4-Person Families | 323 (16.7%) | $142,721 |
| 5-Person Families | 164 (8.5%) | $0 |
| 6-Person Families | 33 (1.7%) | $0 |
| 7+ Person Families | 43 (2.2%) | $0 |
| Total | 1,938 (100.0%) | $54,886 |
Family Income by Number of Earners in Pulaski County
The median family income in Pulaski County is $54,886, with families comprising 3+ earners (151) having the highest median family income of $144,779, while families with no earners (534) have the lowest median family income of $31,519, accounting for 7.8% and 27.6% of families, respectively.
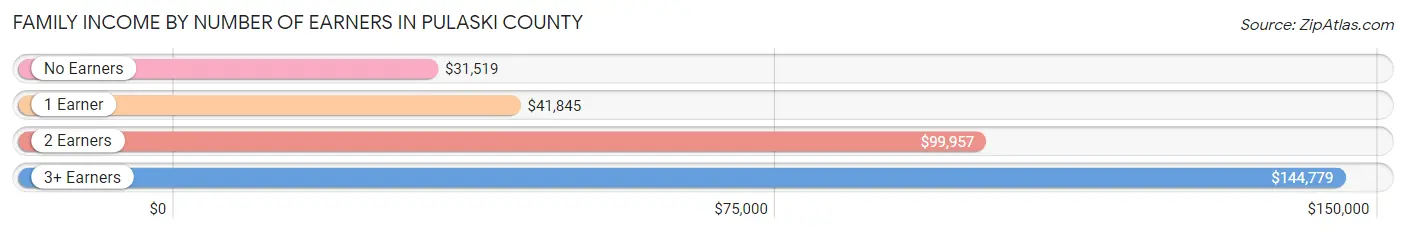
| Number of Earners | # Families | Median Income |
| No Earners | 534 (27.6%) | $31,519 |
| 1 Earner | 738 (38.1%) | $41,845 |
| 2 Earners | 515 (26.6%) | $99,957 |
| 3+ Earners | 151 (7.8%) | $144,779 |
| Total | 1,938 (100.0%) | $54,886 |
Household Income in Pulaski County
Household Income Brackets in Pulaski County
With 505 households falling in the category, the $25,000 to $34,999 income range is the most frequent in Pulaski County, accounting for 16.2% of all households. In contrast, only 28 households (0.9%) fall into the $200,000+ income bracket, making it the least populous group.
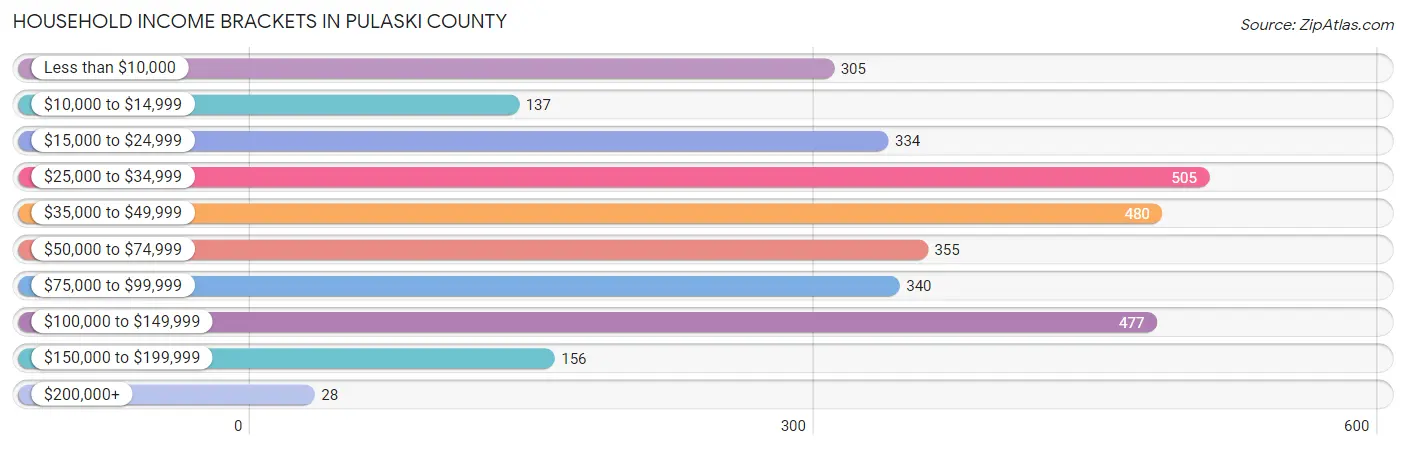
| Income Bracket | # Households | % Households |
| Less than $10,000 | 305 | 9.8% |
| $10,000 to $14,999 | 137 | 4.4% |
| $15,000 to $24,999 | 334 | 10.7% |
| $25,000 to $34,999 | 505 | 16.2% |
| $35,000 to $49,999 | 480 | 15.4% |
| $50,000 to $74,999 | 355 | 11.4% |
| $75,000 to $99,999 | 340 | 10.9% |
| $100,000 to $149,999 | 477 | 15.3% |
| $150,000 to $199,999 | 156 | 5.0% |
| $200,000+ | 28 | 0.9% |
Household Income by Householder Age in Pulaski County
The median household income in Pulaski County is $42,545, with the highest median household income of $50,417 found in the 45 to 64 years age bracket for the primary householder. A total of 1,038 households (33.3%) fall into this category. Meanwhile, the 15 to 24 years age bracket for the primary householder has the lowest median household income of $0, with 96 households (3.1%) in this group.
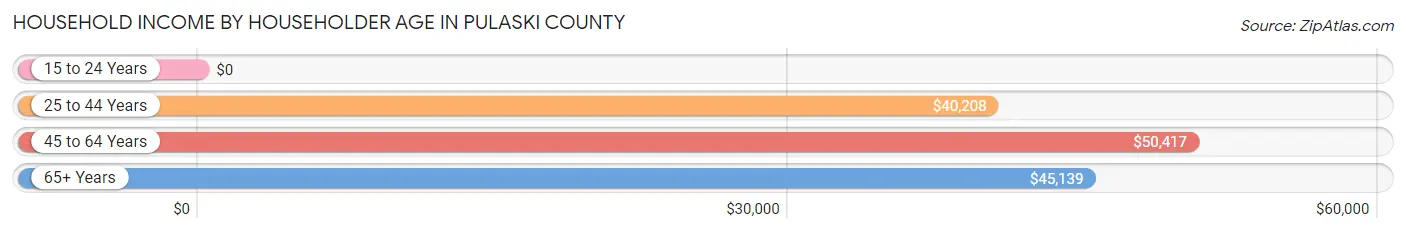
| Income Bracket | # Households | Median Income |
| 15 to 24 Years | 96 (3.1%) | $0 |
| 25 to 44 Years | 716 (23.0%) | $40,208 |
| 45 to 64 Years | 1,038 (33.3%) | $50,417 |
| 65+ Years | 1,267 (40.6%) | $45,139 |
| Total | 3,117 (100.0%) | $42,545 |
Poverty in Pulaski County
Income Below Poverty by Sex and Age in Pulaski County
With 17.6% poverty level for males and 20.2% for females among the residents of Pulaski County, under 5 year old males and 5 year old females are the most vulnerable to poverty, with 295 males (79.9%) and 28 females (100.0%) in their respective age groups living below the poverty level.
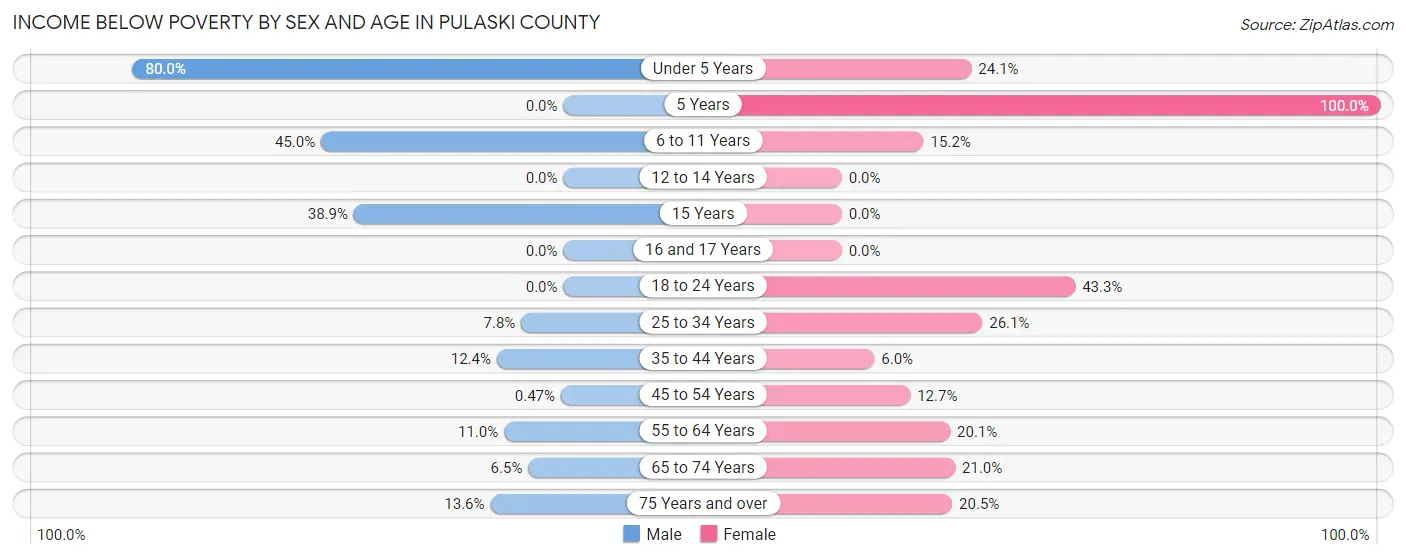
| Age Bracket | Male | Female |
| Under 5 Years | 295 (79.9%) | 83 (24.1%) |
| 5 Years | 0 (0.0%) | 28 (100.0%) |
| 6 to 11 Years | 201 (45.0%) | 41 (15.2%) |
| 12 to 14 Years | 0 (0.0%) | 0 (0.0%) |
| 15 Years | 21 (38.9%) | 0 (0.0%) |
| 16 and 17 Years | 0 (0.0%) | 0 (0.0%) |
| 18 to 24 Years | 0 (0.0%) | 107 (43.3%) |
| 25 to 34 Years | 51 (7.8%) | 181 (26.1%) |
| 35 to 44 Years | 34 (12.4%) | 20 (6.0%) |
| 45 to 54 Years | 2 (0.5%) | 78 (12.7%) |
| 55 to 64 Years | 54 (11.0%) | 121 (20.1%) |
| 65 to 74 Years | 39 (6.5%) | 114 (21.0%) |
| 75 Years and over | 55 (13.6%) | 102 (20.5%) |
| Total | 752 (17.6%) | 875 (20.2%) |
Income Above Poverty by Sex and Age in Pulaski County
According to the poverty statistics in Pulaski County, males aged 5 years and females aged 12 to 14 years are the age groups that are most secure financially, with 100.0% of males and 100.0% of females in these age groups living above the poverty line.
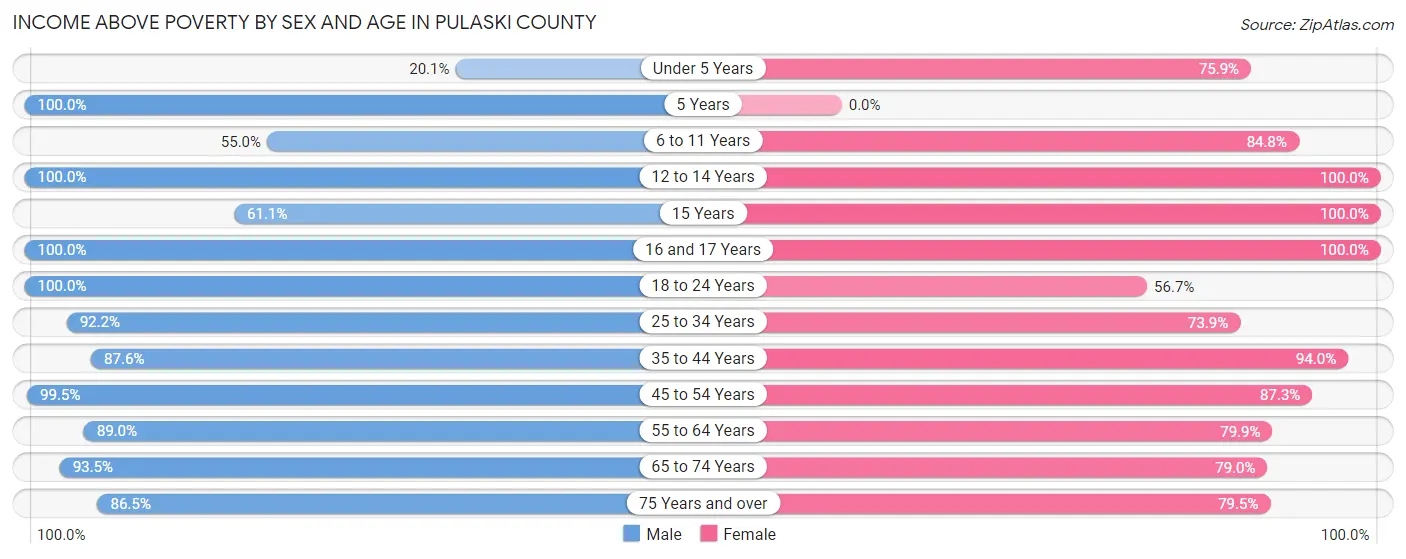
| Age Bracket | Male | Female |
| Under 5 Years | 74 (20.1%) | 262 (75.9%) |
| 5 Years | 9 (100.0%) | 0 (0.0%) |
| 6 to 11 Years | 246 (55.0%) | 229 (84.8%) |
| 12 to 14 Years | 57 (100.0%) | 65 (100.0%) |
| 15 Years | 33 (61.1%) | 14 (100.0%) |
| 16 and 17 Years | 119 (100.0%) | 84 (100.0%) |
| 18 to 24 Years | 361 (100.0%) | 140 (56.7%) |
| 25 to 34 Years | 601 (92.2%) | 513 (73.9%) |
| 35 to 44 Years | 241 (87.6%) | 311 (94.0%) |
| 45 to 54 Years | 426 (99.5%) | 536 (87.3%) |
| 55 to 64 Years | 437 (89.0%) | 481 (79.9%) |
| 65 to 74 Years | 559 (93.5%) | 428 (79.0%) |
| 75 Years and over | 351 (86.5%) | 396 (79.5%) |
| Total | 3,514 (82.4%) | 3,459 (79.8%) |
Income Below Poverty Among Married-Couple Families in Pulaski County
The poverty statistics for married-couple families in Pulaski County show that 6.4% or 74 of the total 1,163 families live below the poverty line. Families with no children have the highest poverty rate of 8.5%, comprising of 71 families. On the other hand, families with 3 or 4 children have the lowest poverty rate of 0.0%, which includes 0 families.
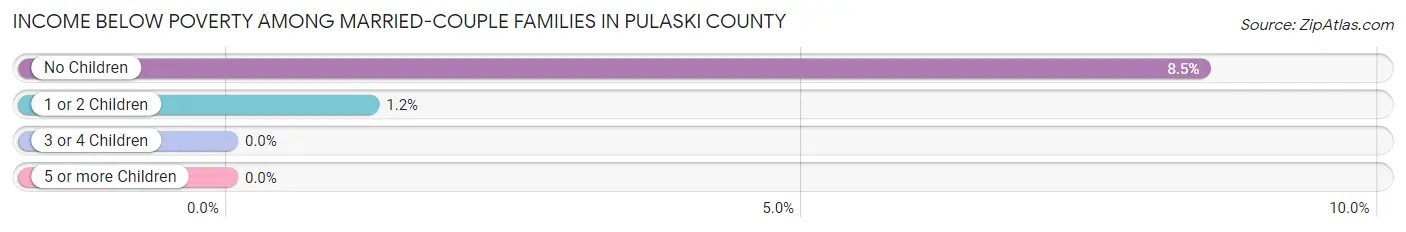
| Children | Above Poverty | Below Poverty |
| No Children | 767 (91.5%) | 71 (8.5%) |
| 1 or 2 Children | 241 (98.8%) | 3 (1.2%) |
| 3 or 4 Children | 81 (100.0%) | 0 (0.0%) |
| 5 or more Children | 0 (0.0%) | 0 (0.0%) |
| Total | 1,089 (93.6%) | 74 (6.4%) |
Income Below Poverty Among Single-Parent Households in Pulaski County
According to the poverty data in Pulaski County, 20.1% or 39 single-father households and 46.1% or 268 single-mother households are living below the poverty line. Among single-father households, those with 1 or 2 children have the highest poverty rate, with 34 households (41.0%) experiencing poverty. Likewise, among single-mother households, those with 1 or 2 children have the highest poverty rate, with 182 households (63.4%) falling below the poverty line.
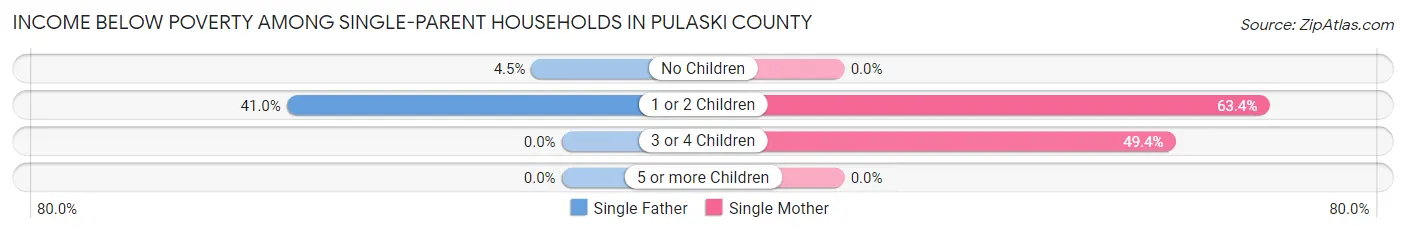
| Children | Single Father | Single Mother |
| No Children | 5 (4.5%) | 0 (0.0%) |
| 1 or 2 Children | 34 (41.0%) | 182 (63.4%) |
| 3 or 4 Children | 0 (0.0%) | 86 (49.4%) |
| 5 or more Children | 0 (0.0%) | 0 (0.0%) |
| Total | 39 (20.1%) | 268 (46.1%) |
Income Below Poverty Among Married-Couple vs Single-Parent Households in Pulaski County
The poverty data for Pulaski County shows that 74 of the married-couple family households (6.4%) and 307 of the single-parent households (39.6%) are living below the poverty level. Within the married-couple family households, those with no children have the highest poverty rate, with 71 households (8.5%) falling below the poverty line. Among the single-parent households, those with 1 or 2 children have the highest poverty rate, with 216 household (58.4%) living below poverty.
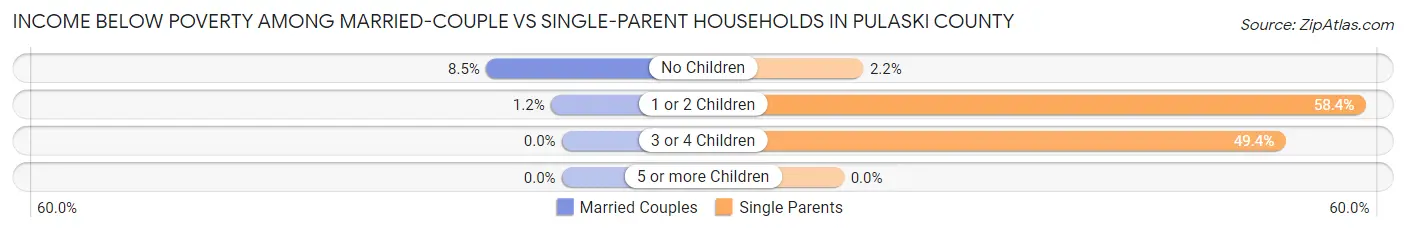
| Children | Married-Couple Families | Single-Parent Households |
| No Children | 71 (8.5%) | 5 (2.2%) |
| 1 or 2 Children | 3 (1.2%) | 216 (58.4%) |
| 3 or 4 Children | 0 (0.0%) | 86 (49.4%) |
| 5 or more Children | 0 (0.0%) | 0 (0.0%) |
| Total | 74 (6.4%) | 307 (39.6%) |
Race in Pulaski County
The most populous races in Pulaski County are White / Caucasian (5,727 | 57.9%), Black / African American (3,642 | 36.8%), and Hispanic or Latino (413 | 4.2%).
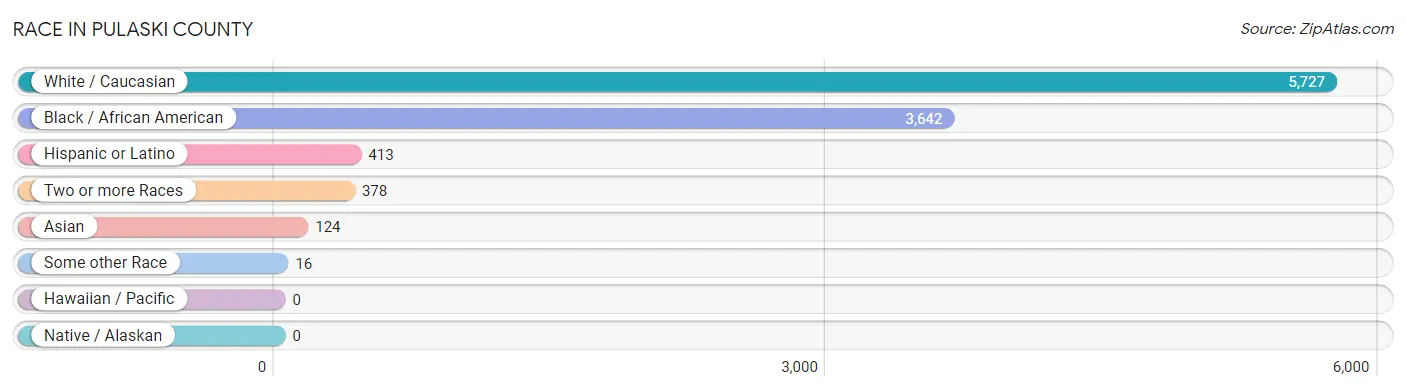
| Race | # Population | % Population |
| Asian | 124 | 1.3% |
| Black / African American | 3,642 | 36.8% |
| Hawaiian / Pacific | 0 | 0.0% |
| Hispanic or Latino | 413 | 4.2% |
| Native / Alaskan | 0 | 0.0% |
| White / Caucasian | 5,727 | 57.9% |
| Two or more Races | 378 | 3.8% |
| Some other Race | 16 | 0.2% |
| Total | 9,887 | 100.0% |
Ancestry in Pulaski County
The most populous ancestries reported in Pulaski County are American (1,310 | 13.3%), English (696 | 7.0%), Irish (532 | 5.4%), German (347 | 3.5%), and Mexican (254 | 2.6%), together accounting for 31.8% of all Pulaski County residents.
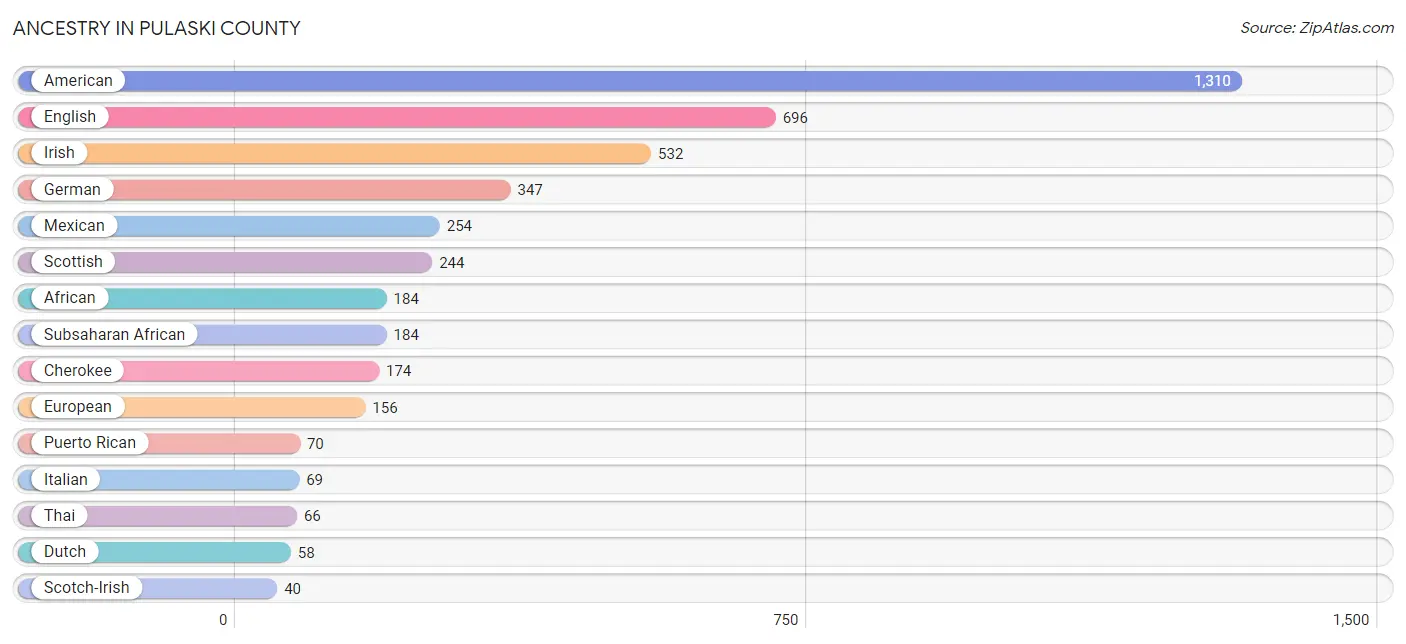
| Ancestry | # Population | % Population |
| African | 184 | 1.9% |
| American | 1,310 | 13.3% |
| Bhutanese | 31 | 0.3% |
| Blackfeet | 8 | 0.1% |
| British | 18 | 0.2% |
| Burmese | 7 | 0.1% |
| Canadian | 3 | 0.0% |
| Cherokee | 174 | 1.8% |
| Cuban | 16 | 0.2% |
| Danish | 18 | 0.2% |
| Dutch | 58 | 0.6% |
| Eastern European | 13 | 0.1% |
| English | 696 | 7.0% |
| European | 156 | 1.6% |
| French | 2 | 0.0% |
| German | 347 | 3.5% |
| Indian (Asian) | 3 | 0.0% |
| Irish | 532 | 5.4% |
| Italian | 69 | 0.7% |
| Jamaican | 39 | 0.4% |
| Korean | 20 | 0.2% |
| Mexican | 254 | 2.6% |
| Polish | 3 | 0.0% |
| Puerto Rican | 70 | 0.7% |
| Scotch-Irish | 40 | 0.4% |
| Scottish | 244 | 2.5% |
| South American | 22 | 0.2% |
| South American Indian | 29 | 0.3% |
| Spaniard | 7 | 0.1% |
| Subsaharan African | 184 | 1.9% |
| Swedish | 9 | 0.1% |
| Thai | 66 | 0.7% |
| Venezuelan | 22 | 0.2% |
| Welsh | 15 | 0.2% | View All 34 Rows |
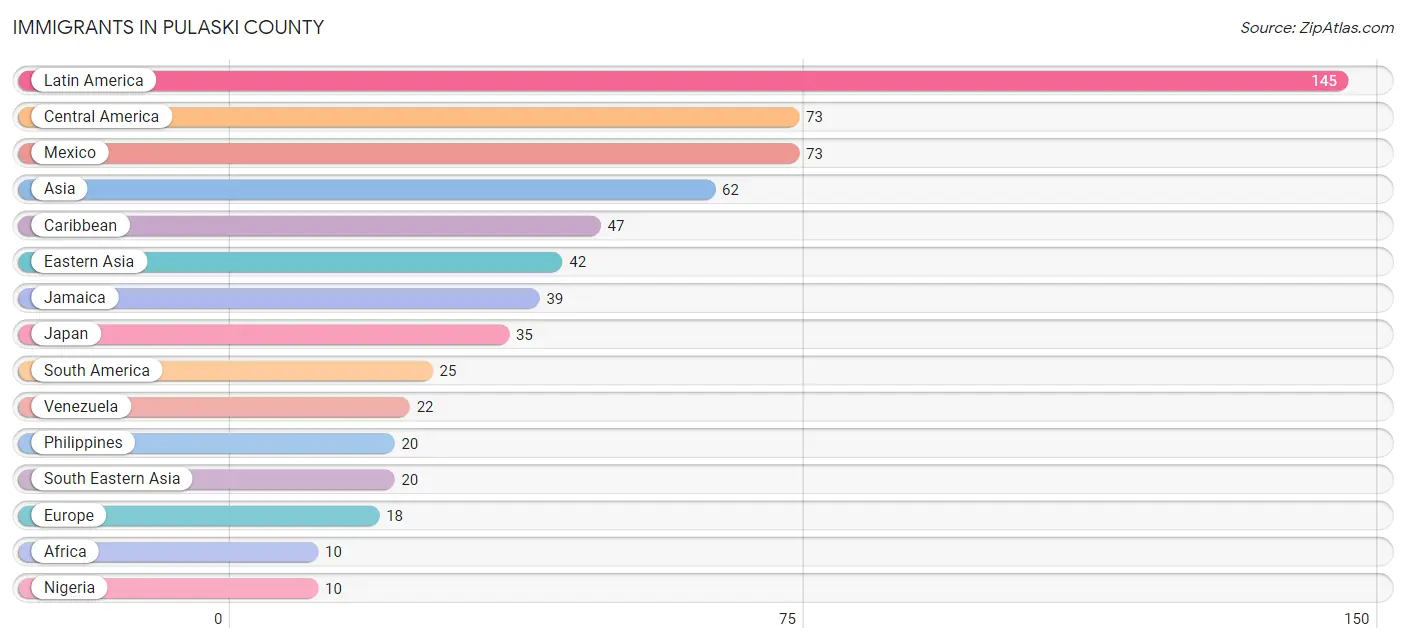
Immigrants in Pulaski County
The most numerous immigrant groups reported in Pulaski County came from Latin America (145 | 1.5%), Central America (73 | 0.7%), Mexico (73 | 0.7%), Asia (62 | 0.6%), and Caribbean (47 | 0.5%), together accounting for 4.1% of all Pulaski County residents.
| Immigration Origin | # Population | % Population |
| Africa | 10 | 0.1% |
| Asia | 62 | 0.6% |
| Caribbean | 47 | 0.5% |
| Central America | 73 | 0.7% |
| Eastern Asia | 42 | 0.4% |
| England | 2 | 0.0% |
| Europe | 18 | 0.2% |
| Germany | 7 | 0.1% |
| Guyana | 3 | 0.0% |
| Jamaica | 39 | 0.4% |
| Japan | 35 | 0.4% |
| Korea | 7 | 0.1% |
| Latin America | 145 | 1.5% |
| Mexico | 73 | 0.7% |
| Nigeria | 10 | 0.1% |
| Northern Europe | 2 | 0.0% |
| Philippines | 20 | 0.2% |
| South America | 25 | 0.3% |
| South Eastern Asia | 20 | 0.2% |
| Southern Europe | 9 | 0.1% |
| Spain | 9 | 0.1% |
| Trinidad and Tobago | 8 | 0.1% |
| Venezuela | 22 | 0.2% |
| Western Africa | 10 | 0.1% |
| Western Europe | 7 | 0.1% | View All 25 Rows |
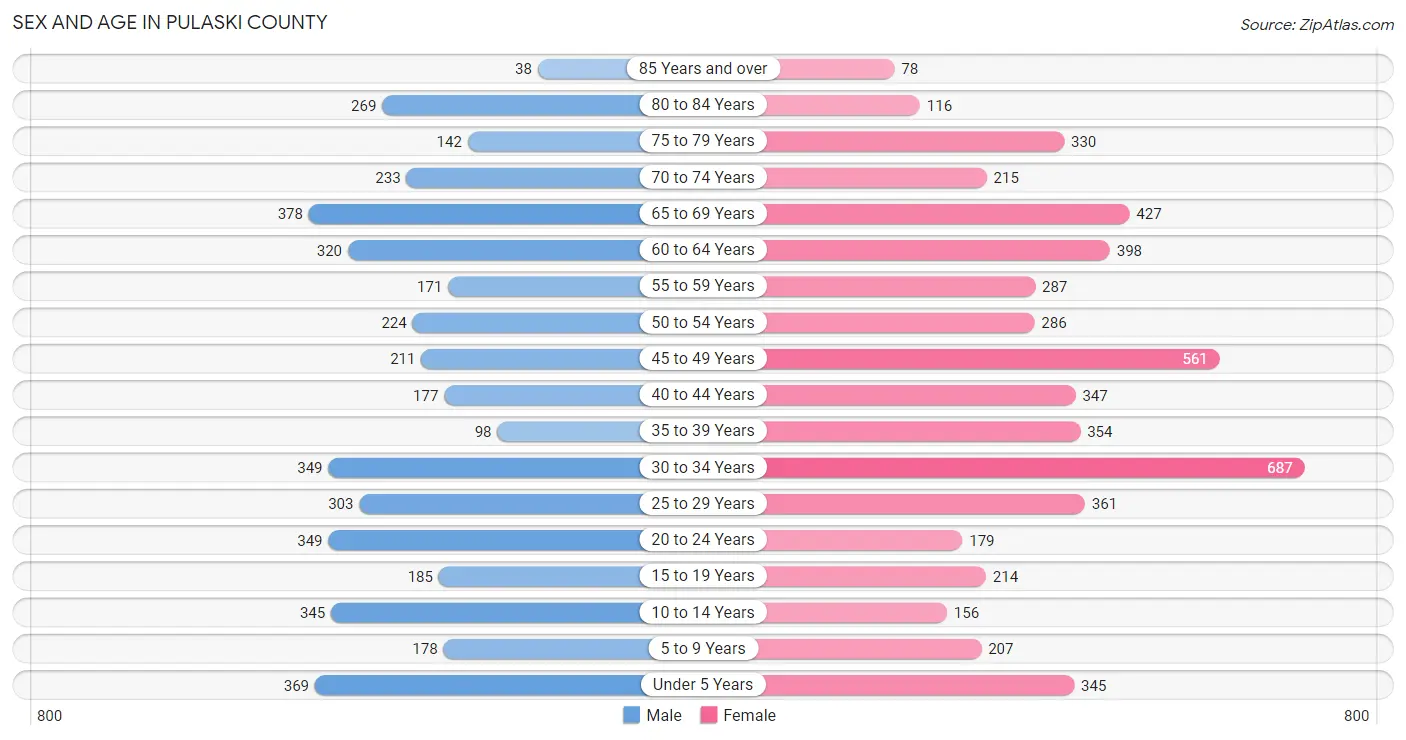
Sex and Age in Pulaski County
Sex and Age in Pulaski County
The most populous age groups in Pulaski County are 65 to 69 Years (378 | 8.7%) for men and 30 to 34 Years (687 | 12.4%) for women.
| Age Bracket | Male | Female |
| Under 5 Years | 369 (8.5%) | 345 (6.2%) |
| 5 to 9 Years | 178 (4.1%) | 207 (3.7%) |
| 10 to 14 Years | 345 (8.0%) | 156 (2.8%) |
| 15 to 19 Years | 185 (4.3%) | 214 (3.9%) |
| 20 to 24 Years | 349 (8.0%) | 179 (3.2%) |
| 25 to 29 Years | 303 (7.0%) | 361 (6.5%) |
| 30 to 34 Years | 349 (8.0%) | 687 (12.4%) |
| 35 to 39 Years | 98 (2.3%) | 354 (6.4%) |
| 40 to 44 Years | 177 (4.1%) | 347 (6.2%) |
| 45 to 49 Years | 211 (4.9%) | 561 (10.1%) |
| 50 to 54 Years | 224 (5.2%) | 286 (5.2%) |
| 55 to 59 Years | 171 (3.9%) | 287 (5.2%) |
| 60 to 64 Years | 320 (7.4%) | 398 (7.2%) |
| 65 to 69 Years | 378 (8.7%) | 427 (7.7%) |
| 70 to 74 Years | 233 (5.4%) | 215 (3.9%) |
| 75 to 79 Years | 142 (3.3%) | 330 (5.9%) |
| 80 to 84 Years | 269 (6.2%) | 116 (2.1%) |
| 85 Years and over | 38 (0.9%) | 78 (1.4%) |
| Total | 4,339 (100.0%) | 5,548 (100.0%) |
Families and Households in Pulaski County
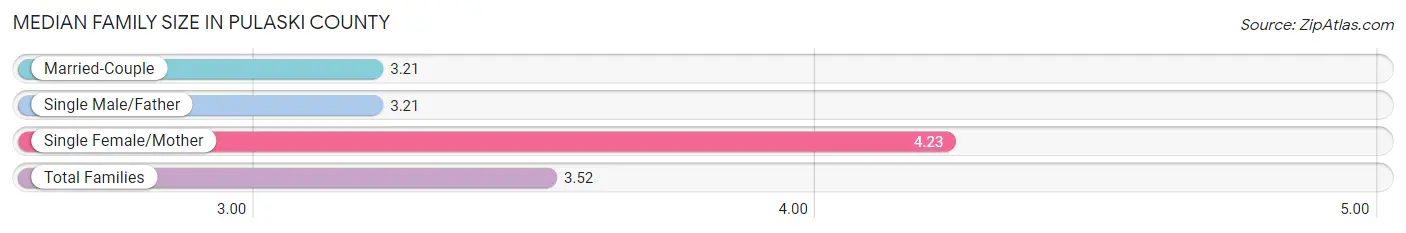
Median Family Size in Pulaski County
The median family size in Pulaski County is 3.52 persons per family, with single female/mother families (581 | 30.0%) accounting for the largest median family size of 4.23 persons per family. On the other hand, married-couple families (1,163 | 60.0%) represent the smallest median family size with 3.21 persons per family.
| Family Type | # Families | Family Size |
| Married-Couple | 1,163 (60.0%) | 3.21 |
| Single Male/Father | 194 (10.0%) | 3.21 |
| Single Female/Mother | 581 (30.0%) | 4.23 |
| Total Families | 1,938 (100.0%) | 3.52 |
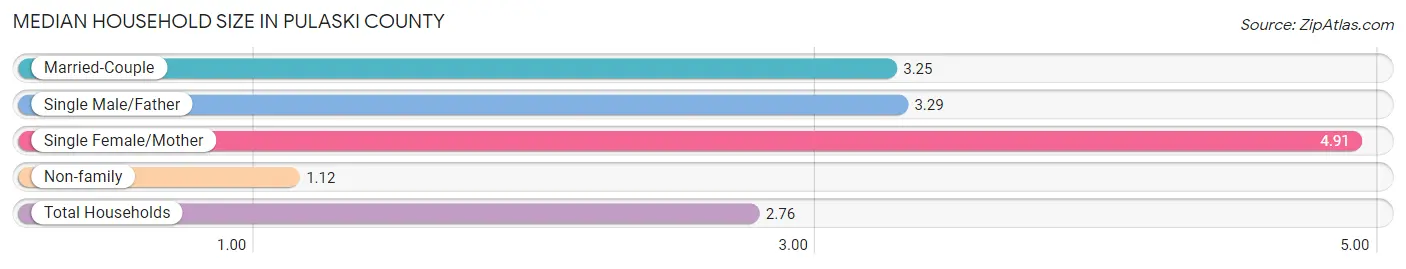
Median Household Size in Pulaski County
The median household size in Pulaski County is 2.76 persons per household, with single female/mother households (581 | 18.6%) accounting for the largest median household size of 4.91 persons per household. non-family households (1,179 | 37.8%) represent the smallest median household size with 1.12 persons per household.
| Household Type | # Households | Household Size |
| Married-Couple | 1,163 (37.3%) | 3.25 |
| Single Male/Father | 194 (6.2%) | 3.29 |
| Single Female/Mother | 581 (18.6%) | 4.91 |
| Non-family | 1,179 (37.8%) | 1.12 |
| Total Households | 3,117 (100.0%) | 2.76 |
Household Size by Marriage Status in Pulaski County
Out of a total of 3,117 households in Pulaski County, 1,938 (62.2%) are family households, while 1,179 (37.8%) are nonfamily households. The most numerous type of family households are 2-person households, comprising 1,003, and the most common type of nonfamily households are 1-person households, comprising 1,079.
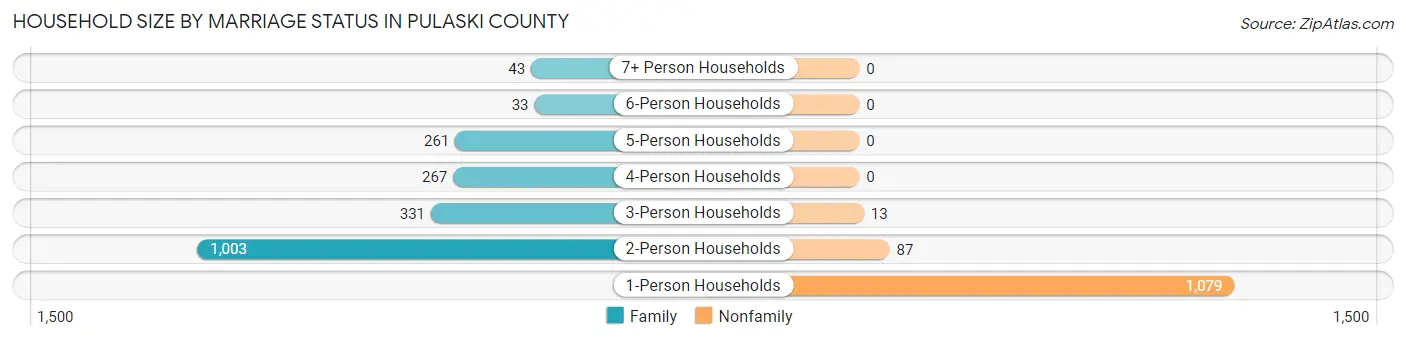
| Household Size | Family Households | Nonfamily Households |
| 1-Person Households | - | 1,079 (34.6%) |
| 2-Person Households | 1,003 (32.2%) | 87 (2.8%) |
| 3-Person Households | 331 (10.6%) | 13 (0.4%) |
| 4-Person Households | 267 (8.6%) | 0 (0.0%) |
| 5-Person Households | 261 (8.4%) | 0 (0.0%) |
| 6-Person Households | 33 (1.1%) | 0 (0.0%) |
| 7+ Person Households | 43 (1.4%) | 0 (0.0%) |
| Total | 1,938 (62.2%) | 1,179 (37.8%) |
Female Fertility in Pulaski County
Fertility by Age in Pulaski County
Average fertility rate in Pulaski County is 47.0 births per 1,000 women. Women in the age bracket of 15 to 19 years have the highest fertility rate with 229.0 births per 1,000 women. Women in the age bracket of 20 to 34 years acount for 55.1% of all women with births.
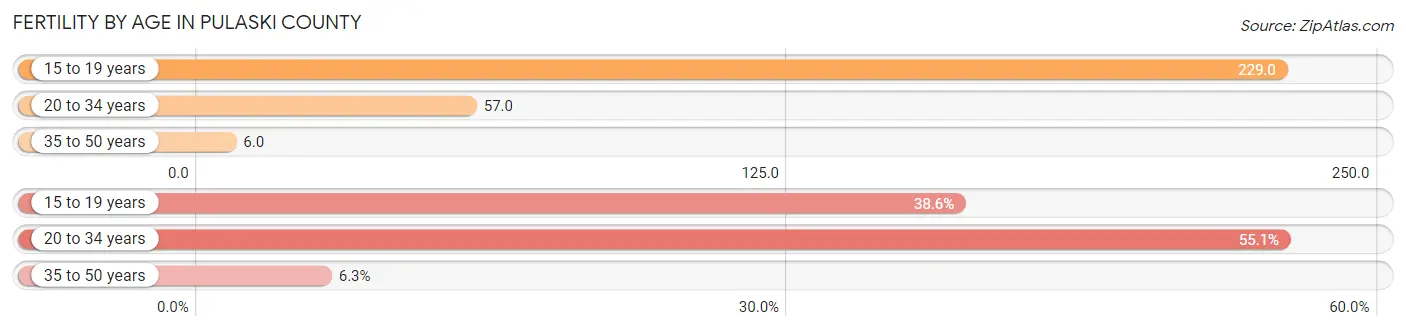
| Age Bracket | Women with Births | Births / 1,000 Women |
| 15 to 19 years | 49 (38.6%) | 229.0 |
| 20 to 34 years | 70 (55.1%) | 57.0 |
| 35 to 50 years | 8 (6.3%) | 6.0 |
| Total | 127 (100.0%) | 47.0 |
Fertility by Age by Marriage Status in Pulaski County
33.1% of women with births (127) in Pulaski County are married. The highest percentage of unmarried women with births falls into 15 to 19 years age bracket with 100.0% of them unmarried at the time of birth, while the lowest percentage of unmarried women with births belong to 20 to 34 years age bracket with 40.0% of them unmarried.
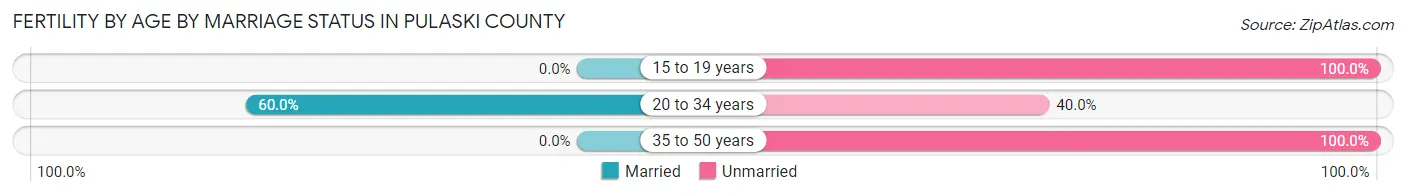
| Age Bracket | Married | Unmarried |
| 15 to 19 years | 0 (0.0%) | 49 (100.0%) |
| 20 to 34 years | 42 (60.0%) | 28 (40.0%) |
| 35 to 50 years | 0 (0.0%) | 8 (100.0%) |
| Total | 42 (33.1%) | 85 (66.9%) |
Fertility by Education in Pulaski County
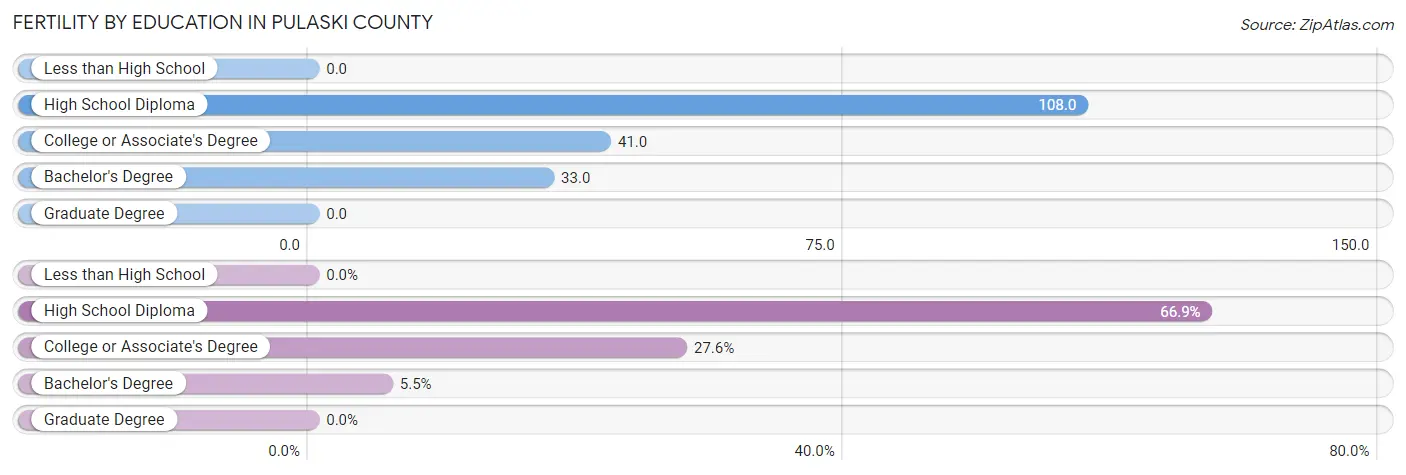
| Educational Attainment | Women with Births | Births / 1,000 Women |
| Less than High School | 0 (0.0%) | 0.0 |
| High School Diploma | 85 (66.9%) | 108.0 |
| College or Associate's Degree | 35 (27.6%) | 41.0 |
| Bachelor's Degree | 7 (5.5%) | 33.0 |
| Graduate Degree | 0 (0.0%) | 0.0 |
| Total | 127 (100.0%) | 47.0 |
Fertility by Education by Marriage Status in Pulaski County
66.9% of women with births in Pulaski County are unmarried. Women with the educational attainment of college or associate's degree are most likely to be married with 100.0% of them married at childbirth, while women with the educational attainment of high school diploma are least likely to be married with 100.0% of them unmarried at childbirth.
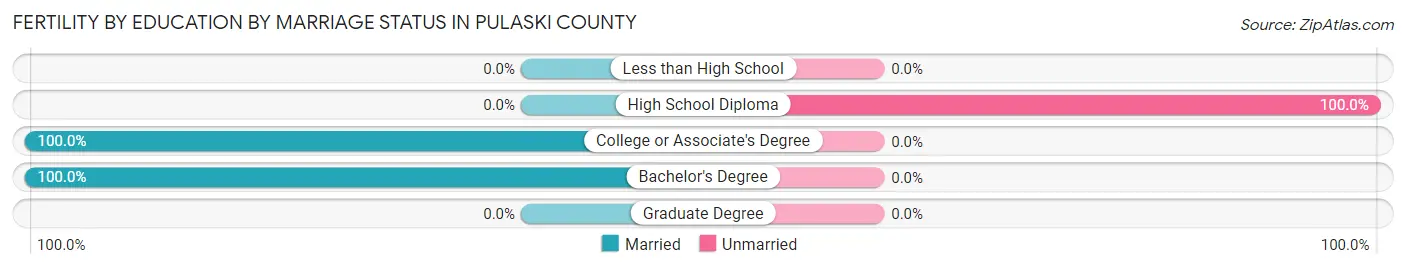
| Educational Attainment | Married | Unmarried |
| Less than High School | 0 (0.0%) | 0 (0.0%) |
| High School Diploma | 0 (0.0%) | 85 (100.0%) |
| College or Associate's Degree | 35 (100.0%) | 0 (0.0%) |
| Bachelor's Degree | 7 (100.0%) | 0 (0.0%) |
| Graduate Degree | 0 (0.0%) | 0 (0.0%) |
| Total | 42 (33.1%) | 85 (66.9%) |
Employment Characteristics in Pulaski County
Employment by Class of Employer in Pulaski County
Among the 3,555 employed individuals in Pulaski County, private company employees (2,211 | 62.2%), local government employees (466 | 13.1%), and not-for-profit organizations (354 | 10.0%) make up the most common classes of employment.
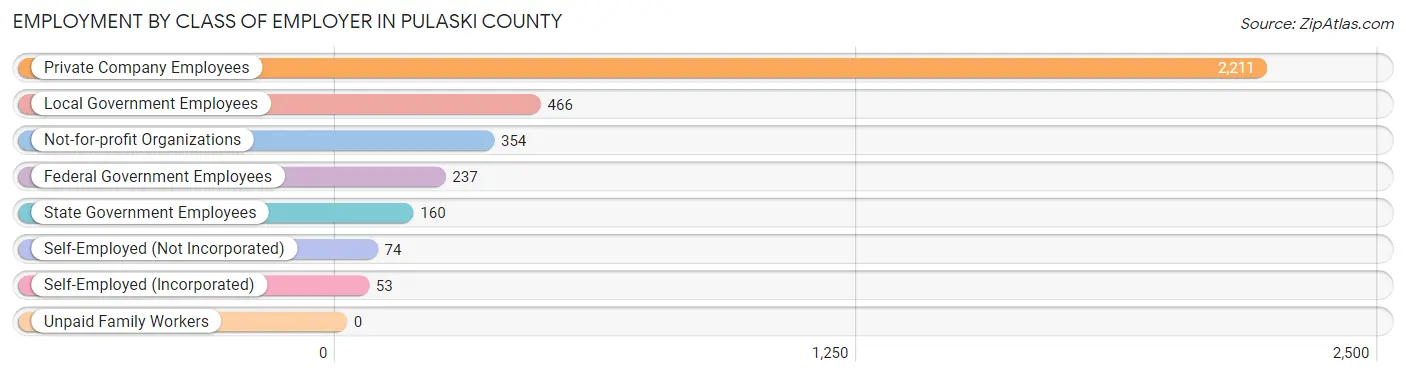
| Employer Class | # Employees | % Employees |
| Private Company Employees | 2,211 | 62.2% |
| Self-Employed (Incorporated) | 53 | 1.5% |
| Self-Employed (Not Incorporated) | 74 | 2.1% |
| Not-for-profit Organizations | 354 | 10.0% |
| Local Government Employees | 466 | 13.1% |
| State Government Employees | 160 | 4.5% |
| Federal Government Employees | 237 | 6.7% |
| Unpaid Family Workers | 0 | 0.0% |
| Total | 3,555 | 100.0% |
Employment Status by Age in Pulaski County
According to the labor force statistics for Pulaski County, out of the total population over 16 years of age (8,219), 47.9% or 3,937 individuals are in the labor force, with 3.9% or 154 of them unemployed. The age group with the highest labor force participation rate is 20 to 24 years, with 82.4% or 435 individuals in the labor force. Within the labor force, the 16 to 19 years age range has the highest percentage of unemployed individuals, with 33.3% or 16 of them being unemployed.
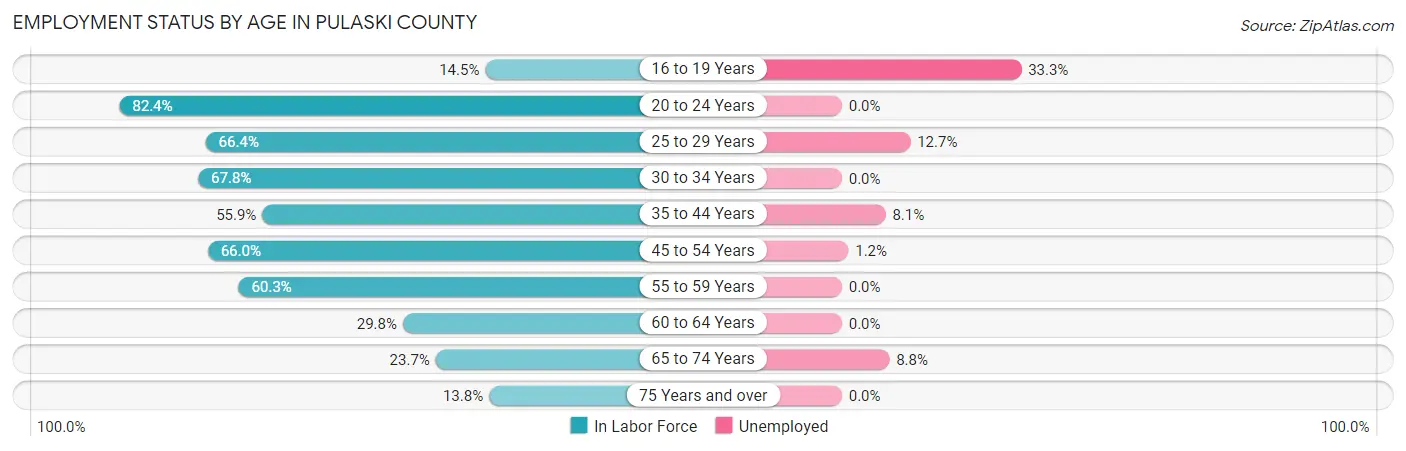
| Age Bracket | In Labor Force | Unemployed |
| 16 to 19 Years | 48 (14.5%) | 16 (33.3%) |
| 20 to 24 Years | 435 (82.4%) | 0 (0.0%) |
| 25 to 29 Years | 441 (66.4%) | 56 (12.7%) |
| 30 to 34 Years | 702 (67.8%) | 0 (0.0%) |
| 35 to 44 Years | 546 (55.9%) | 44 (8.1%) |
| 45 to 54 Years | 846 (66.0%) | 10 (1.2%) |
| 55 to 59 Years | 276 (60.3%) | 0 (0.0%) |
| 60 to 64 Years | 214 (29.8%) | 0 (0.0%) |
| 65 to 74 Years | 297 (23.7%) | 26 (8.8%) |
| 75 Years and over | 134 (13.8%) | 0 (0.0%) |
| Total | 3,937 (47.9%) | 154 (3.9%) |
Employment Status by Educational Attainment in Pulaski County
According to labor force statistics for Pulaski County, 58.9% of individuals (3,024) out of the total population between 25 and 64 years of age (5,134) are in the labor force, with 3.6% or 109 of them being unemployed. The group with the highest labor force participation rate are those with the educational attainment of bachelor's degree or higher, with 76.0% or 477 individuals in the labor force. Within the labor force, individuals with college / associate degree education have the highest percentage of unemployment, with 5.9% or 66 of them being unemployed.
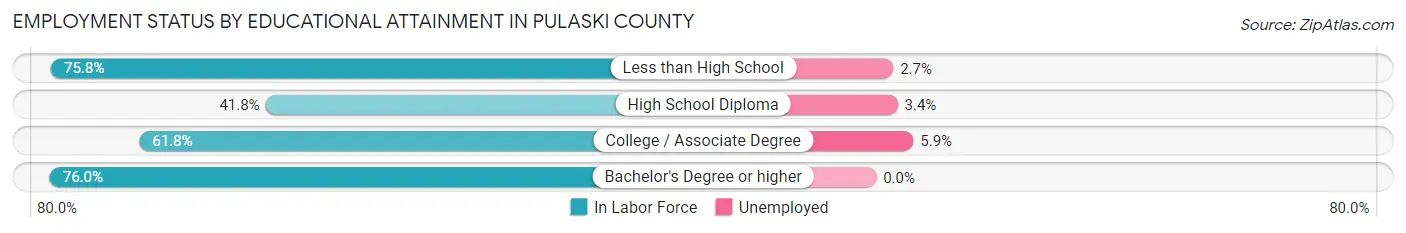
| Educational Attainment | In Labor Force | Unemployed |
| Less than High School | 675 (75.8%) | 24 (2.7%) |
| High School Diploma | 754 (41.8%) | 61 (3.4%) |
| College / Associate Degree | 1,119 (61.8%) | 107 (5.9%) |
| Bachelor's Degree or higher | 477 (76.0%) | 0 (0.0%) |
| Total | 3,024 (58.9%) | 185 (3.6%) |
Employment Occupations by Sex in Pulaski County
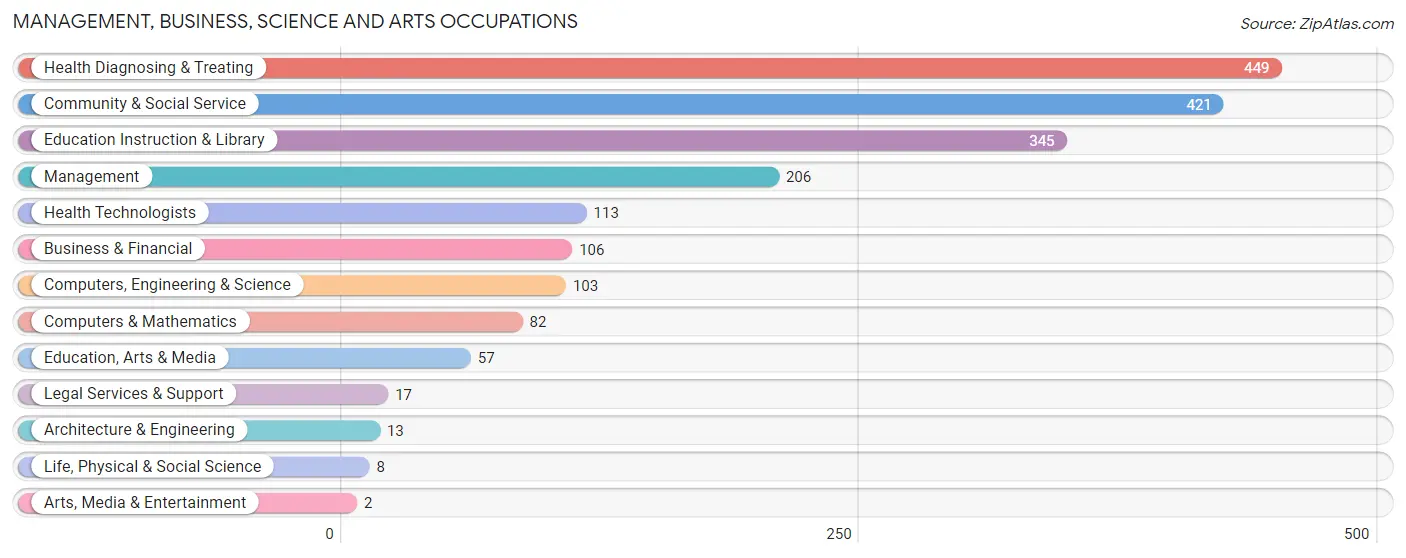
Management, Business, Science and Arts Occupations
The most common Management, Business, Science and Arts occupations in Pulaski County are Health Diagnosing & Treating (449 | 11.9%), Community & Social Service (421 | 11.1%), Education Instruction & Library (345 | 9.1%), Management (206 | 5.4%), and Health Technologists (113 | 3.0%).
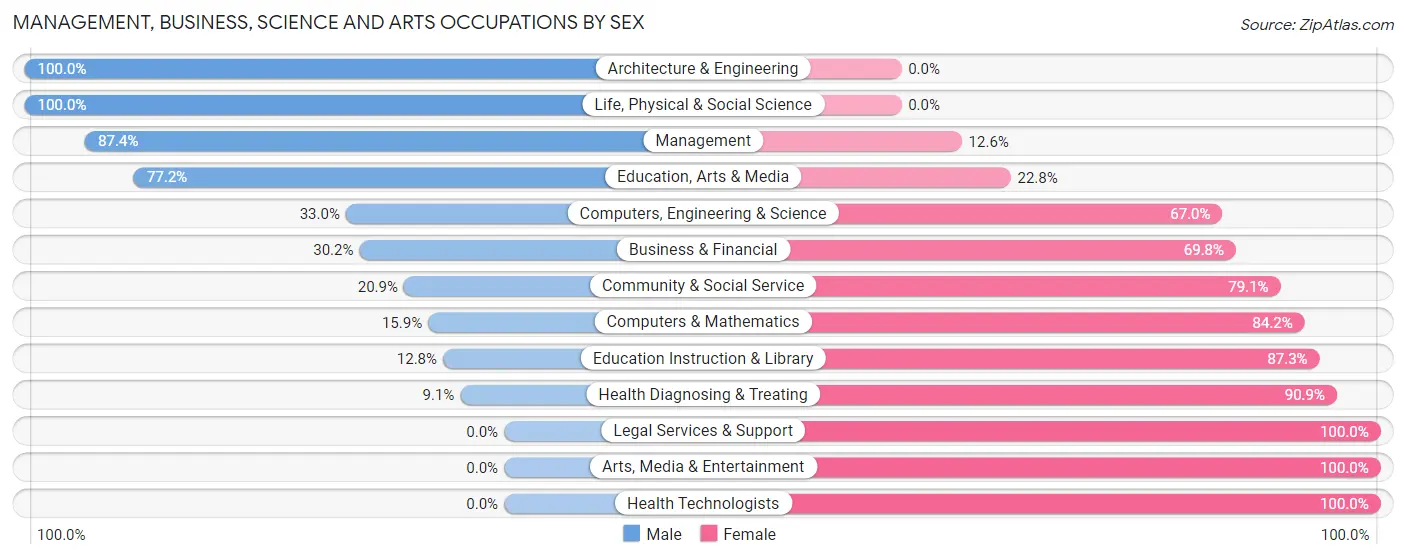
Management, Business, Science and Arts Occupations by Sex
Within the Management, Business, Science and Arts occupations in Pulaski County, the most male-oriented occupations are Architecture & Engineering (100.0%), Life, Physical & Social Science (100.0%), and Management (87.4%), while the most female-oriented occupations are Legal Services & Support (100.0%), Arts, Media & Entertainment (100.0%), and Health Technologists (100.0%).
| Occupation | Male | Female |
| Management | 180 (87.4%) | 26 (12.6%) |
| Business & Financial | 32 (30.2%) | 74 (69.8%) |
| Computers, Engineering & Science | 34 (33.0%) | 69 (67.0%) |
| Computers & Mathematics | 13 (15.9%) | 69 (84.2%) |
| Architecture & Engineering | 13 (100.0%) | 0 (0.0%) |
| Life, Physical & Social Science | 8 (100.0%) | 0 (0.0%) |
| Community & Social Service | 88 (20.9%) | 333 (79.1%) |
| Education, Arts & Media | 44 (77.2%) | 13 (22.8%) |
| Legal Services & Support | 0 (0.0%) | 17 (100.0%) |
| Education Instruction & Library | 44 (12.8%) | 301 (87.3%) |
| Arts, Media & Entertainment | 0 (0.0%) | 2 (100.0%) |
| Health Diagnosing & Treating | 41 (9.1%) | 408 (90.9%) |
| Health Technologists | 0 (0.0%) | 113 (100.0%) |
| Total (Category) | 375 (29.2%) | 910 (70.8%) |
| Total (Overall) | 1,913 (50.5%) | 1,874 (49.5%) |
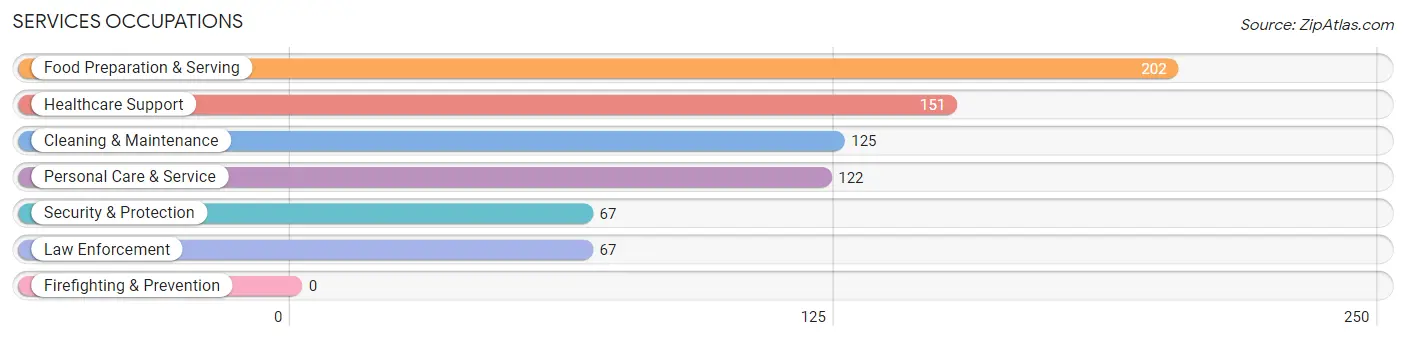
Services Occupations
The most common Services occupations in Pulaski County are Food Preparation & Serving (202 | 5.3%), Healthcare Support (151 | 4.0%), Cleaning & Maintenance (125 | 3.3%), Personal Care & Service (122 | 3.2%), and Security & Protection (67 | 1.8%).
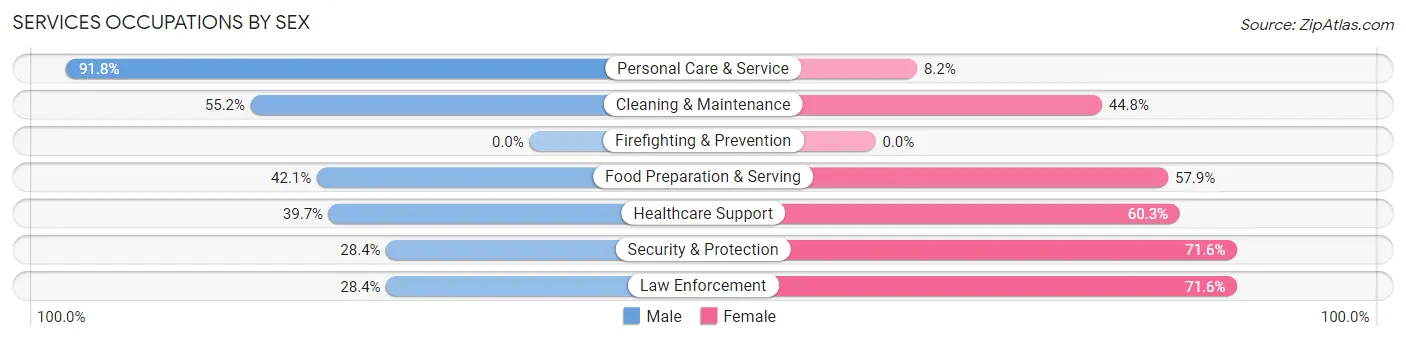
Services Occupations by Sex
Within the Services occupations in Pulaski County, the most male-oriented occupations are Personal Care & Service (91.8%), Cleaning & Maintenance (55.2%), and Food Preparation & Serving (42.1%), while the most female-oriented occupations are Security & Protection (71.6%), Law Enforcement (71.6%), and Healthcare Support (60.3%).
| Occupation | Male | Female |
| Healthcare Support | 60 (39.7%) | 91 (60.3%) |
| Security & Protection | 19 (28.4%) | 48 (71.6%) |
| Firefighting & Prevention | 0 (0.0%) | 0 (0.0%) |
| Law Enforcement | 19 (28.4%) | 48 (71.6%) |
| Food Preparation & Serving | 85 (42.1%) | 117 (57.9%) |
| Cleaning & Maintenance | 69 (55.2%) | 56 (44.8%) |
| Personal Care & Service | 112 (91.8%) | 10 (8.2%) |
| Total (Category) | 345 (51.7%) | 322 (48.3%) |
| Total (Overall) | 1,913 (50.5%) | 1,874 (49.5%) |
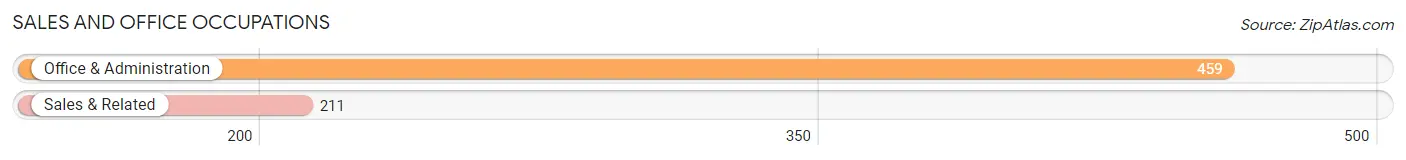
Sales and Office Occupations
The most common Sales and Office occupations in Pulaski County are Office & Administration (459 | 12.1%), and Sales & Related (211 | 5.6%).
Sales and Office Occupations by Sex
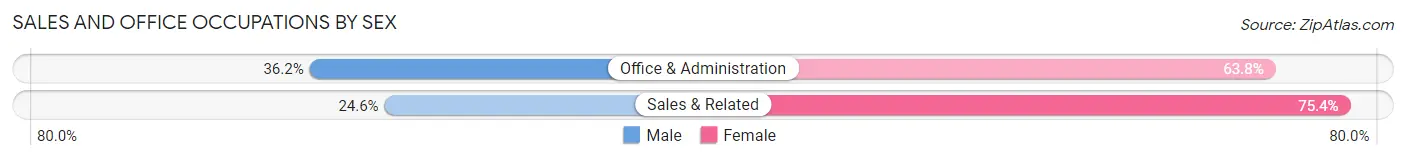
| Occupation | Male | Female |
| Sales & Related | 52 (24.6%) | 159 (75.4%) |
| Office & Administration | 166 (36.2%) | 293 (63.8%) |
| Total (Category) | 218 (32.5%) | 452 (67.5%) |
| Total (Overall) | 1,913 (50.5%) | 1,874 (49.5%) |
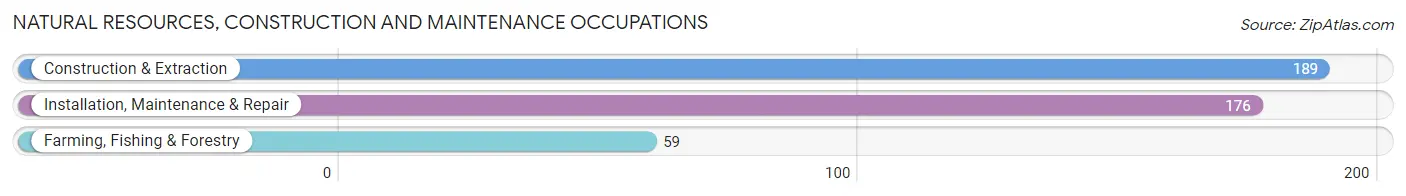
Natural Resources, Construction and Maintenance Occupations
The most common Natural Resources, Construction and Maintenance occupations in Pulaski County are Construction & Extraction (189 | 5.0%), Installation, Maintenance & Repair (176 | 4.6%), and Farming, Fishing & Forestry (59 | 1.6%).
Natural Resources, Construction and Maintenance Occupations by Sex
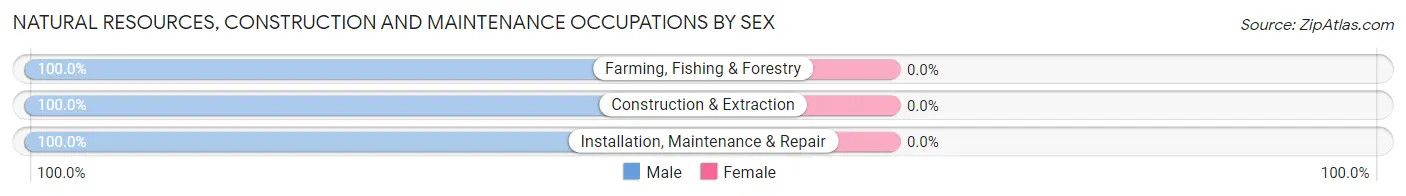
| Occupation | Male | Female |
| Farming, Fishing & Forestry | 59 (100.0%) | 0 (0.0%) |
| Construction & Extraction | 189 (100.0%) | 0 (0.0%) |
| Installation, Maintenance & Repair | 176 (100.0%) | 0 (0.0%) |
| Total (Category) | 424 (100.0%) | 0 (0.0%) |
| Total (Overall) | 1,913 (50.5%) | 1,874 (49.5%) |
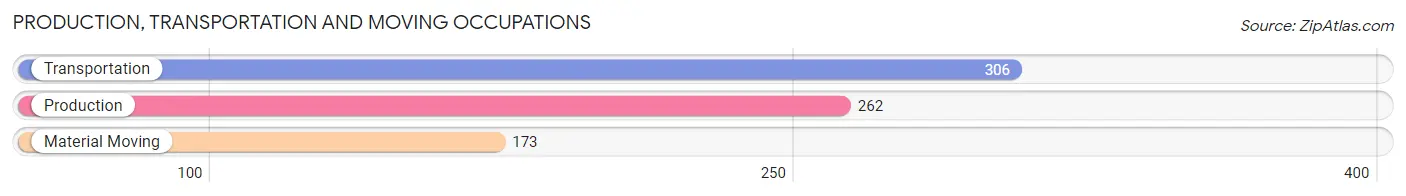
Production, Transportation and Moving Occupations
The most common Production, Transportation and Moving occupations in Pulaski County are Transportation (306 | 8.1%), Production (262 | 6.9%), and Material Moving (173 | 4.6%).
Production, Transportation and Moving Occupations by Sex
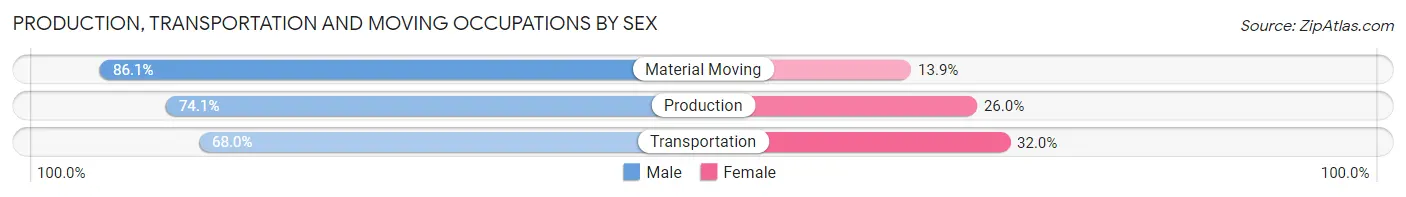
| Occupation | Male | Female |
| Production | 194 (74.1%) | 68 (26.0%) |
| Transportation | 208 (68.0%) | 98 (32.0%) |
| Material Moving | 149 (86.1%) | 24 (13.9%) |
| Total (Category) | 551 (74.4%) | 190 (25.6%) |
| Total (Overall) | 1,913 (50.5%) | 1,874 (49.5%) |
Employment Industries by Sex in Pulaski County
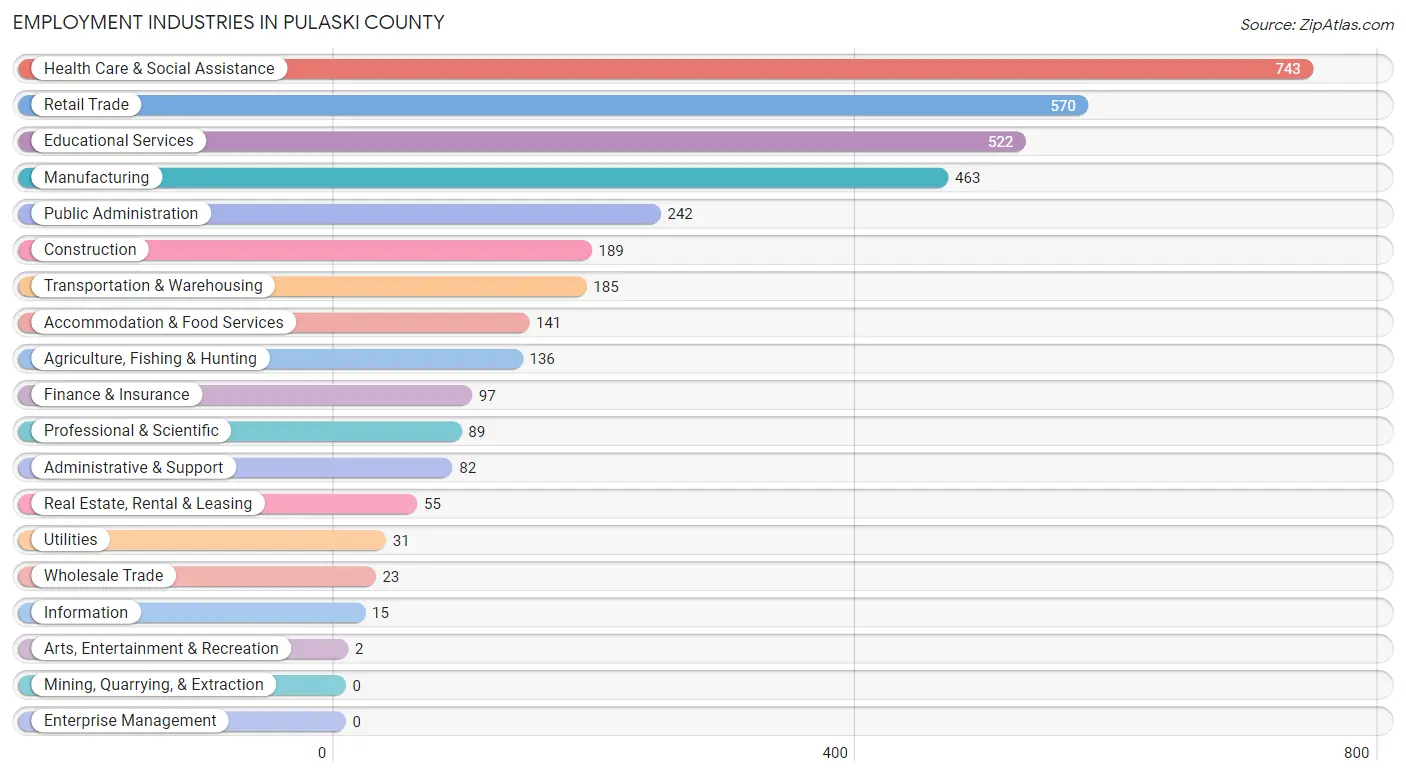
Employment Industries in Pulaski County
The major employment industries in Pulaski County include Health Care & Social Assistance (743 | 19.6%), Retail Trade (570 | 15.0%), Educational Services (522 | 13.8%), Manufacturing (463 | 12.2%), and Public Administration (242 | 6.4%).
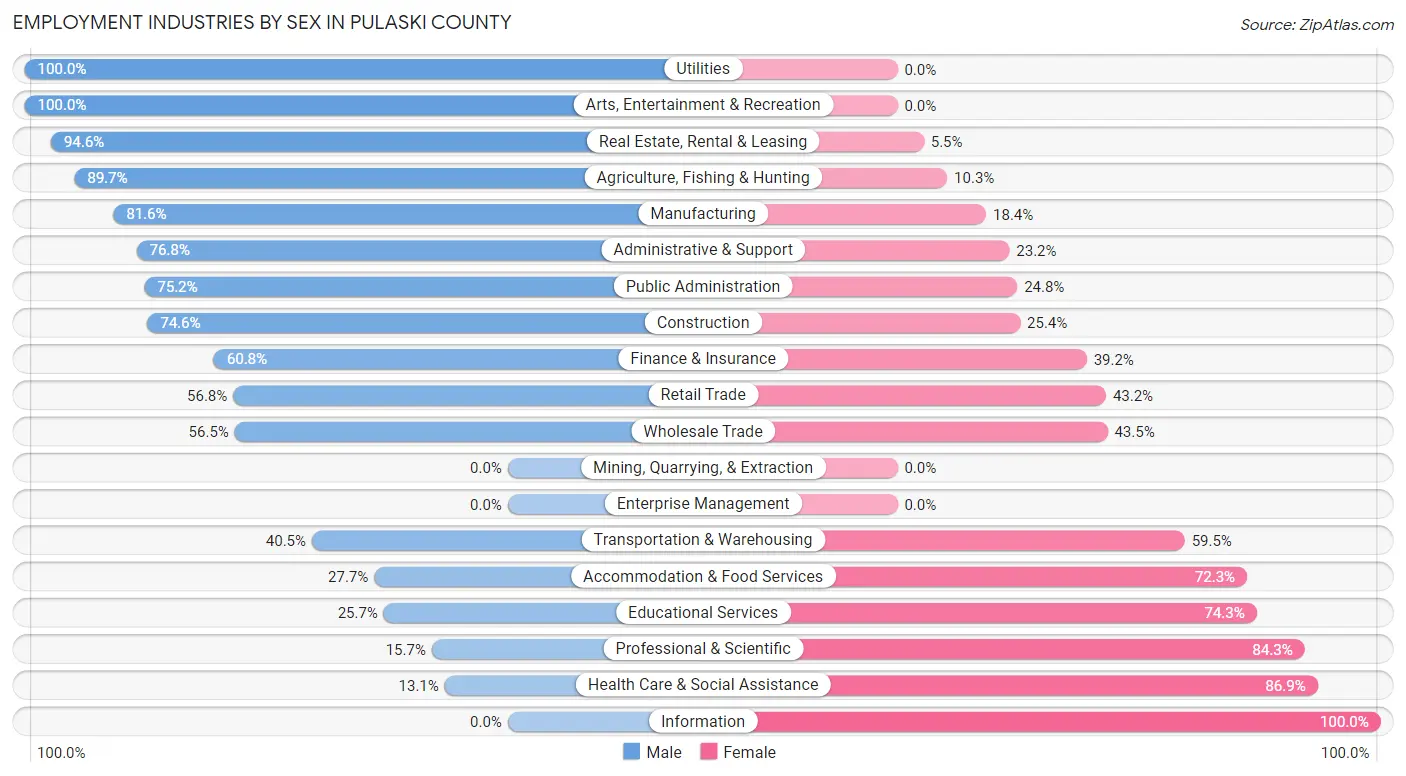
Employment Industries by Sex in Pulaski County
The Pulaski County industries that see more men than women are Utilities (100.0%), Arts, Entertainment & Recreation (100.0%), and Real Estate, Rental & Leasing (94.6%), whereas the industries that tend to have a higher number of women are Information (100.0%), Health Care & Social Assistance (86.9%), and Professional & Scientific (84.3%).
| Industry | Male | Female |
| Agriculture, Fishing & Hunting | 122 (89.7%) | 14 (10.3%) |
| Mining, Quarrying, & Extraction | 0 (0.0%) | 0 (0.0%) |
| Construction | 141 (74.6%) | 48 (25.4%) |
| Manufacturing | 378 (81.6%) | 85 (18.4%) |
| Wholesale Trade | 13 (56.5%) | 10 (43.5%) |
| Retail Trade | 324 (56.8%) | 246 (43.2%) |
| Transportation & Warehousing | 75 (40.5%) | 110 (59.5%) |
| Utilities | 31 (100.0%) | 0 (0.0%) |
| Information | 0 (0.0%) | 15 (100.0%) |
| Finance & Insurance | 59 (60.8%) | 38 (39.2%) |
| Real Estate, Rental & Leasing | 52 (94.6%) | 3 (5.4%) |
| Professional & Scientific | 14 (15.7%) | 75 (84.3%) |
| Enterprise Management | 0 (0.0%) | 0 (0.0%) |
| Administrative & Support | 63 (76.8%) | 19 (23.2%) |
| Educational Services | 134 (25.7%) | 388 (74.3%) |
| Health Care & Social Assistance | 97 (13.1%) | 646 (86.9%) |
| Arts, Entertainment & Recreation | 2 (100.0%) | 0 (0.0%) |
| Accommodation & Food Services | 39 (27.7%) | 102 (72.3%) |
| Public Administration | 182 (75.2%) | 60 (24.8%) |
| Total | 1,913 (50.5%) | 1,874 (49.5%) |
Education in Pulaski County
School Enrollment in Pulaski County
The most common levels of schooling among the 1,937 students in Pulaski County are college / undergraduate (493 | 25.5%), middle school (379 | 19.6%), and high school (376 | 19.4%).
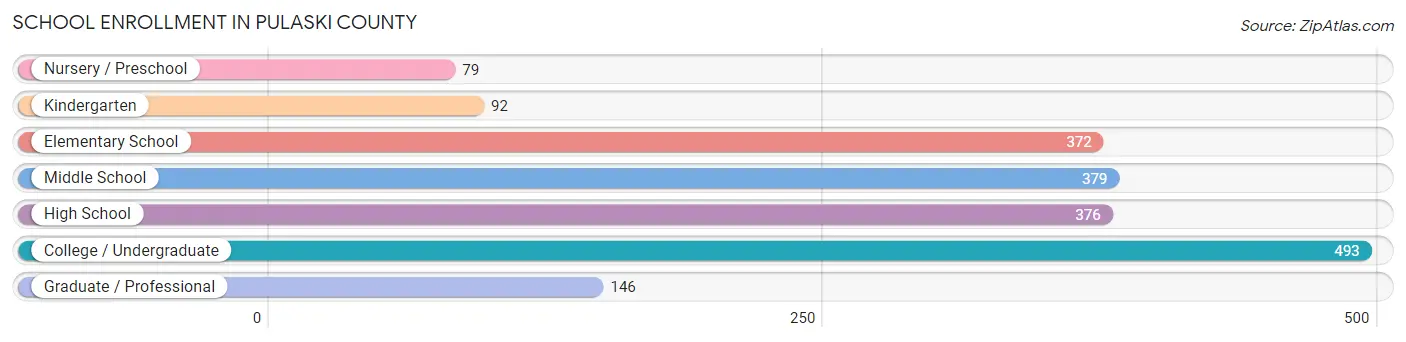
| School Level | # Students | % Students |
| Nursery / Preschool | 79 | 4.1% |
| Kindergarten | 92 | 4.8% |
| Elementary School | 372 | 19.2% |
| Middle School | 379 | 19.6% |
| High School | 376 | 19.4% |
| College / Undergraduate | 493 | 25.5% |
| Graduate / Professional | 146 | 7.5% |
| Total | 1,937 | 100.0% |
School Enrollment by Age by Funding Source in Pulaski County
Out of a total of 1,937 students who are enrolled in schools in Pulaski County, 163 (8.4%) attend a private institution, while the remaining 1,774 (91.6%) are enrolled in public schools. The age group of 35 years and over has the highest likelihood of being enrolled in private schools, with 79 (45.4% in the age bracket) enrolled. Conversely, the age group of 15 to 17 year olds has the lowest likelihood of being enrolled in a private school, with 271 (100.0% in the age bracket) attending a public institution.
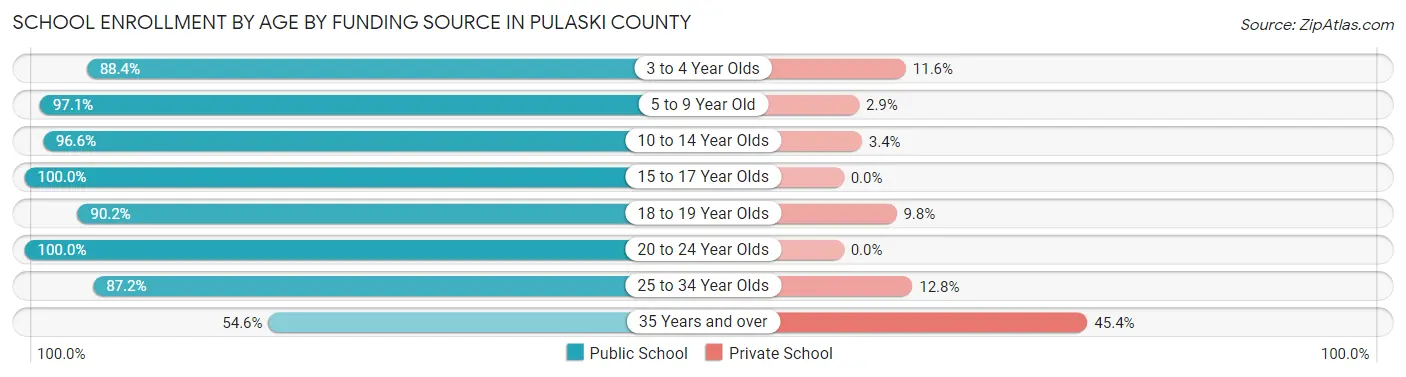
| Age Bracket | Public School | Private School |
| 3 to 4 Year Olds | 84 (88.4%) | 11 (11.6%) |
| 5 to 9 Year Old | 374 (97.1%) | 11 (2.9%) |
| 10 to 14 Year Olds | 484 (96.6%) | 17 (3.4%) |
| 15 to 17 Year Olds | 271 (100.0%) | 0 (0.0%) |
| 18 to 19 Year Olds | 55 (90.2%) | 6 (9.8%) |
| 20 to 24 Year Olds | 145 (100.0%) | 0 (0.0%) |
| 25 to 34 Year Olds | 266 (87.2%) | 39 (12.8%) |
| 35 Years and over | 95 (54.6%) | 79 (45.4%) |
| Total | 1,774 (91.6%) | 163 (8.4%) |
Educational Attainment by Field of Study in Pulaski County
Education (294 | 29.8%), business (126 | 12.8%), science & technology (125 | 12.7%), bio, nature & agricultural (88 | 8.9%), and literature & languages (69 | 7.0%) are the most common fields of study among 985 individuals in Pulaski County who have obtained a bachelor's degree or higher.
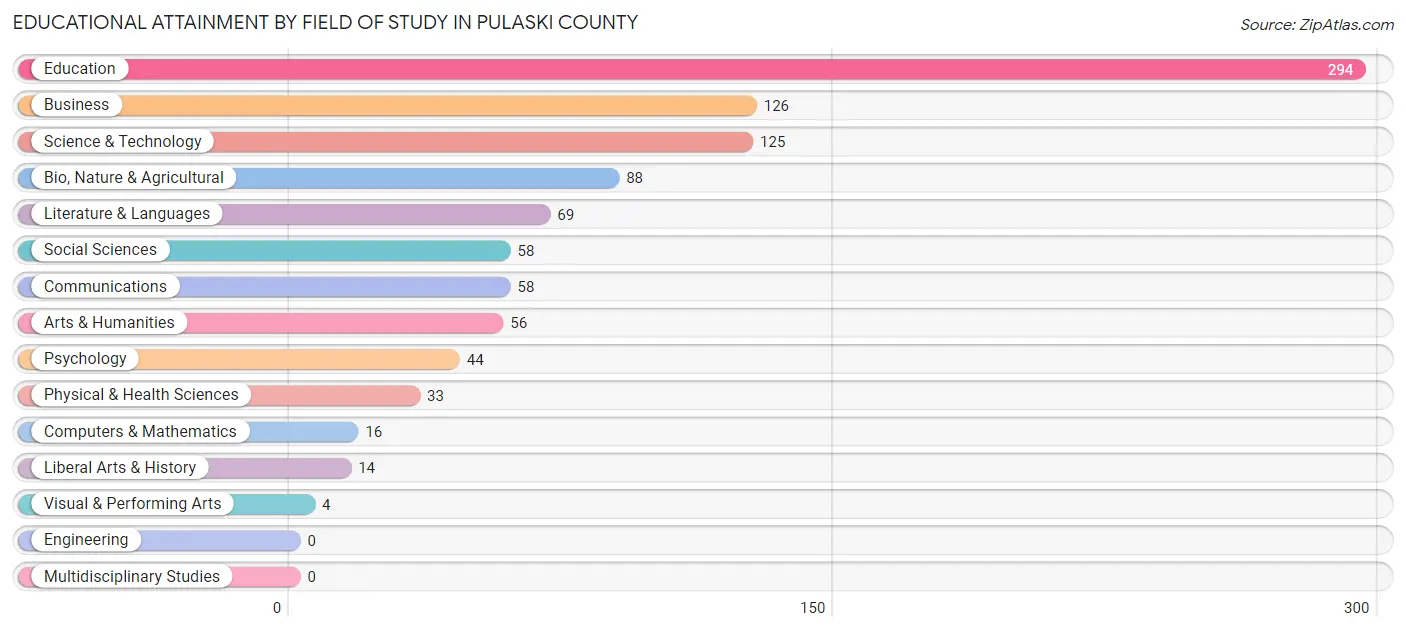
| Field of Study | # Graduates | % Graduates |
| Computers & Mathematics | 16 | 1.6% |
| Bio, Nature & Agricultural | 88 | 8.9% |
| Physical & Health Sciences | 33 | 3.4% |
| Psychology | 44 | 4.5% |
| Social Sciences | 58 | 5.9% |
| Engineering | 0 | 0.0% |
| Multidisciplinary Studies | 0 | 0.0% |
| Science & Technology | 125 | 12.7% |
| Business | 126 | 12.8% |
| Education | 294 | 29.8% |
| Literature & Languages | 69 | 7.0% |
| Liberal Arts & History | 14 | 1.4% |
| Visual & Performing Arts | 4 | 0.4% |
| Communications | 58 | 5.9% |
| Arts & Humanities | 56 | 5.7% |
| Total | 985 | 100.0% |
Transportation & Commute in Pulaski County
Vehicle Availability by Sex in Pulaski County
The most prevalent vehicle ownership categories in Pulaski County are males with 2 vehicles (556, accounting for 29.8%) and females with 2 vehicles (379, making up 33.0%).
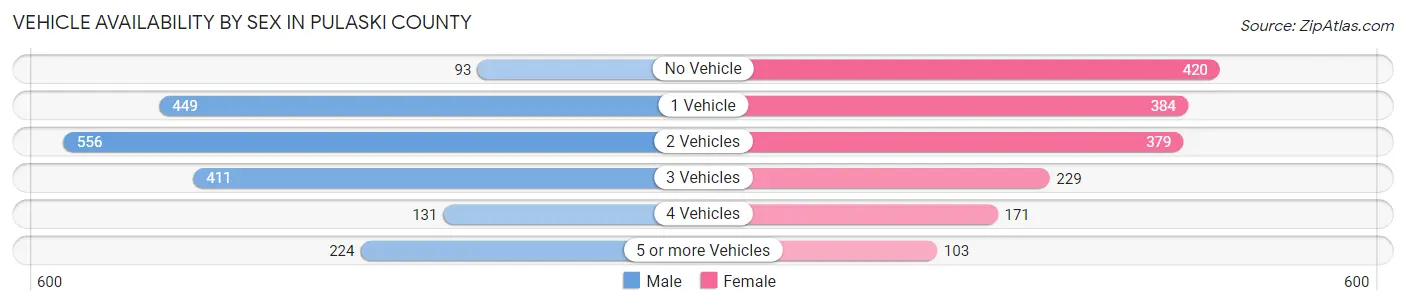
| Vehicles Available | Male | Female |
| No Vehicle | 93 (5.0%) | 420 (24.9%) |
| 1 Vehicle | 449 (24.1%) | 384 (22.8%) |
| 2 Vehicles | 556 (29.8%) | 379 (22.5%) |
| 3 Vehicles | 411 (22.1%) | 229 (13.6%) |
| 4 Vehicles | 131 (7.0%) | 171 (10.1%) |
| 5 or more Vehicles | 224 (12.0%) | 103 (6.1%) |
| Total | 1,864 (100.0%) | 1,686 (100.0%) |
Commute Time in Pulaski County
The most frequently occuring commute durations in Pulaski County are 10 to 14 minutes (631 commuters, 18.1%), 45 to 59 minutes (506 commuters, 14.5%), and 5 to 9 minutes (410 commuters, 11.8%).
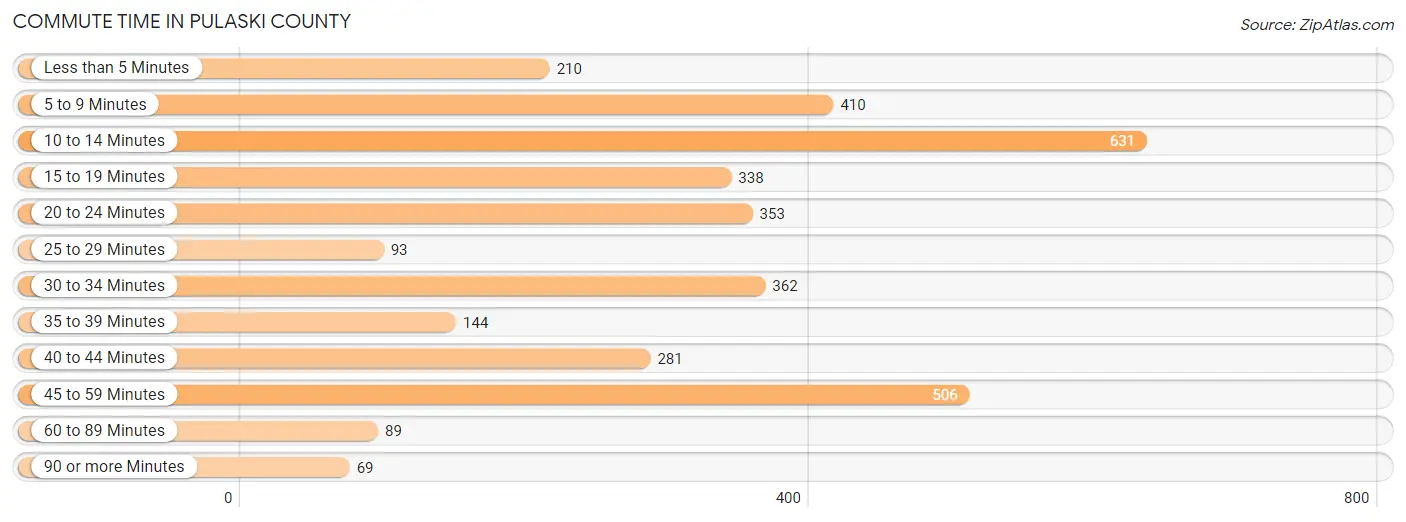
| Commute Time | # Commuters | % Commuters |
| Less than 5 Minutes | 210 | 6.0% |
| 5 to 9 Minutes | 410 | 11.8% |
| 10 to 14 Minutes | 631 | 18.1% |
| 15 to 19 Minutes | 338 | 9.7% |
| 20 to 24 Minutes | 353 | 10.1% |
| 25 to 29 Minutes | 93 | 2.7% |
| 30 to 34 Minutes | 362 | 10.4% |
| 35 to 39 Minutes | 144 | 4.1% |
| 40 to 44 Minutes | 281 | 8.1% |
| 45 to 59 Minutes | 506 | 14.5% |
| 60 to 89 Minutes | 89 | 2.5% |
| 90 or more Minutes | 69 | 2.0% |
Commute Time by Sex in Pulaski County
The most common commute times in Pulaski County are 45 to 59 minutes (466 commuters, 24.9%) for males and 10 to 14 minutes (456 commuters, 28.2%) for females.
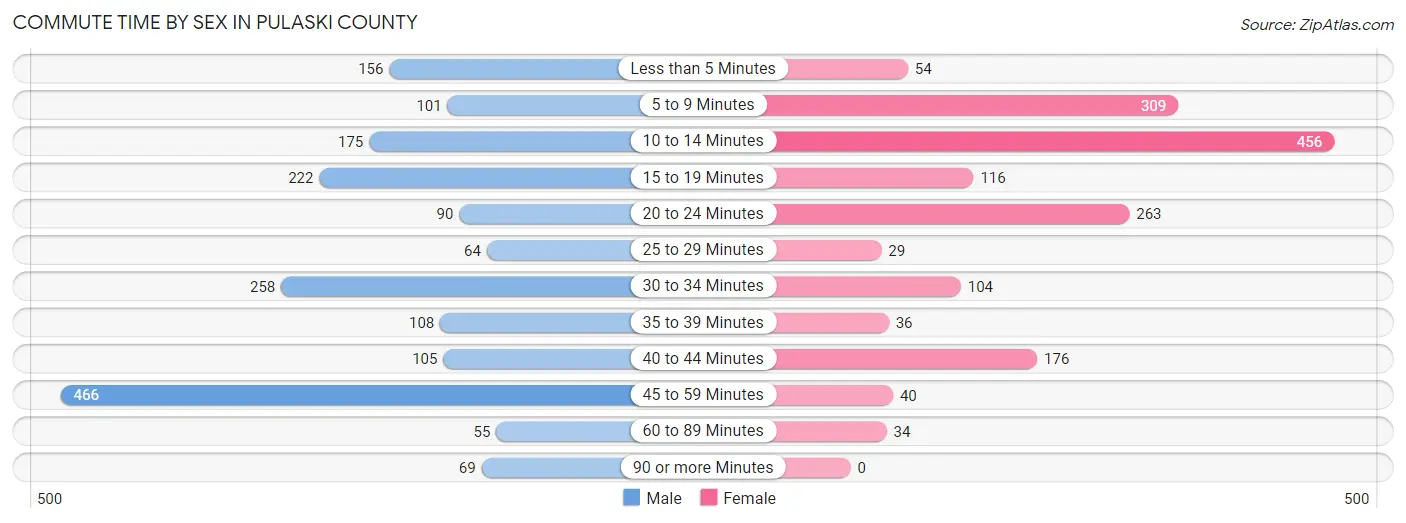
| Commute Time | Male | Female |
| Less than 5 Minutes | 156 (8.4%) | 54 (3.3%) |
| 5 to 9 Minutes | 101 (5.4%) | 309 (19.1%) |
| 10 to 14 Minutes | 175 (9.4%) | 456 (28.2%) |
| 15 to 19 Minutes | 222 (11.9%) | 116 (7.2%) |
| 20 to 24 Minutes | 90 (4.8%) | 263 (16.3%) |
| 25 to 29 Minutes | 64 (3.4%) | 29 (1.8%) |
| 30 to 34 Minutes | 258 (13.8%) | 104 (6.4%) |
| 35 to 39 Minutes | 108 (5.8%) | 36 (2.2%) |
| 40 to 44 Minutes | 105 (5.6%) | 176 (10.9%) |
| 45 to 59 Minutes | 466 (24.9%) | 40 (2.5%) |
| 60 to 89 Minutes | 55 (2.9%) | 34 (2.1%) |
| 90 or more Minutes | 69 (3.7%) | 0 (0.0%) |
Time of Departure to Work by Sex in Pulaski County
The most frequent times of departure to work in Pulaski County are 7:00 AM to 7:29 AM (354, 18.9%) for males and 7:30 AM to 7:59 AM (634, 39.2%) for females.
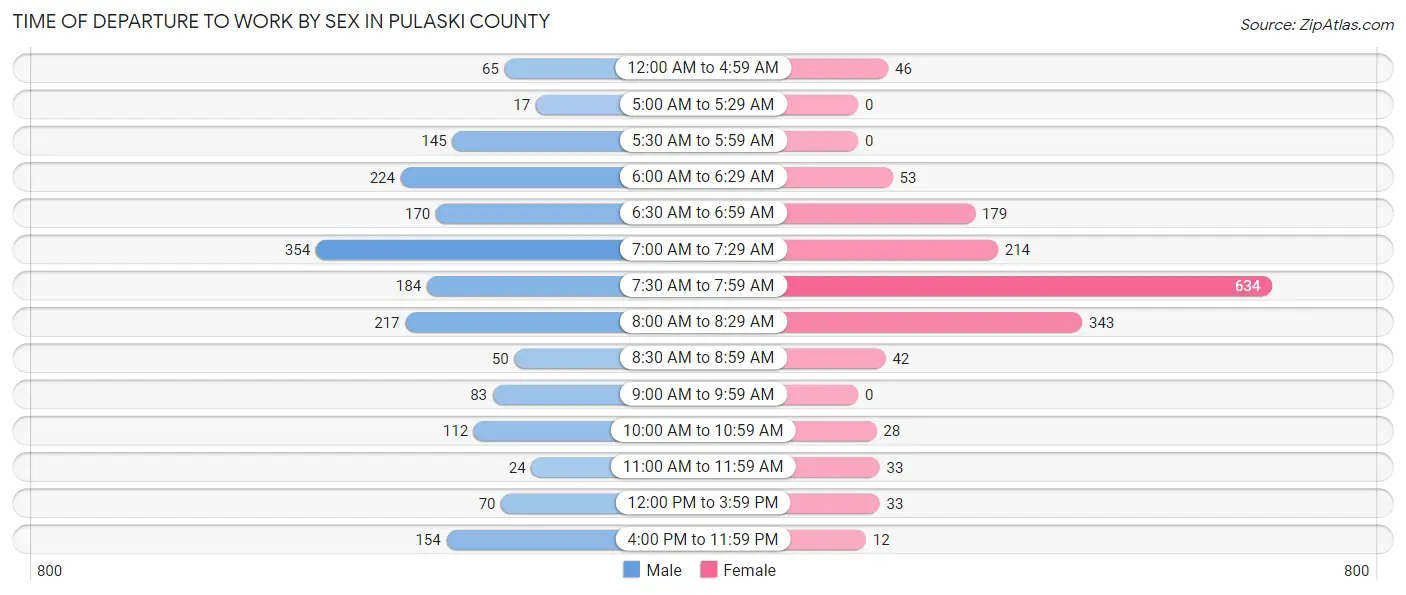
| Time of Departure | Male | Female |
| 12:00 AM to 4:59 AM | 65 (3.5%) | 46 (2.8%) |
| 5:00 AM to 5:29 AM | 17 (0.9%) | 0 (0.0%) |
| 5:30 AM to 5:59 AM | 145 (7.8%) | 0 (0.0%) |
| 6:00 AM to 6:29 AM | 224 (12.0%) | 53 (3.3%) |
| 6:30 AM to 6:59 AM | 170 (9.1%) | 179 (11.1%) |
| 7:00 AM to 7:29 AM | 354 (18.9%) | 214 (13.2%) |
| 7:30 AM to 7:59 AM | 184 (9.8%) | 634 (39.2%) |
| 8:00 AM to 8:29 AM | 217 (11.6%) | 343 (21.2%) |
| 8:30 AM to 8:59 AM | 50 (2.7%) | 42 (2.6%) |
| 9:00 AM to 9:59 AM | 83 (4.4%) | 0 (0.0%) |
| 10:00 AM to 10:59 AM | 112 (6.0%) | 28 (1.7%) |
| 11:00 AM to 11:59 AM | 24 (1.3%) | 33 (2.0%) |
| 12:00 PM to 3:59 PM | 70 (3.7%) | 33 (2.0%) |
| 4:00 PM to 11:59 PM | 154 (8.2%) | 12 (0.7%) |
| Total | 1,869 (100.0%) | 1,617 (100.0%) |
Housing Occupancy in Pulaski County
Occupancy by Ownership in Pulaski County
Of the total 3,117 dwellings in Pulaski County, owner-occupied units account for 2,011 (64.5%), while renter-occupied units make up 1,106 (35.5%).
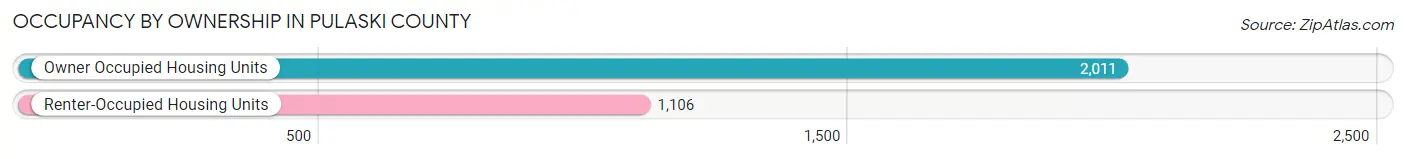
| Occupancy | # Housing Units | % Housing Units |
| Owner Occupied Housing Units | 2,011 | 64.5% |
| Renter-Occupied Housing Units | 1,106 | 35.5% |
| Total Occupied Housing Units | 3,117 | 100.0% |
Occupancy by Household Size in Pulaski County
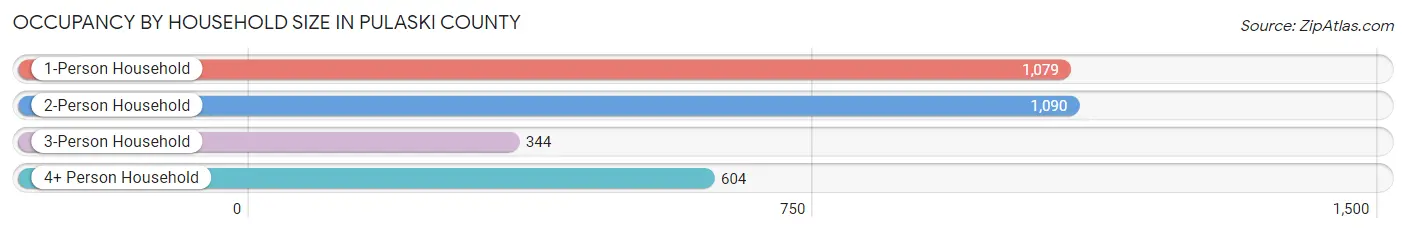
| Household Size | # Housing Units | % Housing Units |
| 1-Person Household | 1,079 | 34.6% |
| 2-Person Household | 1,090 | 35.0% |
| 3-Person Household | 344 | 11.0% |
| 4+ Person Household | 604 | 19.4% |
| Total Housing Units | 3,117 | 100.0% |
Occupancy by Ownership by Household Size in Pulaski County
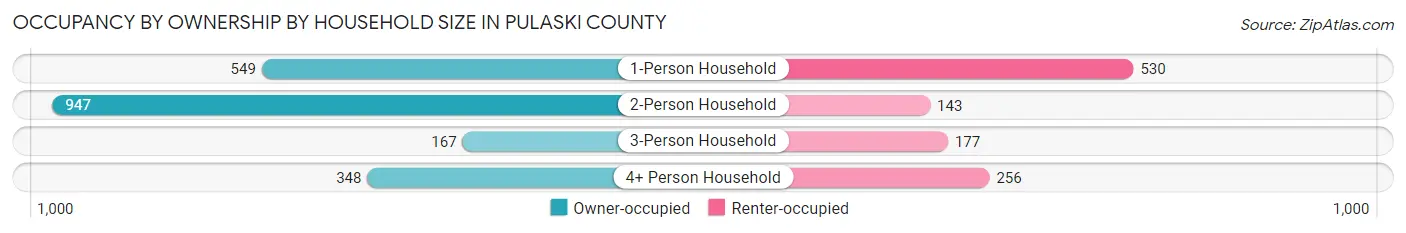
| Household Size | Owner-occupied | Renter-occupied |
| 1-Person Household | 549 (50.9%) | 530 (49.1%) |
| 2-Person Household | 947 (86.9%) | 143 (13.1%) |
| 3-Person Household | 167 (48.5%) | 177 (51.4%) |
| 4+ Person Household | 348 (57.6%) | 256 (42.4%) |
| Total Housing Units | 2,011 (64.5%) | 1,106 (35.5%) |
Occupancy by Educational Attainment in Pulaski County
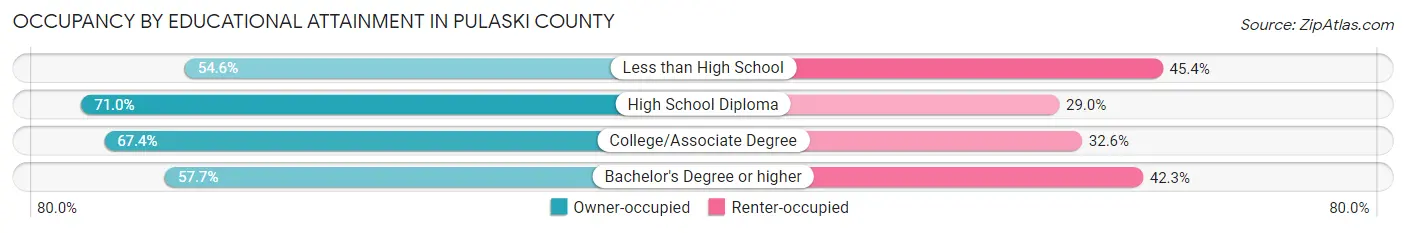
| Household Size | Owner-occupied | Renter-occupied |
| Less than High School | 316 (54.6%) | 263 (45.4%) |
| High School Diploma | 715 (71.0%) | 292 (29.0%) |
| College/Associate Degree | 673 (67.4%) | 326 (32.6%) |
| Bachelor's Degree or higher | 307 (57.7%) | 225 (42.3%) |
Occupancy by Age of Householder in Pulaski County
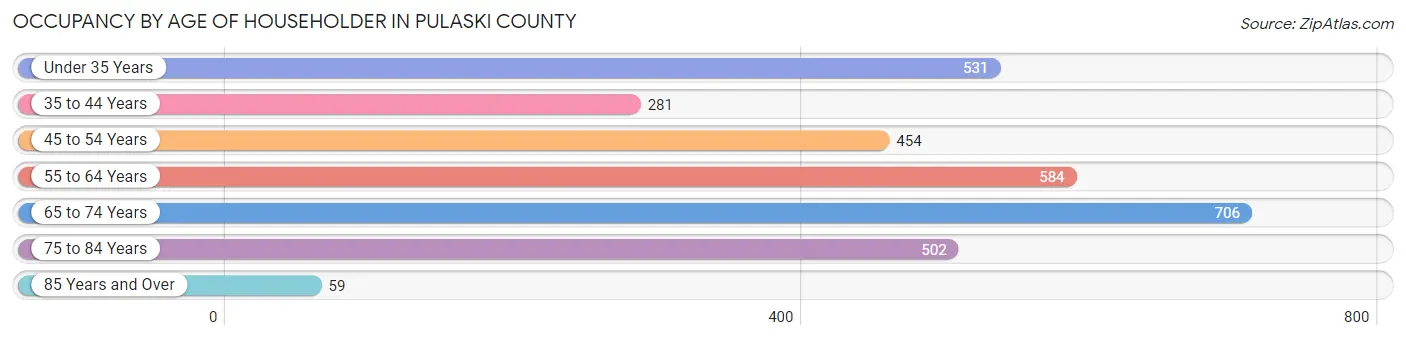
| Age Bracket | # Households | % Households |
| Under 35 Years | 531 | 17.0% |
| 35 to 44 Years | 281 | 9.0% |
| 45 to 54 Years | 454 | 14.6% |
| 55 to 64 Years | 584 | 18.7% |
| 65 to 74 Years | 706 | 22.7% |
| 75 to 84 Years | 502 | 16.1% |
| 85 Years and Over | 59 | 1.9% |
| Total | 3,117 | 100.0% |
Housing Finances in Pulaski County
Median Income by Occupancy in Pulaski County
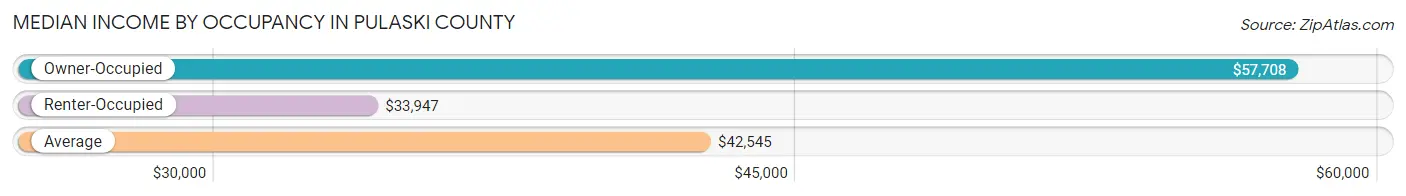
| Occupancy Type | # Households | Median Income |
| Owner-Occupied | 2,011 (64.5%) | $57,708 |
| Renter-Occupied | 1,106 (35.5%) | $33,947 |
| Average | 3,117 (100.0%) | $42,545 |
Occupancy by Householder Income Bracket in Pulaski County
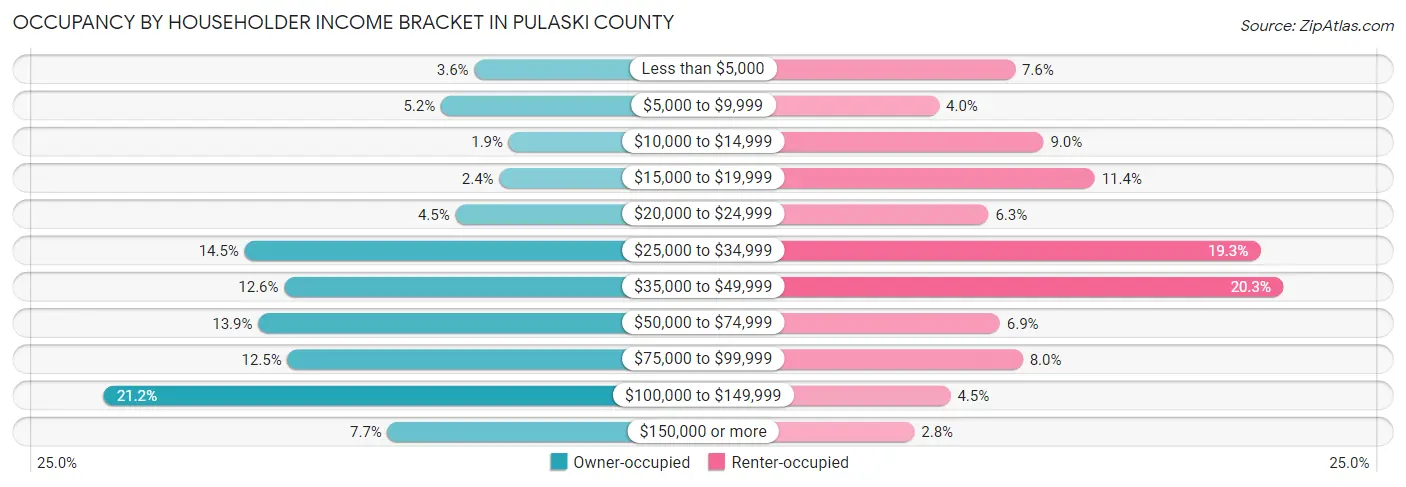
| Income Bracket | Owner-occupied | Renter-occupied |
| Less than $5,000 | 72 (3.6%) | 84 (7.6%) |
| $5,000 to $9,999 | 104 (5.2%) | 44 (4.0%) |
| $10,000 to $14,999 | 39 (1.9%) | 99 (8.9%) |
| $15,000 to $19,999 | 48 (2.4%) | 126 (11.4%) |
| $20,000 to $24,999 | 90 (4.5%) | 70 (6.3%) |
| $25,000 to $34,999 | 292 (14.5%) | 213 (19.3%) |
| $35,000 to $49,999 | 254 (12.6%) | 225 (20.3%) |
| $50,000 to $74,999 | 279 (13.9%) | 76 (6.9%) |
| $75,000 to $99,999 | 251 (12.5%) | 88 (8.0%) |
| $100,000 to $149,999 | 427 (21.2%) | 50 (4.5%) |
| $150,000 or more | 155 (7.7%) | 31 (2.8%) |
| Total | 2,011 (100.0%) | 1,106 (100.0%) |
Monthly Housing Cost Tiers in Pulaski County
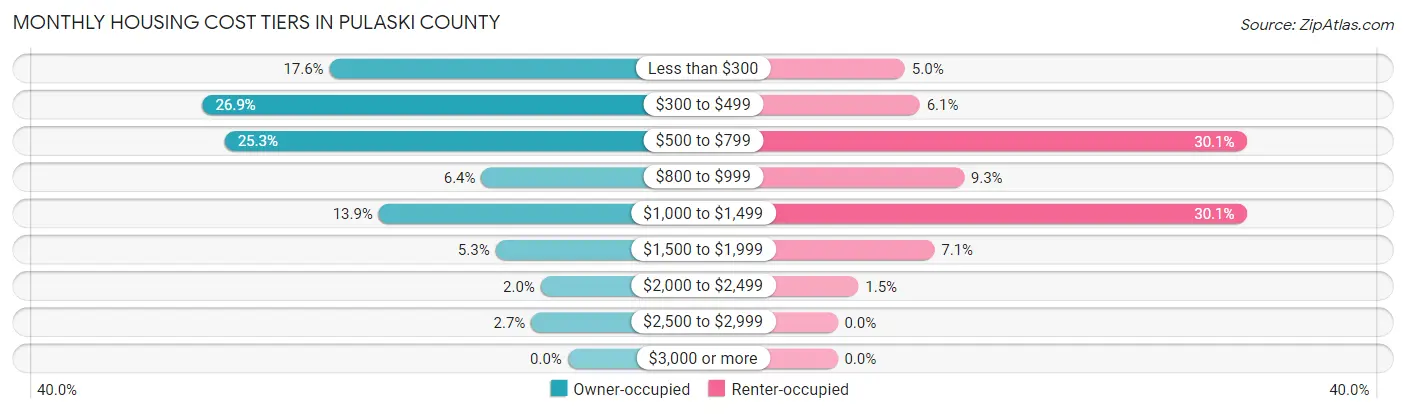
| Monthly Cost | Owner-occupied | Renter-occupied |
| Less than $300 | 353 (17.5%) | 55 (5.0%) |
| $300 to $499 | 541 (26.9%) | 67 (6.1%) |
| $500 to $799 | 508 (25.3%) | 333 (30.1%) |
| $800 to $999 | 128 (6.4%) | 103 (9.3%) |
| $1,000 to $1,499 | 280 (13.9%) | 333 (30.1%) |
| $1,500 to $1,999 | 107 (5.3%) | 79 (7.1%) |
| $2,000 to $2,499 | 40 (2.0%) | 17 (1.5%) |
| $2,500 to $2,999 | 54 (2.7%) | 0 (0.0%) |
| $3,000 or more | 0 (0.0%) | 0 (0.0%) |
| Total | 2,011 (100.0%) | 1,106 (100.0%) |
Physical Housing Characteristics in Pulaski County
Housing Structures in Pulaski County
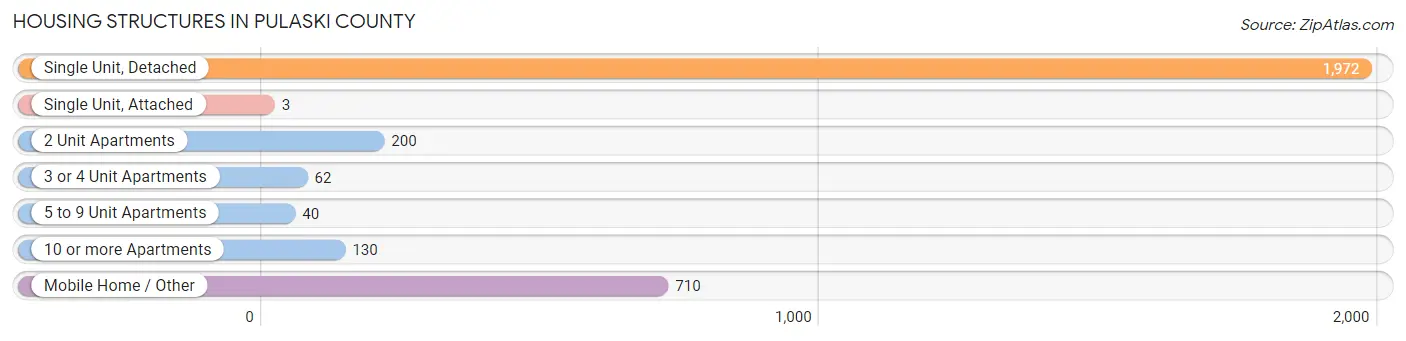
| Structure Type | # Housing Units | % Housing Units |
| Single Unit, Detached | 1,972 | 63.3% |
| Single Unit, Attached | 3 | 0.1% |
| 2 Unit Apartments | 200 | 6.4% |
| 3 or 4 Unit Apartments | 62 | 2.0% |
| 5 to 9 Unit Apartments | 40 | 1.3% |
| 10 or more Apartments | 130 | 4.2% |
| Mobile Home / Other | 710 | 22.8% |
| Total | 3,117 | 100.0% |
Housing Structures by Occupancy in Pulaski County
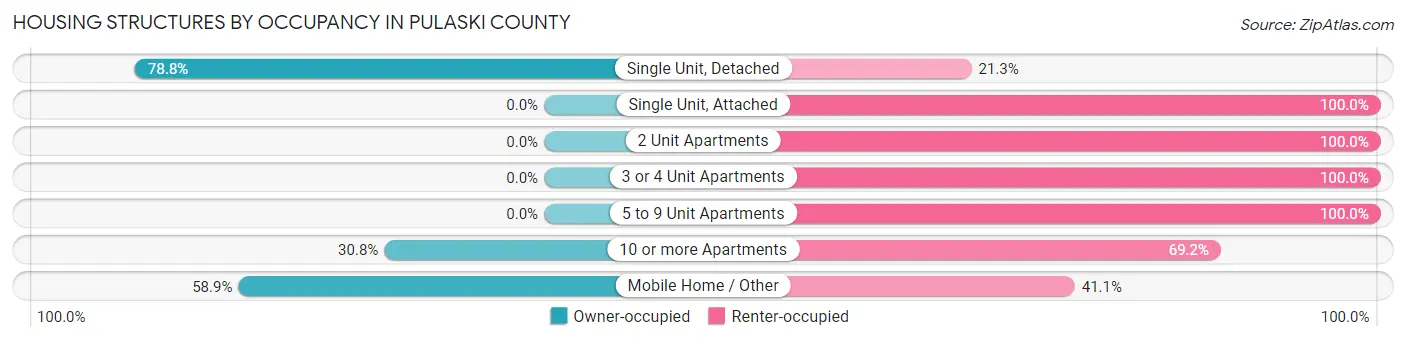
| Structure Type | Owner-occupied | Renter-occupied |
| Single Unit, Detached | 1,553 (78.7%) | 419 (21.2%) |
| Single Unit, Attached | 0 (0.0%) | 3 (100.0%) |
| 2 Unit Apartments | 0 (0.0%) | 200 (100.0%) |
| 3 or 4 Unit Apartments | 0 (0.0%) | 62 (100.0%) |
| 5 to 9 Unit Apartments | 0 (0.0%) | 40 (100.0%) |
| 10 or more Apartments | 40 (30.8%) | 90 (69.2%) |
| Mobile Home / Other | 418 (58.9%) | 292 (41.1%) |
| Total | 2,011 (64.5%) | 1,106 (35.5%) |
Housing Structures by Number of Rooms in Pulaski County
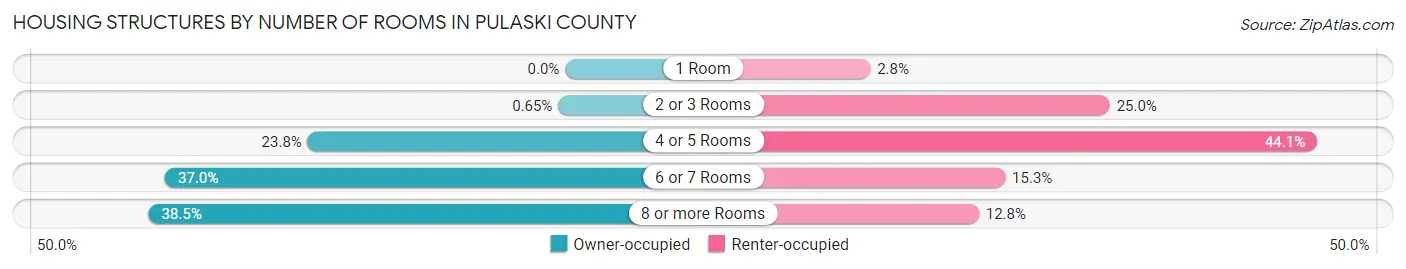
| Number of Rooms | Owner-occupied | Renter-occupied |
| 1 Room | 0 (0.0%) | 31 (2.8%) |
| 2 or 3 Rooms | 13 (0.6%) | 276 (24.9%) |
| 4 or 5 Rooms | 479 (23.8%) | 488 (44.1%) |
| 6 or 7 Rooms | 744 (37.0%) | 169 (15.3%) |
| 8 or more Rooms | 775 (38.5%) | 142 (12.8%) |
| Total | 2,011 (100.0%) | 1,106 (100.0%) |
Housing Structure by Heating Type in Pulaski County
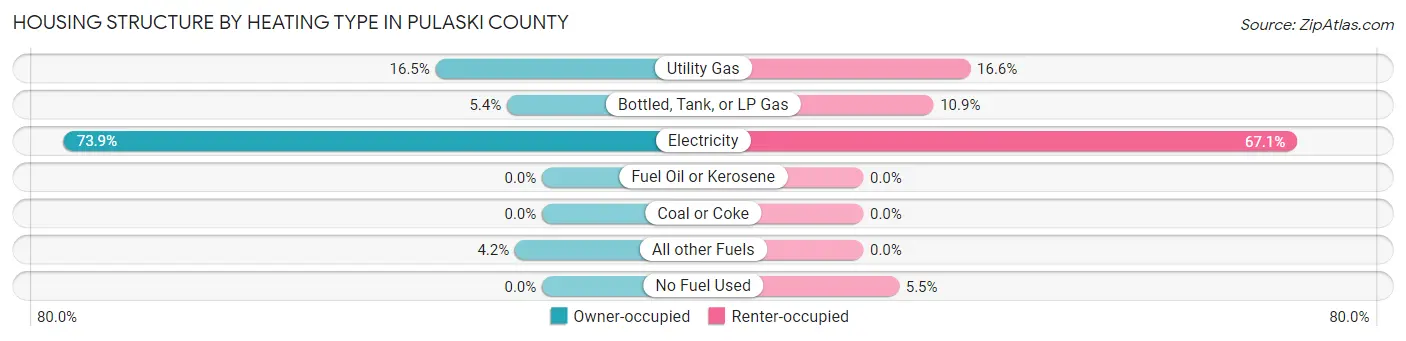
| Heating Type | Owner-occupied | Renter-occupied |
| Utility Gas | 331 (16.5%) | 183 (16.6%) |
| Bottled, Tank, or LP Gas | 109 (5.4%) | 120 (10.8%) |
| Electricity | 1,487 (73.9%) | 742 (67.1%) |
| Fuel Oil or Kerosene | 0 (0.0%) | 0 (0.0%) |
| Coal or Coke | 0 (0.0%) | 0 (0.0%) |
| All other Fuels | 84 (4.2%) | 0 (0.0%) |
| No Fuel Used | 0 (0.0%) | 61 (5.5%) |
| Total | 2,011 (100.0%) | 1,106 (100.0%) |
Household Vehicle Usage in Pulaski County
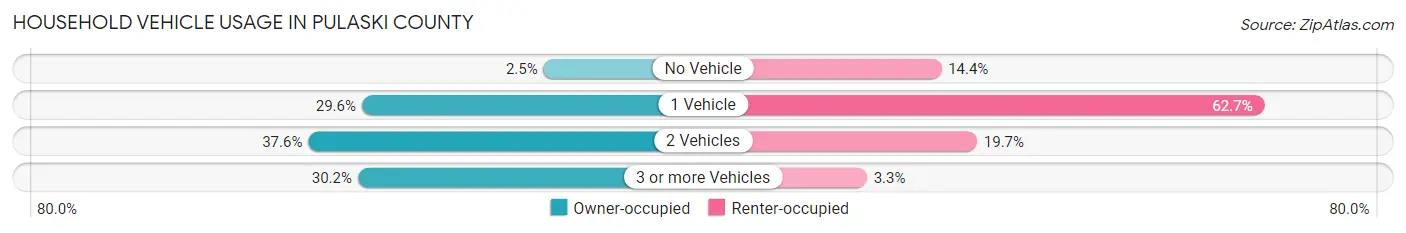
| Vehicles per Household | Owner-occupied | Renter-occupied |
| No Vehicle | 50 (2.5%) | 159 (14.4%) |
| 1 Vehicle | 596 (29.6%) | 693 (62.7%) |
| 2 Vehicles | 757 (37.6%) | 218 (19.7%) |
| 3 or more Vehicles | 608 (30.2%) | 36 (3.3%) |
| Total | 2,011 (100.0%) | 1,106 (100.0%) |
Real Estate & Mortgages in Pulaski County
Real Estate and Mortgage Overview in Pulaski County
| Characteristic | Without Mortgage | With Mortgage |
| Housing Units | 1,336 | 675 |
| Median Property Value | $108,700 | $135,300 |
| Median Household Income | $49,684 | $54 |
| Monthly Housing Costs | $429 | $0 |
| Real Estate Taxes | $1,009 | $0 |
Property Value by Mortgage Status in Pulaski County
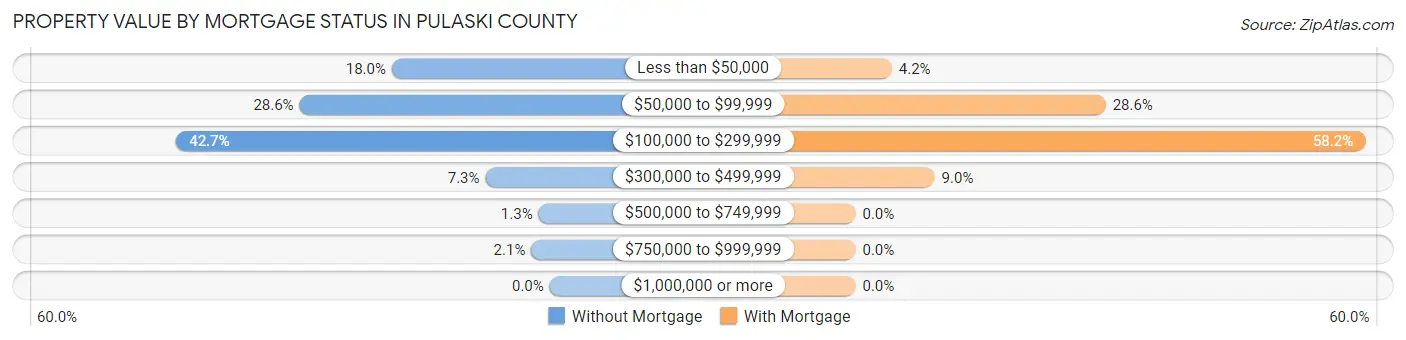
| Property Value | Without Mortgage | With Mortgage |
| Less than $50,000 | 241 (18.0%) | 28 (4.2%) |
| $50,000 to $99,999 | 382 (28.6%) | 193 (28.6%) |
| $100,000 to $299,999 | 570 (42.7%) | 393 (58.2%) |
| $300,000 to $499,999 | 98 (7.3%) | 61 (9.0%) |
| $500,000 to $749,999 | 17 (1.3%) | 0 (0.0%) |
| $750,000 to $999,999 | 28 (2.1%) | 0 (0.0%) |
| $1,000,000 or more | 0 (0.0%) | 0 (0.0%) |
| Total | 1,336 (100.0%) | 675 (100.0%) |
Household Income by Mortgage Status in Pulaski County
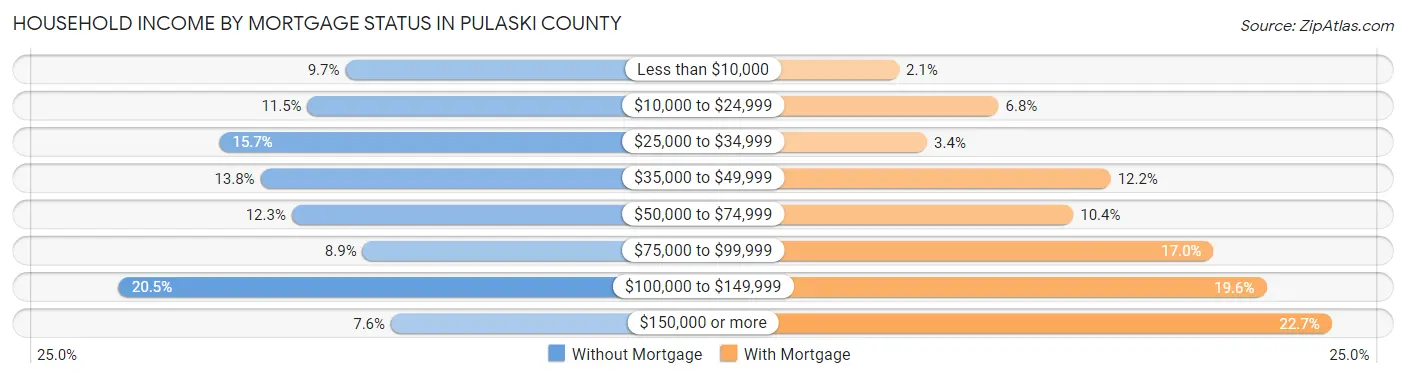
| Household Income | Without Mortgage | With Mortgage |
| Less than $10,000 | 130 (9.7%) | 14 (2.1%) |
| $10,000 to $24,999 | 154 (11.5%) | 46 (6.8%) |
| $25,000 to $34,999 | 210 (15.7%) | 23 (3.4%) |
| $35,000 to $49,999 | 184 (13.8%) | 82 (12.1%) |
| $50,000 to $74,999 | 164 (12.3%) | 70 (10.4%) |
| $75,000 to $99,999 | 119 (8.9%) | 115 (17.0%) |
| $100,000 to $149,999 | 274 (20.5%) | 132 (19.6%) |
| $150,000 or more | 101 (7.6%) | 153 (22.7%) |
| Total | 1,336 (100.0%) | 675 (100.0%) |
Property Value to Household Income Ratio in Pulaski County
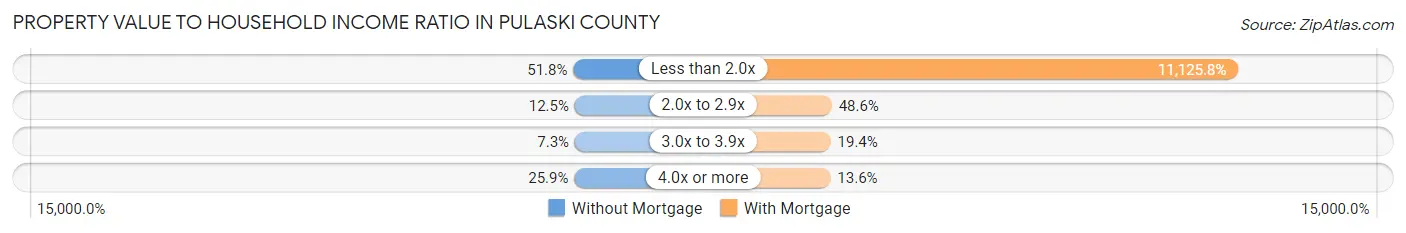
| Value-to-Income Ratio | Without Mortgage | With Mortgage |
| Less than 2.0x | 692 (51.8%) | 75,099 (11,125.8%) |
| 2.0x to 2.9x | 167 (12.5%) | 328 (48.6%) |
| 3.0x to 3.9x | 97 (7.3%) | 131 (19.4%) |
| 4.0x or more | 346 (25.9%) | 92 (13.6%) |
| Total | 1,336 (100.0%) | 675 (100.0%) |
Real Estate Taxes by Mortgage Status in Pulaski County
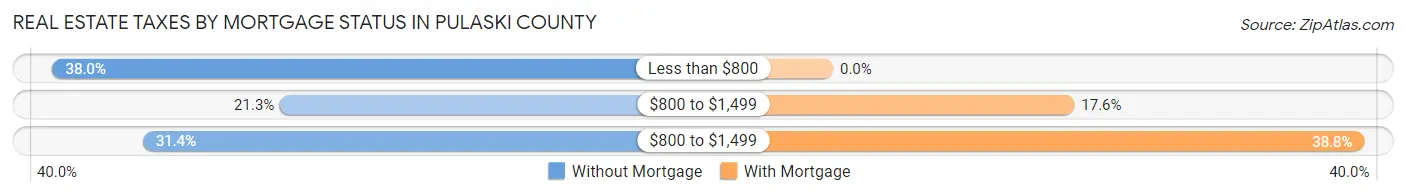
| Property Taxes | Without Mortgage | With Mortgage |
| Less than $800 | 507 (38.0%) | 0 (0.0%) |
| $800 to $1,499 | 285 (21.3%) | 119 (17.6%) |
| $800 to $1,499 | 419 (31.4%) | 262 (38.8%) |
| Total | 1,336 (100.0%) | 675 (100.0%) |
Health & Disability in Pulaski County
Health Insurance Coverage by Age in Pulaski County
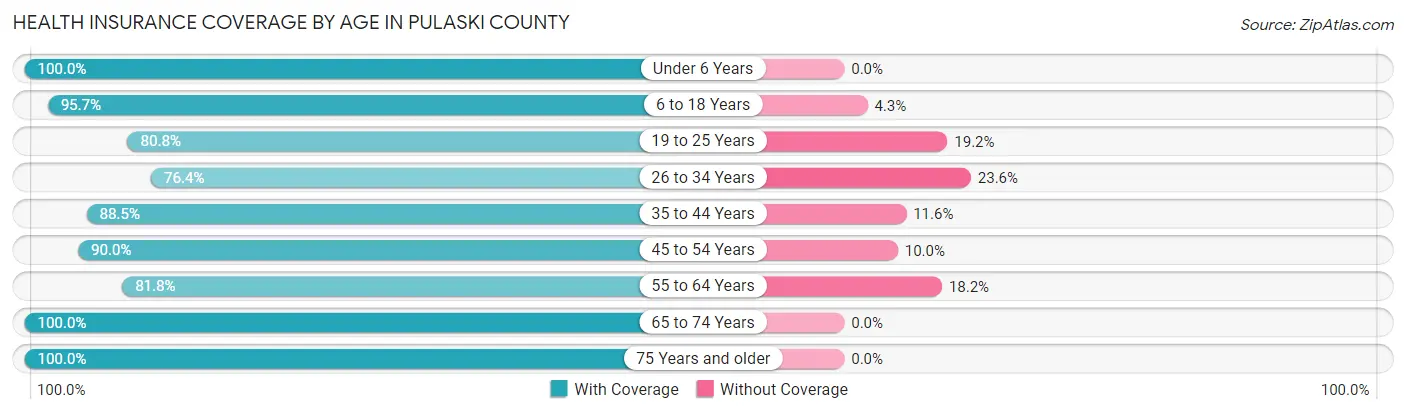
| Age Bracket | With Coverage | Without Coverage |
| Under 6 Years | 751 (100.0%) | 0 (0.0%) |
| 6 to 18 Years | 1,129 (95.7%) | 51 (4.3%) |
| 19 to 25 Years | 517 (80.8%) | 123 (19.2%) |
| 26 to 34 Years | 958 (76.4%) | 296 (23.6%) |
| 35 to 44 Years | 536 (88.4%) | 70 (11.6%) |
| 45 to 54 Years | 938 (90.0%) | 104 (10.0%) |
| 55 to 64 Years | 894 (81.8%) | 199 (18.2%) |
| 65 to 74 Years | 1,140 (100.0%) | 0 (0.0%) |
| 75 Years and older | 904 (100.0%) | 0 (0.0%) |
| Total | 7,767 (90.2%) | 843 (9.8%) |
Health Insurance Coverage by Citizenship Status in Pulaski County
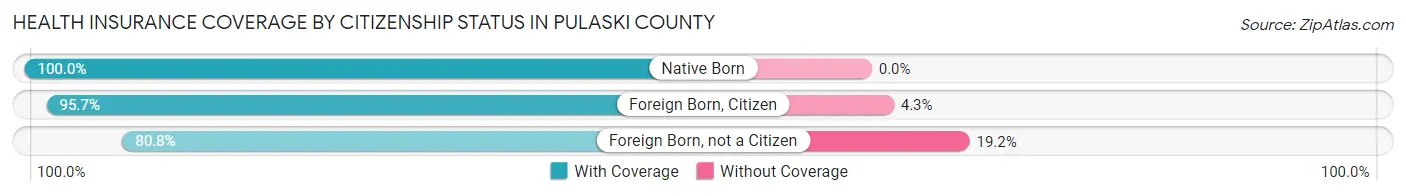
| Citizenship Status | With Coverage | Without Coverage |
| Native Born | 751 (100.0%) | 0 (0.0%) |
| Foreign Born, Citizen | 1,129 (95.7%) | 51 (4.3%) |
| Foreign Born, not a Citizen | 517 (80.8%) | 123 (19.2%) |
Health Insurance Coverage by Household Income in Pulaski County
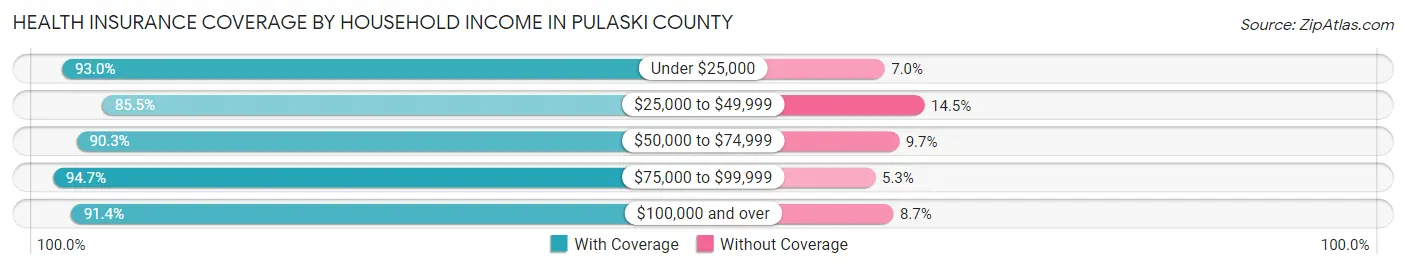
| Household Income | With Coverage | Without Coverage |
| Under $25,000 | 1,311 (93.0%) | 99 (7.0%) |
| $25,000 to $49,999 | 2,102 (85.5%) | 356 (14.5%) |
| $50,000 to $74,999 | 771 (90.3%) | 83 (9.7%) |
| $75,000 to $99,999 | 860 (94.7%) | 48 (5.3%) |
| $100,000 and over | 2,702 (91.3%) | 256 (8.6%) |
Public vs Private Health Insurance Coverage by Age in Pulaski County
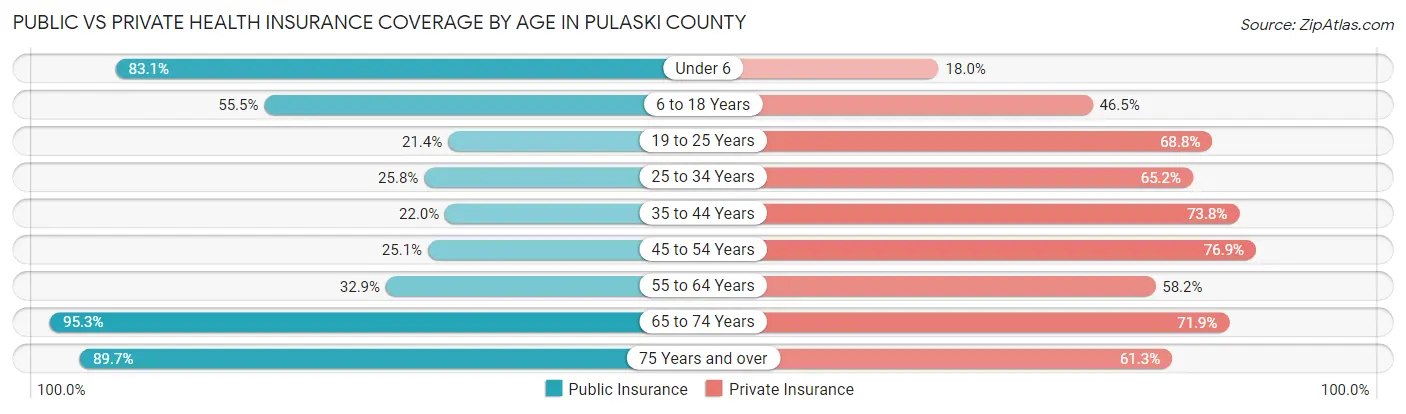
| Age Bracket | Public Insurance | Private Insurance |
| Under 6 | 624 (83.1%) | 135 (18.0%) |
| 6 to 18 Years | 655 (55.5%) | 549 (46.5%) |
| 19 to 25 Years | 137 (21.4%) | 440 (68.8%) |
| 25 to 34 Years | 324 (25.8%) | 817 (65.1%) |
| 35 to 44 Years | 133 (22.0%) | 447 (73.8%) |
| 45 to 54 Years | 262 (25.1%) | 801 (76.9%) |
| 55 to 64 Years | 360 (32.9%) | 636 (58.2%) |
| 65 to 74 Years | 1,086 (95.3%) | 820 (71.9%) |
| 75 Years and over | 811 (89.7%) | 554 (61.3%) |
| Total | 4,392 (51.0%) | 5,199 (60.4%) |
Disability Status by Sex by Age in Pulaski County
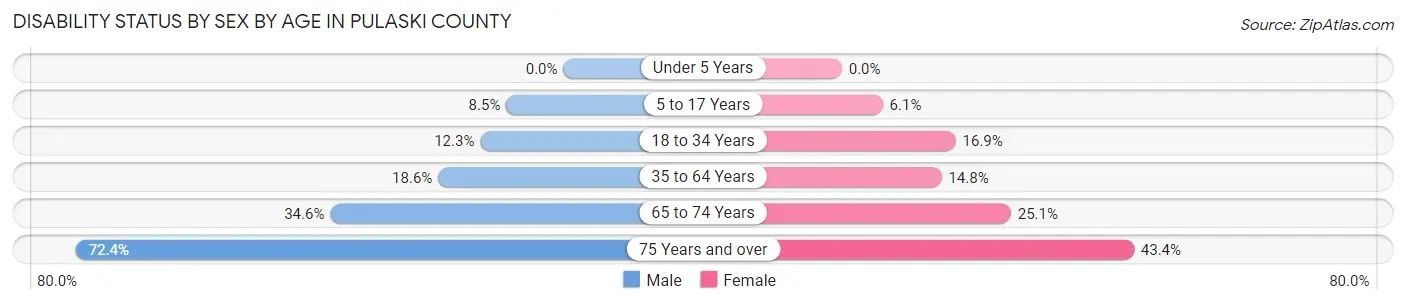
| Age Bracket | Male | Female |
| Under 5 Years | 0 (0.0%) | 0 (0.0%) |
| 5 to 17 Years | 59 (8.5%) | 28 (6.1%) |
| 18 to 34 Years | 125 (12.3%) | 159 (16.9%) |
| 35 to 64 Years | 222 (18.6%) | 229 (14.8%) |
| 65 to 74 Years | 207 (34.6%) | 136 (25.1%) |
| 75 Years and over | 294 (72.4%) | 216 (43.4%) |
Disability Class by Sex by Age in Pulaski County
Disability Class: Hearing Difficulty
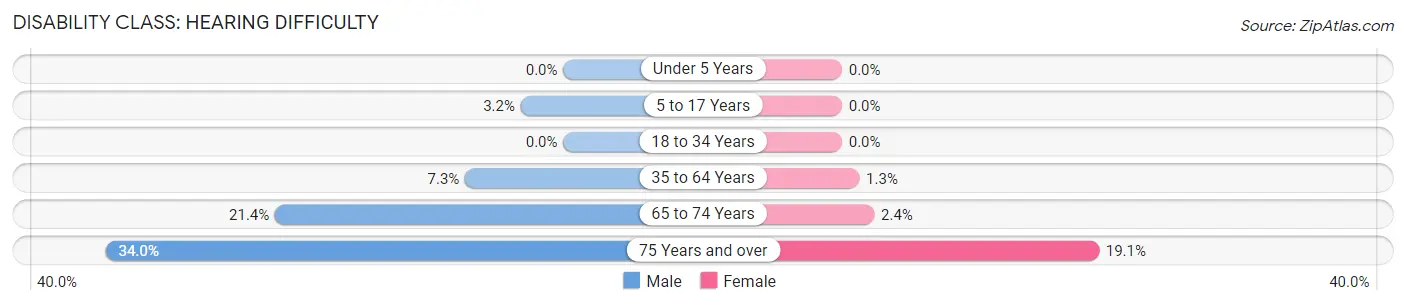
| Age Bracket | Male | Female |
| Under 5 Years | 0 (0.0%) | 0 (0.0%) |
| 5 to 17 Years | 22 (3.2%) | 0 (0.0%) |
| 18 to 34 Years | 0 (0.0%) | 0 (0.0%) |
| 35 to 64 Years | 87 (7.3%) | 20 (1.3%) |
| 65 to 74 Years | 128 (21.4%) | 13 (2.4%) |
| 75 Years and over | 138 (34.0%) | 95 (19.1%) |
Disability Class: Vision Difficulty
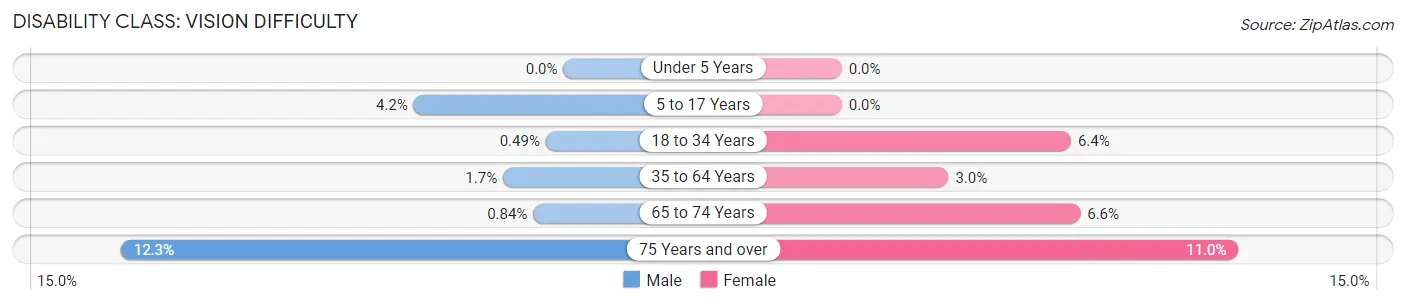
| Age Bracket | Male | Female |
| Under 5 Years | 0 (0.0%) | 0 (0.0%) |
| 5 to 17 Years | 29 (4.2%) | 0 (0.0%) |
| 18 to 34 Years | 5 (0.5%) | 60 (6.4%) |
| 35 to 64 Years | 20 (1.7%) | 46 (3.0%) |
| 65 to 74 Years | 5 (0.8%) | 36 (6.6%) |
| 75 Years and over | 50 (12.3%) | 55 (11.0%) |
Disability Class: Cognitive Difficulty
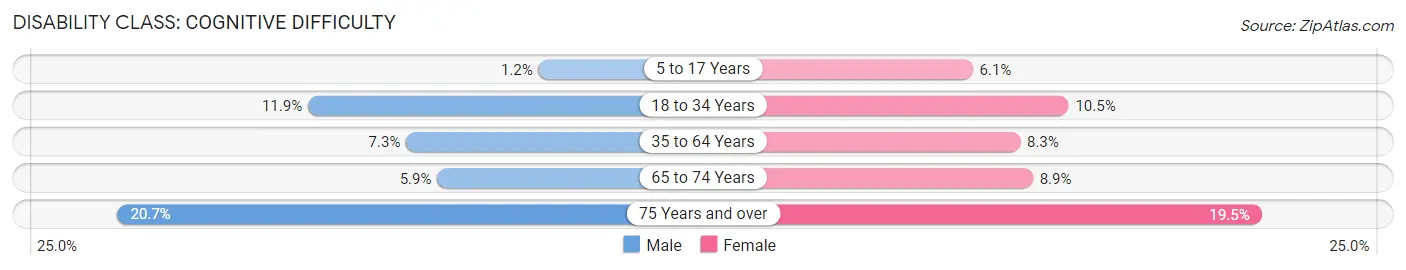
| Age Bracket | Male | Female |
| 5 to 17 Years | 8 (1.1%) | 28 (6.1%) |
| 18 to 34 Years | 120 (11.8%) | 99 (10.5%) |
| 35 to 64 Years | 87 (7.3%) | 128 (8.3%) |
| 65 to 74 Years | 35 (5.9%) | 48 (8.9%) |
| 75 Years and over | 84 (20.7%) | 97 (19.5%) |
Disability Class: Ambulatory Difficulty
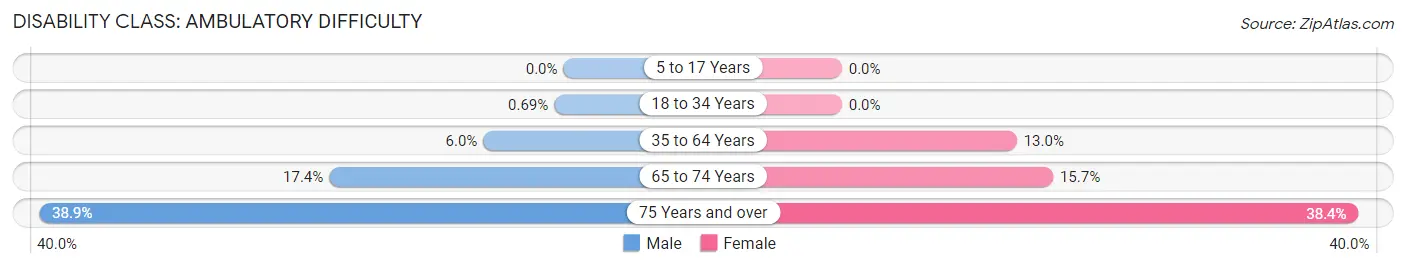
| Age Bracket | Male | Female |
| 5 to 17 Years | 0 (0.0%) | 0 (0.0%) |
| 18 to 34 Years | 7 (0.7%) | 0 (0.0%) |
| 35 to 64 Years | 71 (5.9%) | 201 (13.0%) |
| 65 to 74 Years | 104 (17.4%) | 85 (15.7%) |
| 75 Years and over | 158 (38.9%) | 191 (38.4%) |
Disability Class: Self-Care Difficulty
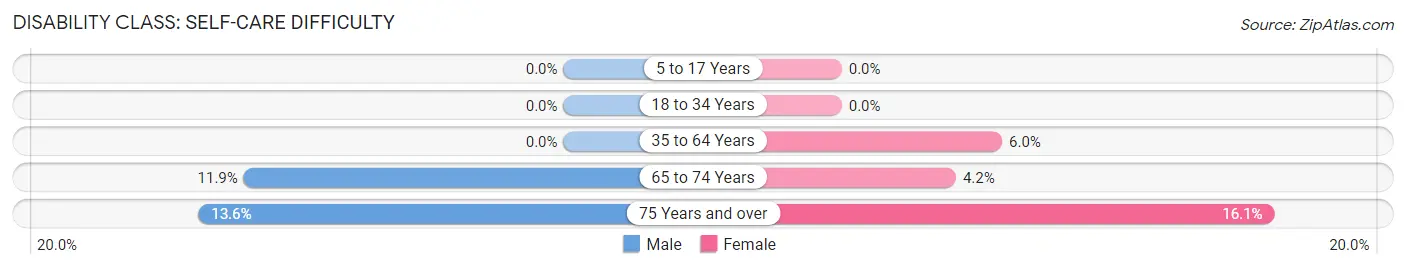
| Age Bracket | Male | Female |
| 5 to 17 Years | 0 (0.0%) | 0 (0.0%) |
| 18 to 34 Years | 0 (0.0%) | 0 (0.0%) |
| 35 to 64 Years | 0 (0.0%) | 92 (5.9%) |
| 65 to 74 Years | 71 (11.9%) | 23 (4.2%) |
| 75 Years and over | 55 (13.6%) | 80 (16.1%) |
Technology Access in Pulaski County
Computing Device Access in Pulaski County
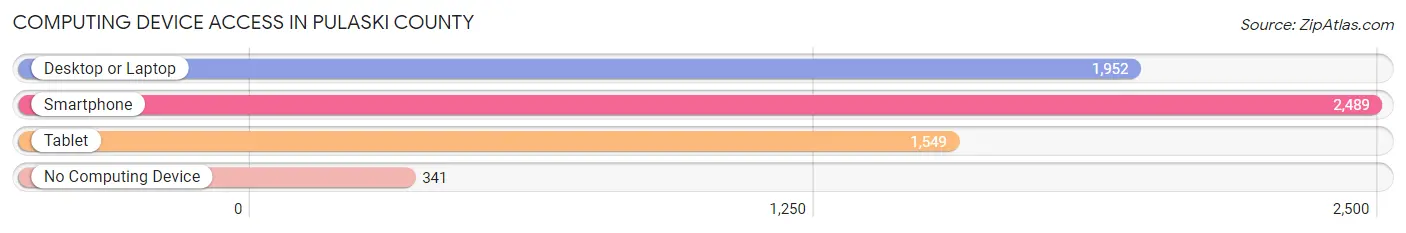
| Device Type | # Households | % Households |
| Desktop or Laptop | 1,952 | 62.6% |
| Smartphone | 2,489 | 79.8% |
| Tablet | 1,549 | 49.7% |
| No Computing Device | 341 | 10.9% |
| Total | 3,117 | 100.0% |
Internet Access in Pulaski County
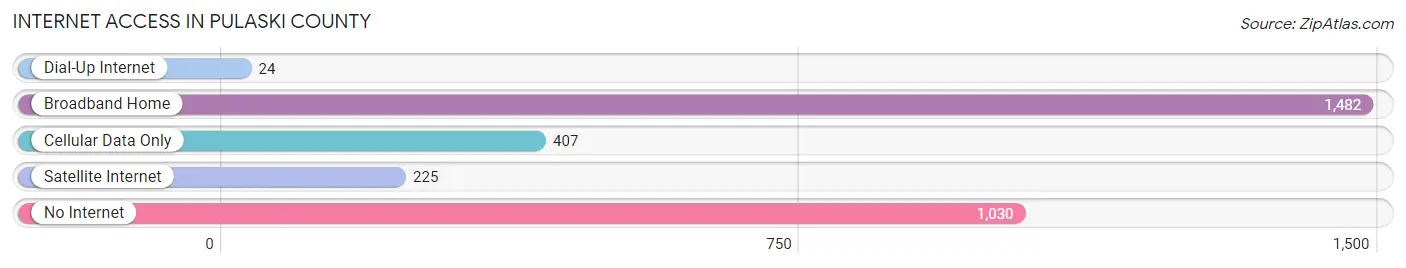
| Internet Type | # Households | % Households |
| Dial-Up Internet | 24 | 0.8% |
| Broadband Home | 1,482 | 47.5% |
| Cellular Data Only | 407 | 13.1% |
| Satellite Internet | 225 | 7.2% |
| No Internet | 1,030 | 33.0% |
| Total | 3,117 | 100.0% |
Pulaski County Summary
Pulaski County, Georgia is located in the south-central part of the state, and is part of the Middle Georgia region. It is bordered by Wilcox, Dodge, Telfair, Wheeler, and Bleckley counties. The county seat is Hawkinsville, and the county has a population of 12,010 as of the 2010 census.
History
Pulaski County was created in 1808 from part of Laurens County. It was named for Count Casimir Pulaski, a Polish-born Revolutionary War hero who died in the Battle of Savannah in 1779. The county was originally part of the Creek Nation, and the area was home to many Native American tribes, including the Creek, Cherokee, and Choctaw.
The first settlers in the area were mostly Scots-Irish immigrants who arrived in the early 1800s. The county was largely agricultural, and cotton was the main crop. The county was also home to several small towns, including Hawkinsville, which was founded in 1808 and became the county seat in 1809.
Geography
Pulaski County is located in the Middle Georgia region of the state. It is bordered by Wilcox, Dodge, Telfair, Wheeler, and Bleckley counties. The county has a total area of 441 square miles, of which 437 square miles is land and 4.2 square miles is water. The county is mostly flat, with some rolling hills in the northern part. The Ocmulgee River runs through the county, and there are several small creeks and streams.
Economy
Agriculture is the main economic activity in Pulaski County. Cotton is the main crop, and other crops include corn, soybeans, peanuts, and hay. The county also has a thriving timber industry, and there are several sawmills and wood-processing plants in the area.
The county also has a growing manufacturing sector, with several factories producing furniture, textiles, and other products. The county is home to several small businesses, including restaurants, retail stores, and service providers.
Demographics
As of the 2010 census, Pulaski County had a population of 12,010. The racial makeup of the county was 68.3% White, 28.2% African American, 0.4% Native American, 0.3% Asian, 0.1% Pacific Islander, 0.7% from other races, and 1.9% from two or more races. Hispanic or Latino of any race were 2.2% of the population.
The median income for a household in the county was $30,945, and the median income for a family was $37,917. The per capita income for the county was $16,845. About 19.2% of the population was below the poverty line.
Common Questions
What is Per Capita Income in Pulaski County?
Per Capita income in Pulaski County is $23,007.
What is the Median Family Income in Pulaski County?
Median Family Income in Pulaski County is $54,886.
What is the Median Household income in Pulaski County?
Median Household Income in Pulaski County is $42,545.
What is Income or Wage Gap in Pulaski County?
Income or Wage Gap in Pulaski County is 30.5%.
Women in Pulaski County earn 69.5 cents for every dollar earned by a man.
What is Inequality or Gini Index in Pulaski County?
Inequality or Gini Index in Pulaski County is 0.45.
What is the Total Population of Pulaski County?
Total Population of Pulaski County is 9,887.
What is the Total Male Population of Pulaski County?
Total Male Population of Pulaski County is 4,339.
What is the Total Female Population of Pulaski County?
Total Female Population of Pulaski County is 5,548.
What is the Ratio of Males per 100 Females in Pulaski County?
There are 78.21 Males per 100 Females in Pulaski County.
What is the Ratio of Females per 100 Males in Pulaski County?
There are 127.86 Females per 100 Males in Pulaski County.
What is the Median Population Age in Pulaski County?
Median Population Age in Pulaski County is 42.2 Years.
What is the Average Family Size in Pulaski County
Average Family Size in Pulaski County is 3.5 People.
What is the Average Household Size in Pulaski County
Average Household Size in Pulaski County is 2.8 People.
How Large is the Labor Force in Pulaski County?
There are 3,937 People in the Labor Forcein in Pulaski County.
What is the Percentage of People in the Labor Force in Pulaski County?
47.9% of People are in the Labor Force in Pulaski County.
What is the Unemployment Rate in Pulaski County?
Unemployment Rate in Pulaski County is 3.9%.