Oglethorpe County, GA Map & Demographics
Oglethorpe County Map

Oglethorpe County Overview
$30,225
PER CAPITA INCOME
$79,990
AVG FAMILY INCOME
$66,672
AVG HOUSEHOLD INCOME
36.3%
WAGE / INCOME GAP [ % ]
63.7¢/ $1
WAGE / INCOME GAP [ $ ]
0.43
INEQUALITY / GINI INDEX
14,974
TOTAL POPULATION
7,528
MALE POPULATION
7,446
FEMALE POPULATION
101.10
MALES / 100 FEMALES
98.91
FEMALES / 100 MALES
42.2
MEDIAN AGE
3.4
AVG FAMILY SIZE
2.8
AVG HOUSEHOLD SIZE
7,438
LABOR FORCE [ PEOPLE ]
61.3%
PERCENT IN LABOR FORCE
4.5%
UNEMPLOYMENT RATE
Oglethorpe County Area Codes
Income in Oglethorpe County
Income Overview in Oglethorpe County
Per Capita Income in Oglethorpe County is $30,225, while median incomes of families and households are $79,990 and $66,672 respectively.
| Characteristic | Number | Measure |
| Per Capita Income | 14,974 | $30,225 |
| Median Family Income | 3,721 | $79,990 |
| Mean Family Income | 3,721 | $93,218 |
| Median Household Income | 5,273 | $66,672 |
| Mean Household Income | 5,273 | $79,153 |
| Income Deficit | 3,721 | $0 |
| Wage / Income Gap (%) | 14,974 | 36.32% |
| Wage / Income Gap ($) | 14,974 | 63.68¢ per $1 |
| Gini / Inequality Index | 14,974 | 0.43 |
Earnings by Sex in Oglethorpe County
Average Earnings in Oglethorpe County are $38,004, $44,070 for men and $28,064 for women, a difference of 36.3%.

| Sex | Number | Average Earnings |
| Male | 3,904 (51.8%) | $44,070 |
| Female | 3,631 (48.2%) | $28,064 |
| Total | 7,535 (100.0%) | $38,004 |
Earnings by Sex by Income Bracket in Oglethorpe County
The most common earnings brackets in Oglethorpe County are $75,000 to $99,999 for men (430 | 11.0%) and $55,000 to $64,999 for women (441 | 12.1%).

| Income | Male | Female |
| $2,499 or less | 224 (5.7%) | 166 (4.6%) |
| $2,500 to $4,999 | 139 (3.6%) | 127 (3.5%) |
| $5,000 to $7,499 | 92 (2.4%) | 187 (5.1%) |
| $7,500 to $9,999 | 153 (3.9%) | 18 (0.5%) |
| $10,000 to $12,499 | 25 (0.6%) | 269 (7.4%) |
| $12,500 to $14,999 | 66 (1.7%) | 208 (5.7%) |
| $15,000 to $17,499 | 160 (4.1%) | 225 (6.2%) |
| $17,500 to $19,999 | 29 (0.7%) | 133 (3.7%) |
| $20,000 to $22,499 | 42 (1.1%) | 280 (7.7%) |
| $22,500 to $24,999 | 75 (1.9%) | 86 (2.4%) |
| $25,000 to $29,999 | 227 (5.8%) | 228 (6.3%) |
| $30,000 to $34,999 | 224 (5.7%) | 146 (4.0%) |
| $35,000 to $39,999 | 218 (5.6%) | 177 (4.9%) |
| $40,000 to $44,999 | 352 (9.0%) | 157 (4.3%) |
| $45,000 to $49,999 | 177 (4.5%) | 176 (4.9%) |
| $50,000 to $54,999 | 284 (7.3%) | 105 (2.9%) |
| $55,000 to $64,999 | 336 (8.6%) | 441 (12.1%) |
| $65,000 to $74,999 | 327 (8.4%) | 318 (8.8%) |
| $75,000 to $99,999 | 430 (11.0%) | 123 (3.4%) |
| $100,000+ | 324 (8.3%) | 61 (1.7%) |
| Total | 3,904 (100.0%) | 3,631 (100.0%) |
Earnings by Sex by Educational Attainment in Oglethorpe County
Average earnings in Oglethorpe County are $49,213 for men and $34,046 for women, a difference of 30.8%. Men with an educational attainment of less than high school enjoy the highest average annual earnings of $67,778, while those with high school diploma education earn the least with $43,537. Women with an educational attainment of graduate degree earn the most with the average annual earnings of $60,399, while those with less than high school education have the smallest earnings of $21,807.

| Educational Attainment | Male Income | Female Income |
| Less than High School | $67,778 | $21,807 |
| High School Diploma | $43,537 | $27,906 |
| College or Associate's Degree | $47,520 | $39,135 |
| Bachelor's Degree | $57,629 | $34,583 |
| Graduate Degree | - | - |
| Total | $49,213 | $34,046 |
Family Income in Oglethorpe County
Family Income Brackets in Oglethorpe County
According to the Oglethorpe County family income data, there are 744 families falling into the $100,000 to $149,999 income range, which is the most common income bracket and makes up 20.0% of all families. Conversely, the $10,000 to $14,999 income bracket is the least frequent group with only 123 families (3.3%) belonging to this category.

| Income Bracket | # Families | % Families |
| Less than $10,000 | 145 | 3.9% |
| $10,000 to $14,999 | 123 | 3.3% |
| $15,000 to $24,999 | 171 | 4.6% |
| $25,000 to $34,999 | 260 | 7.0% |
| $35,000 to $49,999 | 368 | 9.9% |
| $50,000 to $74,999 | 640 | 17.2% |
| $75,000 to $99,999 | 662 | 17.8% |
| $100,000 to $149,999 | 744 | 20.0% |
| $150,000 to $199,999 | 313 | 8.4% |
| $200,000+ | 290 | 7.8% |
Family Income by Famaliy Size in Oglethorpe County
7+ person families (60 | 1.6%) account for the highest median family income in Oglethorpe County with $141,563 per family, while 2-person families (1,654 | 44.5%) have the highest median income of $34,250 per family member.

| Income Bracket | # Families | Median Income |
| 2-Person Families | 1,654 (44.5%) | $68,500 |
| 3-Person Families | 840 (22.6%) | $84,184 |
| 4-Person Families | 832 (22.4%) | $79,563 |
| 5-Person Families | 255 (6.9%) | $95,824 |
| 6-Person Families | 80 (2.1%) | $0 |
| 7+ Person Families | 60 (1.6%) | $141,563 |
| Total | 3,721 (100.0%) | $79,990 |
Family Income by Number of Earners in Oglethorpe County
The median family income in Oglethorpe County is $79,990, with families comprising 3+ earners (391) having the highest median family income of $120,807, while families with no earners (721) have the lowest median family income of $42,656, accounting for 10.5% and 19.4% of families, respectively.

| Number of Earners | # Families | Median Income |
| No Earners | 721 (19.4%) | $42,656 |
| 1 Earner | 1,106 (29.7%) | $52,470 |
| 2 Earners | 1,503 (40.4%) | $97,188 |
| 3+ Earners | 391 (10.5%) | $120,807 |
| Total | 3,721 (100.0%) | $79,990 |
Household Income in Oglethorpe County
Household Income Brackets in Oglethorpe County
With 939 households falling in the category, the $50,000 to $74,999 income range is the most frequent in Oglethorpe County, accounting for 17.8% of all households. In contrast, only 316 households (6.0%) fall into the $150,000 to $199,999 income bracket, making it the least populous group.

| Income Bracket | # Households | % Households |
| Less than $10,000 | 337 | 6.4% |
| $10,000 to $14,999 | 322 | 6.1% |
| $15,000 to $24,999 | 406 | 7.7% |
| $25,000 to $34,999 | 459 | 8.7% |
| $35,000 to $49,999 | 485 | 9.2% |
| $50,000 to $74,999 | 939 | 17.8% |
| $75,000 to $99,999 | 923 | 17.5% |
| $100,000 to $149,999 | 754 | 14.3% |
| $150,000 to $199,999 | 316 | 6.0% |
| $200,000+ | 327 | 6.2% |
Household Income by Householder Age in Oglethorpe County
The median household income in Oglethorpe County is $66,672, with the highest median household income of $81,208 found in the 25 to 44 years age bracket for the primary householder. A total of 1,538 households (29.2%) fall into this category. Meanwhile, the 65+ years age bracket for the primary householder has the lowest median household income of $46,327, with 1,612 households (30.6%) in this group.

| Income Bracket | # Households | Median Income |
| 15 to 24 Years | 41 (0.8%) | $56,042 |
| 25 to 44 Years | 1,538 (29.2%) | $81,208 |
| 45 to 64 Years | 2,082 (39.5%) | $71,572 |
| 65+ Years | 1,612 (30.6%) | $46,327 |
| Total | 5,273 (100.0%) | $66,672 |
Poverty in Oglethorpe County
Income Below Poverty by Sex and Age in Oglethorpe County
With 10.0% poverty level for males and 12.3% for females among the residents of Oglethorpe County, 15 year old males and 12 to 14 year old females are the most vulnerable to poverty, with 48 males (52.7%) and 48 females (23.9%) in their respective age groups living below the poverty level.

| Age Bracket | Male | Female |
| Under 5 Years | 56 (12.4%) | 71 (22.3%) |
| 5 Years | 34 (35.4%) | 0 (0.0%) |
| 6 to 11 Years | 98 (18.7%) | 72 (12.1%) |
| 12 to 14 Years | 91 (40.8%) | 48 (23.9%) |
| 15 Years | 48 (52.7%) | 3 (1.4%) |
| 16 and 17 Years | 19 (8.4%) | 7 (8.2%) |
| 18 to 24 Years | 48 (7.0%) | 33 (5.7%) |
| 25 to 34 Years | 93 (11.0%) | 130 (15.1%) |
| 35 to 44 Years | 43 (5.2%) | 160 (16.9%) |
| 45 to 54 Years | 39 (3.8%) | 94 (9.8%) |
| 55 to 64 Years | 143 (12.4%) | 88 (8.2%) |
| 65 to 74 Years | 19 (2.4%) | 104 (12.0%) |
| 75 Years and over | 9 (2.1%) | 96 (15.0%) |
| Total | 740 (10.0%) | 906 (12.3%) |
Income Above Poverty by Sex and Age in Oglethorpe County
According to the poverty statistics in Oglethorpe County, males aged 75 years and over and females aged 5 years are the age groups that are most secure financially, with 97.9% of males and 100.0% of females in these age groups living above the poverty line.

| Age Bracket | Male | Female |
| Under 5 Years | 397 (87.6%) | 247 (77.7%) |
| 5 Years | 62 (64.6%) | 57 (100.0%) |
| 6 to 11 Years | 426 (81.3%) | 523 (87.9%) |
| 12 to 14 Years | 132 (59.2%) | 153 (76.1%) |
| 15 Years | 43 (47.2%) | 206 (98.6%) |
| 16 and 17 Years | 208 (91.6%) | 78 (91.8%) |
| 18 to 24 Years | 637 (93.0%) | 546 (94.3%) |
| 25 to 34 Years | 752 (89.0%) | 729 (84.9%) |
| 35 to 44 Years | 786 (94.8%) | 785 (83.1%) |
| 45 to 54 Years | 980 (96.2%) | 866 (90.2%) |
| 55 to 64 Years | 1,012 (87.6%) | 989 (91.8%) |
| 65 to 74 Years | 780 (97.6%) | 761 (88.0%) |
| 75 Years and over | 428 (97.9%) | 542 (85.0%) |
| Total | 6,643 (90.0%) | 6,482 (87.7%) |
Income Below Poverty Among Married-Couple Families in Oglethorpe County
The poverty statistics for married-couple families in Oglethorpe County show that 3.6% or 97 of the total 2,660 families live below the poverty line. Families with 3 or 4 children have the highest poverty rate of 14.1%, comprising of 27 families. On the other hand, families with 1 or 2 children have the lowest poverty rate of 0.0%, which includes 0 families.

| Children | Above Poverty | Below Poverty |
| No Children | 1,654 (95.9%) | 70 (4.1%) |
| 1 or 2 Children | 745 (100.0%) | 0 (0.0%) |
| 3 or 4 Children | 164 (85.9%) | 27 (14.1%) |
| 5 or more Children | 0 (0.0%) | 0 (0.0%) |
| Total | 2,563 (96.4%) | 97 (3.6%) |
Income Below Poverty Among Single-Parent Households in Oglethorpe County
According to the poverty data in Oglethorpe County, 5.1% or 11 single-father households and 26.9% or 228 single-mother households are living below the poverty line. Among single-father households, those with 1 or 2 children have the highest poverty rate, with 11 households (15.3%) experiencing poverty. Likewise, among single-mother households, those with 3 or 4 children have the highest poverty rate, with 98 households (63.6%) falling below the poverty line.

| Children | Single Father | Single Mother |
| No Children | 0 (0.0%) | 30 (14.3%) |
| 1 or 2 Children | 11 (15.3%) | 100 (20.7%) |
| 3 or 4 Children | 0 (0.0%) | 98 (63.6%) |
| 5 or more Children | 0 (0.0%) | 0 (0.0%) |
| Total | 11 (5.1%) | 228 (26.9%) |
Income Below Poverty Among Married-Couple vs Single-Parent Households in Oglethorpe County
The poverty data for Oglethorpe County shows that 97 of the married-couple family households (3.6%) and 239 of the single-parent households (22.5%) are living below the poverty level. Within the married-couple family households, those with 3 or 4 children have the highest poverty rate, with 27 households (14.1%) falling below the poverty line. Among the single-parent households, those with 3 or 4 children have the highest poverty rate, with 98 household (63.6%) living below poverty.

| Children | Married-Couple Families | Single-Parent Households |
| No Children | 70 (4.1%) | 30 (8.6%) |
| 1 or 2 Children | 0 (0.0%) | 111 (20.0%) |
| 3 or 4 Children | 27 (14.1%) | 98 (63.6%) |
| 5 or more Children | 0 (0.0%) | 0 (0.0%) |
| Total | 97 (3.6%) | 239 (22.5%) |
Race in Oglethorpe County
The most populous races in Oglethorpe County are White / Caucasian (11,630 | 77.7%), Black / African American (2,503 | 16.7%), and Hispanic or Latino (881 | 5.9%).

| Race | # Population | % Population |
| Asian | 130 | 0.9% |
| Black / African American | 2,503 | 16.7% |
| Hawaiian / Pacific | 10 | 0.1% |
| Hispanic or Latino | 881 | 5.9% |
| Native / Alaskan | 0 | 0.0% |
| White / Caucasian | 11,630 | 77.7% |
| Two or more Races | 574 | 3.8% |
| Some other Race | 127 | 0.9% |
| Total | 14,974 | 100.0% |
Ancestry in Oglethorpe County
The most populous ancestries reported in Oglethorpe County are English (2,110 | 14.1%), Irish (1,862 | 12.4%), American (1,828 | 12.2%), German (754 | 5.0%), and Mexican (551 | 3.7%), together accounting for 47.4% of all Oglethorpe County residents.

| Ancestry | # Population | % Population |
| African | 83 | 0.5% |
| American | 1,828 | 12.2% |
| Apache | 8 | 0.1% |
| Argentinean | 3 | 0.0% |
| Austrian | 9 | 0.1% |
| Basque | 31 | 0.2% |
| Belgian | 3 | 0.0% |
| British | 78 | 0.5% |
| Canadian | 1 | 0.0% |
| Central American | 92 | 0.6% |
| Cherokee | 85 | 0.6% |
| Creek | 2 | 0.0% |
| Czech | 28 | 0.2% |
| Danish | 3 | 0.0% |
| Dutch | 94 | 0.6% |
| Eastern European | 58 | 0.4% |
| English | 2,110 | 14.1% |
| European | 290 | 1.9% |
| Finnish | 12 | 0.1% |
| French | 96 | 0.6% |
| German | 754 | 5.0% |
| Greek | 89 | 0.6% |
| Honduran | 66 | 0.4% |
| Hungarian | 22 | 0.2% |
| Indonesian | 24 | 0.2% |
| Inupiat | 1 | 0.0% |
| Irish | 1,862 | 12.4% |
| Italian | 449 | 3.0% |
| Jamaican | 14 | 0.1% |
| Lithuanian | 1 | 0.0% |
| Lumbee | 17 | 0.1% |
| Mexican | 551 | 3.7% |
| Native Hawaiian | 14 | 0.1% |
| Northern European | 21 | 0.1% |
| Norwegian | 82 | 0.5% |
| Panamanian | 22 | 0.2% |
| Polish | 61 | 0.4% |
| Puerto Rican | 202 | 1.3% |
| Russian | 26 | 0.2% |
| Salvadoran | 4 | 0.0% |
| Scandinavian | 50 | 0.3% |
| Scotch-Irish | 203 | 1.4% |
| Scottish | 303 | 2.0% |
| Seminole | 26 | 0.2% |
| Slovak | 2 | 0.0% |
| South American | 7 | 0.1% |
| Spanish | 29 | 0.2% |
| Sri Lankan | 100 | 0.7% |
| Subsaharan African | 83 | 0.5% |
| Swedish | 60 | 0.4% |
| Swiss | 114 | 0.8% |
| Thai | 21 | 0.1% |
| Ukrainian | 34 | 0.2% |
| Venezuelan | 4 | 0.0% |
| Welsh | 64 | 0.4% | View All 55 Rows |
Immigrants in Oglethorpe County
The most numerous immigrant groups reported in Oglethorpe County came from Latin America (141 | 0.9%), Central America (117 | 0.8%), Mexico (117 | 0.8%), Caribbean (20 | 0.1%), and Europe (14 | 0.1%), together accounting for 2.7% of all Oglethorpe County residents.

| Immigration Origin | # Population | % Population |
| Africa | 6 | 0.0% |
| Asia | 7 | 0.1% |
| Canada | 10 | 0.1% |
| Caribbean | 20 | 0.1% |
| Central America | 117 | 0.8% |
| Eastern Europe | 1 | 0.0% |
| Europe | 14 | 0.1% |
| Germany | 7 | 0.1% |
| Jamaica | 14 | 0.1% |
| Latin America | 141 | 0.9% |
| Mexico | 117 | 0.8% |
| Northern Europe | 2 | 0.0% |
| Romania | 1 | 0.0% |
| South America | 4 | 0.0% |
| South Eastern Asia | 7 | 0.1% |
| Sweden | 2 | 0.0% |
| Switzerland | 4 | 0.0% |
| Trinidad and Tobago | 6 | 0.0% |
| Venezuela | 4 | 0.0% |
| Vietnam | 7 | 0.1% |
| Western Europe | 11 | 0.1% | View All 21 Rows |
Sex and Age in Oglethorpe County
Sex and Age in Oglethorpe County
The most populous age groups in Oglethorpe County are 15 to 19 Years (658 | 8.7%) for men and 55 to 59 Years (687 | 9.2%) for women.
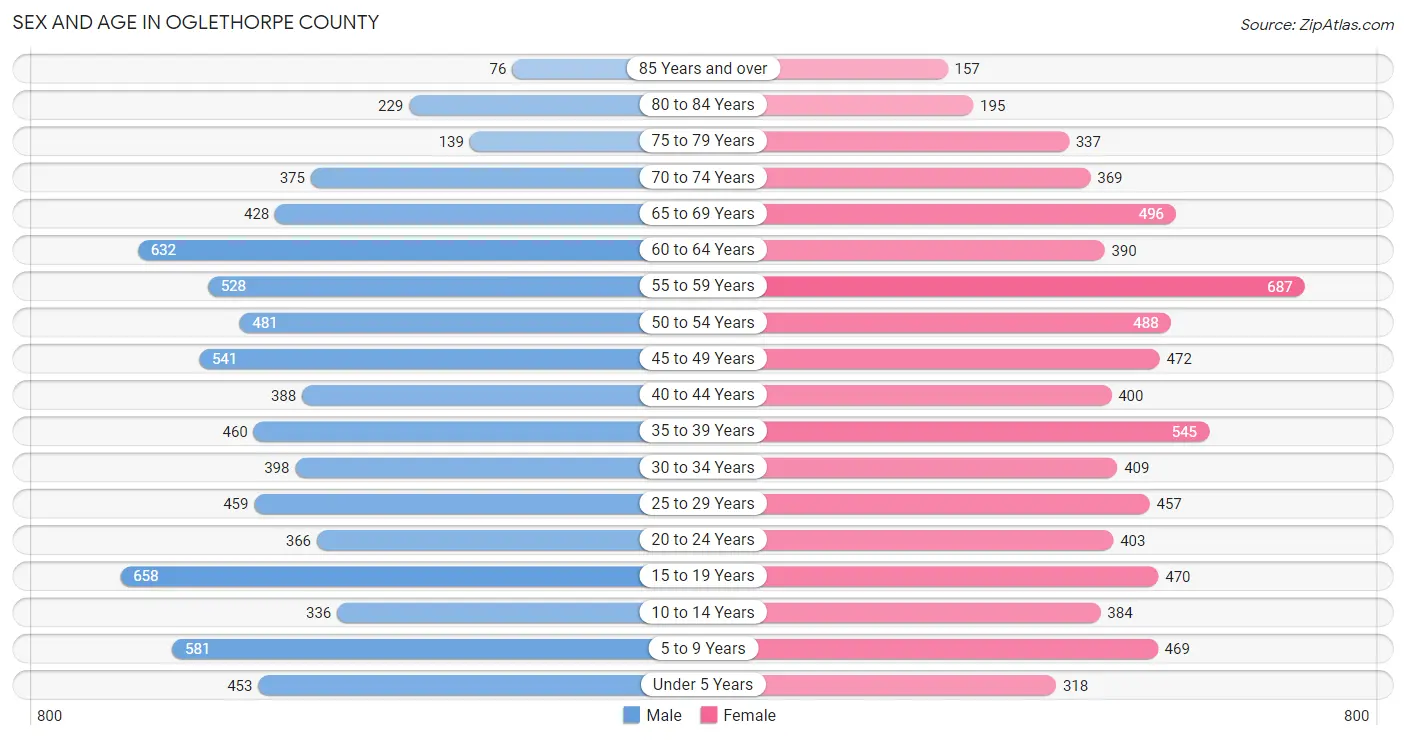
| Age Bracket | Male | Female |
| Under 5 Years | 453 (6.0%) | 318 (4.3%) |
| 5 to 9 Years | 581 (7.7%) | 469 (6.3%) |
| 10 to 14 Years | 336 (4.5%) | 384 (5.2%) |
| 15 to 19 Years | 658 (8.7%) | 470 (6.3%) |
| 20 to 24 Years | 366 (4.9%) | 403 (5.4%) |
| 25 to 29 Years | 459 (6.1%) | 457 (6.1%) |
| 30 to 34 Years | 398 (5.3%) | 409 (5.5%) |
| 35 to 39 Years | 460 (6.1%) | 545 (7.3%) |
| 40 to 44 Years | 388 (5.1%) | 400 (5.4%) |
| 45 to 49 Years | 541 (7.2%) | 472 (6.3%) |
| 50 to 54 Years | 481 (6.4%) | 488 (6.6%) |
| 55 to 59 Years | 528 (7.0%) | 687 (9.2%) |
| 60 to 64 Years | 632 (8.4%) | 390 (5.2%) |
| 65 to 69 Years | 428 (5.7%) | 496 (6.7%) |
| 70 to 74 Years | 375 (5.0%) | 369 (5.0%) |
| 75 to 79 Years | 139 (1.8%) | 337 (4.5%) |
| 80 to 84 Years | 229 (3.0%) | 195 (2.6%) |
| 85 Years and over | 76 (1.0%) | 157 (2.1%) |
| Total | 7,528 (100.0%) | 7,446 (100.0%) |
Families and Households in Oglethorpe County
Median Family Size in Oglethorpe County
The median family size in Oglethorpe County is 3.42 persons per family, with single female/mother families (847 | 22.8%) accounting for the largest median family size of 4.23 persons per family. On the other hand, married-couple families (2,660 | 71.5%) represent the smallest median family size with 3.16 persons per family.

| Family Type | # Families | Family Size |
| Married-Couple | 2,660 (71.5%) | 3.16 |
| Single Male/Father | 214 (5.8%) | 3.33 |
| Single Female/Mother | 847 (22.8%) | 4.23 |
| Total Families | 3,721 (100.0%) | 3.42 |
Median Household Size in Oglethorpe County
The median household size in Oglethorpe County is 2.81 persons per household, with single female/mother households (847 | 16.1%) accounting for the largest median household size of 4.6 persons per household. non-family households (1,552 | 29.4%) represent the smallest median household size with 1.06 persons per household.

| Household Type | # Households | Household Size |
| Married-Couple | 2,660 (50.4%) | 3.17 |
| Single Male/Father | 214 (4.1%) | 4.08 |
| Single Female/Mother | 847 (16.1%) | 4.60 |
| Non-family | 1,552 (29.4%) | 1.06 |
| Total Households | 5,273 (100.0%) | 2.81 |
Household Size by Marriage Status in Oglethorpe County
Out of a total of 5,273 households in Oglethorpe County, 3,721 (70.6%) are family households, while 1,552 (29.4%) are nonfamily households. The most numerous type of family households are 2-person households, comprising 1,600, and the most common type of nonfamily households are 1-person households, comprising 1,442.

| Household Size | Family Households | Nonfamily Households |
| 1-Person Households | - | 1,442 (27.4%) |
| 2-Person Households | 1,600 (30.3%) | 110 (2.1%) |
| 3-Person Households | 829 (15.7%) | 0 (0.0%) |
| 4-Person Households | 794 (15.1%) | 0 (0.0%) |
| 5-Person Households | 337 (6.4%) | 0 (0.0%) |
| 6-Person Households | 85 (1.6%) | 0 (0.0%) |
| 7+ Person Households | 76 (1.4%) | 0 (0.0%) |
| Total | 3,721 (70.6%) | 1,552 (29.4%) |
Female Fertility in Oglethorpe County
Fertility by Age in Oglethorpe County
Average fertility rate in Oglethorpe County is 30.0 births per 1,000 women. Women in the age bracket of 35 to 50 years have the highest fertility rate with 47.0 births per 1,000 women. Women in the age bracket of 35 to 50 years acount for 72.0% of all women with births.

| Age Bracket | Women with Births | Births / 1,000 Women |
| 15 to 19 years | 0 (0.0%) | 0.0 |
| 20 to 34 years | 28 (28.0%) | 22.0 |
| 35 to 50 years | 72 (72.0%) | 47.0 |
| Total | 100 (100.0%) | 30.0 |
Fertility by Age by Marriage Status in Oglethorpe County
83.0% of women with births (100) in Oglethorpe County are married. The highest percentage of unmarried women with births falls into 20 to 34 years age bracket with 60.7% of them unmarried at the time of birth, while the lowest percentage of unmarried women with births belong to 35 to 50 years age bracket with 0.0% of them unmarried.

| Age Bracket | Married | Unmarried |
| 15 to 19 years | 0 (0.0%) | 0 (0.0%) |
| 20 to 34 years | 11 (39.3%) | 17 (60.7%) |
| 35 to 50 years | 72 (100.0%) | 0 (0.0%) |
| Total | 83 (83.0%) | 17 (17.0%) |
Fertility by Education in Oglethorpe County

| Educational Attainment | Women with Births | Births / 1,000 Women |
| Less than High School | 0 (0.0%) | 0.0 |
| High School Diploma | 60 (60.0%) | 67.0 |
| College or Associate's Degree | 21 (21.0%) | 20.0 |
| Bachelor's Degree | 9 (9.0%) | 29.0 |
| Graduate Degree | 10 (10.0%) | 34.0 |
| Total | 100 (100.0%) | 30.0 |
Fertility by Education by Marriage Status in Oglethorpe County
17.0% of women with births in Oglethorpe County are unmarried. Women with the educational attainment of high school diploma are most likely to be married with 100.0% of them married at childbirth, while women with the educational attainment of college or associate's degree are least likely to be married with 80.9% of them unmarried at childbirth.

| Educational Attainment | Married | Unmarried |
| Less than High School | 0 (0.0%) | 0 (0.0%) |
| High School Diploma | 60 (100.0%) | 0 (0.0%) |
| College or Associate's Degree | 4 (19.1%) | 17 (80.9%) |
| Bachelor's Degree | 9 (100.0%) | 0 (0.0%) |
| Graduate Degree | 10 (100.0%) | 0 (0.0%) |
| Total | 83 (83.0%) | 17 (17.0%) |
Employment Characteristics in Oglethorpe County
Employment by Class of Employer in Oglethorpe County
Among the 6,959 employed individuals in Oglethorpe County, private company employees (4,098 | 58.9%), state government employees (812 | 11.7%), and self-employed (not incorporated) (640 | 9.2%) make up the most common classes of employment.
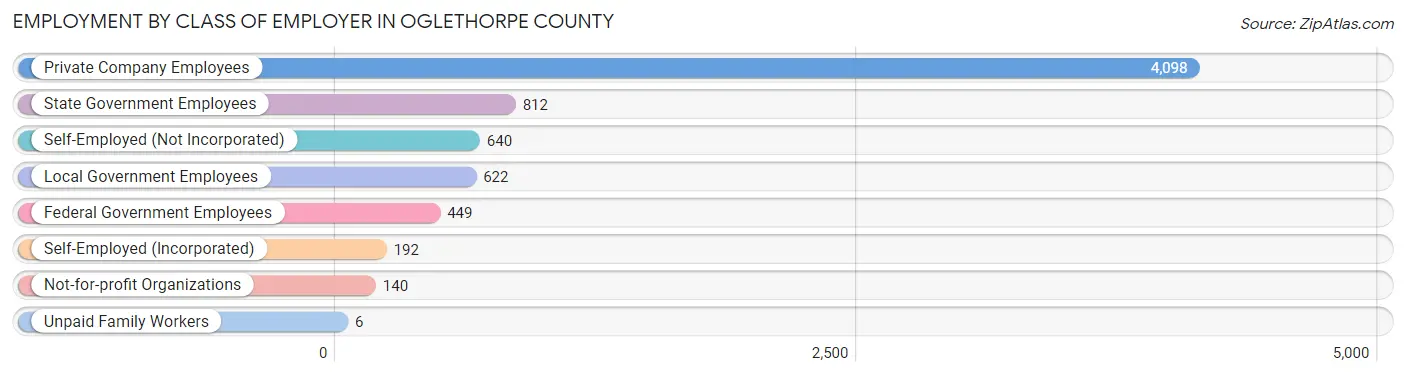
| Employer Class | # Employees | % Employees |
| Private Company Employees | 4,098 | 58.9% |
| Self-Employed (Incorporated) | 192 | 2.8% |
| Self-Employed (Not Incorporated) | 640 | 9.2% |
| Not-for-profit Organizations | 140 | 2.0% |
| Local Government Employees | 622 | 8.9% |
| State Government Employees | 812 | 11.7% |
| Federal Government Employees | 449 | 6.5% |
| Unpaid Family Workers | 6 | 0.1% |
| Total | 6,959 | 100.0% |
Employment Status by Age in Oglethorpe County
According to the labor force statistics for Oglethorpe County, out of the total population over 16 years of age (12,133), 61.3% or 7,438 individuals are in the labor force, with 4.5% or 335 of them unemployed. The age group with the highest labor force participation rate is 30 to 34 years, with 92.6% or 747 individuals in the labor force. Within the labor force, the 16 to 19 years age range has the highest percentage of unemployed individuals, with 19.1% or 61 of them being unemployed.

| Age Bracket | In Labor Force | Unemployed |
| 16 to 19 Years | 319 (38.5%) | 61 (19.1%) |
| 20 to 24 Years | 632 (82.2%) | 93 (14.7%) |
| 25 to 29 Years | 715 (78.1%) | 44 (6.2%) |
| 30 to 34 Years | 747 (92.6%) | 40 (5.4%) |
| 35 to 44 Years | 1,519 (84.7%) | 33 (2.2%) |
| 45 to 54 Years | 1,584 (79.9%) | 40 (2.5%) |
| 55 to 59 Years | 854 (70.3%) | 0 (0.0%) |
| 60 to 64 Years | 616 (60.3%) | 3 (0.5%) |
| 65 to 74 Years | 399 (23.9%) | 21 (5.3%) |
| 75 Years and over | 51 (4.5%) | 1 (2.0%) |
| Total | 7,438 (61.3%) | 335 (4.5%) |
Employment Status by Educational Attainment in Oglethorpe County
According to labor force statistics for Oglethorpe County, 78.0% of individuals (6,033) out of the total population between 25 and 64 years of age (7,735) are in the labor force, with 2.6% or 157 of them being unemployed. The group with the highest labor force participation rate are those with the educational attainment of bachelor's degree or higher, with 82.6% or 1,404 individuals in the labor force. Within the labor force, individuals with less than high school education have the highest percentage of unemployment, with 12.9% or 73 of them being unemployed.

| Educational Attainment | In Labor Force | Unemployed |
| Less than High School | 568 (69.1%) | 106 (12.9%) |
| High School Diploma | 2,364 (76.1%) | 53 (1.7%) |
| College / Associate Degree | 1,698 (80.6%) | 44 (2.1%) |
| Bachelor's Degree or higher | 1,404 (82.6%) | 12 (0.7%) |
| Total | 6,033 (78.0%) | 201 (2.6%) |
Employment Occupations by Sex in Oglethorpe County
Management, Business, Science and Arts Occupations
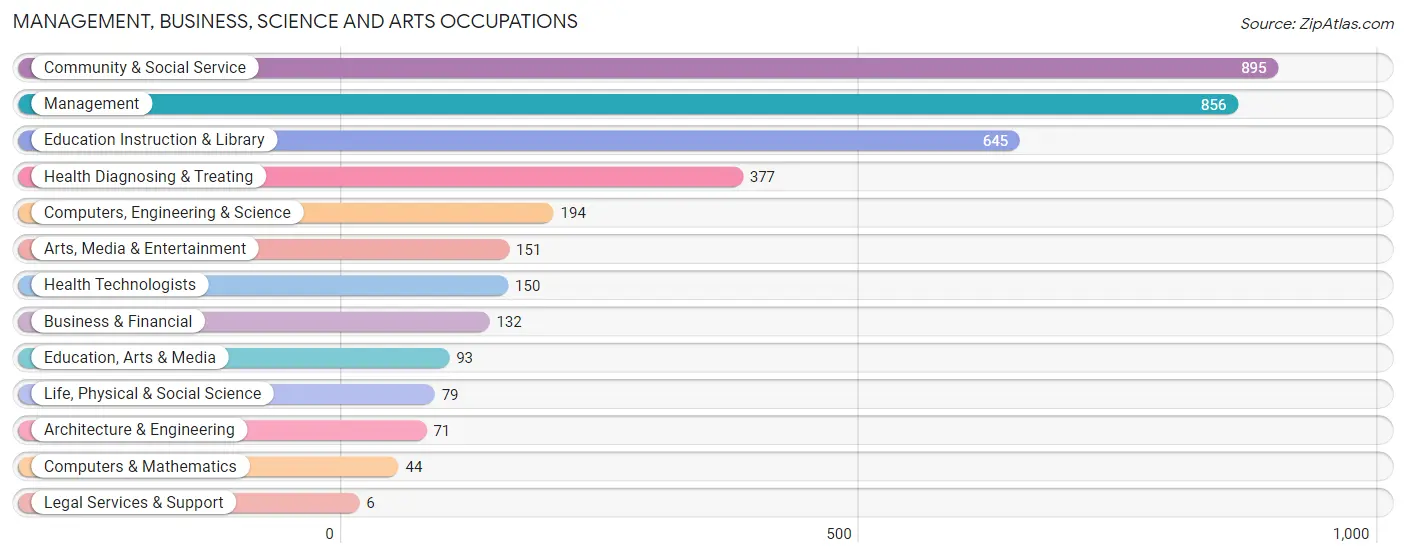
The most common Management, Business, Science and Arts occupations in Oglethorpe County are Community & Social Service (895 | 12.7%), Management (856 | 12.1%), Education Instruction & Library (645 | 9.1%), Health Diagnosing & Treating (377 | 5.3%), and Computers, Engineering & Science (194 | 2.7%).
Management, Business, Science and Arts Occupations by Sex
Within the Management, Business, Science and Arts occupations in Oglethorpe County, the most male-oriented occupations are Architecture & Engineering (100.0%), Computers, Engineering & Science (86.6%), and Computers & Mathematics (81.8%), while the most female-oriented occupations are Legal Services & Support (100.0%), Education, Arts & Media (81.7%), and Education Instruction & Library (80.6%).
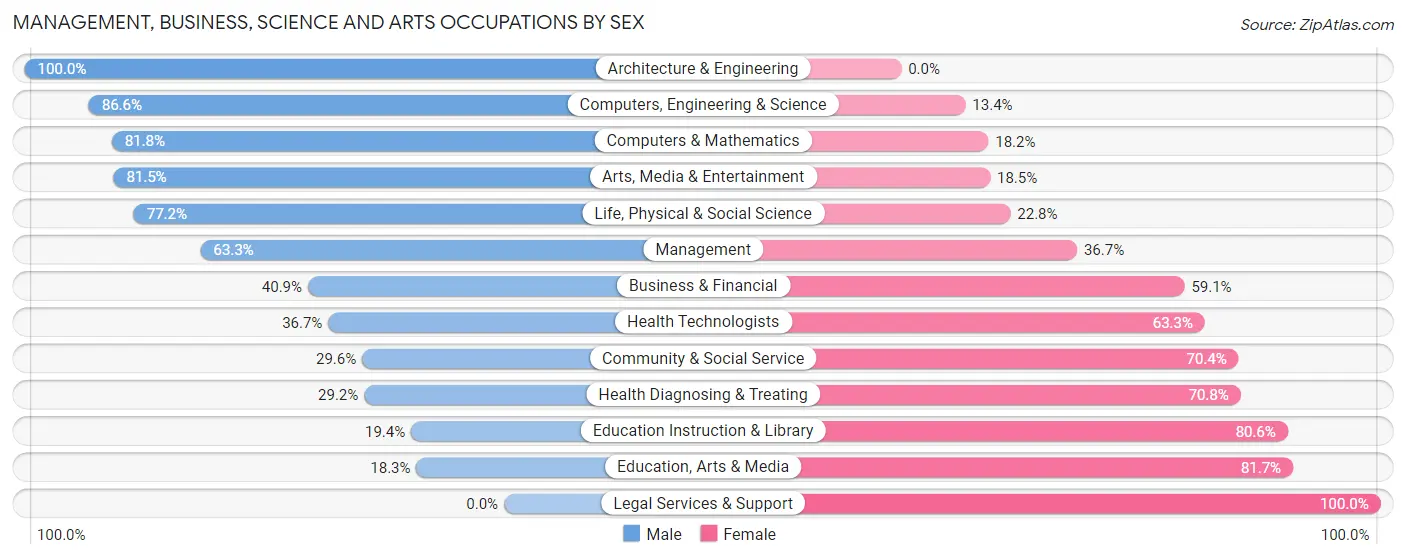
| Occupation | Male | Female |
| Management | 542 (63.3%) | 314 (36.7%) |
| Business & Financial | 54 (40.9%) | 78 (59.1%) |
| Computers, Engineering & Science | 168 (86.6%) | 26 (13.4%) |
| Computers & Mathematics | 36 (81.8%) | 8 (18.2%) |
| Architecture & Engineering | 71 (100.0%) | 0 (0.0%) |
| Life, Physical & Social Science | 61 (77.2%) | 18 (22.8%) |
| Community & Social Service | 265 (29.6%) | 630 (70.4%) |
| Education, Arts & Media | 17 (18.3%) | 76 (81.7%) |
| Legal Services & Support | 0 (0.0%) | 6 (100.0%) |
| Education Instruction & Library | 125 (19.4%) | 520 (80.6%) |
| Arts, Media & Entertainment | 123 (81.5%) | 28 (18.5%) |
| Health Diagnosing & Treating | 110 (29.2%) | 267 (70.8%) |
| Health Technologists | 55 (36.7%) | 95 (63.3%) |
| Total (Category) | 1,139 (46.4%) | 1,315 (53.6%) |
| Total (Overall) | 3,613 (51.1%) | 3,455 (48.9%) |
Services Occupations
The most common Services occupations in Oglethorpe County are Cleaning & Maintenance (548 | 7.7%), Healthcare Support (266 | 3.8%), Food Preparation & Serving (228 | 3.2%), Security & Protection (100 | 1.4%), and Law Enforcement (67 | 0.9%).

Services Occupations by Sex
Within the Services occupations in Oglethorpe County, the most male-oriented occupations are Law Enforcement (97.0%), Security & Protection (86.0%), and Firefighting & Prevention (63.6%), while the most female-oriented occupations are Personal Care & Service (100.0%), Healthcare Support (82.3%), and Cleaning & Maintenance (65.1%).

| Occupation | Male | Female |
| Healthcare Support | 47 (17.7%) | 219 (82.3%) |
| Security & Protection | 86 (86.0%) | 14 (14.0%) |
| Firefighting & Prevention | 21 (63.6%) | 12 (36.4%) |
| Law Enforcement | 65 (97.0%) | 2 (3.0%) |
| Food Preparation & Serving | 128 (56.1%) | 100 (43.9%) |
| Cleaning & Maintenance | 191 (34.8%) | 357 (65.1%) |
| Personal Care & Service | 0 (0.0%) | 31 (100.0%) |
| Total (Category) | 452 (38.5%) | 721 (61.5%) |
| Total (Overall) | 3,613 (51.1%) | 3,455 (48.9%) |
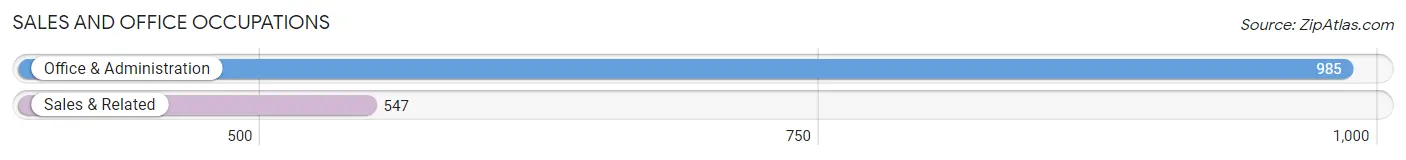
Sales and Office Occupations
The most common Sales and Office occupations in Oglethorpe County are Office & Administration (985 | 13.9%), and Sales & Related (547 | 7.7%).
Sales and Office Occupations by Sex
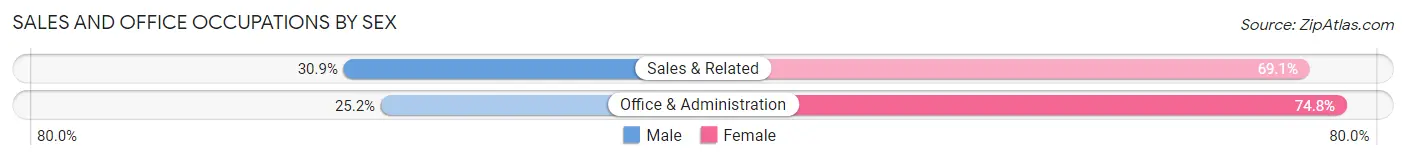
| Occupation | Male | Female |
| Sales & Related | 169 (30.9%) | 378 (69.1%) |
| Office & Administration | 248 (25.2%) | 737 (74.8%) |
| Total (Category) | 417 (27.2%) | 1,115 (72.8%) |
| Total (Overall) | 3,613 (51.1%) | 3,455 (48.9%) |
Natural Resources, Construction and Maintenance Occupations
The most common Natural Resources, Construction and Maintenance occupations in Oglethorpe County are Construction & Extraction (384 | 5.4%), Installation, Maintenance & Repair (308 | 4.4%), and Farming, Fishing & Forestry (44 | 0.6%).

Natural Resources, Construction and Maintenance Occupations by Sex

| Occupation | Male | Female |
| Farming, Fishing & Forestry | 14 (31.8%) | 30 (68.2%) |
| Construction & Extraction | 384 (100.0%) | 0 (0.0%) |
| Installation, Maintenance & Repair | 290 (94.2%) | 18 (5.8%) |
| Total (Category) | 688 (93.5%) | 48 (6.5%) |
| Total (Overall) | 3,613 (51.1%) | 3,455 (48.9%) |
Production, Transportation and Moving Occupations
The most common Production, Transportation and Moving occupations in Oglethorpe County are Production (510 | 7.2%), Material Moving (360 | 5.1%), and Transportation (303 | 4.3%).

Production, Transportation and Moving Occupations by Sex

| Occupation | Male | Female |
| Production | 403 (79.0%) | 107 (21.0%) |
| Transportation | 283 (93.4%) | 20 (6.6%) |
| Material Moving | 231 (64.2%) | 129 (35.8%) |
| Total (Category) | 917 (78.2%) | 256 (21.8%) |
| Total (Overall) | 3,613 (51.1%) | 3,455 (48.9%) |
Employment Industries by Sex in Oglethorpe County
Employment Industries in Oglethorpe County
The major employment industries in Oglethorpe County include Educational Services (1,020 | 14.4%), Health Care & Social Assistance (1,010 | 14.3%), Manufacturing (698 | 9.9%), Retail Trade (660 | 9.3%), and Construction (576 | 8.2%).

Employment Industries by Sex in Oglethorpe County
The Oglethorpe County industries that see more men than women are Mining, Quarrying, & Extraction (100.0%), Utilities (100.0%), and Arts, Entertainment & Recreation (95.4%), whereas the industries that tend to have a higher number of women are Health Care & Social Assistance (77.2%), Educational Services (75.9%), and Finance & Insurance (65.1%).

| Industry | Male | Female |
| Agriculture, Fishing & Hunting | 179 (74.0%) | 63 (26.0%) |
| Mining, Quarrying, & Extraction | 7 (100.0%) | 0 (0.0%) |
| Construction | 474 (82.3%) | 102 (17.7%) |
| Manufacturing | 549 (78.6%) | 149 (21.3%) |
| Wholesale Trade | 115 (58.1%) | 83 (41.9%) |
| Retail Trade | 347 (52.6%) | 313 (47.4%) |
| Transportation & Warehousing | 315 (55.7%) | 250 (44.3%) |
| Utilities | 130 (100.0%) | 0 (0.0%) |
| Information | 37 (90.2%) | 4 (9.8%) |
| Finance & Insurance | 45 (34.9%) | 84 (65.1%) |
| Real Estate, Rental & Leasing | 41 (48.8%) | 43 (51.2%) |
| Professional & Scientific | 98 (40.2%) | 146 (59.8%) |
| Enterprise Management | 0 (0.0%) | 0 (0.0%) |
| Administrative & Support | 210 (48.5%) | 223 (51.5%) |
| Educational Services | 246 (24.1%) | 774 (75.9%) |
| Health Care & Social Assistance | 230 (22.8%) | 780 (77.2%) |
| Arts, Entertainment & Recreation | 62 (95.4%) | 3 (4.6%) |
| Accommodation & Food Services | 129 (38.1%) | 210 (62.0%) |
| Public Administration | 180 (55.0%) | 147 (45.0%) |
| Total | 3,613 (51.1%) | 3,455 (48.9%) |
Education in Oglethorpe County
School Enrollment in Oglethorpe County
The most common levels of schooling among the 3,355 students in Oglethorpe County are high school (948 | 28.3%), elementary school (880 | 26.2%), and college / undergraduate (597 | 17.8%).

| School Level | # Students | % Students |
| Nursery / Preschool | 215 | 6.4% |
| Kindergarten | 139 | 4.1% |
| Elementary School | 880 | 26.2% |
| Middle School | 502 | 15.0% |
| High School | 948 | 28.3% |
| College / Undergraduate | 597 | 17.8% |
| Graduate / Professional | 74 | 2.2% |
| Total | 3,355 | 100.0% |
School Enrollment by Age by Funding Source in Oglethorpe County
Out of a total of 3,355 students who are enrolled in schools in Oglethorpe County, 393 (11.7%) attend a private institution, while the remaining 2,962 (88.3%) are enrolled in public schools. The age group of 25 to 34 year olds has the highest likelihood of being enrolled in private schools, with 73 (52.1% in the age bracket) enrolled. Conversely, the age group of 18 to 19 year olds has the lowest likelihood of being enrolled in a private school, with 411 (100.0% in the age bracket) attending a public institution.

| Age Bracket | Public School | Private School |
| 3 to 4 Year Olds | 63 (50.4%) | 62 (49.6%) |
| 5 to 9 Year Old | 896 (94.8%) | 49 (5.2%) |
| 10 to 14 Year Olds | 653 (90.7%) | 67 (9.3%) |
| 15 to 17 Year Olds | 547 (89.4%) | 65 (10.6%) |
| 18 to 19 Year Olds | 411 (100.0%) | 0 (0.0%) |
| 20 to 24 Year Olds | 215 (84.7%) | 39 (15.3%) |
| 25 to 34 Year Olds | 67 (47.9%) | 73 (52.1%) |
| 35 Years and over | 111 (75.0%) | 37 (25.0%) |
| Total | 2,962 (88.3%) | 393 (11.7%) |
Educational Attainment by Field of Study in Oglethorpe County
Business (475 | 18.1%), bio, nature & agricultural (473 | 18.0%), education (440 | 16.8%), science & technology (270 | 10.3%), and social sciences (193 | 7.4%) are the most common fields of study among 2,620 individuals in Oglethorpe County who have obtained a bachelor's degree or higher.

| Field of Study | # Graduates | % Graduates |
| Computers & Mathematics | 50 | 1.9% |
| Bio, Nature & Agricultural | 473 | 18.0% |
| Physical & Health Sciences | 57 | 2.2% |
| Psychology | 162 | 6.2% |
| Social Sciences | 193 | 7.4% |
| Engineering | 64 | 2.4% |
| Multidisciplinary Studies | 18 | 0.7% |
| Science & Technology | 270 | 10.3% |
| Business | 475 | 18.1% |
| Education | 440 | 16.8% |
| Literature & Languages | 24 | 0.9% |
| Liberal Arts & History | 73 | 2.8% |
| Visual & Performing Arts | 46 | 1.8% |
| Communications | 103 | 3.9% |
| Arts & Humanities | 172 | 6.6% |
| Total | 2,620 | 100.0% |
Transportation & Commute in Oglethorpe County
Vehicle Availability by Sex in Oglethorpe County
The most prevalent vehicle ownership categories in Oglethorpe County are males with 2 vehicles (1,397, accounting for 38.7%) and females with 2 vehicles (1,180, making up 41.7%).

| Vehicles Available | Male | Female |
| No Vehicle | 0 (0.0%) | 0 (0.0%) |
| 1 Vehicle | 155 (4.3%) | 505 (15.1%) |
| 2 Vehicles | 1,397 (38.7%) | 1,180 (35.2%) |
| 3 Vehicles | 1,017 (28.2%) | 974 (29.1%) |
| 4 Vehicles | 461 (12.8%) | 383 (11.4%) |
| 5 or more Vehicles | 580 (16.1%) | 306 (9.1%) |
| Total | 3,610 (100.0%) | 3,348 (100.0%) |
Commute Time in Oglethorpe County
The most frequently occuring commute durations in Oglethorpe County are 30 to 34 minutes (1,249 commuters, 18.8%), 20 to 24 minutes (1,123 commuters, 16.9%), and 15 to 19 minutes (997 commuters, 15.0%).

| Commute Time | # Commuters | % Commuters |
| Less than 5 Minutes | 99 | 1.5% |
| 5 to 9 Minutes | 253 | 3.8% |
| 10 to 14 Minutes | 273 | 4.1% |
| 15 to 19 Minutes | 997 | 15.0% |
| 20 to 24 Minutes | 1,123 | 16.9% |
| 25 to 29 Minutes | 478 | 7.2% |
| 30 to 34 Minutes | 1,249 | 18.8% |
| 35 to 39 Minutes | 287 | 4.3% |
| 40 to 44 Minutes | 514 | 7.7% |
| 45 to 59 Minutes | 702 | 10.6% |
| 60 to 89 Minutes | 393 | 5.9% |
| 90 or more Minutes | 272 | 4.1% |
Commute Time by Sex in Oglethorpe County
The most common commute times in Oglethorpe County are 15 to 19 minutes (665 commuters, 19.6%) for males and 20 to 24 minutes (736 commuters, 22.7%) for females.

| Commute Time | Male | Female |
| Less than 5 Minutes | 39 (1.1%) | 60 (1.8%) |
| 5 to 9 Minutes | 74 (2.2%) | 179 (5.5%) |
| 10 to 14 Minutes | 119 (3.5%) | 154 (4.7%) |
| 15 to 19 Minutes | 665 (19.6%) | 332 (10.2%) |
| 20 to 24 Minutes | 387 (11.4%) | 736 (22.7%) |
| 25 to 29 Minutes | 232 (6.8%) | 246 (7.6%) |
| 30 to 34 Minutes | 622 (18.3%) | 627 (19.3%) |
| 35 to 39 Minutes | 138 (4.1%) | 149 (4.6%) |
| 40 to 44 Minutes | 319 (9.4%) | 195 (6.0%) |
| 45 to 59 Minutes | 304 (9.0%) | 398 (12.3%) |
| 60 to 89 Minutes | 290 (8.5%) | 103 (3.2%) |
| 90 or more Minutes | 205 (6.0%) | 67 (2.1%) |
Time of Departure to Work by Sex in Oglethorpe County
The most frequent times of departure to work in Oglethorpe County are 7:00 AM to 7:29 AM (638, 18.8%) for males and 7:00 AM to 7:29 AM (775, 23.9%) for females.

| Time of Departure | Male | Female |
| 12:00 AM to 4:59 AM | 341 (10.1%) | 70 (2.2%) |
| 5:00 AM to 5:29 AM | 215 (6.3%) | 64 (2.0%) |
| 5:30 AM to 5:59 AM | 201 (5.9%) | 71 (2.2%) |
| 6:00 AM to 6:29 AM | 492 (14.5%) | 108 (3.3%) |
| 6:30 AM to 6:59 AM | 284 (8.4%) | 382 (11.8%) |
| 7:00 AM to 7:29 AM | 638 (18.8%) | 775 (23.9%) |
| 7:30 AM to 7:59 AM | 487 (14.3%) | 616 (19.0%) |
| 8:00 AM to 8:29 AM | 196 (5.8%) | 454 (14.0%) |
| 8:30 AM to 8:59 AM | 128 (3.8%) | 233 (7.2%) |
| 9:00 AM to 9:59 AM | 32 (0.9%) | 222 (6.8%) |
| 10:00 AM to 10:59 AM | 77 (2.3%) | 71 (2.2%) |
| 11:00 AM to 11:59 AM | 8 (0.2%) | 15 (0.5%) |
| 12:00 PM to 3:59 PM | 197 (5.8%) | 67 (2.1%) |
| 4:00 PM to 11:59 PM | 98 (2.9%) | 98 (3.0%) |
| Total | 3,394 (100.0%) | 3,246 (100.0%) |
Housing Occupancy in Oglethorpe County
Occupancy by Ownership in Oglethorpe County
Of the total 5,273 dwellings in Oglethorpe County, owner-occupied units account for 4,129 (78.3%), while renter-occupied units make up 1,144 (21.7%).

| Occupancy | # Housing Units | % Housing Units |
| Owner Occupied Housing Units | 4,129 | 78.3% |
| Renter-Occupied Housing Units | 1,144 | 21.7% |
| Total Occupied Housing Units | 5,273 | 100.0% |
Occupancy by Household Size in Oglethorpe County
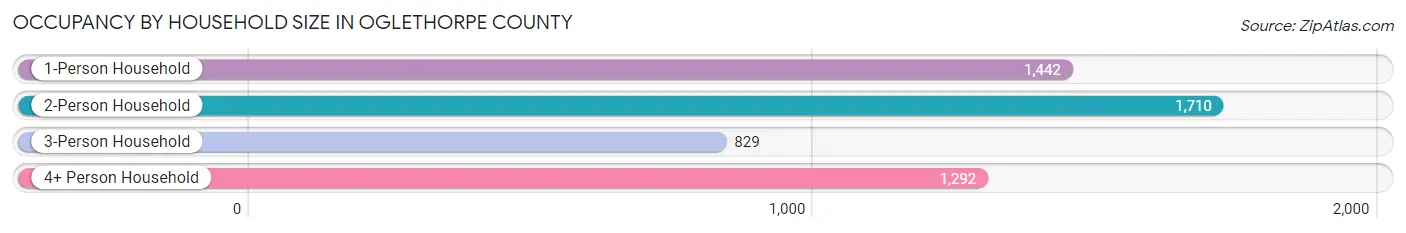
| Household Size | # Housing Units | % Housing Units |
| 1-Person Household | 1,442 | 27.4% |
| 2-Person Household | 1,710 | 32.4% |
| 3-Person Household | 829 | 15.7% |
| 4+ Person Household | 1,292 | 24.5% |
| Total Housing Units | 5,273 | 100.0% |
Occupancy by Ownership by Household Size in Oglethorpe County

| Household Size | Owner-occupied | Renter-occupied |
| 1-Person Household | 986 (68.4%) | 456 (31.6%) |
| 2-Person Household | 1,543 (90.2%) | 167 (9.8%) |
| 3-Person Household | 586 (70.7%) | 243 (29.3%) |
| 4+ Person Household | 1,014 (78.5%) | 278 (21.5%) |
| Total Housing Units | 4,129 (78.3%) | 1,144 (21.7%) |
Occupancy by Educational Attainment in Oglethorpe County

| Household Size | Owner-occupied | Renter-occupied |
| Less than High School | 328 (58.6%) | 232 (41.4%) |
| High School Diploma | 1,211 (67.7%) | 577 (32.3%) |
| College/Associate Degree | 1,329 (87.1%) | 197 (12.9%) |
| Bachelor's Degree or higher | 1,261 (90.1%) | 138 (9.9%) |
Occupancy by Age of Householder in Oglethorpe County
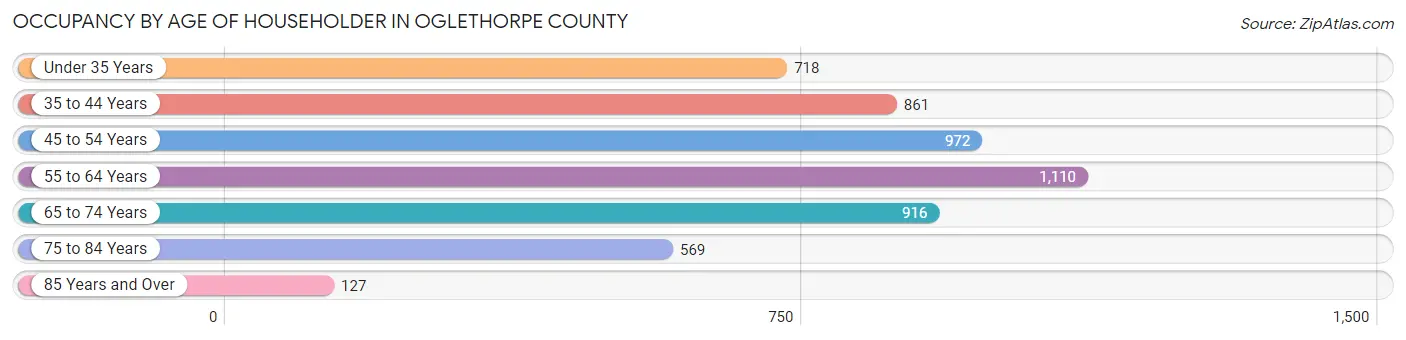
| Age Bracket | # Households | % Households |
| Under 35 Years | 718 | 13.6% |
| 35 to 44 Years | 861 | 16.3% |
| 45 to 54 Years | 972 | 18.4% |
| 55 to 64 Years | 1,110 | 21.0% |
| 65 to 74 Years | 916 | 17.4% |
| 75 to 84 Years | 569 | 10.8% |
| 85 Years and Over | 127 | 2.4% |
| Total | 5,273 | 100.0% |
Housing Finances in Oglethorpe County
Median Income by Occupancy in Oglethorpe County

| Occupancy Type | # Households | Median Income |
| Owner-Occupied | 4,129 (78.3%) | $77,743 |
| Renter-Occupied | 1,144 (21.7%) | $43,348 |
| Average | 5,273 (100.0%) | $66,672 |
Occupancy by Householder Income Bracket in Oglethorpe County

| Income Bracket | Owner-occupied | Renter-occupied |
| Less than $5,000 | 129 (3.1%) | 26 (2.3%) |
| $5,000 to $9,999 | 49 (1.2%) | 134 (11.7%) |
| $10,000 to $14,999 | 189 (4.6%) | 135 (11.8%) |
| $15,000 to $19,999 | 59 (1.4%) | 68 (5.9%) |
| $20,000 to $24,999 | 229 (5.6%) | 49 (4.3%) |
| $25,000 to $34,999 | 329 (8.0%) | 132 (11.5%) |
| $35,000 to $49,999 | 381 (9.2%) | 104 (9.1%) |
| $50,000 to $74,999 | 678 (16.4%) | 259 (22.6%) |
| $75,000 to $99,999 | 745 (18.0%) | 179 (15.7%) |
| $100,000 to $149,999 | 715 (17.3%) | 38 (3.3%) |
| $150,000 or more | 626 (15.2%) | 20 (1.8%) |
| Total | 4,129 (100.0%) | 1,144 (100.0%) |
Monthly Housing Cost Tiers in Oglethorpe County
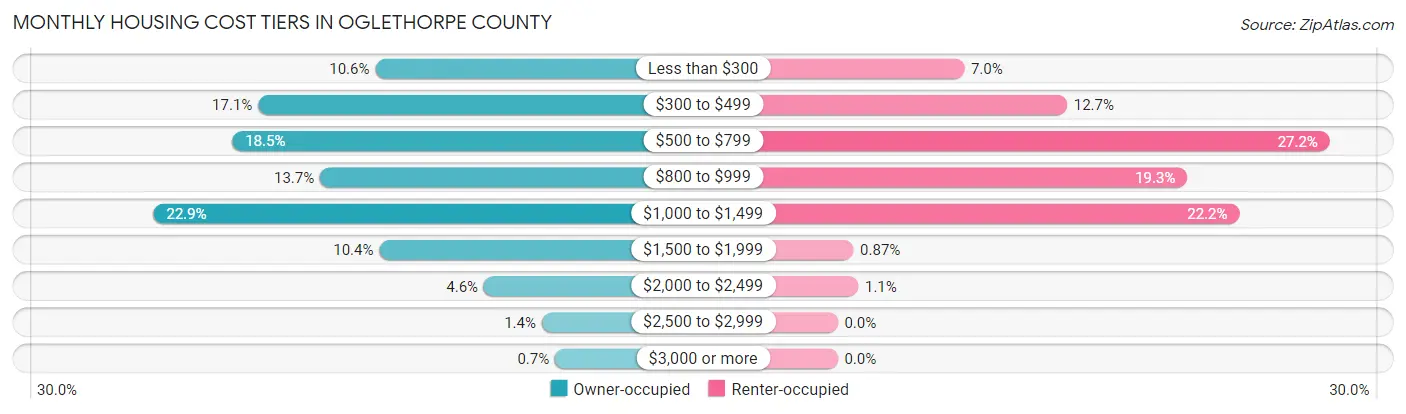
| Monthly Cost | Owner-occupied | Renter-occupied |
| Less than $300 | 439 (10.6%) | 80 (7.0%) |
| $300 to $499 | 706 (17.1%) | 145 (12.7%) |
| $500 to $799 | 765 (18.5%) | 311 (27.2%) |
| $800 to $999 | 565 (13.7%) | 221 (19.3%) |
| $1,000 to $1,499 | 945 (22.9%) | 254 (22.2%) |
| $1,500 to $1,999 | 430 (10.4%) | 10 (0.9%) |
| $2,000 to $2,499 | 191 (4.6%) | 13 (1.1%) |
| $2,500 to $2,999 | 59 (1.4%) | 0 (0.0%) |
| $3,000 or more | 29 (0.7%) | 0 (0.0%) |
| Total | 4,129 (100.0%) | 1,144 (100.0%) |
Physical Housing Characteristics in Oglethorpe County
Housing Structures in Oglethorpe County

| Structure Type | # Housing Units | % Housing Units |
| Single Unit, Detached | 3,720 | 70.6% |
| Single Unit, Attached | 26 | 0.5% |
| 2 Unit Apartments | 15 | 0.3% |
| 3 or 4 Unit Apartments | 70 | 1.3% |
| 5 to 9 Unit Apartments | 19 | 0.4% |
| 10 or more Apartments | 146 | 2.8% |
| Mobile Home / Other | 1,277 | 24.2% |
| Total | 5,273 | 100.0% |
Housing Structures by Occupancy in Oglethorpe County

| Structure Type | Owner-occupied | Renter-occupied |
| Single Unit, Detached | 3,247 (87.3%) | 473 (12.7%) |
| Single Unit, Attached | 15 (57.7%) | 11 (42.3%) |
| 2 Unit Apartments | 0 (0.0%) | 15 (100.0%) |
| 3 or 4 Unit Apartments | 0 (0.0%) | 70 (100.0%) |
| 5 to 9 Unit Apartments | 0 (0.0%) | 19 (100.0%) |
| 10 or more Apartments | 0 (0.0%) | 146 (100.0%) |
| Mobile Home / Other | 867 (67.9%) | 410 (32.1%) |
| Total | 4,129 (78.3%) | 1,144 (21.7%) |
Housing Structures by Number of Rooms in Oglethorpe County

| Number of Rooms | Owner-occupied | Renter-occupied |
| 1 Room | 55 (1.3%) | 21 (1.8%) |
| 2 or 3 Rooms | 44 (1.1%) | 136 (11.9%) |
| 4 or 5 Rooms | 1,166 (28.2%) | 608 (53.1%) |
| 6 or 7 Rooms | 1,641 (39.7%) | 311 (27.2%) |
| 8 or more Rooms | 1,223 (29.6%) | 68 (5.9%) |
| Total | 4,129 (100.0%) | 1,144 (100.0%) |
Housing Structure by Heating Type in Oglethorpe County

| Heating Type | Owner-occupied | Renter-occupied |
| Utility Gas | 447 (10.8%) | 69 (6.0%) |
| Bottled, Tank, or LP Gas | 790 (19.1%) | 41 (3.6%) |
| Electricity | 2,601 (63.0%) | 1,034 (90.4%) |
| Fuel Oil or Kerosene | 0 (0.0%) | 0 (0.0%) |
| Coal or Coke | 0 (0.0%) | 0 (0.0%) |
| All other Fuels | 254 (6.1%) | 0 (0.0%) |
| No Fuel Used | 37 (0.9%) | 0 (0.0%) |
| Total | 4,129 (100.0%) | 1,144 (100.0%) |
Household Vehicle Usage in Oglethorpe County

| Vehicles per Household | Owner-occupied | Renter-occupied |
| No Vehicle | 64 (1.5%) | 105 (9.2%) |
| 1 Vehicle | 728 (17.6%) | 529 (46.2%) |
| 2 Vehicles | 1,560 (37.8%) | 298 (26.1%) |
| 3 or more Vehicles | 1,777 (43.0%) | 212 (18.5%) |
| Total | 4,129 (100.0%) | 1,144 (100.0%) |
Real Estate & Mortgages in Oglethorpe County
Real Estate and Mortgage Overview in Oglethorpe County
| Characteristic | Without Mortgage | With Mortgage |
| Housing Units | 2,083 | 2,046 |
| Median Property Value | $143,300 | $210,200 |
| Median Household Income | $53,184 | $341 |
| Monthly Housing Costs | $465 | $29 |
| Real Estate Taxes | $1,255 | $62 |
Property Value by Mortgage Status in Oglethorpe County

| Property Value | Without Mortgage | With Mortgage |
| Less than $50,000 | 336 (16.1%) | 95 (4.6%) |
| $50,000 to $99,999 | 388 (18.6%) | 188 (9.2%) |
| $100,000 to $299,999 | 1,060 (50.9%) | 1,344 (65.7%) |
| $300,000 to $499,999 | 172 (8.3%) | 356 (17.4%) |
| $500,000 to $749,999 | 87 (4.2%) | 54 (2.6%) |
| $750,000 to $999,999 | 22 (1.1%) | 1 (0.1%) |
| $1,000,000 or more | 18 (0.9%) | 8 (0.4%) |
| Total | 2,083 (100.0%) | 2,046 (100.0%) |
Household Income by Mortgage Status in Oglethorpe County

| Household Income | Without Mortgage | With Mortgage |
| Less than $10,000 | 169 (8.1%) | 27 (1.3%) |
| $10,000 to $24,999 | 360 (17.3%) | 9 (0.4%) |
| $25,000 to $34,999 | 237 (11.4%) | 117 (5.7%) |
| $35,000 to $49,999 | 192 (9.2%) | 92 (4.5%) |
| $50,000 to $74,999 | 266 (12.8%) | 189 (9.2%) |
| $75,000 to $99,999 | 264 (12.7%) | 412 (20.1%) |
| $100,000 to $149,999 | 310 (14.9%) | 481 (23.5%) |
| $150,000 or more | 285 (13.7%) | 405 (19.8%) |
| Total | 2,083 (100.0%) | 2,046 (100.0%) |
Property Value to Household Income Ratio in Oglethorpe County

| Value-to-Income Ratio | Without Mortgage | With Mortgage |
| Less than 2.0x | 954 (45.8%) | 84,150 (4,112.9%) |
| 2.0x to 2.9x | 245 (11.8%) | 750 (36.7%) |
| 3.0x to 3.9x | 174 (8.4%) | 574 (28.1%) |
| 4.0x or more | 590 (28.3%) | 255 (12.5%) |
| Total | 2,083 (100.0%) | 2,046 (100.0%) |
Real Estate Taxes by Mortgage Status in Oglethorpe County

| Property Taxes | Without Mortgage | With Mortgage |
| Less than $800 | 715 (34.3%) | 0 (0.0%) |
| $800 to $1,499 | 460 (22.1%) | 303 (14.8%) |
| $800 to $1,499 | 823 (39.5%) | 558 (27.3%) |
| Total | 2,083 (100.0%) | 2,046 (100.0%) |
Health & Disability in Oglethorpe County
Health Insurance Coverage by Age in Oglethorpe County

| Age Bracket | With Coverage | Without Coverage |
| Under 6 Years | 915 (99.0%) | 9 (1.0%) |
| 6 to 18 Years | 2,345 (96.7%) | 79 (3.3%) |
| 19 to 25 Years | 898 (73.3%) | 328 (26.8%) |
| 26 to 34 Years | 1,193 (78.8%) | 321 (21.2%) |
| 35 to 44 Years | 1,363 (76.8%) | 411 (23.2%) |
| 45 to 54 Years | 1,540 (77.8%) | 439 (22.2%) |
| 55 to 64 Years | 2,000 (89.6%) | 232 (10.4%) |
| 65 to 74 Years | 1,664 (100.0%) | 0 (0.0%) |
| 75 Years and older | 1,052 (97.9%) | 23 (2.1%) |
| Total | 12,970 (87.6%) | 1,842 (12.4%) |
Health Insurance Coverage by Citizenship Status in Oglethorpe County

| Citizenship Status | With Coverage | Without Coverage |
| Native Born | 915 (99.0%) | 9 (1.0%) |
| Foreign Born, Citizen | 2,345 (96.7%) | 79 (3.3%) |
| Foreign Born, not a Citizen | 898 (73.3%) | 328 (26.8%) |
Health Insurance Coverage by Household Income in Oglethorpe County

| Household Income | With Coverage | Without Coverage |
| Under $25,000 | 1,349 (76.6%) | 413 (23.4%) |
| $25,000 to $49,999 | 1,992 (85.6%) | 335 (14.4%) |
| $50,000 to $74,999 | 1,965 (84.1%) | 372 (15.9%) |
| $75,000 to $99,999 | 2,931 (86.5%) | 456 (13.5%) |
| $100,000 and over | 4,732 (94.7%) | 264 (5.3%) |
Public vs Private Health Insurance Coverage by Age in Oglethorpe County

| Age Bracket | Public Insurance | Private Insurance |
| Under 6 | 490 (53.0%) | 472 (51.1%) |
| 6 to 18 Years | 1,225 (50.5%) | 1,241 (51.2%) |
| 19 to 25 Years | 126 (10.3%) | 799 (65.2%) |
| 25 to 34 Years | 259 (17.1%) | 981 (64.8%) |
| 35 to 44 Years | 306 (17.2%) | 1,148 (64.7%) |
| 45 to 54 Years | 316 (16.0%) | 1,308 (66.1%) |
| 55 to 64 Years | 458 (20.5%) | 1,620 (72.6%) |
| 65 to 74 Years | 1,631 (98.0%) | 741 (44.5%) |
| 75 Years and over | 1,041 (96.8%) | 624 (58.1%) |
| Total | 5,852 (39.5%) | 8,934 (60.3%) |
Disability Status by Sex by Age in Oglethorpe County
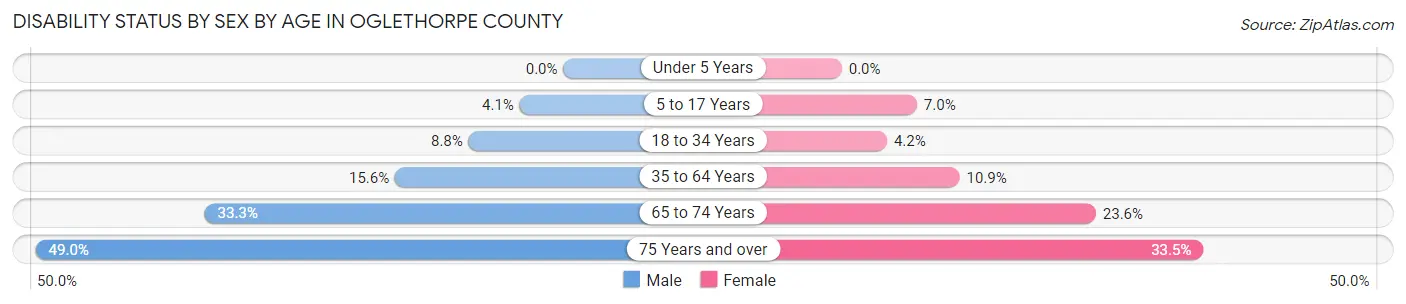
| Age Bracket | Male | Female |
| Under 5 Years | 0 (0.0%) | 0 (0.0%) |
| 5 to 17 Years | 50 (4.1%) | 80 (7.0%) |
| 18 to 34 Years | 132 (8.8%) | 60 (4.2%) |
| 35 to 64 Years | 469 (15.6%) | 326 (10.9%) |
| 65 to 74 Years | 266 (33.3%) | 204 (23.6%) |
| 75 Years and over | 214 (49.0%) | 214 (33.5%) |
Disability Class by Sex by Age in Oglethorpe County
Disability Class: Hearing Difficulty

| Age Bracket | Male | Female |
| Under 5 Years | 0 (0.0%) | 0 (0.0%) |
| 5 to 17 Years | 0 (0.0%) | 0 (0.0%) |
| 18 to 34 Years | 31 (2.1%) | 2 (0.1%) |
| 35 to 64 Years | 107 (3.6%) | 84 (2.8%) |
| 65 to 74 Years | 95 (11.9%) | 64 (7.4%) |
| 75 Years and over | 144 (33.0%) | 78 (12.2%) |
Disability Class: Vision Difficulty

| Age Bracket | Male | Female |
| Under 5 Years | 0 (0.0%) | 0 (0.0%) |
| 5 to 17 Years | 8 (0.6%) | 2 (0.2%) |
| 18 to 34 Years | 27 (1.8%) | 9 (0.6%) |
| 35 to 64 Years | 85 (2.8%) | 67 (2.2%) |
| 65 to 74 Years | 98 (12.3%) | 58 (6.7%) |
| 75 Years and over | 41 (9.4%) | 10 (1.6%) |
Disability Class: Cognitive Difficulty

| Age Bracket | Male | Female |
| 5 to 17 Years | 42 (3.4%) | 78 (6.8%) |
| 18 to 34 Years | 86 (5.7%) | 3 (0.2%) |
| 35 to 64 Years | 85 (2.8%) | 129 (4.3%) |
| 65 to 74 Years | 5 (0.6%) | 39 (4.5%) |
| 75 Years and over | 36 (8.2%) | 61 (9.6%) |
Disability Class: Ambulatory Difficulty

| Age Bracket | Male | Female |
| 5 to 17 Years | 0 (0.0%) | 0 (0.0%) |
| 18 to 34 Years | 42 (2.8%) | 2 (0.1%) |
| 35 to 64 Years | 267 (8.9%) | 132 (4.4%) |
| 65 to 74 Years | 186 (23.3%) | 147 (17.0%) |
| 75 Years and over | 101 (23.1%) | 157 (24.6%) |
Disability Class: Self-Care Difficulty

| Age Bracket | Male | Female |
| 5 to 17 Years | 18 (1.5%) | 47 (4.1%) |
| 18 to 34 Years | 35 (2.3%) | 2 (0.1%) |
| 35 to 64 Years | 203 (6.8%) | 12 (0.4%) |
| 65 to 74 Years | 6 (0.7%) | 8 (0.9%) |
| 75 Years and over | 17 (3.9%) | 43 (6.7%) |
Technology Access in Oglethorpe County
Computing Device Access in Oglethorpe County

| Device Type | # Households | % Households |
| Desktop or Laptop | 3,611 | 68.5% |
| Smartphone | 4,044 | 76.7% |
| Tablet | 2,614 | 49.6% |
| No Computing Device | 676 | 12.8% |
| Total | 5,273 | 100.0% |
Internet Access in Oglethorpe County

| Internet Type | # Households | % Households |
| Dial-Up Internet | 11 | 0.2% |
| Broadband Home | 2,976 | 56.4% |
| Cellular Data Only | 518 | 9.8% |
| Satellite Internet | 523 | 9.9% |
| No Internet | 1,337 | 25.4% |
| Total | 5,273 | 100.0% |
Oglethorpe County Summary
Oglethorpe County is a county located in the northeastern part of the U.S. state of Georgia. As of the 2010 census, the population was 14,899. The county seat is Lexington. The county was created on December 19, 1793 and is named for General James Oglethorpe, the founder of the Georgia Colony.
History
Oglethorpe County was created on December 19, 1793 from land taken from Wilkes County. It was named for General James Oglethorpe, the founder of the Georgia Colony. The county was originally part of the Creek Nation, and the area was home to the Creek Indians until the early 19th century. The first white settlers arrived in the area in the late 1700s, and the county was officially established in 1793.
The county was home to several prominent figures in Georgia history, including William Few, a signer of the United States Constitution, and William H. Crawford, a United States Senator and Secretary of War.
Geography
Oglethorpe County is located in the northeastern part of the state of Georgia. It is bordered by Elbert County to the north, Madison County to the east, Clarke County to the south, and Wilkes County to the west. The county has a total area of 441 square miles, of which 439 square miles is land and 2 square miles (0.5%) is water.
The county is located in the Piedmont region of Georgia, and is characterized by rolling hills and valleys. The county is home to several rivers, including the Broad River, the Oconee River, and the Apalachee River.
Economy
Oglethorpe County has a diversified economy, with the largest industries being manufacturing, retail trade, and health care. The county is home to several large employers, including the Oglethorpe County Hospital, the Oglethorpe County School System, and the Oglethorpe County Sheriff's Office.
The county is also home to several small businesses, including farms, restaurants, and retail stores. The county is home to several wineries, and is a popular destination for wine tours.
Demographics
As of the 2010 census, there were 14,899 people, 5,845 households, and 4,072 families residing in the county. The population density was 34 people per square mile. There were 6,541 housing units at an average density of 15 per square mile. The racial makeup of the county was 79.2% White, 17.3% Black or African American, 0.3% Native American, 0.4% Asian, 0.1% Pacific Islander, 1.3% from other races, and 1.4% from two or more races. 2.7% of the population were Hispanic or Latino of any race.
The median income for a household in the county was $37,945, and the median income for a family was $45,945. The per capita income for the county was $19,845. About 13.2% of families and 16.2% of the population were below the poverty line, including 22.2% of those under age 18 and 11.2% of those age 65 or over.
Common Questions
What is Per Capita Income in Oglethorpe County?
Per Capita income in Oglethorpe County is $30,225.
What is the Median Family Income in Oglethorpe County?
Median Family Income in Oglethorpe County is $79,990.
What is the Median Household income in Oglethorpe County?
Median Household Income in Oglethorpe County is $66,672.
What is Income or Wage Gap in Oglethorpe County?
Income or Wage Gap in Oglethorpe County is 36.3%.
Women in Oglethorpe County earn 63.7 cents for every dollar earned by a man.
What is Inequality or Gini Index in Oglethorpe County?
Inequality or Gini Index in Oglethorpe County is 0.43.
What is the Total Population of Oglethorpe County?
Total Population of Oglethorpe County is 14,974.
What is the Total Male Population of Oglethorpe County?
Total Male Population of Oglethorpe County is 7,528.
What is the Total Female Population of Oglethorpe County?
Total Female Population of Oglethorpe County is 7,446.
What is the Ratio of Males per 100 Females in Oglethorpe County?
There are 101.10 Males per 100 Females in Oglethorpe County.
What is the Ratio of Females per 100 Males in Oglethorpe County?
There are 98.91 Females per 100 Males in Oglethorpe County.
What is the Median Population Age in Oglethorpe County?
Median Population Age in Oglethorpe County is 42.2 Years.
What is the Average Family Size in Oglethorpe County
Average Family Size in Oglethorpe County is 3.4 People.
What is the Average Household Size in Oglethorpe County
Average Household Size in Oglethorpe County is 2.8 People.
How Large is the Labor Force in Oglethorpe County?
There are 7,438 People in the Labor Forcein in Oglethorpe County.
What is the Percentage of People in the Labor Force in Oglethorpe County?
61.3% of People are in the Labor Force in Oglethorpe County.
What is the Unemployment Rate in Oglethorpe County?
Unemployment Rate in Oglethorpe County is 4.5%.