Montgomery County, GA Map & Demographics
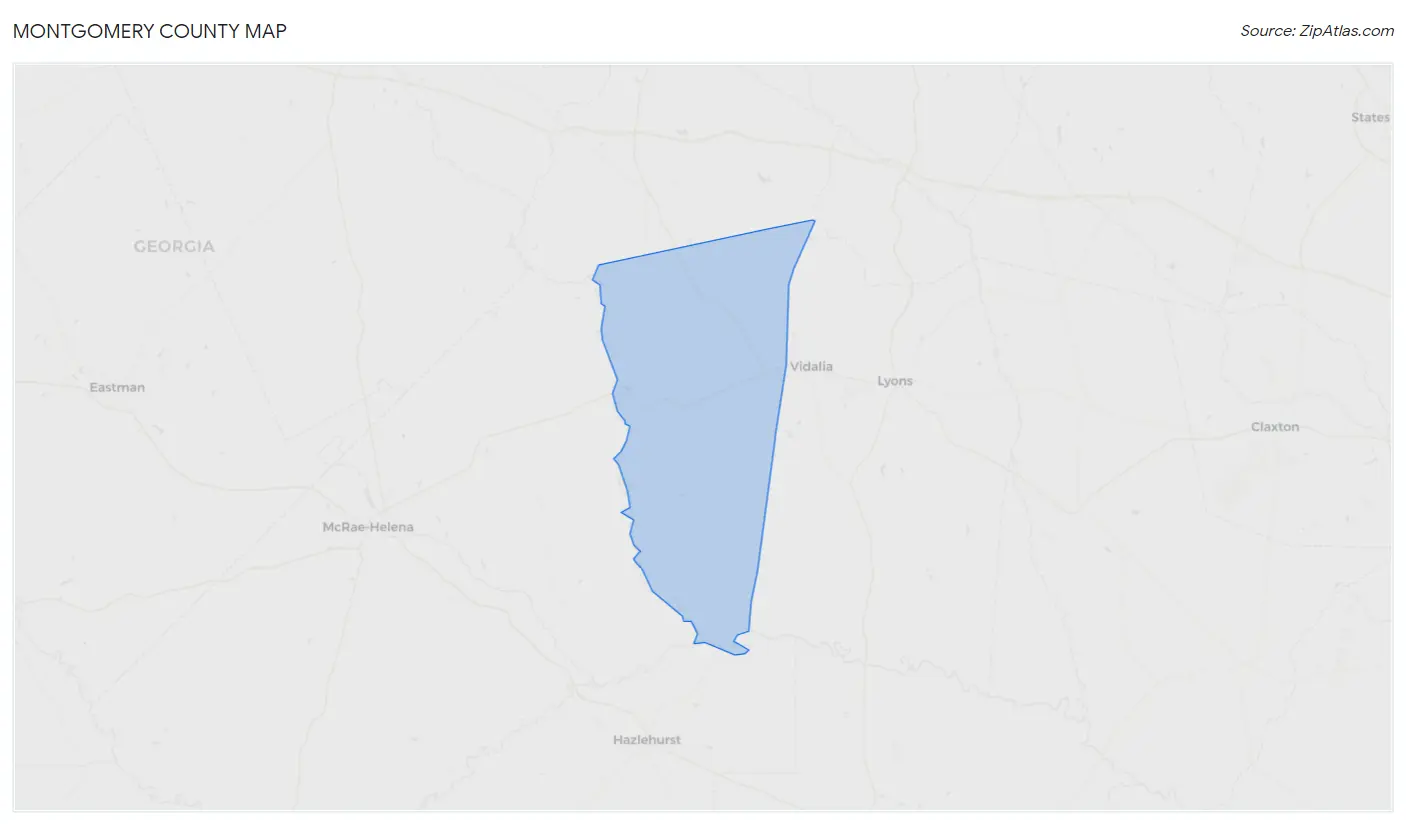
Montgomery County Map
Montgomery County Overview
$27,994
PER CAPITA INCOME
$66,419
AVG FAMILY INCOME
$49,138
AVG HOUSEHOLD INCOME
22.8%
WAGE / INCOME GAP [ % ]
77.2¢/ $1
WAGE / INCOME GAP [ $ ]
$8,315
FAMILY INCOME DEFICIT
0.51
INEQUALITY / GINI INDEX
8,687
TOTAL POPULATION
4,405
MALE POPULATION
4,282
FEMALE POPULATION
102.87
MALES / 100 FEMALES
97.21
FEMALES / 100 MALES
37.5
MEDIAN AGE
3.3
AVG FAMILY SIZE
2.7
AVG HOUSEHOLD SIZE
3,683
LABOR FORCE [ PEOPLE ]
52.0%
PERCENT IN LABOR FORCE
6.5%
UNEMPLOYMENT RATE
Montgomery County Area Codes
Income in Montgomery County
Income Overview in Montgomery County
Per Capita Income in Montgomery County is $27,994, while median incomes of families and households are $66,419 and $49,138 respectively.
| Characteristic | Number | Measure |
| Per Capita Income | 8,687 | $27,994 |
| Median Family Income | 2,073 | $66,419 |
| Mean Family Income | 2,073 | $94,801 |
| Median Household Income | 2,966 | $49,138 |
| Mean Household Income | 2,966 | $79,916 |
| Income Deficit | 2,073 | $8,315 |
| Wage / Income Gap (%) | 8,687 | 22.82% |
| Wage / Income Gap ($) | 8,687 | 77.18¢ per $1 |
| Gini / Inequality Index | 8,687 | 0.51 |
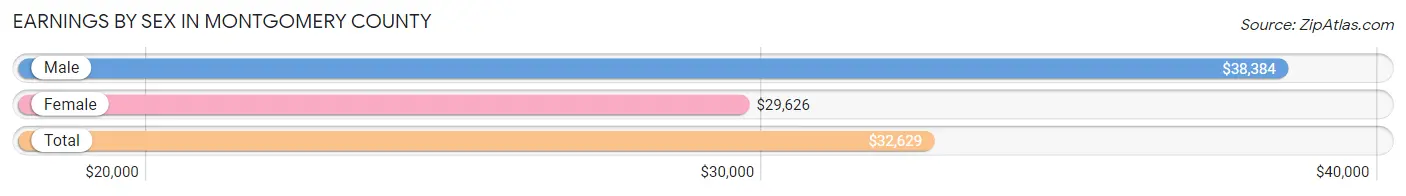
Earnings by Sex in Montgomery County
Average Earnings in Montgomery County are $32,629, $38,384 for men and $29,626 for women, a difference of 22.8%.
| Sex | Number | Average Earnings |
| Male | 2,241 (55.7%) | $38,384 |
| Female | 1,780 (44.3%) | $29,626 |
| Total | 4,021 (100.0%) | $32,629 |
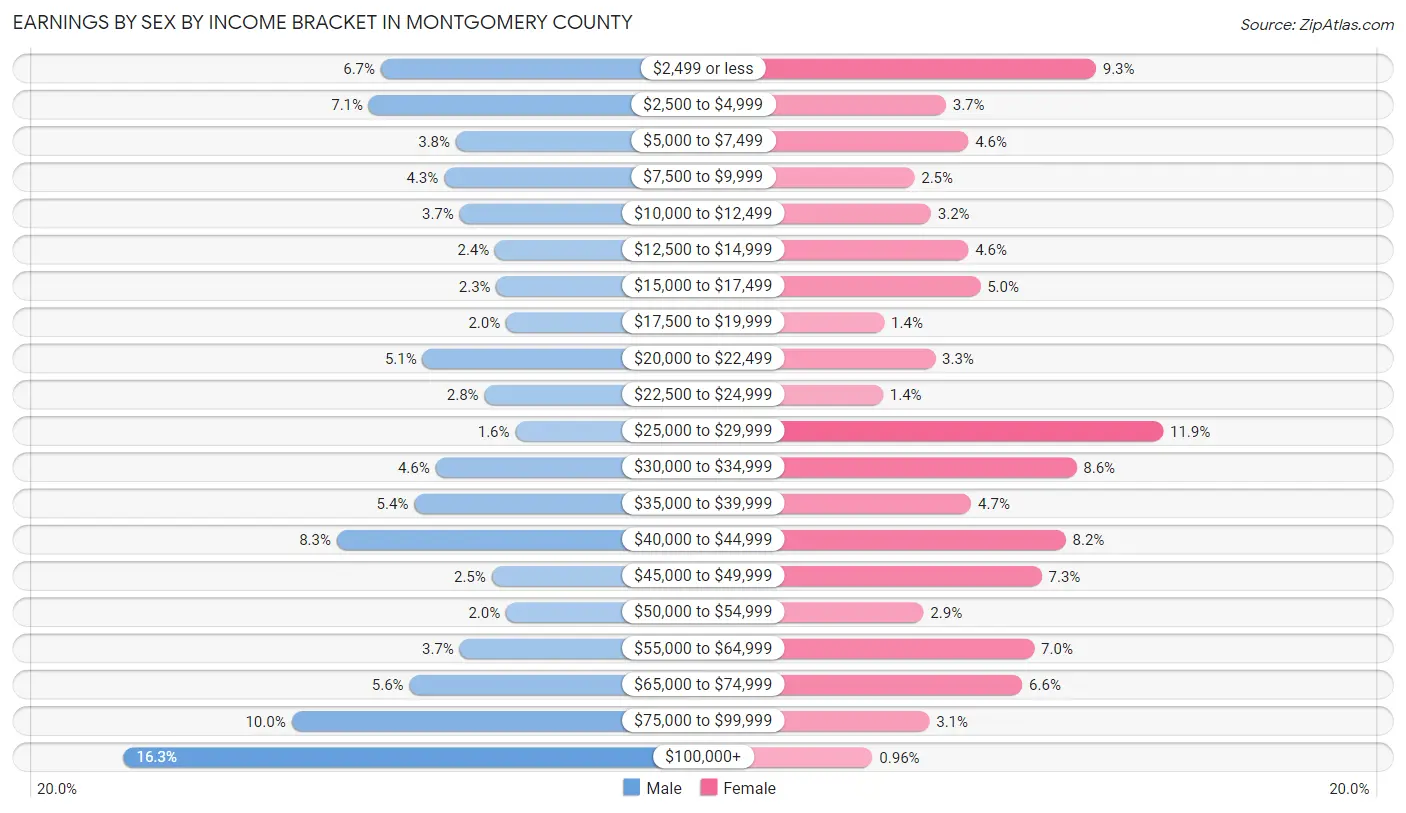
Earnings by Sex by Income Bracket in Montgomery County
The most common earnings brackets in Montgomery County are $100,000+ for men (365 | 16.3%) and $25,000 to $29,999 for women (211 | 11.8%).
| Income | Male | Female |
| $2,499 or less | 149 (6.7%) | 166 (9.3%) |
| $2,500 to $4,999 | 159 (7.1%) | 66 (3.7%) |
| $5,000 to $7,499 | 86 (3.8%) | 81 (4.5%) |
| $7,500 to $9,999 | 96 (4.3%) | 45 (2.5%) |
| $10,000 to $12,499 | 83 (3.7%) | 56 (3.2%) |
| $12,500 to $14,999 | 53 (2.4%) | 81 (4.5%) |
| $15,000 to $17,499 | 52 (2.3%) | 89 (5.0%) |
| $17,500 to $19,999 | 44 (2.0%) | 25 (1.4%) |
| $20,000 to $22,499 | 114 (5.1%) | 59 (3.3%) |
| $22,500 to $24,999 | 62 (2.8%) | 24 (1.3%) |
| $25,000 to $29,999 | 36 (1.6%) | 211 (11.8%) |
| $30,000 to $34,999 | 103 (4.6%) | 153 (8.6%) |
| $35,000 to $39,999 | 121 (5.4%) | 83 (4.7%) |
| $40,000 to $44,999 | 186 (8.3%) | 146 (8.2%) |
| $45,000 to $49,999 | 56 (2.5%) | 130 (7.3%) |
| $50,000 to $54,999 | 44 (2.0%) | 51 (2.9%) |
| $55,000 to $64,999 | 83 (3.7%) | 125 (7.0%) |
| $65,000 to $74,999 | 125 (5.6%) | 117 (6.6%) |
| $75,000 to $99,999 | 224 (10.0%) | 55 (3.1%) |
| $100,000+ | 365 (16.3%) | 17 (1.0%) |
| Total | 2,241 (100.0%) | 1,780 (100.0%) |
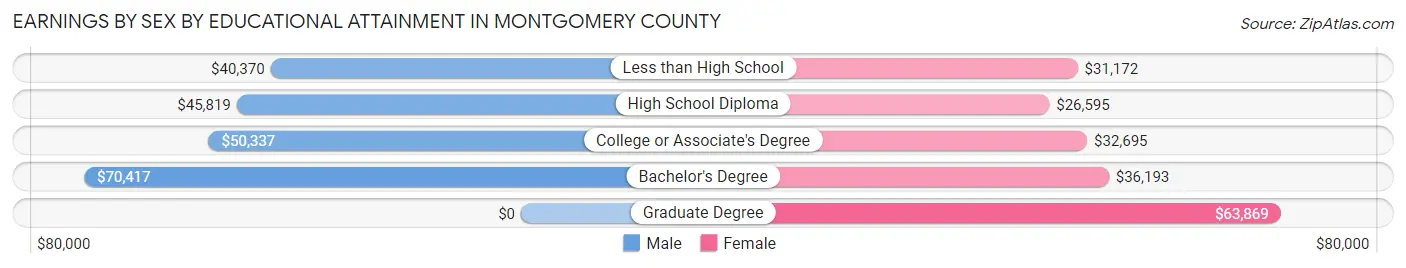
Earnings by Sex by Educational Attainment in Montgomery County
Average earnings in Montgomery County are $42,300 for men and $34,180 for women, a difference of 19.2%. Men with an educational attainment of bachelor's degree enjoy the highest average annual earnings of $70,417, while those with less than high school education earn the least with $40,370. Women with an educational attainment of graduate degree earn the most with the average annual earnings of $63,869, while those with high school diploma education have the smallest earnings of $26,595.
| Educational Attainment | Male Income | Female Income |
| Less than High School | $40,370 | $31,172 |
| High School Diploma | $45,819 | $26,595 |
| College or Associate's Degree | $50,337 | $32,695 |
| Bachelor's Degree | $70,417 | $36,193 |
| Graduate Degree | - | - |
| Total | $42,300 | $34,180 |
Family Income in Montgomery County
Family Income Brackets in Montgomery County
According to the Montgomery County family income data, there are 369 families falling into the $75,000 to $99,999 income range, which is the most common income bracket and makes up 17.8% of all families. Conversely, the less than $10,000 income bracket is the least frequent group with only 70 families (3.4%) belonging to this category.
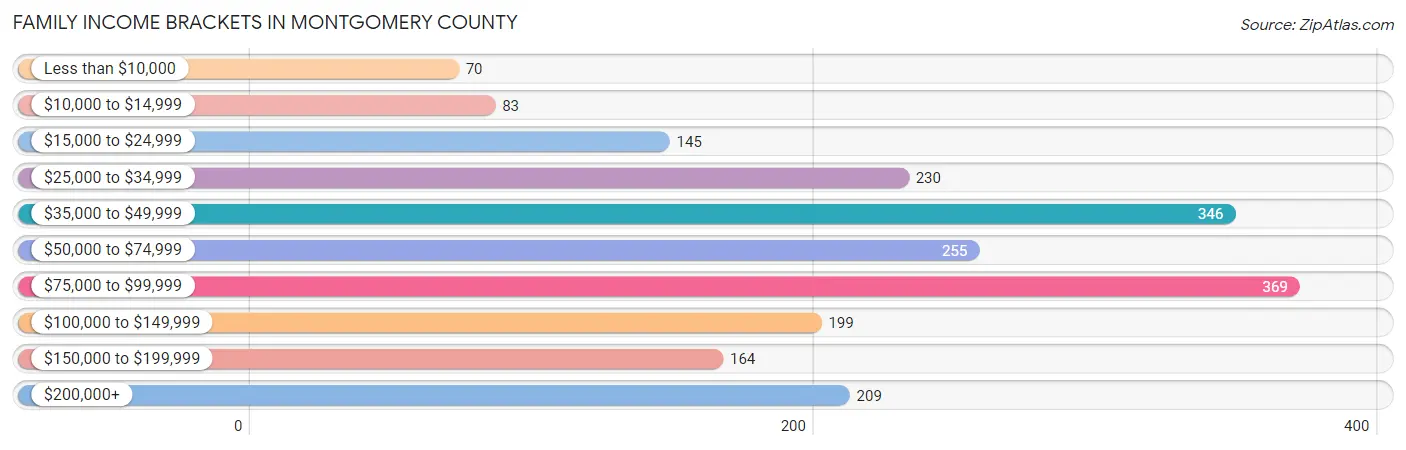
| Income Bracket | # Families | % Families |
| Less than $10,000 | 70 | 3.4% |
| $10,000 to $14,999 | 83 | 4.0% |
| $15,000 to $24,999 | 145 | 7.0% |
| $25,000 to $34,999 | 230 | 11.1% |
| $35,000 to $49,999 | 346 | 16.7% |
| $50,000 to $74,999 | 255 | 12.3% |
| $75,000 to $99,999 | 369 | 17.8% |
| $100,000 to $149,999 | 199 | 9.6% |
| $150,000 to $199,999 | 164 | 7.9% |
| $200,000+ | 209 | 10.1% |
Family Income by Famaliy Size in Montgomery County
7+ person families (23 | 1.1%) account for the highest median family income in Montgomery County with $198,309 per family, while 2-person families (1,001 | 48.3%) have the highest median income of $29,688 per family member.
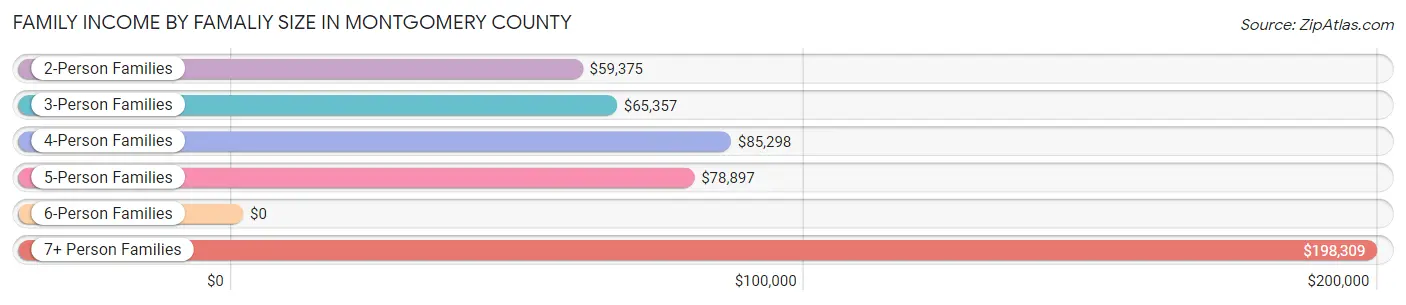
| Income Bracket | # Families | Median Income |
| 2-Person Families | 1,001 (48.3%) | $59,375 |
| 3-Person Families | 412 (19.9%) | $65,357 |
| 4-Person Families | 491 (23.7%) | $85,298 |
| 5-Person Families | 89 (4.3%) | $78,897 |
| 6-Person Families | 57 (2.8%) | $0 |
| 7+ Person Families | 23 (1.1%) | $198,309 |
| Total | 2,073 (100.0%) | $66,419 |
Family Income by Number of Earners in Montgomery County
The median family income in Montgomery County is $66,419, with families comprising 2 earners (719) having the highest median family income of $101,023, while families with no earners (295) have the lowest median family income of $30,026, accounting for 34.7% and 14.2% of families, respectively.
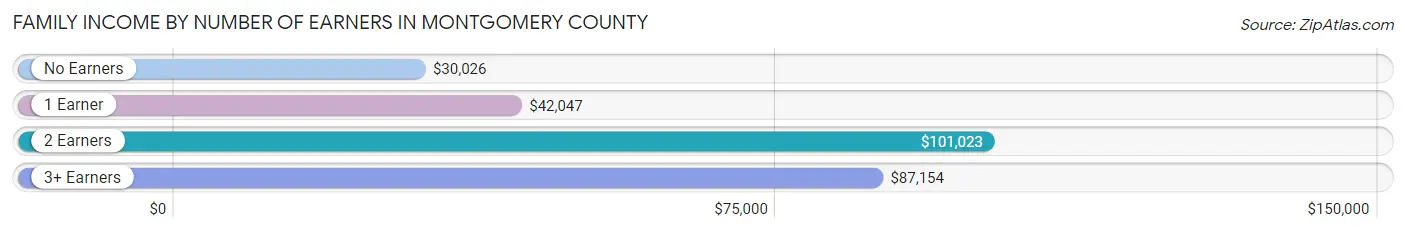
| Number of Earners | # Families | Median Income |
| No Earners | 295 (14.2%) | $30,026 |
| 1 Earner | 855 (41.2%) | $42,047 |
| 2 Earners | 719 (34.7%) | $101,023 |
| 3+ Earners | 204 (9.8%) | $87,154 |
| Total | 2,073 (100.0%) | $66,419 |
Household Income in Montgomery County
Household Income Brackets in Montgomery County
With 501 households falling in the category, the $75,000 to $99,999 income range is the most frequent in Montgomery County, accounting for 16.9% of all households. In contrast, only 163 households (5.5%) fall into the $150,000 to $199,999 income bracket, making it the least populous group.
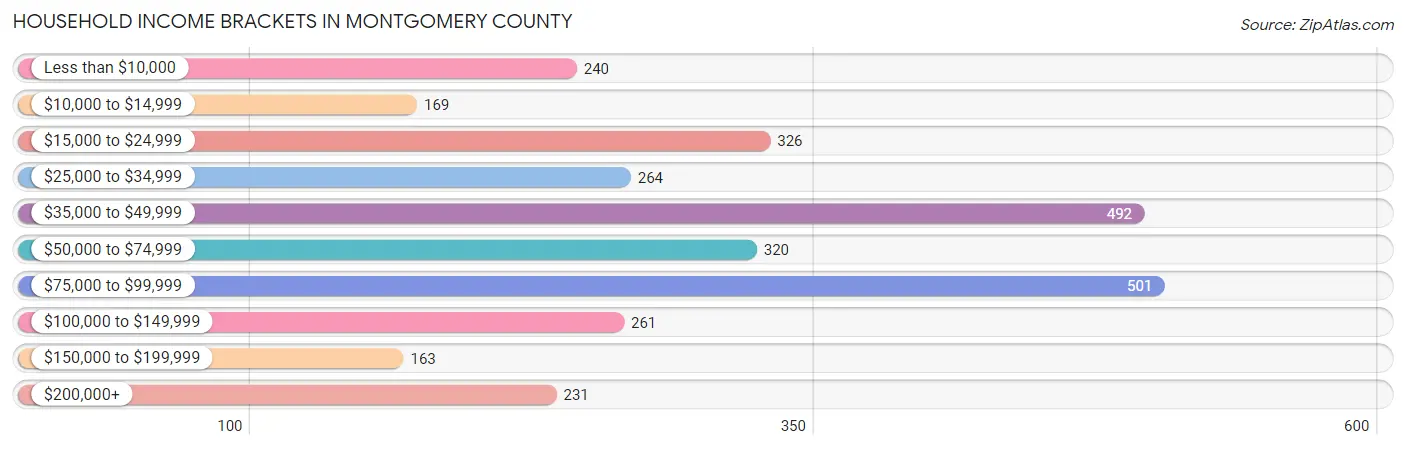
| Income Bracket | # Households | % Households |
| Less than $10,000 | 240 | 8.1% |
| $10,000 to $14,999 | 169 | 5.7% |
| $15,000 to $24,999 | 326 | 11.0% |
| $25,000 to $34,999 | 264 | 8.9% |
| $35,000 to $49,999 | 492 | 16.6% |
| $50,000 to $74,999 | 320 | 10.8% |
| $75,000 to $99,999 | 501 | 16.9% |
| $100,000 to $149,999 | 261 | 8.8% |
| $150,000 to $199,999 | 163 | 5.5% |
| $200,000+ | 231 | 7.8% |
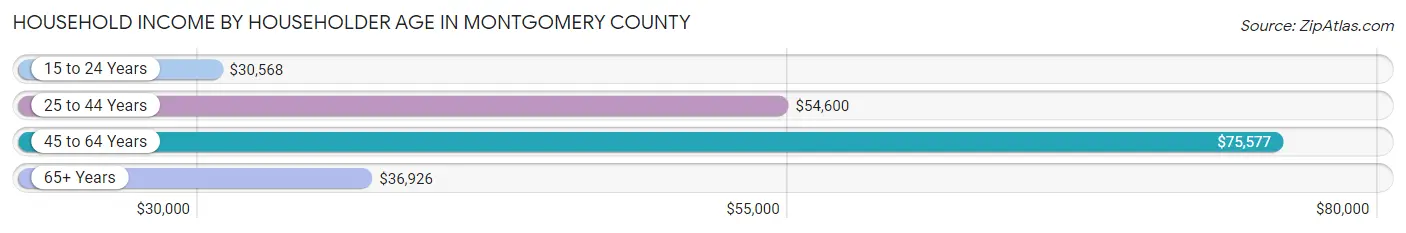
Household Income by Householder Age in Montgomery County
The median household income in Montgomery County is $49,138, with the highest median household income of $75,577 found in the 45 to 64 years age bracket for the primary householder. A total of 1,166 households (39.3%) fall into this category. Meanwhile, the 15 to 24 years age bracket for the primary householder has the lowest median household income of $30,568, with 79 households (2.7%) in this group.
| Income Bracket | # Households | Median Income |
| 15 to 24 Years | 79 (2.7%) | $30,568 |
| 25 to 44 Years | 814 (27.4%) | $54,600 |
| 45 to 64 Years | 1,166 (39.3%) | $75,577 |
| 65+ Years | 907 (30.6%) | $36,926 |
| Total | 2,966 (100.0%) | $49,138 |
Poverty in Montgomery County
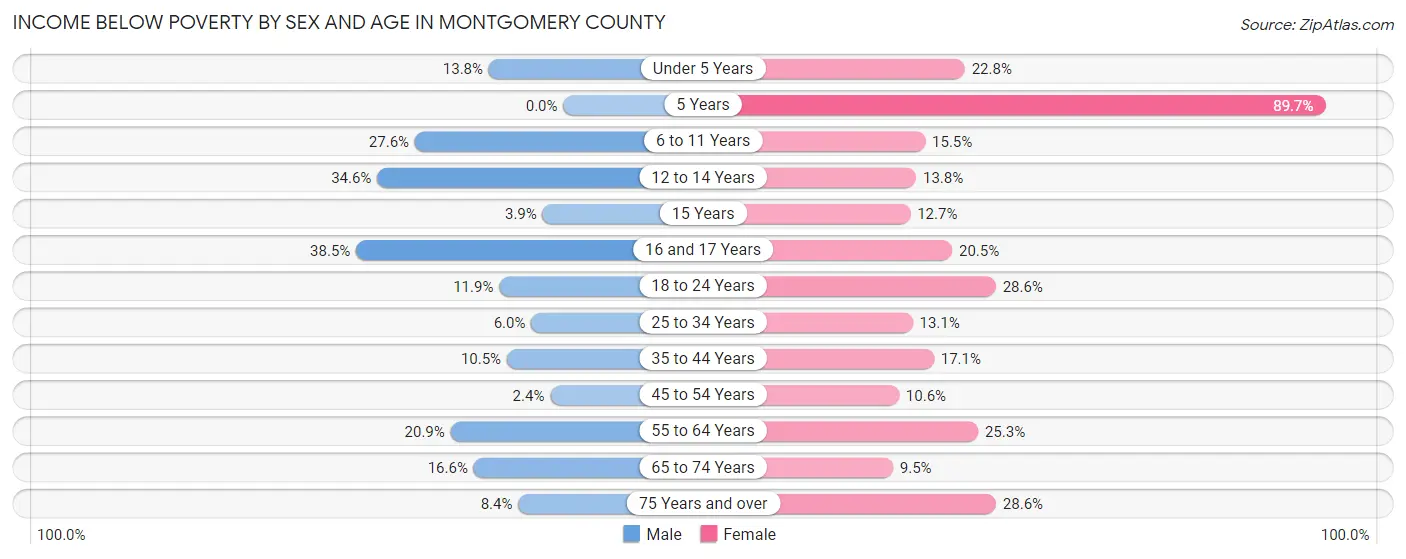
Income Below Poverty by Sex and Age in Montgomery County
With 14.1% poverty level for males and 18.9% for females among the residents of Montgomery County, 16 and 17 year old males and 5 year old females are the most vulnerable to poverty, with 15 males (38.5%) and 35 females (89.7%) in their respective age groups living below the poverty level.
| Age Bracket | Male | Female |
| Under 5 Years | 35 (13.8%) | 47 (22.8%) |
| 5 Years | 0 (0.0%) | 35 (89.7%) |
| 6 to 11 Years | 89 (27.6%) | 62 (15.5%) |
| 12 to 14 Years | 57 (34.5%) | 8 (13.8%) |
| 15 Years | 2 (3.8%) | 8 (12.7%) |
| 16 and 17 Years | 15 (38.5%) | 26 (20.5%) |
| 18 to 24 Years | 45 (11.9%) | 106 (28.6%) |
| 25 to 34 Years | 26 (5.9%) | 73 (13.1%) |
| 35 to 44 Years | 42 (10.5%) | 85 (17.1%) |
| 45 to 54 Years | 11 (2.4%) | 53 (10.6%) |
| 55 to 64 Years | 113 (20.9%) | 136 (25.3%) |
| 65 to 74 Years | 74 (16.6%) | 40 (9.5%) |
| 75 Years and over | 17 (8.4%) | 107 (28.6%) |
| Total | 526 (14.1%) | 786 (18.9%) |
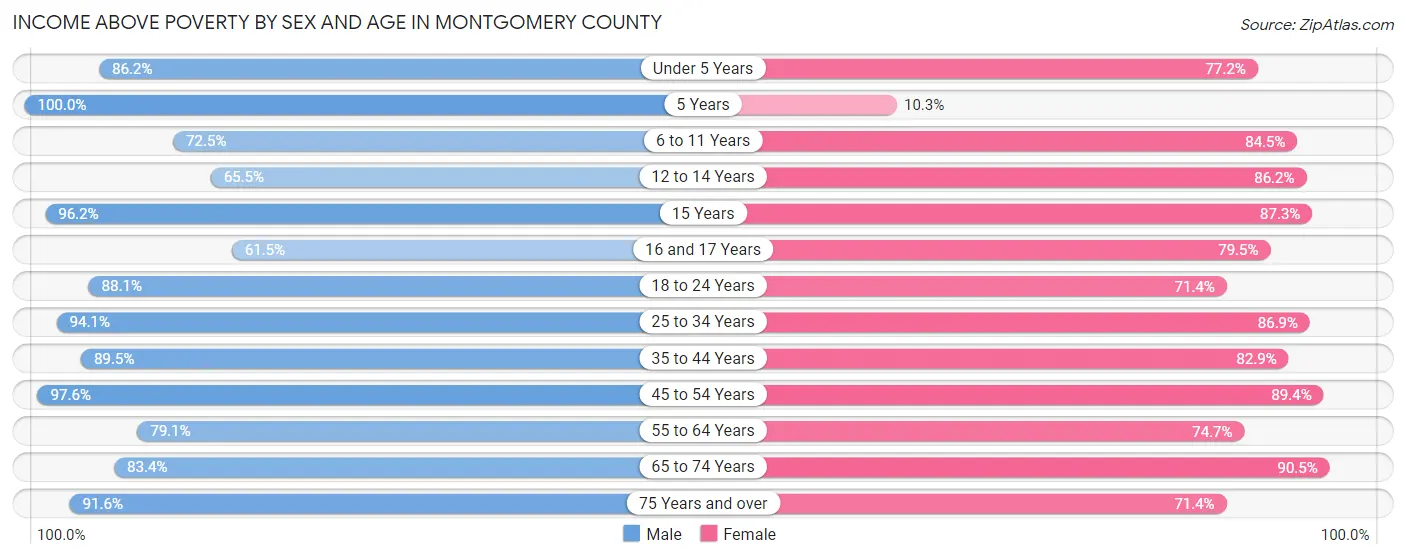
Income Above Poverty by Sex and Age in Montgomery County
According to the poverty statistics in Montgomery County, males aged 5 years and females aged 65 to 74 years are the age groups that are most secure financially, with 100.0% of males and 90.5% of females in these age groups living above the poverty line.
| Age Bracket | Male | Female |
| Under 5 Years | 218 (86.2%) | 159 (77.2%) |
| 5 Years | 45 (100.0%) | 4 (10.3%) |
| 6 to 11 Years | 234 (72.5%) | 339 (84.5%) |
| 12 to 14 Years | 108 (65.4%) | 50 (86.2%) |
| 15 Years | 50 (96.2%) | 55 (87.3%) |
| 16 and 17 Years | 24 (61.5%) | 101 (79.5%) |
| 18 to 24 Years | 333 (88.1%) | 265 (71.4%) |
| 25 to 34 Years | 411 (94.1%) | 483 (86.9%) |
| 35 to 44 Years | 359 (89.5%) | 413 (82.9%) |
| 45 to 54 Years | 442 (97.6%) | 447 (89.4%) |
| 55 to 64 Years | 427 (79.1%) | 402 (74.7%) |
| 65 to 74 Years | 371 (83.4%) | 382 (90.5%) |
| 75 Years and over | 186 (91.6%) | 267 (71.4%) |
| Total | 3,208 (85.9%) | 3,367 (81.1%) |
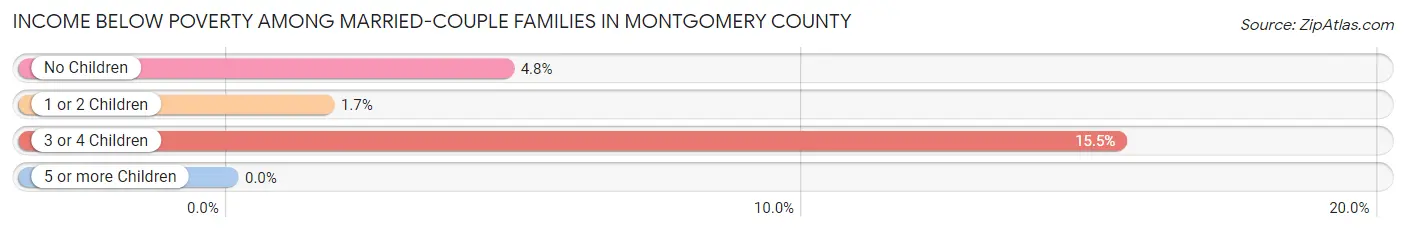
Income Below Poverty Among Married-Couple Families in Montgomery County
The poverty statistics for married-couple families in Montgomery County show that 4.5% or 68 of the total 1,509 families live below the poverty line. Families with 3 or 4 children have the highest poverty rate of 15.5%, comprising of 13 families. On the other hand, families with 5 or more children have the lowest poverty rate of 0.0%, which includes 0 families.
| Children | Above Poverty | Below Poverty |
| No Children | 952 (95.2%) | 48 (4.8%) |
| 1 or 2 Children | 412 (98.3%) | 7 (1.7%) |
| 3 or 4 Children | 71 (84.5%) | 13 (15.5%) |
| 5 or more Children | 6 (100.0%) | 0 (0.0%) |
| Total | 1,441 (95.5%) | 68 (4.5%) |
Income Below Poverty Among Single-Parent Households in Montgomery County
According to the poverty data in Montgomery County, 25.9% or 28 single-father households and 40.8% or 186 single-mother households are living below the poverty line. Among single-father households, those with 3 or 4 children have the highest poverty rate, with 4 households (100.0%) experiencing poverty. Likewise, among single-mother households, those with 5 or more children have the highest poverty rate, with 10 households (100.0%) falling below the poverty line.
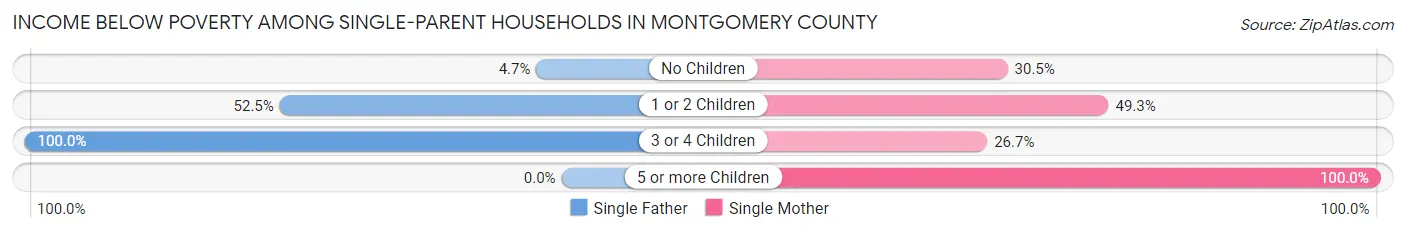
| Children | Single Father | Single Mother |
| No Children | 3 (4.7%) | 40 (30.5%) |
| 1 or 2 Children | 21 (52.5%) | 113 (49.3%) |
| 3 or 4 Children | 4 (100.0%) | 23 (26.7%) |
| 5 or more Children | 0 (0.0%) | 10 (100.0%) |
| Total | 28 (25.9%) | 186 (40.8%) |
Income Below Poverty Among Married-Couple vs Single-Parent Households in Montgomery County
The poverty data for Montgomery County shows that 68 of the married-couple family households (4.5%) and 214 of the single-parent households (37.9%) are living below the poverty level. Within the married-couple family households, those with 3 or 4 children have the highest poverty rate, with 13 households (15.5%) falling below the poverty line. Among the single-parent households, those with 5 or more children have the highest poverty rate, with 10 household (100.0%) living below poverty.
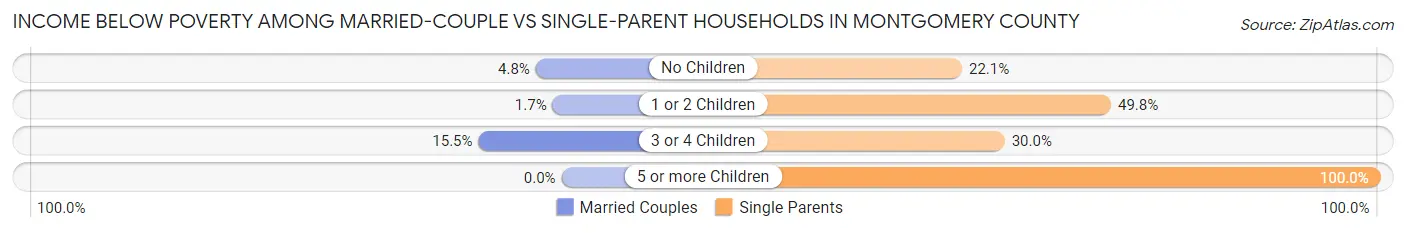
| Children | Married-Couple Families | Single-Parent Households |
| No Children | 48 (4.8%) | 43 (22.1%) |
| 1 or 2 Children | 7 (1.7%) | 134 (49.8%) |
| 3 or 4 Children | 13 (15.5%) | 27 (30.0%) |
| 5 or more Children | 0 (0.0%) | 10 (100.0%) |
| Total | 68 (4.5%) | 214 (37.9%) |
Race in Montgomery County
The most populous races in Montgomery County are White / Caucasian (5,858 | 67.4%), Black / African American (2,082 | 24.0%), and Hispanic or Latino (645 | 7.4%).
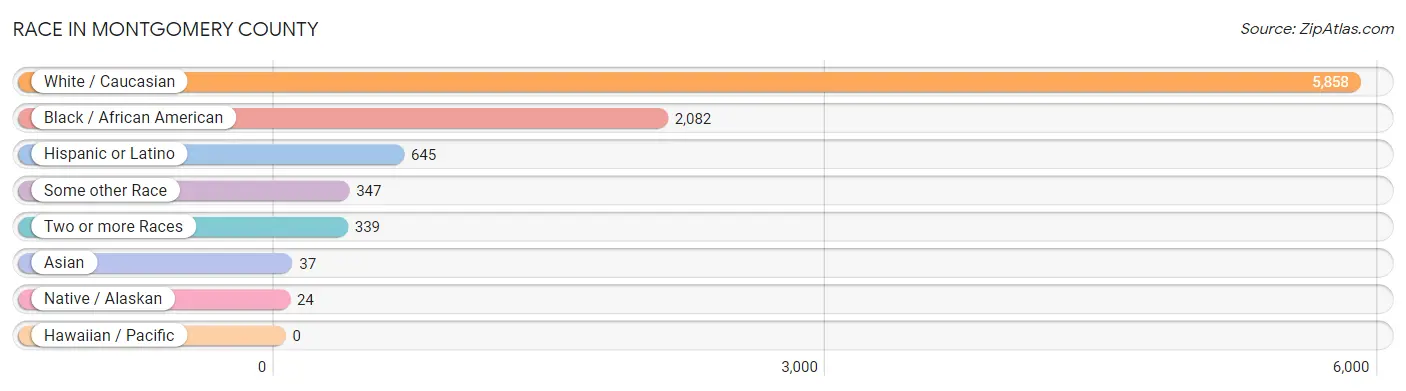
| Race | # Population | % Population |
| Asian | 37 | 0.4% |
| Black / African American | 2,082 | 24.0% |
| Hawaiian / Pacific | 0 | 0.0% |
| Hispanic or Latino | 645 | 7.4% |
| Native / Alaskan | 24 | 0.3% |
| White / Caucasian | 5,858 | 67.4% |
| Two or more Races | 339 | 3.9% |
| Some other Race | 347 | 4.0% |
| Total | 8,687 | 100.0% |
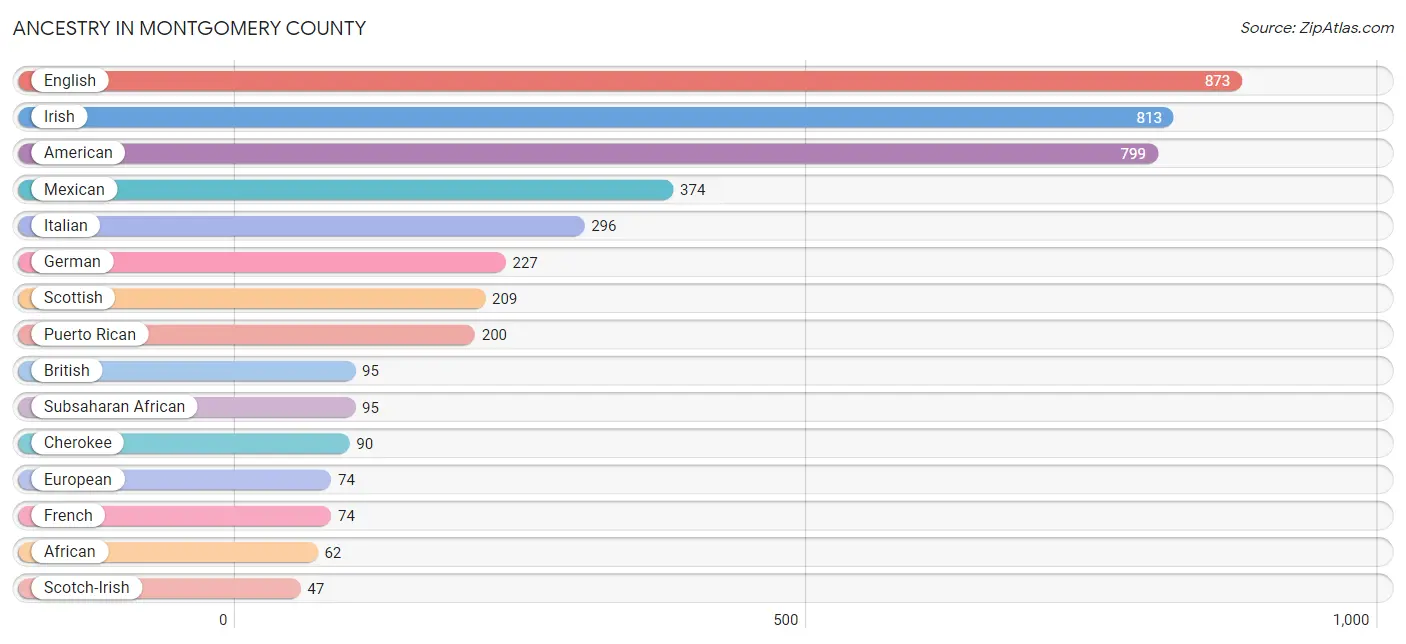
Ancestry in Montgomery County
The most populous ancestries reported in Montgomery County are English (873 | 10.1%), Irish (813 | 9.4%), American (799 | 9.2%), Mexican (374 | 4.3%), and Italian (296 | 3.4%), together accounting for 36.3% of all Montgomery County residents.
| Ancestry | # Population | % Population |
| African | 62 | 0.7% |
| American | 799 | 9.2% |
| Brazilian | 4 | 0.1% |
| British | 95 | 1.1% |
| Burmese | 16 | 0.2% |
| Celtic | 2 | 0.0% |
| Central American | 11 | 0.1% |
| Cherokee | 90 | 1.0% |
| Colombian | 5 | 0.1% |
| Czech | 2 | 0.0% |
| Dutch | 13 | 0.2% |
| Eastern European | 27 | 0.3% |
| English | 873 | 10.1% |
| European | 74 | 0.9% |
| Finnish | 18 | 0.2% |
| French | 74 | 0.9% |
| French Canadian | 30 | 0.4% |
| German | 227 | 2.6% |
| Greek | 20 | 0.2% |
| Haitian | 13 | 0.2% |
| Hungarian | 4 | 0.1% |
| Indian (Asian) | 3 | 0.0% |
| Irish | 813 | 9.4% |
| Italian | 296 | 3.4% |
| Jamaican | 33 | 0.4% |
| Mexican | 374 | 4.3% |
| Native Hawaiian | 1 | 0.0% |
| Nicaraguan | 11 | 0.1% |
| Nigerian | 2 | 0.0% |
| Norwegian | 14 | 0.2% |
| Polish | 43 | 0.5% |
| Puerto Rican | 200 | 2.3% |
| Russian | 2 | 0.0% |
| Scandinavian | 18 | 0.2% |
| Scotch-Irish | 47 | 0.5% |
| Scottish | 209 | 2.4% |
| South African | 5 | 0.1% |
| South American | 5 | 0.1% |
| Spaniard | 28 | 0.3% |
| Subsaharan African | 95 | 1.1% |
| Swedish | 9 | 0.1% |
| Swiss | 3 | 0.0% |
| Thai | 18 | 0.2% |
| Turkish | 14 | 0.2% |
| Ukrainian | 14 | 0.2% |
| Welsh | 15 | 0.2% | View All 46 Rows |
Immigrants in Montgomery County
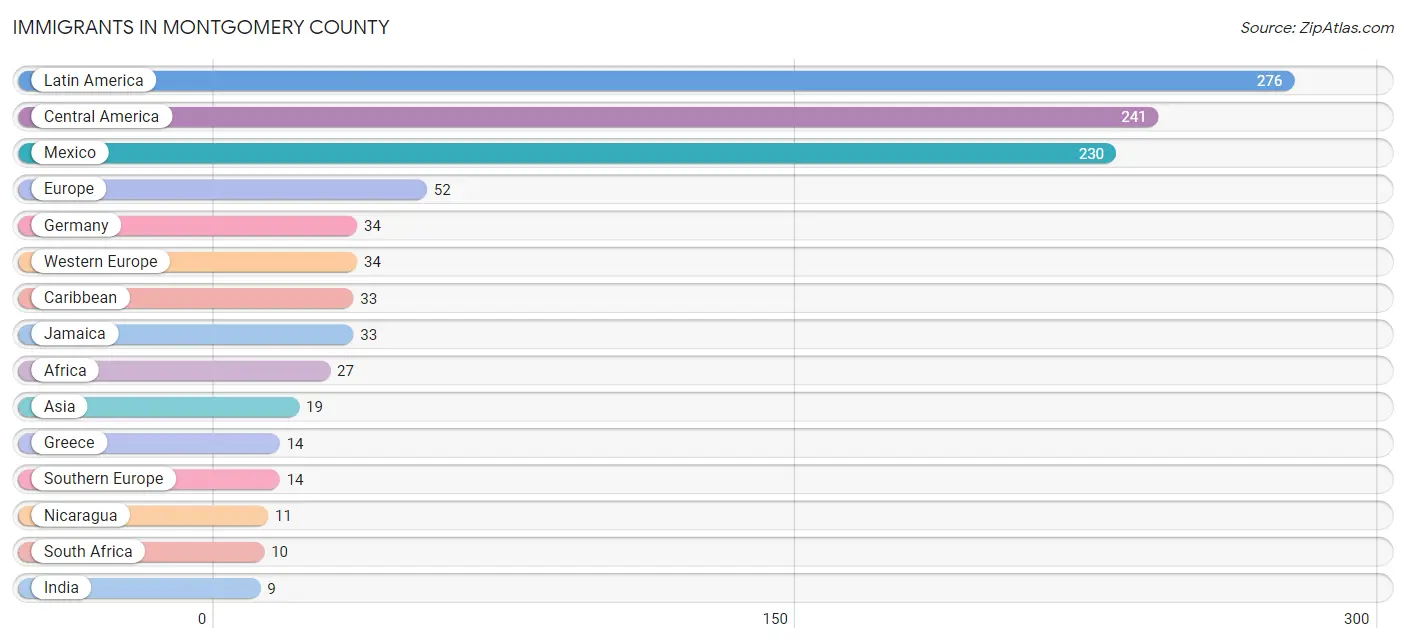
The most numerous immigrant groups reported in Montgomery County came from Latin America (276 | 3.2%), Central America (241 | 2.8%), Mexico (230 | 2.6%), Europe (52 | 0.6%), and Germany (34 | 0.4%), together accounting for 9.6% of all Montgomery County residents.
| Immigration Origin | # Population | % Population |
| Africa | 27 | 0.3% |
| Asia | 19 | 0.2% |
| Brazil | 2 | 0.0% |
| Caribbean | 33 | 0.4% |
| Central America | 241 | 2.8% |
| China | 3 | 0.0% |
| Eastern Africa | 1 | 0.0% |
| Eastern Asia | 4 | 0.1% |
| Eastern Europe | 2 | 0.0% |
| England | 2 | 0.0% |
| Europe | 52 | 0.6% |
| Germany | 34 | 0.4% |
| Greece | 14 | 0.2% |
| India | 9 | 0.1% |
| Jamaica | 33 | 0.4% |
| Korea | 1 | 0.0% |
| Latin America | 276 | 3.2% |
| Mexico | 230 | 2.6% |
| Nicaragua | 11 | 0.1% |
| Northern Europe | 2 | 0.0% |
| Philippines | 6 | 0.1% |
| South Africa | 10 | 0.1% |
| South America | 2 | 0.0% |
| South Central Asia | 9 | 0.1% |
| South Eastern Asia | 6 | 0.1% |
| Southern Europe | 14 | 0.2% |
| Western Europe | 34 | 0.4% |
| Zimbabwe | 1 | 0.0% | View All 28 Rows |
Sex and Age in Montgomery County
Sex and Age in Montgomery County
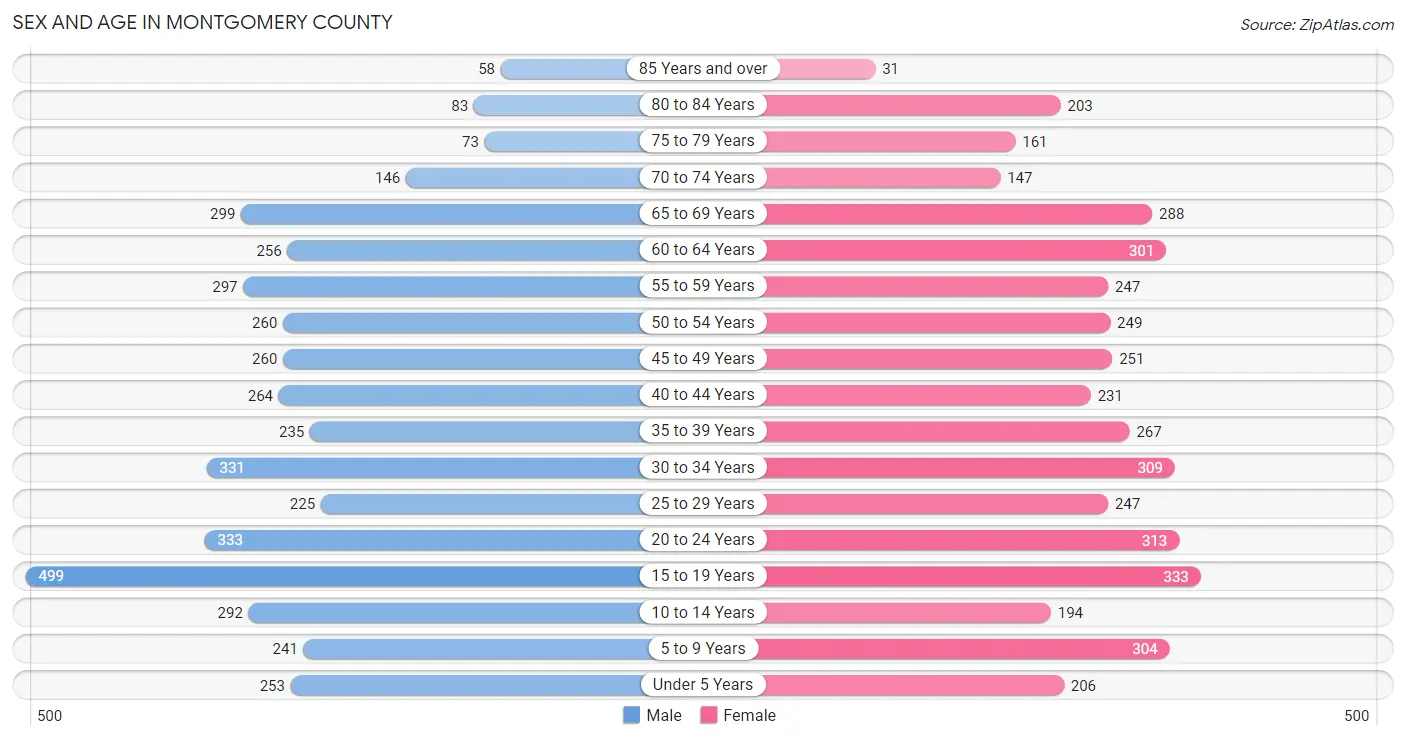
The most populous age groups in Montgomery County are 15 to 19 Years (499 | 11.3%) for men and 15 to 19 Years (333 | 7.8%) for women.
| Age Bracket | Male | Female |
| Under 5 Years | 253 (5.7%) | 206 (4.8%) |
| 5 to 9 Years | 241 (5.5%) | 304 (7.1%) |
| 10 to 14 Years | 292 (6.6%) | 194 (4.5%) |
| 15 to 19 Years | 499 (11.3%) | 333 (7.8%) |
| 20 to 24 Years | 333 (7.6%) | 313 (7.3%) |
| 25 to 29 Years | 225 (5.1%) | 247 (5.8%) |
| 30 to 34 Years | 331 (7.5%) | 309 (7.2%) |
| 35 to 39 Years | 235 (5.3%) | 267 (6.2%) |
| 40 to 44 Years | 264 (6.0%) | 231 (5.4%) |
| 45 to 49 Years | 260 (5.9%) | 251 (5.9%) |
| 50 to 54 Years | 260 (5.9%) | 249 (5.8%) |
| 55 to 59 Years | 297 (6.7%) | 247 (5.8%) |
| 60 to 64 Years | 256 (5.8%) | 301 (7.0%) |
| 65 to 69 Years | 299 (6.8%) | 288 (6.7%) |
| 70 to 74 Years | 146 (3.3%) | 147 (3.4%) |
| 75 to 79 Years | 73 (1.7%) | 161 (3.8%) |
| 80 to 84 Years | 83 (1.9%) | 203 (4.7%) |
| 85 Years and over | 58 (1.3%) | 31 (0.7%) |
| Total | 4,405 (100.0%) | 4,282 (100.0%) |
Families and Households in Montgomery County
Median Family Size in Montgomery County
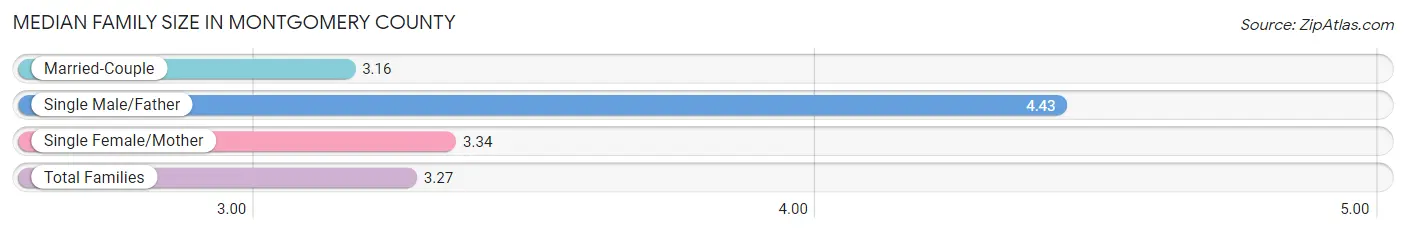
The median family size in Montgomery County is 3.27 persons per family, with single male/father families (108 | 5.2%) accounting for the largest median family size of 4.43 persons per family. On the other hand, married-couple families (1,509 | 72.8%) represent the smallest median family size with 3.16 persons per family.
| Family Type | # Families | Family Size |
| Married-Couple | 1,509 (72.8%) | 3.16 |
| Single Male/Father | 108 (5.2%) | 4.43 |
| Single Female/Mother | 456 (22.0%) | 3.34 |
| Total Families | 2,073 (100.0%) | 3.27 |
Median Household Size in Montgomery County
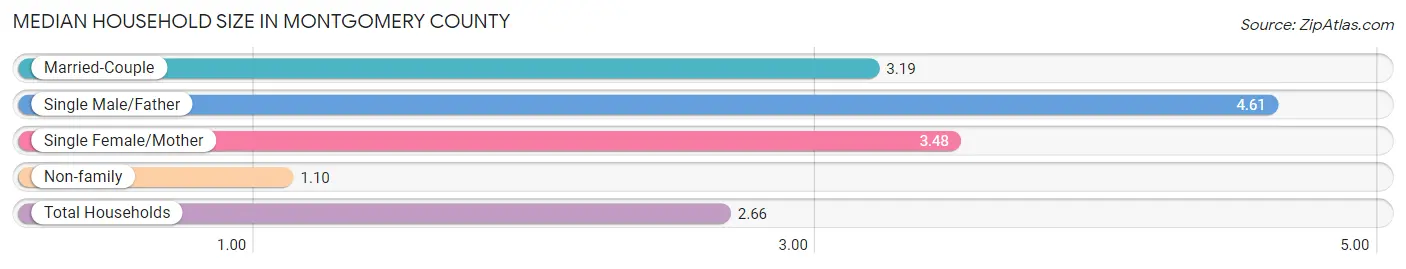
The median household size in Montgomery County is 2.66 persons per household, with single male/father households (108 | 3.6%) accounting for the largest median household size of 4.61 persons per household. non-family households (893 | 30.1%) represent the smallest median household size with 1.10 persons per household.
| Household Type | # Households | Household Size |
| Married-Couple | 1,509 (50.9%) | 3.19 |
| Single Male/Father | 108 (3.6%) | 4.61 |
| Single Female/Mother | 456 (15.4%) | 3.48 |
| Non-family | 893 (30.1%) | 1.10 |
| Total Households | 2,966 (100.0%) | 2.66 |
Household Size by Marriage Status in Montgomery County
Out of a total of 2,966 households in Montgomery County, 2,073 (69.9%) are family households, while 893 (30.1%) are nonfamily households. The most numerous type of family households are 2-person households, comprising 975, and the most common type of nonfamily households are 1-person households, comprising 818.
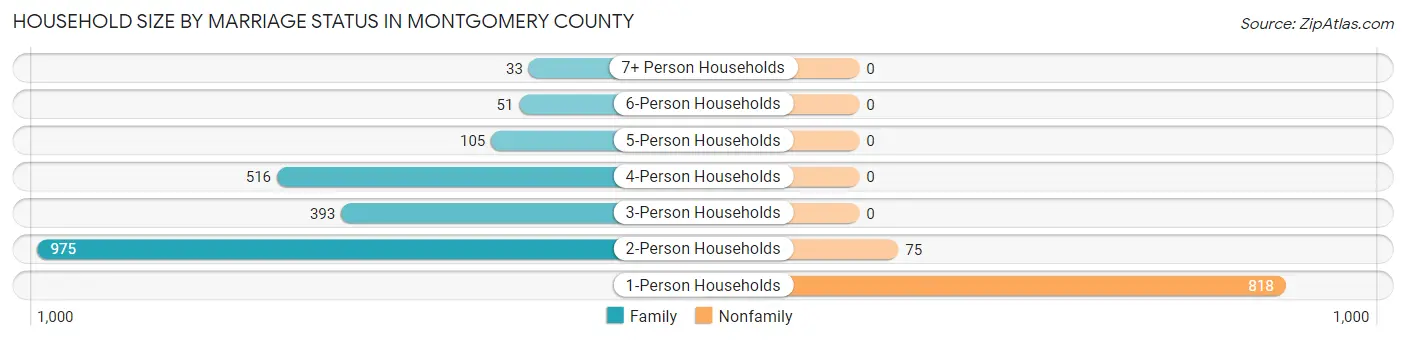
| Household Size | Family Households | Nonfamily Households |
| 1-Person Households | - | 818 (27.6%) |
| 2-Person Households | 975 (32.9%) | 75 (2.5%) |
| 3-Person Households | 393 (13.3%) | 0 (0.0%) |
| 4-Person Households | 516 (17.4%) | 0 (0.0%) |
| 5-Person Households | 105 (3.5%) | 0 (0.0%) |
| 6-Person Households | 51 (1.7%) | 0 (0.0%) |
| 7+ Person Households | 33 (1.1%) | 0 (0.0%) |
| Total | 2,073 (69.9%) | 893 (30.1%) |
Female Fertility in Montgomery County
Fertility by Age in Montgomery County
Average fertility rate in Montgomery County is 44.0 births per 1,000 women. Women in the age bracket of 20 to 34 years have the highest fertility rate with 78.0 births per 1,000 women. Women in the age bracket of 20 to 34 years acount for 75.6% of all women with births.
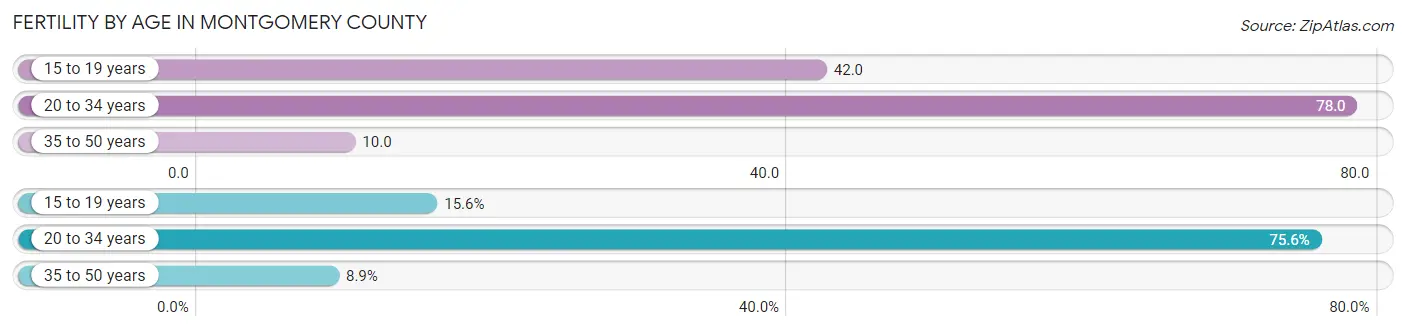
| Age Bracket | Women with Births | Births / 1,000 Women |
| 15 to 19 years | 14 (15.6%) | 42.0 |
| 20 to 34 years | 68 (75.6%) | 78.0 |
| 35 to 50 years | 8 (8.9%) | 10.0 |
| Total | 90 (100.0%) | 44.0 |
Fertility by Age by Marriage Status in Montgomery County
75.6% of women with births (90) in Montgomery County are married. The highest percentage of unmarried women with births falls into 15 to 19 years age bracket with 100.0% of them unmarried at the time of birth, while the lowest percentage of unmarried women with births belong to 35 to 50 years age bracket with 0.0% of them unmarried.
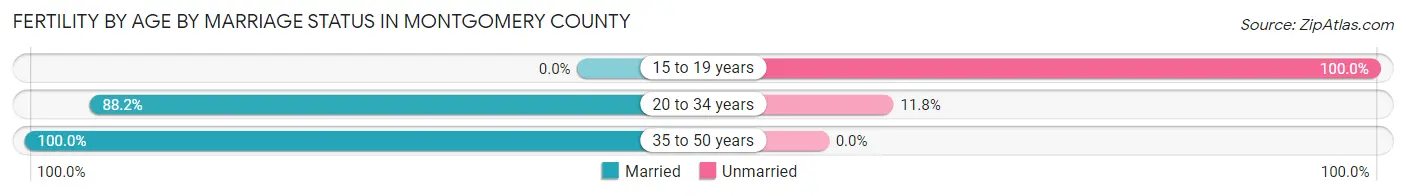
| Age Bracket | Married | Unmarried |
| 15 to 19 years | 0 (0.0%) | 14 (100.0%) |
| 20 to 34 years | 60 (88.2%) | 8 (11.8%) |
| 35 to 50 years | 8 (100.0%) | 0 (0.0%) |
| Total | 68 (75.6%) | 22 (24.4%) |
Fertility by Education in Montgomery County
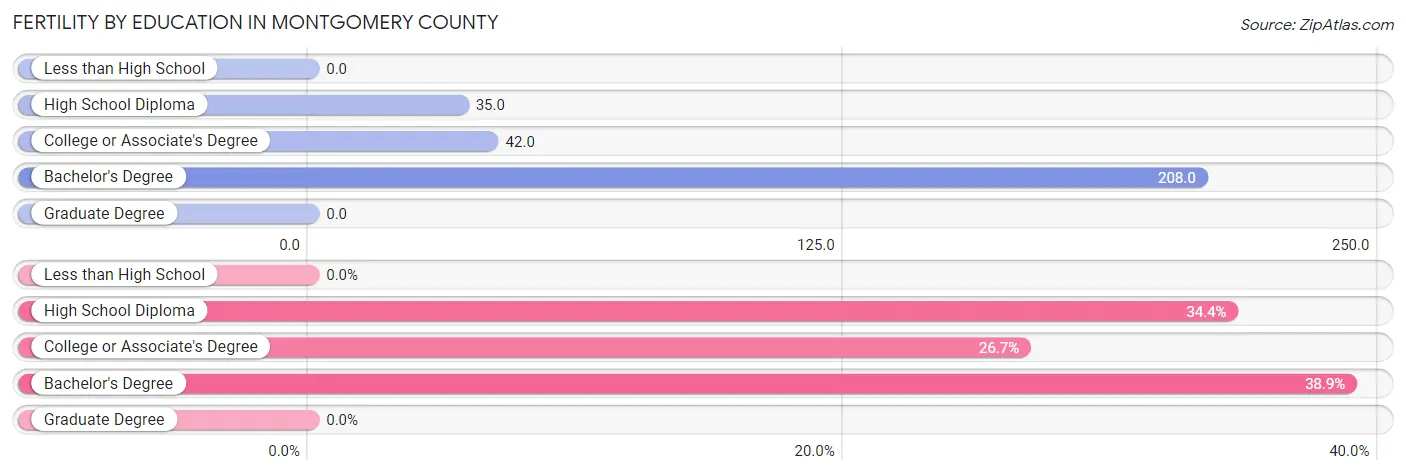
| Educational Attainment | Women with Births | Births / 1,000 Women |
| Less than High School | 0 (0.0%) | 0.0 |
| High School Diploma | 31 (34.4%) | 35.0 |
| College or Associate's Degree | 24 (26.7%) | 42.0 |
| Bachelor's Degree | 35 (38.9%) | 208.0 |
| Graduate Degree | 0 (0.0%) | 0.0 |
| Total | 90 (100.0%) | 44.0 |
Fertility by Education by Marriage Status in Montgomery County
24.4% of women with births in Montgomery County are unmarried. Women with the educational attainment of bachelor's degree are most likely to be married with 100.0% of them married at childbirth, while women with the educational attainment of high school diploma are least likely to be married with 45.2% of them unmarried at childbirth.
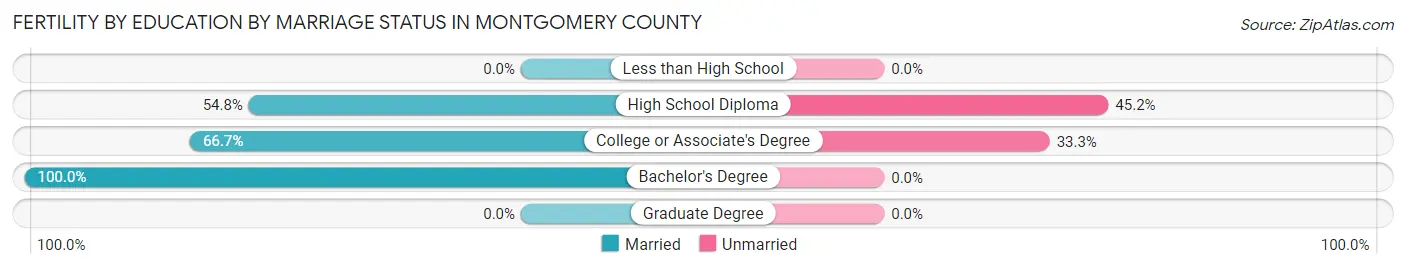
| Educational Attainment | Married | Unmarried |
| Less than High School | 0 (0.0%) | 0 (0.0%) |
| High School Diploma | 17 (54.8%) | 14 (45.2%) |
| College or Associate's Degree | 16 (66.7%) | 8 (33.3%) |
| Bachelor's Degree | 35 (100.0%) | 0 (0.0%) |
| Graduate Degree | 0 (0.0%) | 0 (0.0%) |
| Total | 68 (75.6%) | 22 (24.4%) |
Employment Characteristics in Montgomery County
Employment by Class of Employer in Montgomery County
Among the 3,395 employed individuals in Montgomery County, private company employees (2,118 | 62.4%), local government employees (363 | 10.7%), and self-employed (not incorporated) (284 | 8.4%) make up the most common classes of employment.
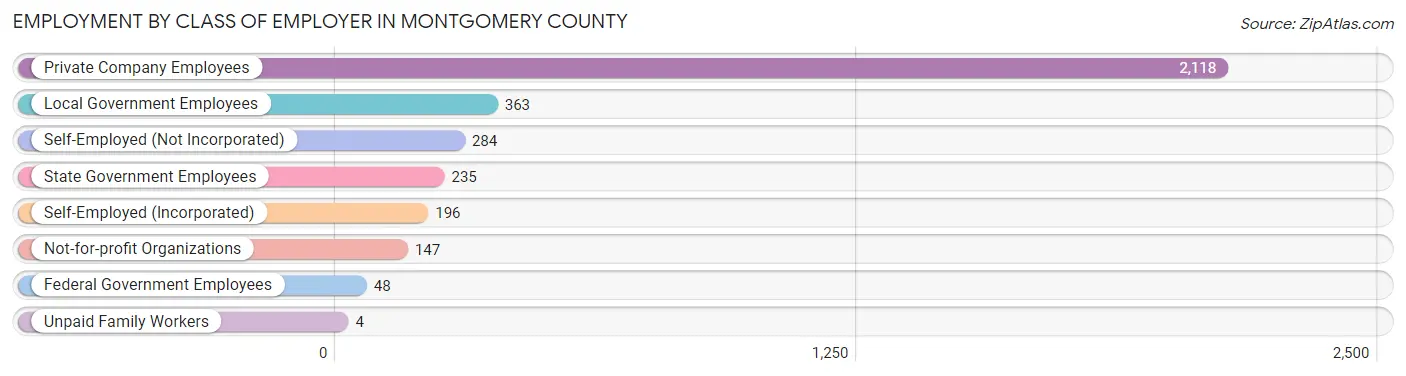
| Employer Class | # Employees | % Employees |
| Private Company Employees | 2,118 | 62.4% |
| Self-Employed (Incorporated) | 196 | 5.8% |
| Self-Employed (Not Incorporated) | 284 | 8.4% |
| Not-for-profit Organizations | 147 | 4.3% |
| Local Government Employees | 363 | 10.7% |
| State Government Employees | 235 | 6.9% |
| Federal Government Employees | 48 | 1.4% |
| Unpaid Family Workers | 4 | 0.1% |
| Total | 3,395 | 100.0% |
Employment Status by Age in Montgomery County
According to the labor force statistics for Montgomery County, out of the total population over 16 years of age (7,082), 52.0% or 3,683 individuals are in the labor force, with 6.5% or 239 of them unemployed. The age group with the highest labor force participation rate is 45 to 54 years, with 75.8% or 773 individuals in the labor force. Within the labor force, the 16 to 19 years age range has the highest percentage of unemployed individuals, with 39.5% or 92 of them being unemployed.
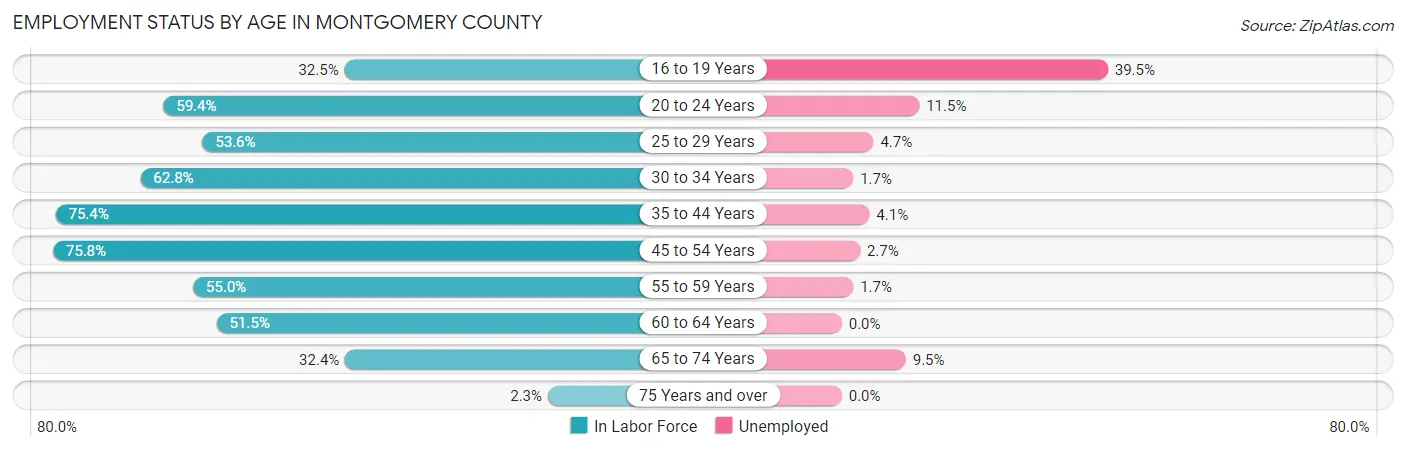
| Age Bracket | In Labor Force | Unemployed |
| 16 to 19 Years | 233 (32.5%) | 92 (39.5%) |
| 20 to 24 Years | 384 (59.4%) | 44 (11.5%) |
| 25 to 29 Years | 253 (53.6%) | 12 (4.7%) |
| 30 to 34 Years | 402 (62.8%) | 7 (1.7%) |
| 35 to 44 Years | 752 (75.4%) | 31 (4.1%) |
| 45 to 54 Years | 773 (75.8%) | 21 (2.7%) |
| 55 to 59 Years | 299 (55.0%) | 5 (1.7%) |
| 60 to 64 Years | 287 (51.5%) | 0 (0.0%) |
| 65 to 74 Years | 285 (32.4%) | 27 (9.5%) |
| 75 Years and over | 14 (2.3%) | 0 (0.0%) |
| Total | 3,683 (52.0%) | 239 (6.5%) |
Employment Status by Educational Attainment in Montgomery County
According to labor force statistics for Montgomery County, 65.4% of individuals (2,766) out of the total population between 25 and 64 years of age (4,230) are in the labor force, with 2.8% or 77 of them being unemployed. The group with the highest labor force participation rate are those with the educational attainment of bachelor's degree or higher, with 85.4% or 742 individuals in the labor force. Within the labor force, individuals with high school diploma education have the highest percentage of unemployment, with 5.0% or 42 of them being unemployed.
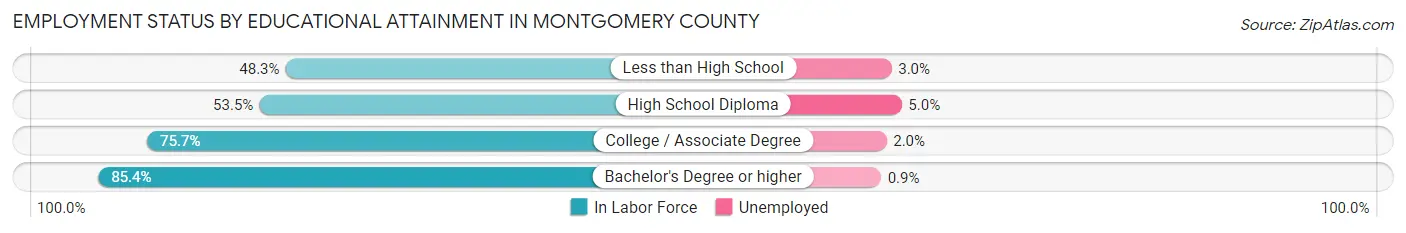
| Educational Attainment | In Labor Force | Unemployed |
| Less than High School | 296 (48.3%) | 18 (3.0%) |
| High School Diploma | 848 (53.5%) | 79 (5.0%) |
| College / Associate Degree | 880 (75.7%) | 23 (2.0%) |
| Bachelor's Degree or higher | 742 (85.4%) | 8 (0.9%) |
| Total | 2,766 (65.4%) | 118 (2.8%) |
Employment Occupations by Sex in Montgomery County
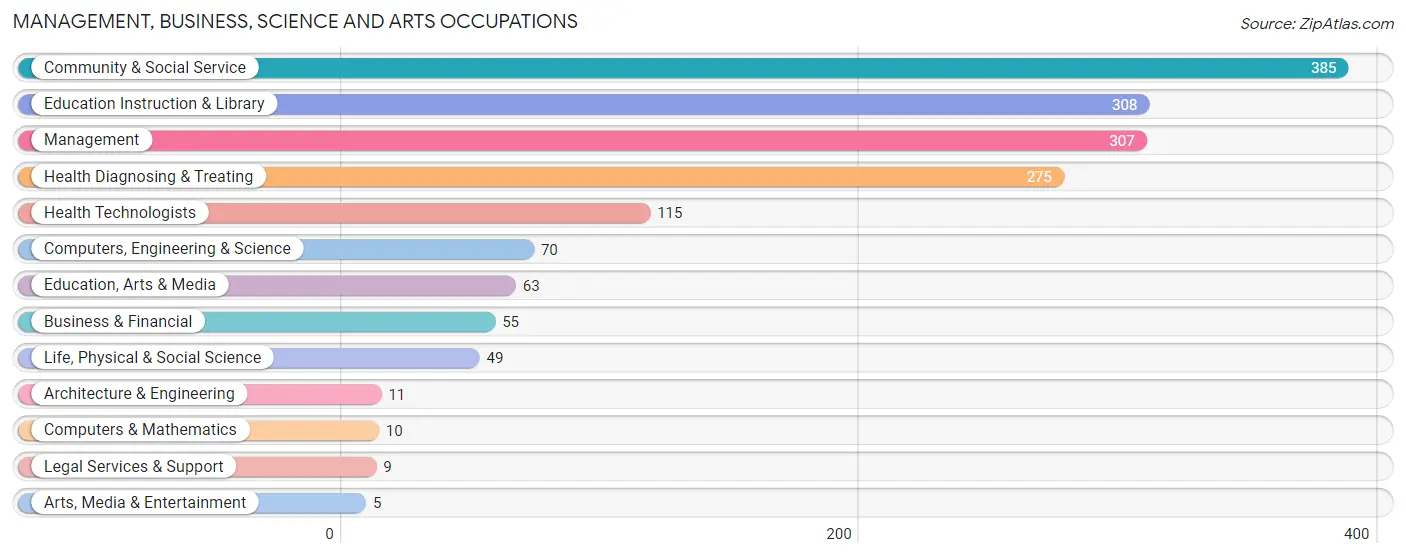
Management, Business, Science and Arts Occupations
The most common Management, Business, Science and Arts occupations in Montgomery County are Community & Social Service (385 | 11.2%), Education Instruction & Library (308 | 9.0%), Management (307 | 8.9%), Health Diagnosing & Treating (275 | 8.0%), and Health Technologists (115 | 3.3%).
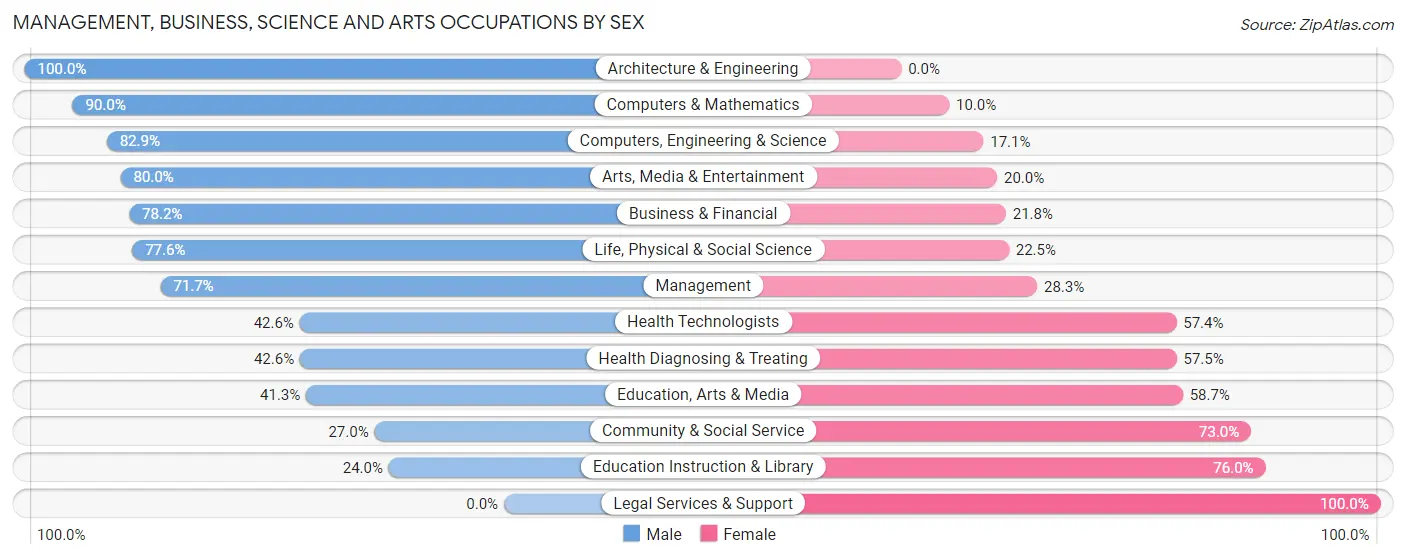
Management, Business, Science and Arts Occupations by Sex
Within the Management, Business, Science and Arts occupations in Montgomery County, the most male-oriented occupations are Architecture & Engineering (100.0%), Computers & Mathematics (90.0%), and Computers, Engineering & Science (82.9%), while the most female-oriented occupations are Legal Services & Support (100.0%), Education Instruction & Library (76.0%), and Community & Social Service (73.0%).
| Occupation | Male | Female |
| Management | 220 (71.7%) | 87 (28.3%) |
| Business & Financial | 43 (78.2%) | 12 (21.8%) |
| Computers, Engineering & Science | 58 (82.9%) | 12 (17.1%) |
| Computers & Mathematics | 9 (90.0%) | 1 (10.0%) |
| Architecture & Engineering | 11 (100.0%) | 0 (0.0%) |
| Life, Physical & Social Science | 38 (77.5%) | 11 (22.5%) |
| Community & Social Service | 104 (27.0%) | 281 (73.0%) |
| Education, Arts & Media | 26 (41.3%) | 37 (58.7%) |
| Legal Services & Support | 0 (0.0%) | 9 (100.0%) |
| Education Instruction & Library | 74 (24.0%) | 234 (76.0%) |
| Arts, Media & Entertainment | 4 (80.0%) | 1 (20.0%) |
| Health Diagnosing & Treating | 117 (42.5%) | 158 (57.5%) |
| Health Technologists | 49 (42.6%) | 66 (57.4%) |
| Total (Category) | 542 (49.6%) | 550 (50.4%) |
| Total (Overall) | 1,829 (53.2%) | 1,609 (46.8%) |
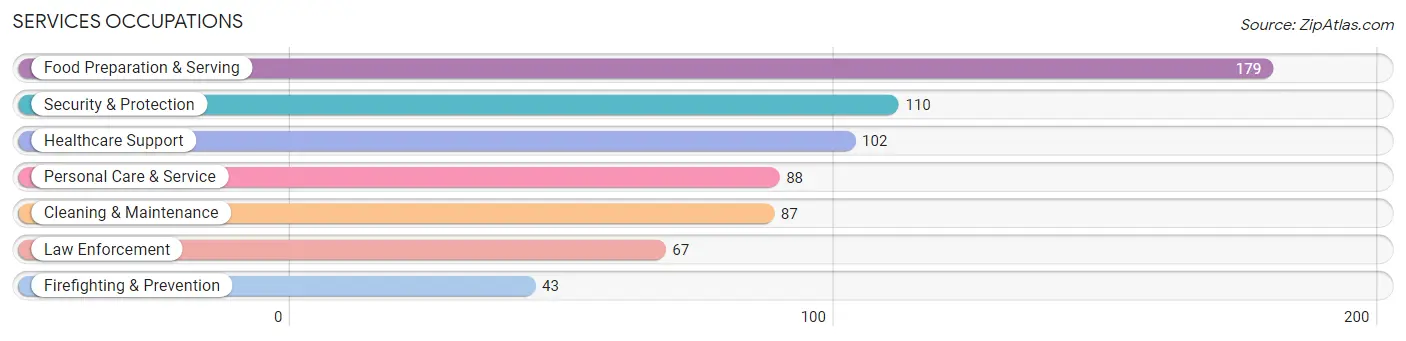
Services Occupations
The most common Services occupations in Montgomery County are Food Preparation & Serving (179 | 5.2%), Security & Protection (110 | 3.2%), Healthcare Support (102 | 3.0%), Personal Care & Service (88 | 2.6%), and Cleaning & Maintenance (87 | 2.5%).
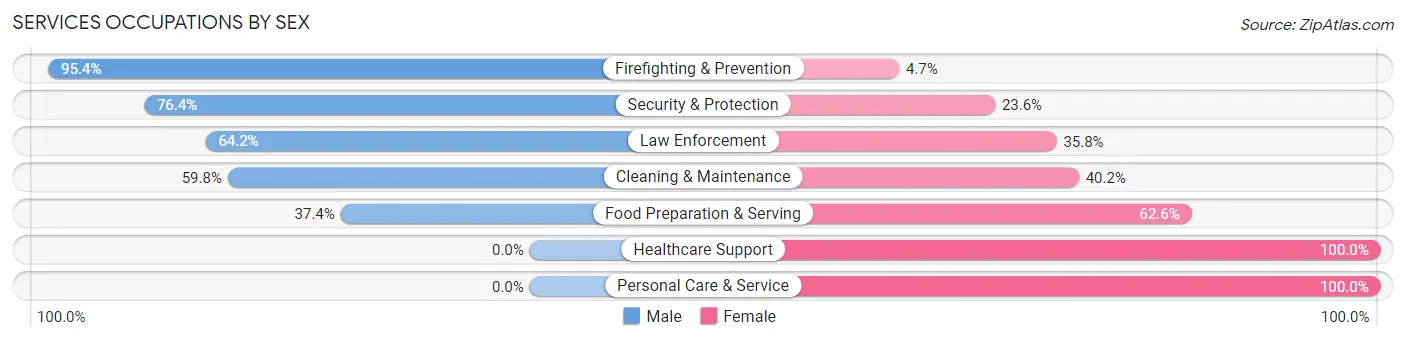
Services Occupations by Sex
Within the Services occupations in Montgomery County, the most male-oriented occupations are Firefighting & Prevention (95.4%), Security & Protection (76.4%), and Law Enforcement (64.2%), while the most female-oriented occupations are Healthcare Support (100.0%), Personal Care & Service (100.0%), and Food Preparation & Serving (62.6%).
| Occupation | Male | Female |
| Healthcare Support | 0 (0.0%) | 102 (100.0%) |
| Security & Protection | 84 (76.4%) | 26 (23.6%) |
| Firefighting & Prevention | 41 (95.4%) | 2 (4.6%) |
| Law Enforcement | 43 (64.2%) | 24 (35.8%) |
| Food Preparation & Serving | 67 (37.4%) | 112 (62.6%) |
| Cleaning & Maintenance | 52 (59.8%) | 35 (40.2%) |
| Personal Care & Service | 0 (0.0%) | 88 (100.0%) |
| Total (Category) | 203 (35.9%) | 363 (64.1%) |
| Total (Overall) | 1,829 (53.2%) | 1,609 (46.8%) |
Sales and Office Occupations
The most common Sales and Office occupations in Montgomery County are Office & Administration (309 | 9.0%), and Sales & Related (277 | 8.1%).
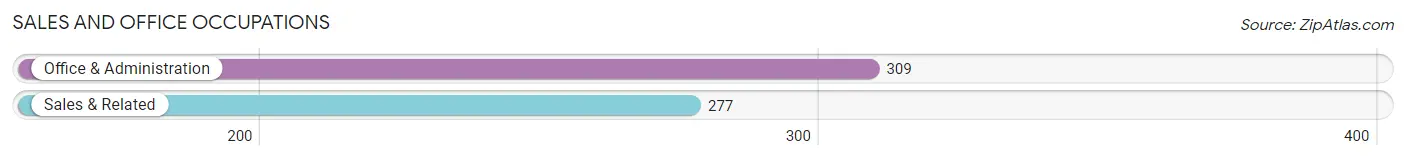
Sales and Office Occupations by Sex
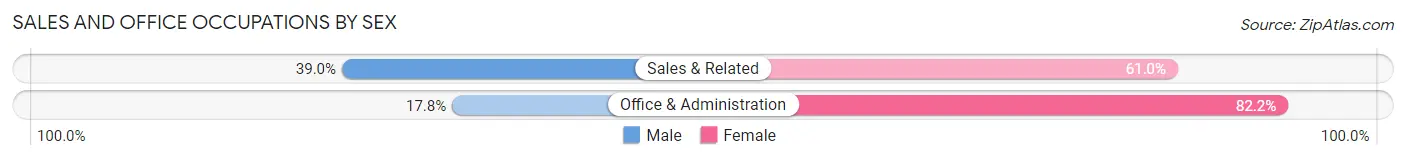
| Occupation | Male | Female |
| Sales & Related | 108 (39.0%) | 169 (61.0%) |
| Office & Administration | 55 (17.8%) | 254 (82.2%) |
| Total (Category) | 163 (27.8%) | 423 (72.2%) |
| Total (Overall) | 1,829 (53.2%) | 1,609 (46.8%) |
Natural Resources, Construction and Maintenance Occupations
The most common Natural Resources, Construction and Maintenance occupations in Montgomery County are Construction & Extraction (350 | 10.2%), Installation, Maintenance & Repair (141 | 4.1%), and Farming, Fishing & Forestry (45 | 1.3%).
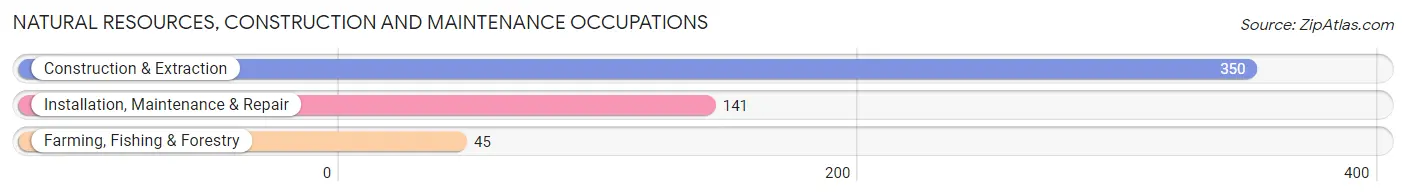
Natural Resources, Construction and Maintenance Occupations by Sex
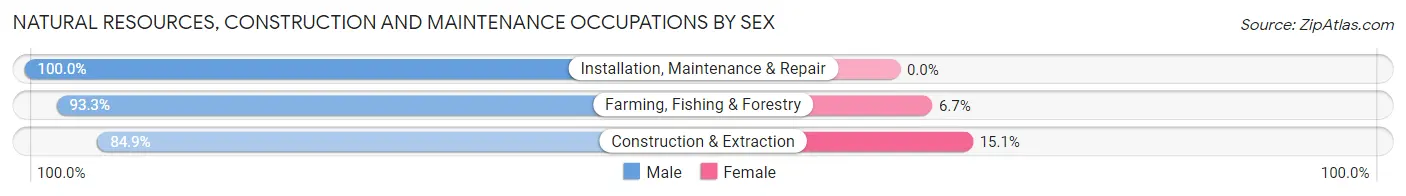
| Occupation | Male | Female |
| Farming, Fishing & Forestry | 42 (93.3%) | 3 (6.7%) |
| Construction & Extraction | 297 (84.9%) | 53 (15.1%) |
| Installation, Maintenance & Repair | 141 (100.0%) | 0 (0.0%) |
| Total (Category) | 480 (89.5%) | 56 (10.4%) |
| Total (Overall) | 1,829 (53.2%) | 1,609 (46.8%) |
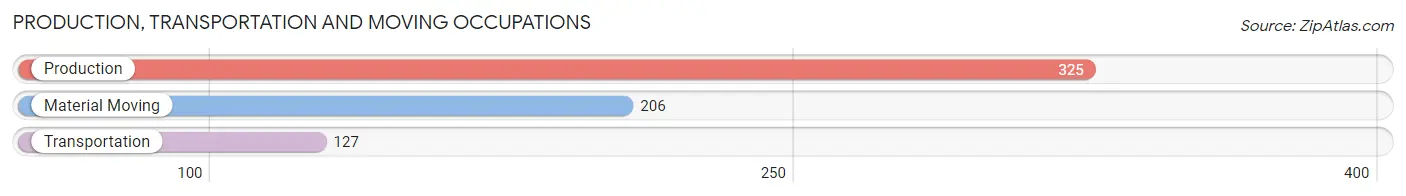
Production, Transportation and Moving Occupations
The most common Production, Transportation and Moving occupations in Montgomery County are Production (325 | 9.5%), Material Moving (206 | 6.0%), and Transportation (127 | 3.7%).
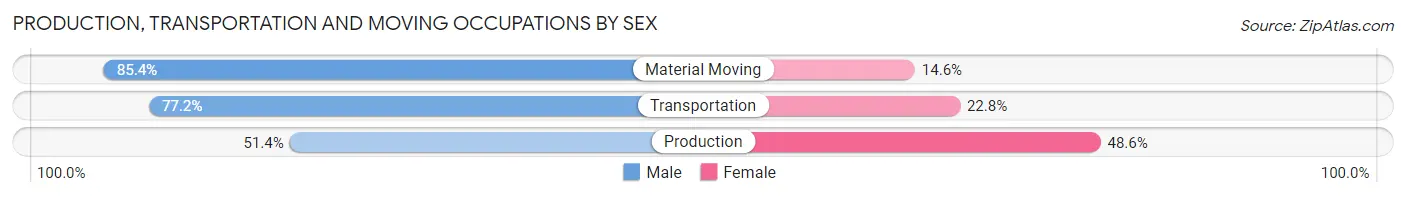
Production, Transportation and Moving Occupations by Sex
| Occupation | Male | Female |
| Production | 167 (51.4%) | 158 (48.6%) |
| Transportation | 98 (77.2%) | 29 (22.8%) |
| Material Moving | 176 (85.4%) | 30 (14.6%) |
| Total (Category) | 441 (67.0%) | 217 (33.0%) |
| Total (Overall) | 1,829 (53.2%) | 1,609 (46.8%) |
Employment Industries by Sex in Montgomery County
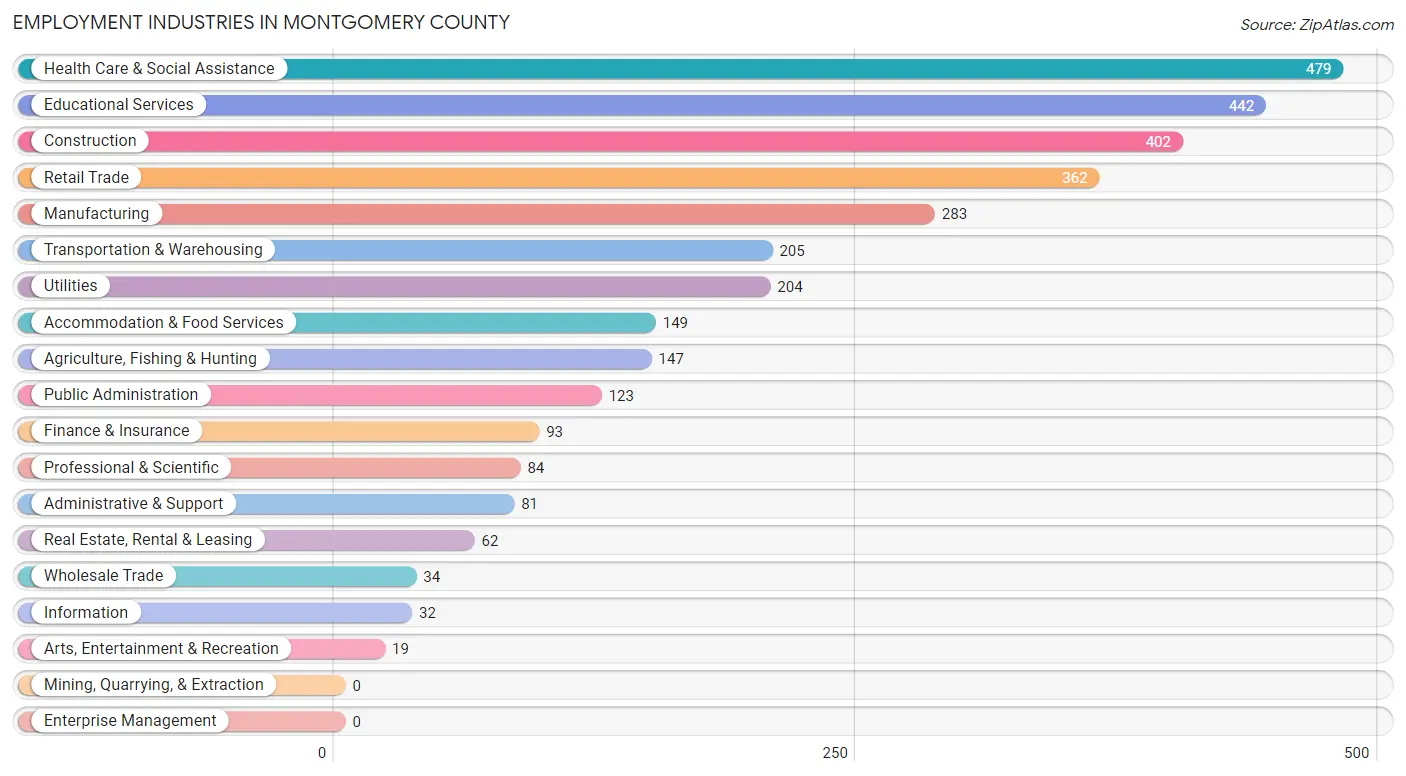
Employment Industries in Montgomery County
The major employment industries in Montgomery County include Health Care & Social Assistance (479 | 13.9%), Educational Services (442 | 12.9%), Construction (402 | 11.7%), Retail Trade (362 | 10.5%), and Manufacturing (283 | 8.2%).
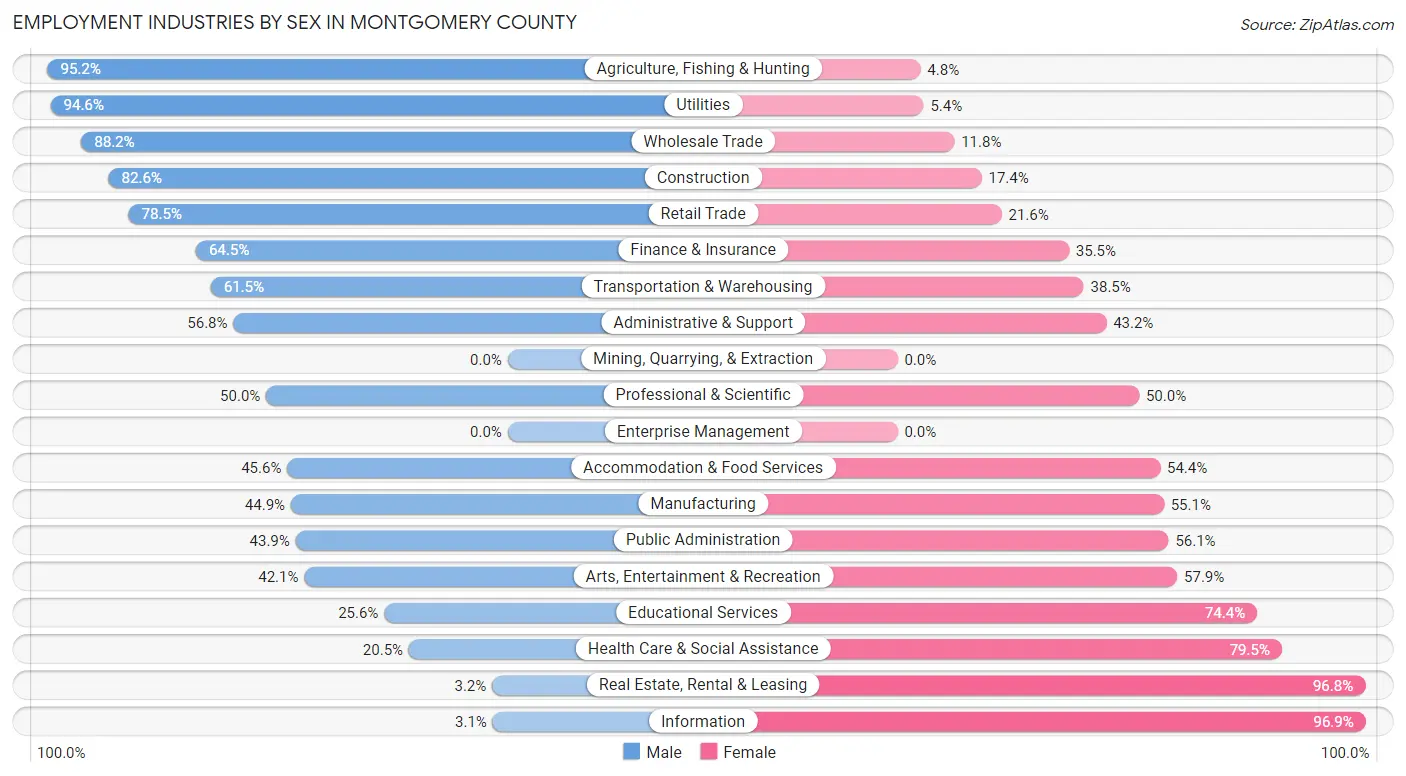
Employment Industries by Sex in Montgomery County
The Montgomery County industries that see more men than women are Agriculture, Fishing & Hunting (95.2%), Utilities (94.6%), and Wholesale Trade (88.2%), whereas the industries that tend to have a higher number of women are Information (96.9%), Real Estate, Rental & Leasing (96.8%), and Health Care & Social Assistance (79.5%).
| Industry | Male | Female |
| Agriculture, Fishing & Hunting | 140 (95.2%) | 7 (4.8%) |
| Mining, Quarrying, & Extraction | 0 (0.0%) | 0 (0.0%) |
| Construction | 332 (82.6%) | 70 (17.4%) |
| Manufacturing | 127 (44.9%) | 156 (55.1%) |
| Wholesale Trade | 30 (88.2%) | 4 (11.8%) |
| Retail Trade | 284 (78.4%) | 78 (21.5%) |
| Transportation & Warehousing | 126 (61.5%) | 79 (38.5%) |
| Utilities | 193 (94.6%) | 11 (5.4%) |
| Information | 1 (3.1%) | 31 (96.9%) |
| Finance & Insurance | 60 (64.5%) | 33 (35.5%) |
| Real Estate, Rental & Leasing | 2 (3.2%) | 60 (96.8%) |
| Professional & Scientific | 42 (50.0%) | 42 (50.0%) |
| Enterprise Management | 0 (0.0%) | 0 (0.0%) |
| Administrative & Support | 46 (56.8%) | 35 (43.2%) |
| Educational Services | 113 (25.6%) | 329 (74.4%) |
| Health Care & Social Assistance | 98 (20.5%) | 381 (79.5%) |
| Arts, Entertainment & Recreation | 8 (42.1%) | 11 (57.9%) |
| Accommodation & Food Services | 68 (45.6%) | 81 (54.4%) |
| Public Administration | 54 (43.9%) | 69 (56.1%) |
| Total | 1,829 (53.2%) | 1,609 (46.8%) |
Education in Montgomery County
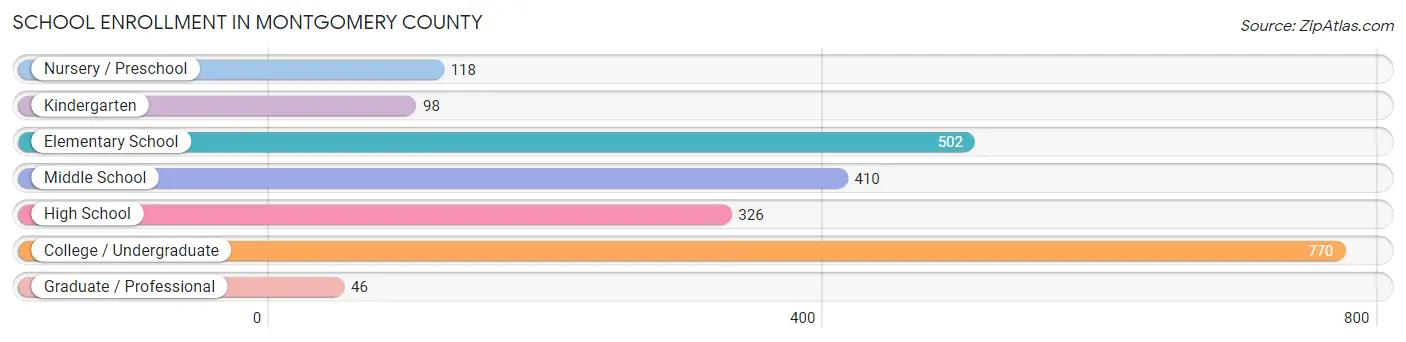
School Enrollment in Montgomery County
The most common levels of schooling among the 2,270 students in Montgomery County are college / undergraduate (770 | 33.9%), elementary school (502 | 22.1%), and middle school (410 | 18.1%).
| School Level | # Students | % Students |
| Nursery / Preschool | 118 | 5.2% |
| Kindergarten | 98 | 4.3% |
| Elementary School | 502 | 22.1% |
| Middle School | 410 | 18.1% |
| High School | 326 | 14.4% |
| College / Undergraduate | 770 | 33.9% |
| Graduate / Professional | 46 | 2.0% |
| Total | 2,270 | 100.0% |
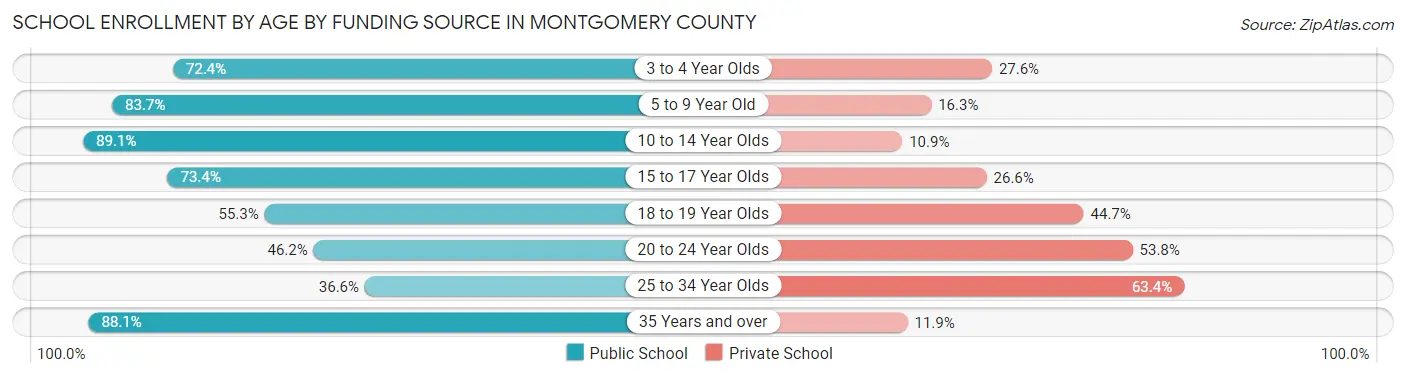
School Enrollment by Age by Funding Source in Montgomery County
Out of a total of 2,270 students who are enrolled in schools in Montgomery County, 649 (28.6%) attend a private institution, while the remaining 1,621 (71.4%) are enrolled in public schools. The age group of 25 to 34 year olds has the highest likelihood of being enrolled in private schools, with 45 (63.4% in the age bracket) enrolled. Conversely, the age group of 10 to 14 year olds has the lowest likelihood of being enrolled in a private school, with 433 (89.1% in the age bracket) attending a public institution.
| Age Bracket | Public School | Private School |
| 3 to 4 Year Olds | 76 (72.4%) | 29 (27.6%) |
| 5 to 9 Year Old | 436 (83.7%) | 85 (16.3%) |
| 10 to 14 Year Olds | 433 (89.1%) | 53 (10.9%) |
| 15 to 17 Year Olds | 193 (73.4%) | 70 (26.6%) |
| 18 to 19 Year Olds | 250 (55.3%) | 202 (44.7%) |
| 20 to 24 Year Olds | 133 (46.2%) | 155 (53.8%) |
| 25 to 34 Year Olds | 26 (36.6%) | 45 (63.4%) |
| 35 Years and over | 74 (88.1%) | 10 (11.9%) |
| Total | 1,621 (71.4%) | 649 (28.6%) |
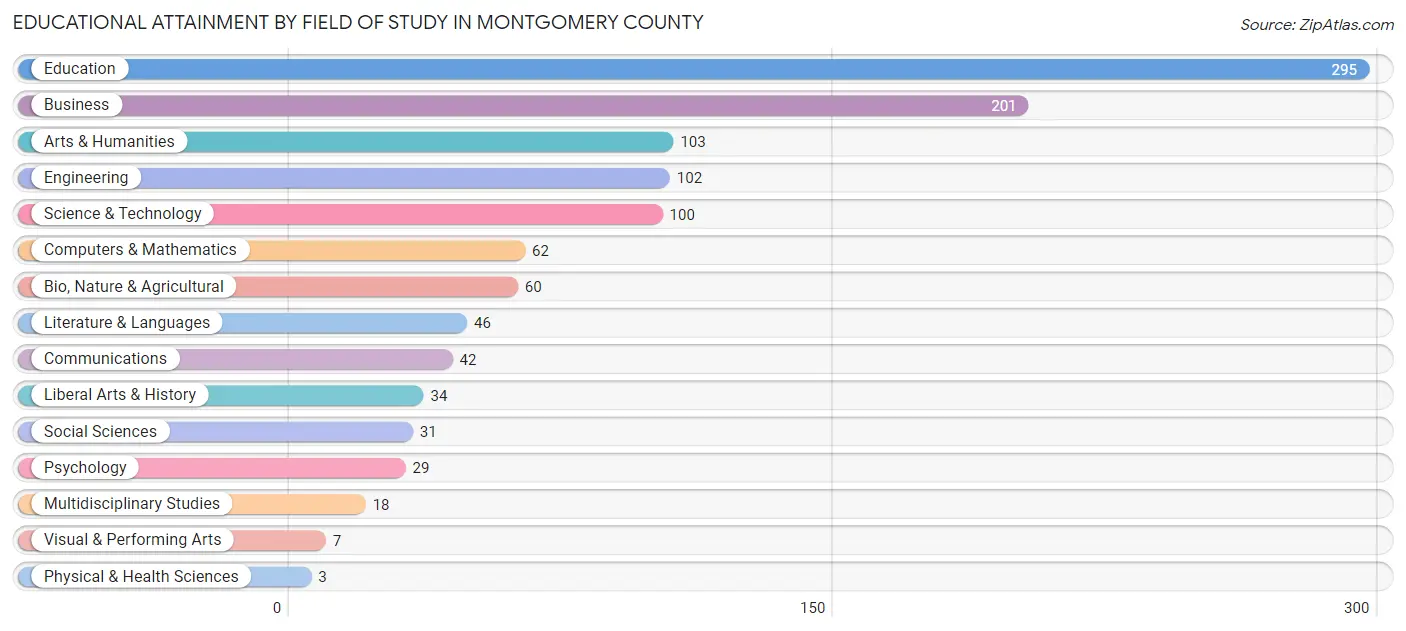
Educational Attainment by Field of Study in Montgomery County
Education (295 | 26.0%), business (201 | 17.7%), arts & humanities (103 | 9.1%), engineering (102 | 9.0%), and science & technology (100 | 8.8%) are the most common fields of study among 1,133 individuals in Montgomery County who have obtained a bachelor's degree or higher.
| Field of Study | # Graduates | % Graduates |
| Computers & Mathematics | 62 | 5.5% |
| Bio, Nature & Agricultural | 60 | 5.3% |
| Physical & Health Sciences | 3 | 0.3% |
| Psychology | 29 | 2.6% |
| Social Sciences | 31 | 2.7% |
| Engineering | 102 | 9.0% |
| Multidisciplinary Studies | 18 | 1.6% |
| Science & Technology | 100 | 8.8% |
| Business | 201 | 17.7% |
| Education | 295 | 26.0% |
| Literature & Languages | 46 | 4.1% |
| Liberal Arts & History | 34 | 3.0% |
| Visual & Performing Arts | 7 | 0.6% |
| Communications | 42 | 3.7% |
| Arts & Humanities | 103 | 9.1% |
| Total | 1,133 | 100.0% |
Transportation & Commute in Montgomery County
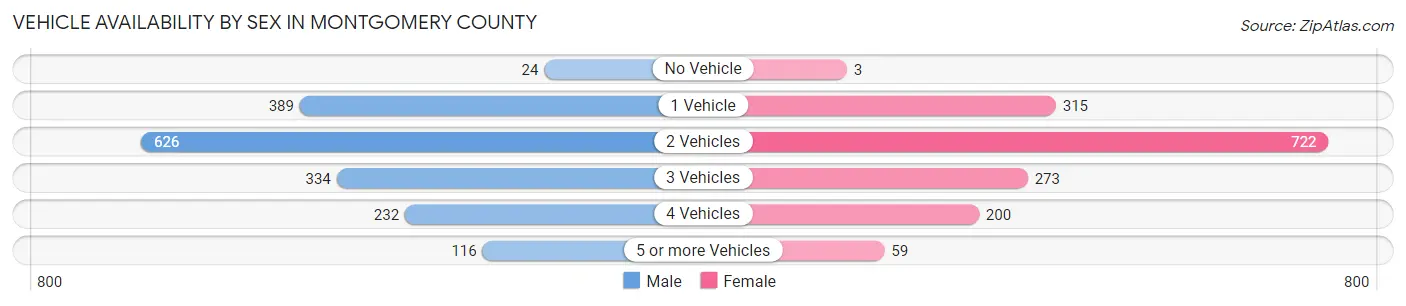
Vehicle Availability by Sex in Montgomery County
The most prevalent vehicle ownership categories in Montgomery County are males with 2 vehicles (626, accounting for 36.4%) and females with 2 vehicles (722, making up 39.8%).
| Vehicles Available | Male | Female |
| No Vehicle | 24 (1.4%) | 3 (0.2%) |
| 1 Vehicle | 389 (22.6%) | 315 (20.0%) |
| 2 Vehicles | 626 (36.4%) | 722 (45.9%) |
| 3 Vehicles | 334 (19.4%) | 273 (17.4%) |
| 4 Vehicles | 232 (13.5%) | 200 (12.7%) |
| 5 or more Vehicles | 116 (6.7%) | 59 (3.7%) |
| Total | 1,721 (100.0%) | 1,572 (100.0%) |
Commute Time in Montgomery County
The most frequently occuring commute durations in Montgomery County are 15 to 19 minutes (491 commuters, 15.6%), 5 to 9 minutes (431 commuters, 13.7%), and 10 to 14 minutes (430 commuters, 13.7%).
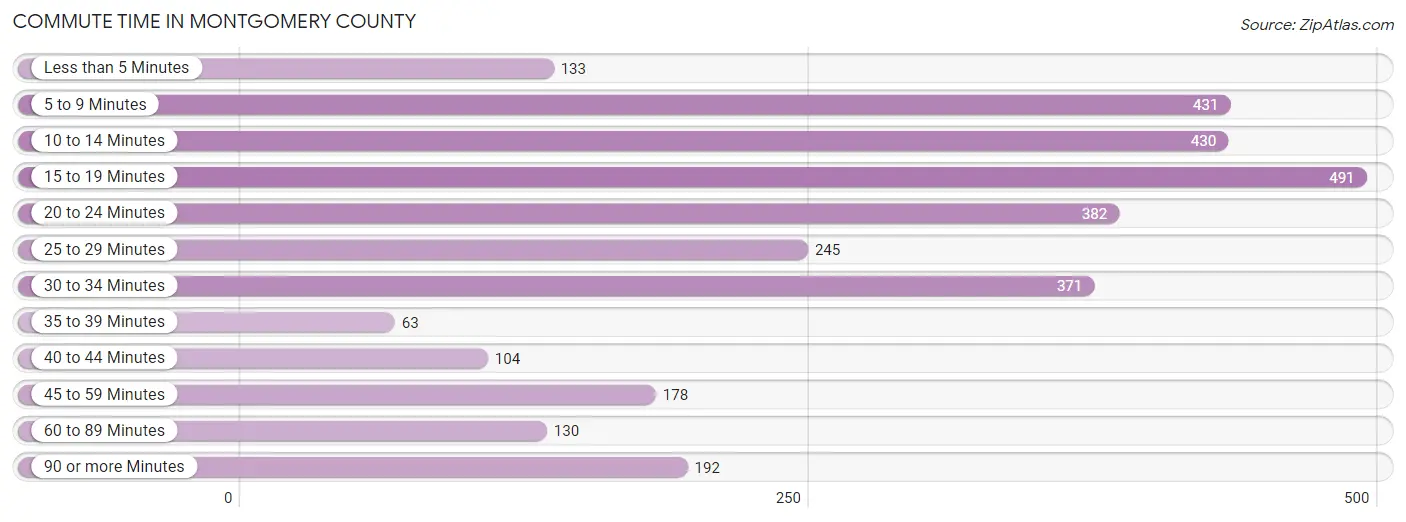
| Commute Time | # Commuters | % Commuters |
| Less than 5 Minutes | 133 | 4.2% |
| 5 to 9 Minutes | 431 | 13.7% |
| 10 to 14 Minutes | 430 | 13.7% |
| 15 to 19 Minutes | 491 | 15.6% |
| 20 to 24 Minutes | 382 | 12.1% |
| 25 to 29 Minutes | 245 | 7.8% |
| 30 to 34 Minutes | 371 | 11.8% |
| 35 to 39 Minutes | 63 | 2.0% |
| 40 to 44 Minutes | 104 | 3.3% |
| 45 to 59 Minutes | 178 | 5.7% |
| 60 to 89 Minutes | 130 | 4.1% |
| 90 or more Minutes | 192 | 6.1% |
Commute Time by Sex in Montgomery County
The most common commute times in Montgomery County are 5 to 9 minutes (283 commuters, 16.6%) for males and 10 to 14 minutes (338 commuters, 23.4%) for females.
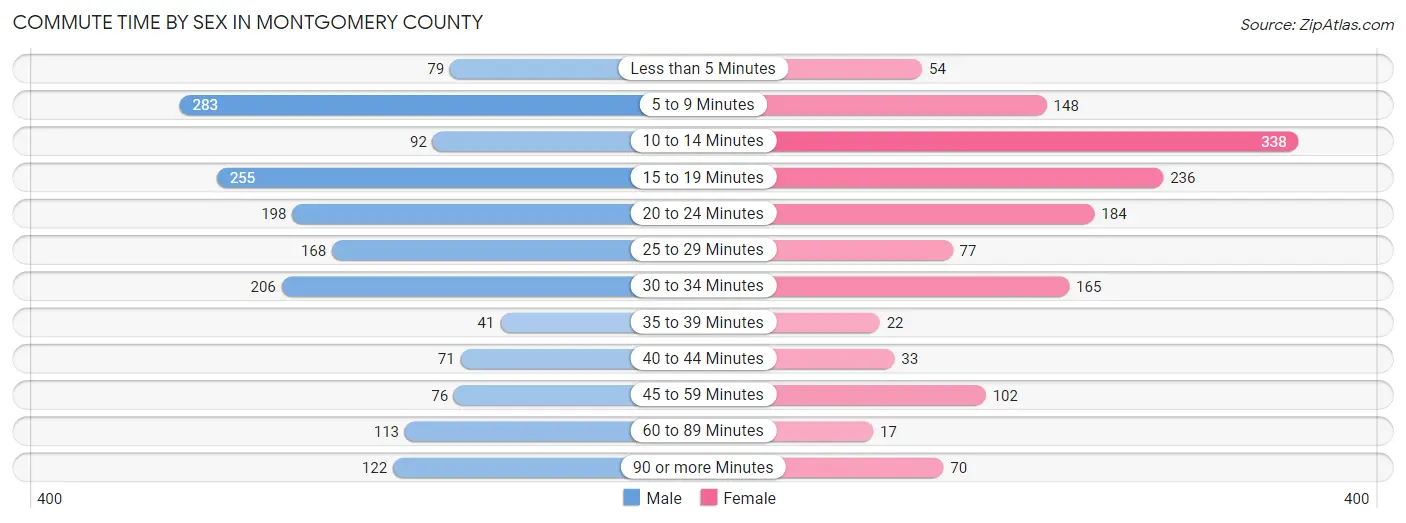
| Commute Time | Male | Female |
| Less than 5 Minutes | 79 (4.6%) | 54 (3.7%) |
| 5 to 9 Minutes | 283 (16.6%) | 148 (10.2%) |
| 10 to 14 Minutes | 92 (5.4%) | 338 (23.4%) |
| 15 to 19 Minutes | 255 (15.0%) | 236 (16.3%) |
| 20 to 24 Minutes | 198 (11.6%) | 184 (12.7%) |
| 25 to 29 Minutes | 168 (9.9%) | 77 (5.3%) |
| 30 to 34 Minutes | 206 (12.1%) | 165 (11.4%) |
| 35 to 39 Minutes | 41 (2.4%) | 22 (1.5%) |
| 40 to 44 Minutes | 71 (4.2%) | 33 (2.3%) |
| 45 to 59 Minutes | 76 (4.5%) | 102 (7.0%) |
| 60 to 89 Minutes | 113 (6.6%) | 17 (1.2%) |
| 90 or more Minutes | 122 (7.2%) | 70 (4.8%) |
Time of Departure to Work by Sex in Montgomery County
The most frequent times of departure to work in Montgomery County are 7:00 AM to 7:29 AM (276, 16.2%) for males and 7:00 AM to 7:29 AM (359, 24.8%) for females.
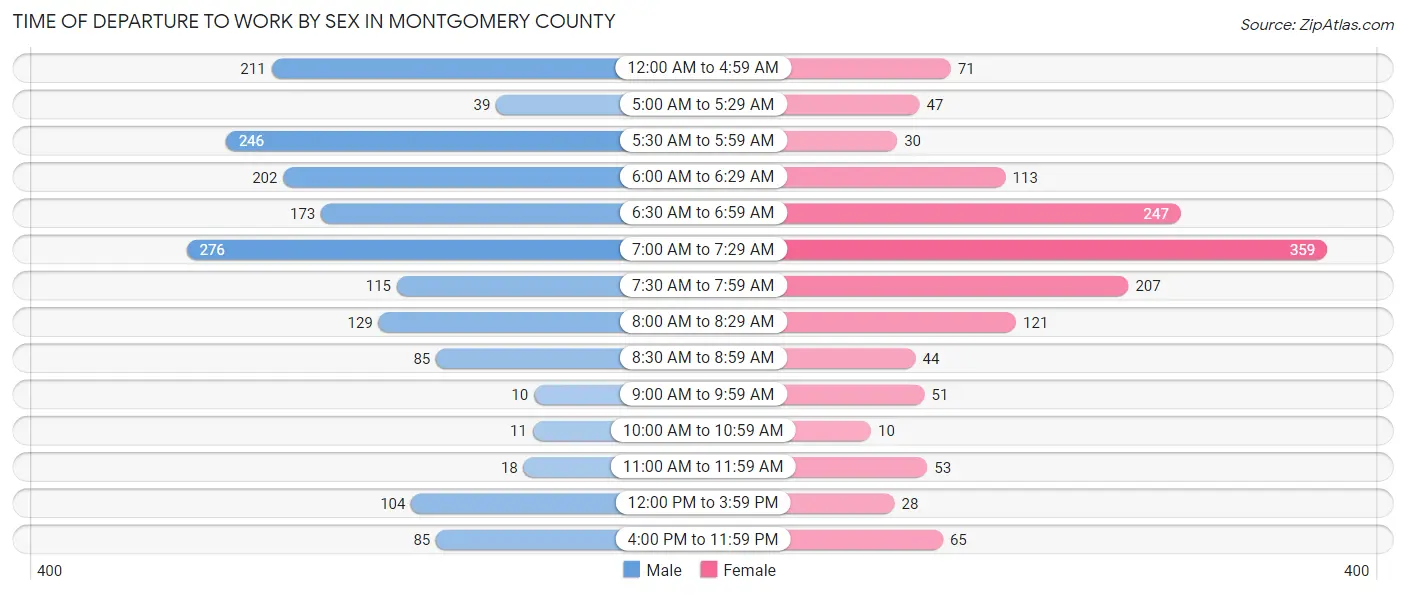
| Time of Departure | Male | Female |
| 12:00 AM to 4:59 AM | 211 (12.4%) | 71 (4.9%) |
| 5:00 AM to 5:29 AM | 39 (2.3%) | 47 (3.3%) |
| 5:30 AM to 5:59 AM | 246 (14.4%) | 30 (2.1%) |
| 6:00 AM to 6:29 AM | 202 (11.8%) | 113 (7.8%) |
| 6:30 AM to 6:59 AM | 173 (10.2%) | 247 (17.1%) |
| 7:00 AM to 7:29 AM | 276 (16.2%) | 359 (24.8%) |
| 7:30 AM to 7:59 AM | 115 (6.8%) | 207 (14.3%) |
| 8:00 AM to 8:29 AM | 129 (7.6%) | 121 (8.4%) |
| 8:30 AM to 8:59 AM | 85 (5.0%) | 44 (3.0%) |
| 9:00 AM to 9:59 AM | 10 (0.6%) | 51 (3.5%) |
| 10:00 AM to 10:59 AM | 11 (0.6%) | 10 (0.7%) |
| 11:00 AM to 11:59 AM | 18 (1.1%) | 53 (3.7%) |
| 12:00 PM to 3:59 PM | 104 (6.1%) | 28 (1.9%) |
| 4:00 PM to 11:59 PM | 85 (5.0%) | 65 (4.5%) |
| Total | 1,704 (100.0%) | 1,446 (100.0%) |
Housing Occupancy in Montgomery County
Occupancy by Ownership in Montgomery County
Of the total 2,966 dwellings in Montgomery County, owner-occupied units account for 2,268 (76.5%), while renter-occupied units make up 698 (23.5%).
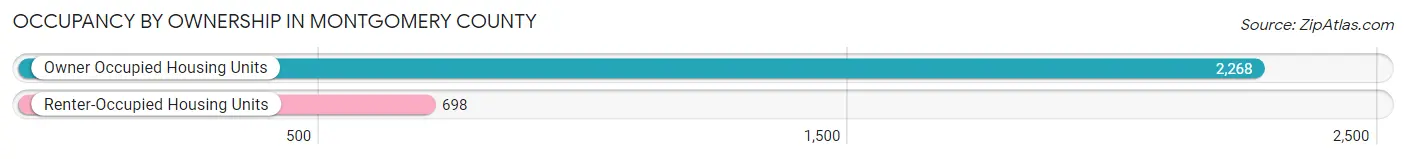
| Occupancy | # Housing Units | % Housing Units |
| Owner Occupied Housing Units | 2,268 | 76.5% |
| Renter-Occupied Housing Units | 698 | 23.5% |
| Total Occupied Housing Units | 2,966 | 100.0% |
Occupancy by Household Size in Montgomery County
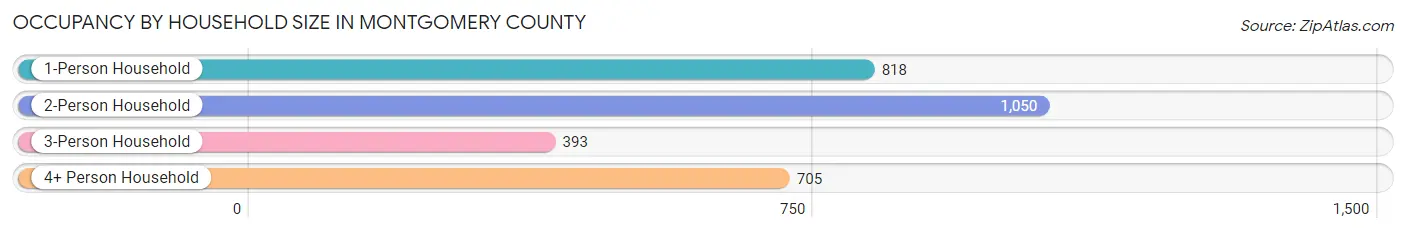
| Household Size | # Housing Units | % Housing Units |
| 1-Person Household | 818 | 27.6% |
| 2-Person Household | 1,050 | 35.4% |
| 3-Person Household | 393 | 13.3% |
| 4+ Person Household | 705 | 23.8% |
| Total Housing Units | 2,966 | 100.0% |
Occupancy by Ownership by Household Size in Montgomery County
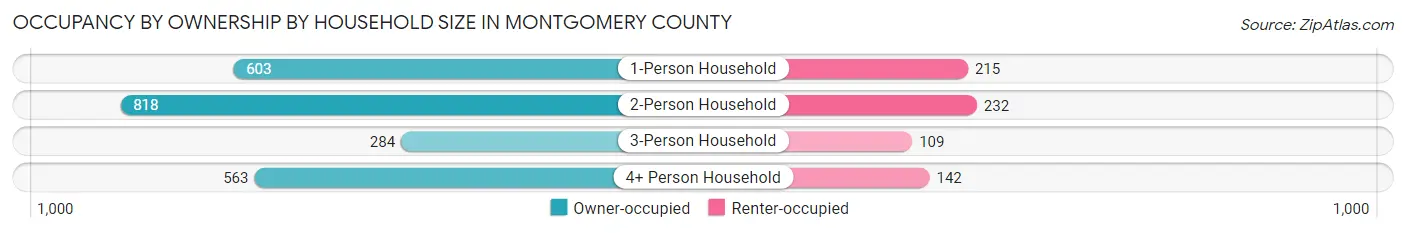
| Household Size | Owner-occupied | Renter-occupied |
| 1-Person Household | 603 (73.7%) | 215 (26.3%) |
| 2-Person Household | 818 (77.9%) | 232 (22.1%) |
| 3-Person Household | 284 (72.3%) | 109 (27.7%) |
| 4+ Person Household | 563 (79.9%) | 142 (20.1%) |
| Total Housing Units | 2,268 (76.5%) | 698 (23.5%) |
Occupancy by Educational Attainment in Montgomery County
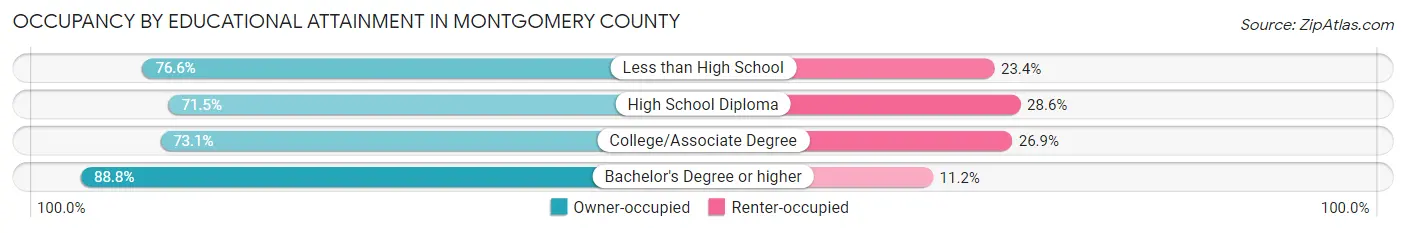
| Household Size | Owner-occupied | Renter-occupied |
| Less than High School | 341 (76.6%) | 104 (23.4%) |
| High School Diploma | 796 (71.5%) | 318 (28.5%) |
| College/Associate Degree | 552 (73.1%) | 203 (26.9%) |
| Bachelor's Degree or higher | 579 (88.8%) | 73 (11.2%) |
Occupancy by Age of Householder in Montgomery County
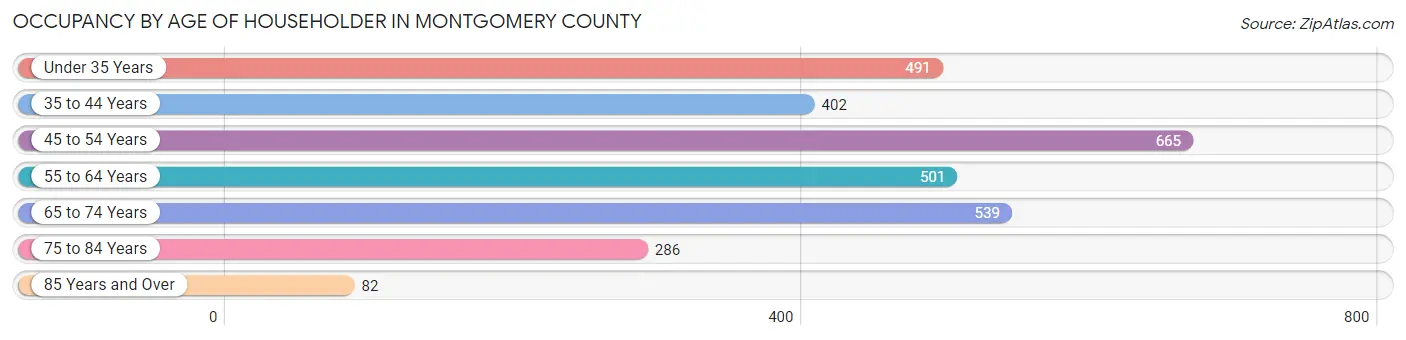
| Age Bracket | # Households | % Households |
| Under 35 Years | 491 | 16.6% |
| 35 to 44 Years | 402 | 13.6% |
| 45 to 54 Years | 665 | 22.4% |
| 55 to 64 Years | 501 | 16.9% |
| 65 to 74 Years | 539 | 18.2% |
| 75 to 84 Years | 286 | 9.6% |
| 85 Years and Over | 82 | 2.8% |
| Total | 2,966 | 100.0% |
Housing Finances in Montgomery County
Median Income by Occupancy in Montgomery County
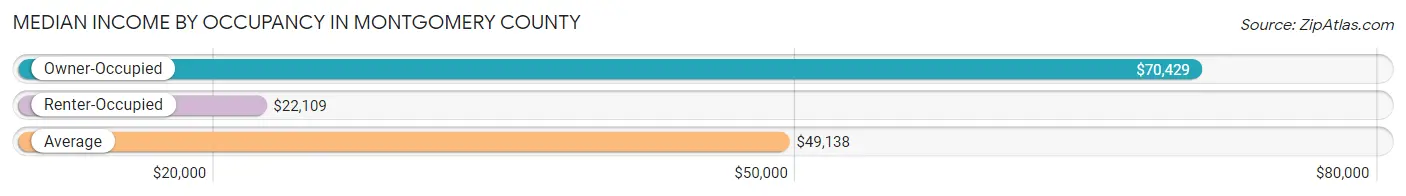
| Occupancy Type | # Households | Median Income |
| Owner-Occupied | 2,268 (76.5%) | $70,429 |
| Renter-Occupied | 698 (23.5%) | $22,109 |
| Average | 2,966 (100.0%) | $49,138 |
Occupancy by Householder Income Bracket in Montgomery County
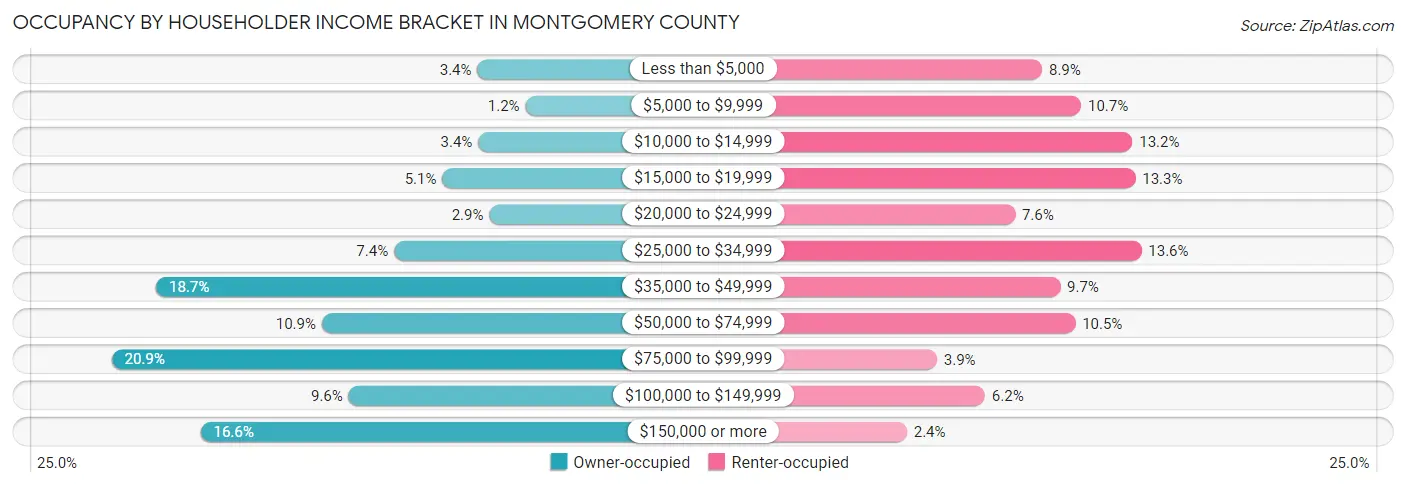
| Income Bracket | Owner-occupied | Renter-occupied |
| Less than $5,000 | 78 (3.4%) | 62 (8.9%) |
| $5,000 to $9,999 | 26 (1.1%) | 75 (10.7%) |
| $10,000 to $14,999 | 77 (3.4%) | 92 (13.2%) |
| $15,000 to $19,999 | 116 (5.1%) | 93 (13.3%) |
| $20,000 to $24,999 | 65 (2.9%) | 53 (7.6%) |
| $25,000 to $34,999 | 168 (7.4%) | 95 (13.6%) |
| $35,000 to $49,999 | 425 (18.7%) | 68 (9.7%) |
| $50,000 to $74,999 | 246 (10.8%) | 73 (10.5%) |
| $75,000 to $99,999 | 473 (20.9%) | 27 (3.9%) |
| $100,000 to $149,999 | 217 (9.6%) | 43 (6.2%) |
| $150,000 or more | 377 (16.6%) | 17 (2.4%) |
| Total | 2,268 (100.0%) | 698 (100.0%) |
Monthly Housing Cost Tiers in Montgomery County
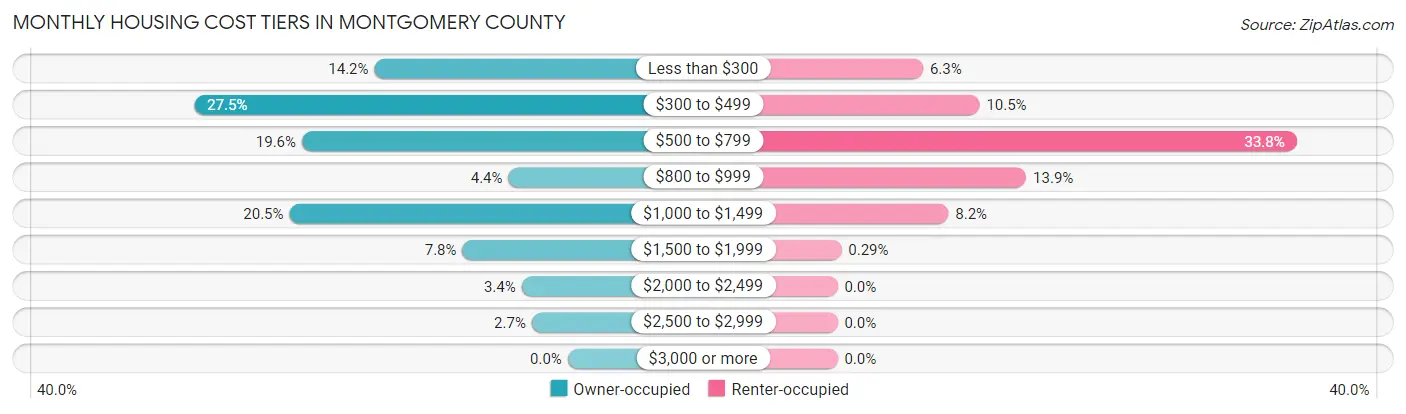
| Monthly Cost | Owner-occupied | Renter-occupied |
| Less than $300 | 323 (14.2%) | 44 (6.3%) |
| $300 to $499 | 624 (27.5%) | 73 (10.5%) |
| $500 to $799 | 444 (19.6%) | 236 (33.8%) |
| $800 to $999 | 99 (4.4%) | 97 (13.9%) |
| $1,000 to $1,499 | 465 (20.5%) | 57 (8.2%) |
| $1,500 to $1,999 | 176 (7.8%) | 2 (0.3%) |
| $2,000 to $2,499 | 77 (3.4%) | 0 (0.0%) |
| $2,500 to $2,999 | 60 (2.6%) | 0 (0.0%) |
| $3,000 or more | 0 (0.0%) | 0 (0.0%) |
| Total | 2,268 (100.0%) | 698 (100.0%) |
Physical Housing Characteristics in Montgomery County
Housing Structures in Montgomery County
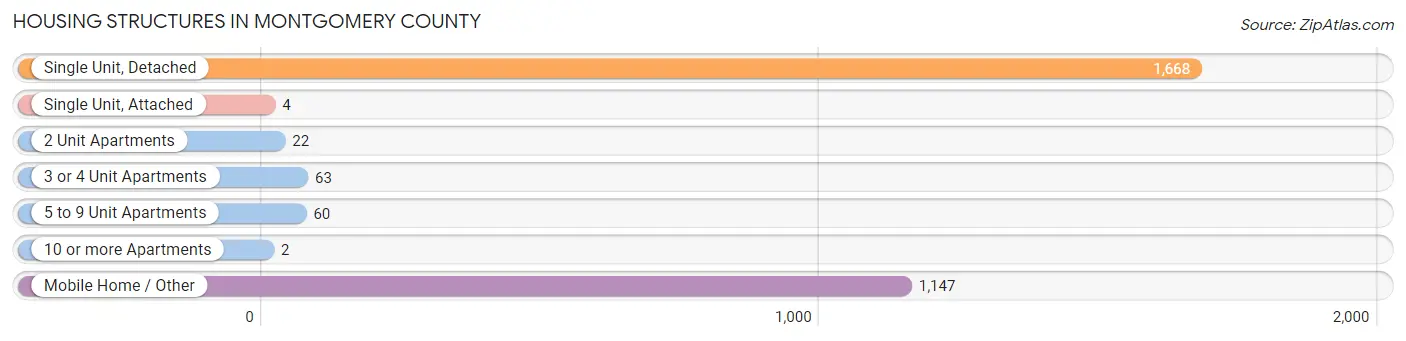
| Structure Type | # Housing Units | % Housing Units |
| Single Unit, Detached | 1,668 | 56.2% |
| Single Unit, Attached | 4 | 0.1% |
| 2 Unit Apartments | 22 | 0.7% |
| 3 or 4 Unit Apartments | 63 | 2.1% |
| 5 to 9 Unit Apartments | 60 | 2.0% |
| 10 or more Apartments | 2 | 0.1% |
| Mobile Home / Other | 1,147 | 38.7% |
| Total | 2,966 | 100.0% |
Housing Structures by Occupancy in Montgomery County
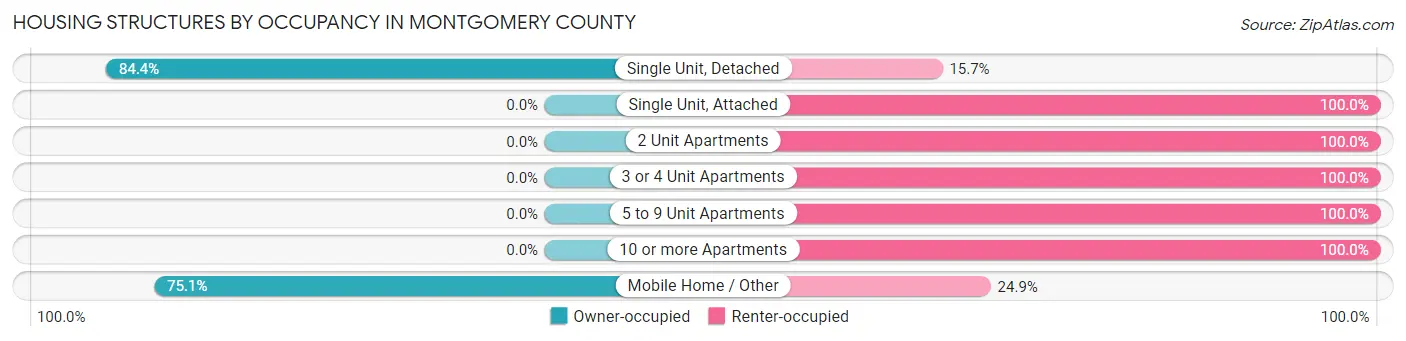
| Structure Type | Owner-occupied | Renter-occupied |
| Single Unit, Detached | 1,407 (84.4%) | 261 (15.7%) |
| Single Unit, Attached | 0 (0.0%) | 4 (100.0%) |
| 2 Unit Apartments | 0 (0.0%) | 22 (100.0%) |
| 3 or 4 Unit Apartments | 0 (0.0%) | 63 (100.0%) |
| 5 to 9 Unit Apartments | 0 (0.0%) | 60 (100.0%) |
| 10 or more Apartments | 0 (0.0%) | 2 (100.0%) |
| Mobile Home / Other | 861 (75.1%) | 286 (24.9%) |
| Total | 2,268 (76.5%) | 698 (23.5%) |
Housing Structures by Number of Rooms in Montgomery County
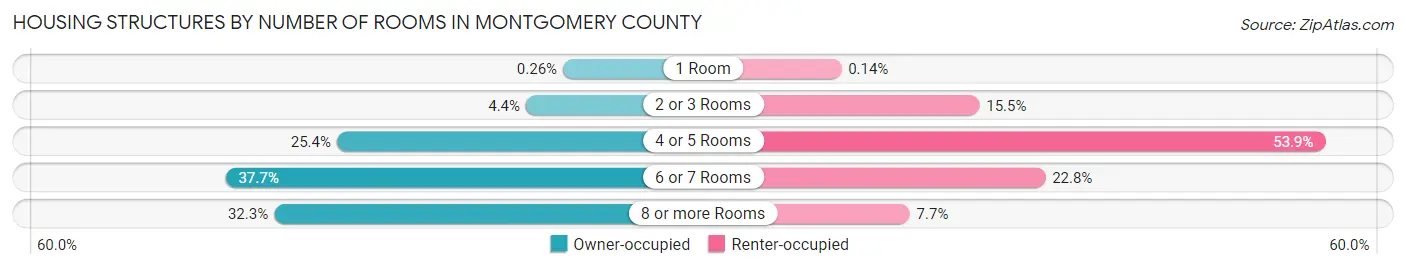
| Number of Rooms | Owner-occupied | Renter-occupied |
| 1 Room | 6 (0.3%) | 1 (0.1%) |
| 2 or 3 Rooms | 99 (4.4%) | 108 (15.5%) |
| 4 or 5 Rooms | 575 (25.4%) | 376 (53.9%) |
| 6 or 7 Rooms | 855 (37.7%) | 159 (22.8%) |
| 8 or more Rooms | 733 (32.3%) | 54 (7.7%) |
| Total | 2,268 (100.0%) | 698 (100.0%) |
Housing Structure by Heating Type in Montgomery County
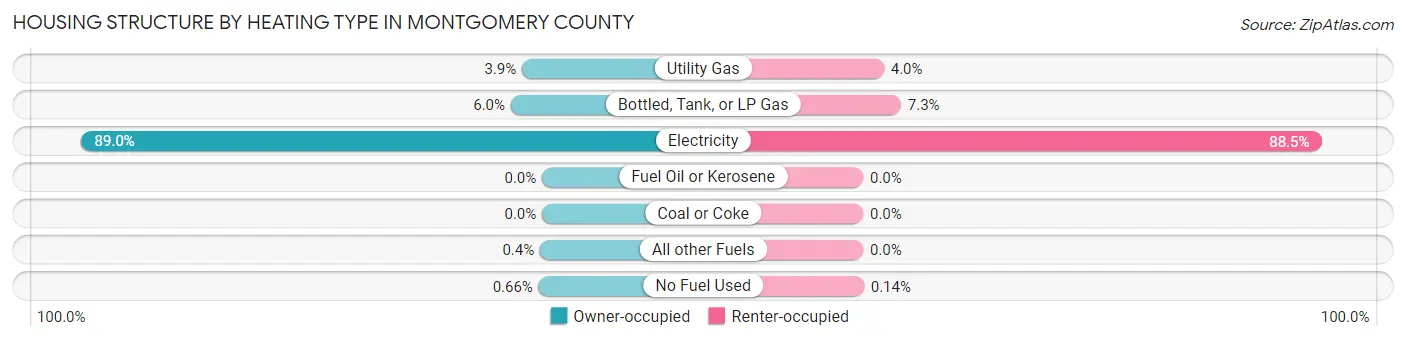
| Heating Type | Owner-occupied | Renter-occupied |
| Utility Gas | 88 (3.9%) | 28 (4.0%) |
| Bottled, Tank, or LP Gas | 137 (6.0%) | 51 (7.3%) |
| Electricity | 2,019 (89.0%) | 618 (88.5%) |
| Fuel Oil or Kerosene | 0 (0.0%) | 0 (0.0%) |
| Coal or Coke | 0 (0.0%) | 0 (0.0%) |
| All other Fuels | 9 (0.4%) | 0 (0.0%) |
| No Fuel Used | 15 (0.7%) | 1 (0.1%) |
| Total | 2,268 (100.0%) | 698 (100.0%) |
Household Vehicle Usage in Montgomery County
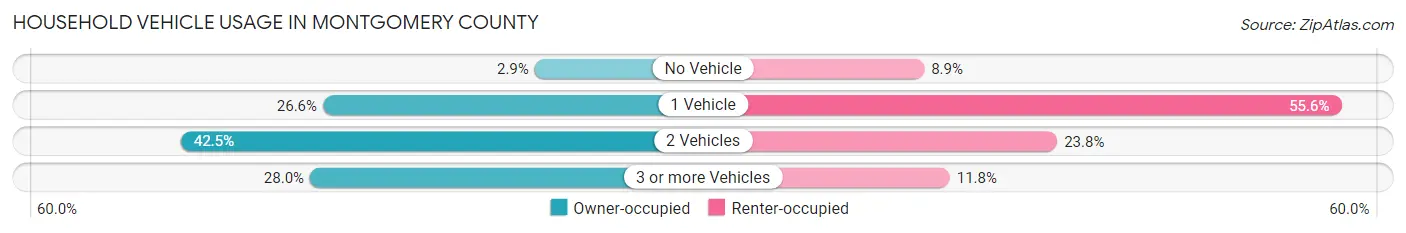
| Vehicles per Household | Owner-occupied | Renter-occupied |
| No Vehicle | 65 (2.9%) | 62 (8.9%) |
| 1 Vehicle | 603 (26.6%) | 388 (55.6%) |
| 2 Vehicles | 964 (42.5%) | 166 (23.8%) |
| 3 or more Vehicles | 636 (28.0%) | 82 (11.7%) |
| Total | 2,268 (100.0%) | 698 (100.0%) |
Real Estate & Mortgages in Montgomery County
Real Estate and Mortgage Overview in Montgomery County
| Characteristic | Without Mortgage | With Mortgage |
| Housing Units | 1,305 | 963 |
| Median Property Value | $83,600 | $136,300 |
| Median Household Income | $49,013 | $179 |
| Monthly Housing Costs | $384 | $0 |
| Real Estate Taxes | $765 | $42 |
Property Value by Mortgage Status in Montgomery County
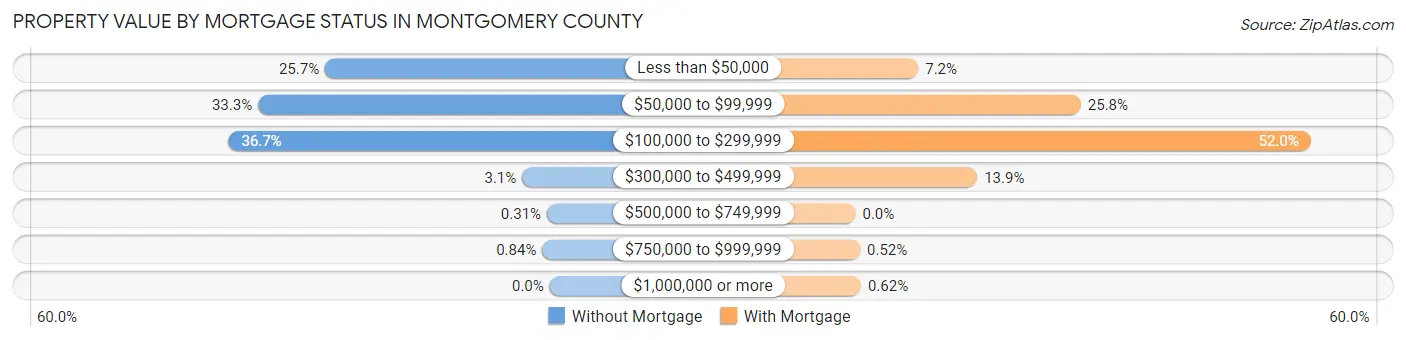
| Property Value | Without Mortgage | With Mortgage |
| Less than $50,000 | 335 (25.7%) | 69 (7.2%) |
| $50,000 to $99,999 | 435 (33.3%) | 248 (25.8%) |
| $100,000 to $299,999 | 479 (36.7%) | 501 (52.0%) |
| $300,000 to $499,999 | 41 (3.1%) | 134 (13.9%) |
| $500,000 to $749,999 | 4 (0.3%) | 0 (0.0%) |
| $750,000 to $999,999 | 11 (0.8%) | 5 (0.5%) |
| $1,000,000 or more | 0 (0.0%) | 6 (0.6%) |
| Total | 1,305 (100.0%) | 963 (100.0%) |
Household Income by Mortgage Status in Montgomery County
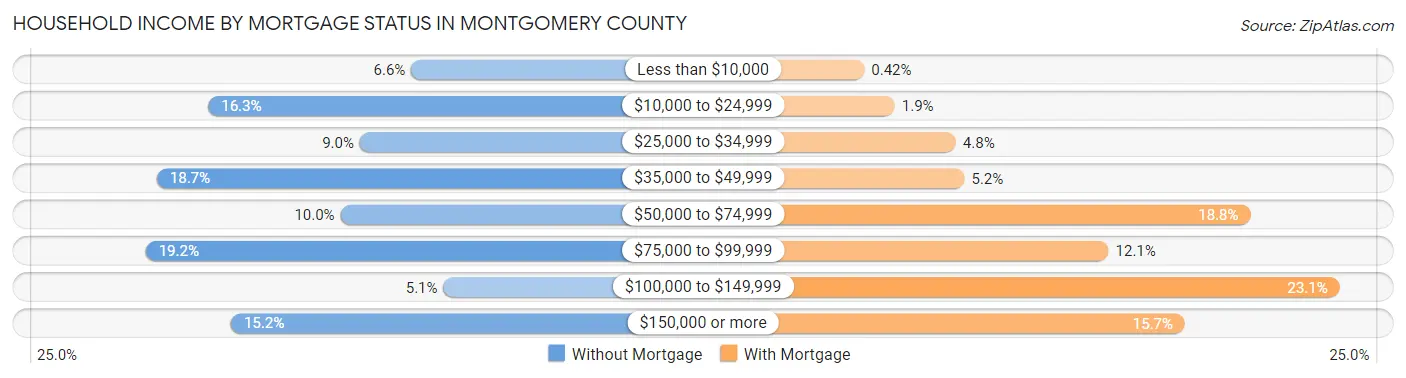
| Household Income | Without Mortgage | With Mortgage |
| Less than $10,000 | 86 (6.6%) | 4 (0.4%) |
| $10,000 to $24,999 | 212 (16.3%) | 18 (1.9%) |
| $25,000 to $34,999 | 118 (9.0%) | 46 (4.8%) |
| $35,000 to $49,999 | 244 (18.7%) | 50 (5.2%) |
| $50,000 to $74,999 | 130 (10.0%) | 181 (18.8%) |
| $75,000 to $99,999 | 251 (19.2%) | 116 (12.0%) |
| $100,000 to $149,999 | 66 (5.1%) | 222 (23.1%) |
| $150,000 or more | 198 (15.2%) | 151 (15.7%) |
| Total | 1,305 (100.0%) | 963 (100.0%) |
Property Value to Household Income Ratio in Montgomery County
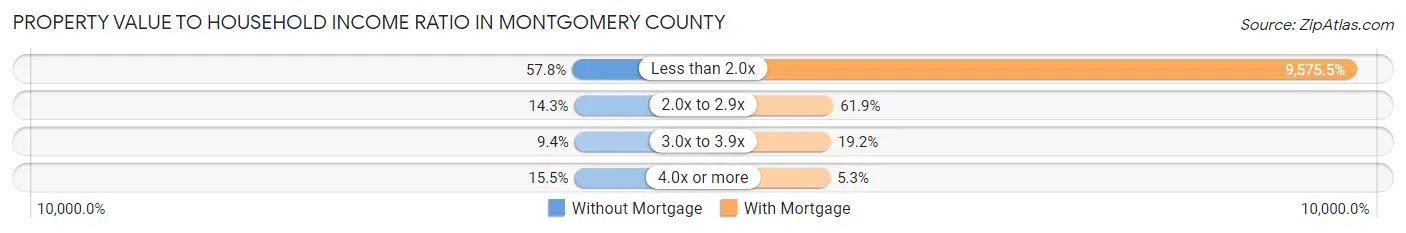
| Value-to-Income Ratio | Without Mortgage | With Mortgage |
| Less than 2.0x | 754 (57.8%) | 92,212 (9,575.5%) |
| 2.0x to 2.9x | 187 (14.3%) | 596 (61.9%) |
| 3.0x to 3.9x | 122 (9.3%) | 185 (19.2%) |
| 4.0x or more | 202 (15.5%) | 51 (5.3%) |
| Total | 1,305 (100.0%) | 963 (100.0%) |
Real Estate Taxes by Mortgage Status in Montgomery County
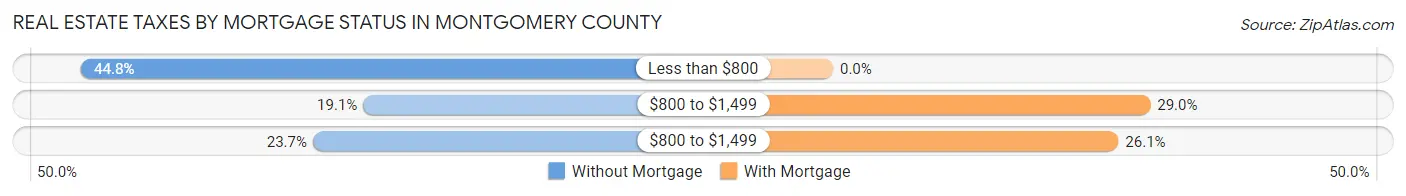
| Property Taxes | Without Mortgage | With Mortgage |
| Less than $800 | 585 (44.8%) | 0 (0.0%) |
| $800 to $1,499 | 249 (19.1%) | 279 (29.0%) |
| $800 to $1,499 | 309 (23.7%) | 251 (26.1%) |
| Total | 1,305 (100.0%) | 963 (100.0%) |
Health & Disability in Montgomery County
Health Insurance Coverage by Age in Montgomery County
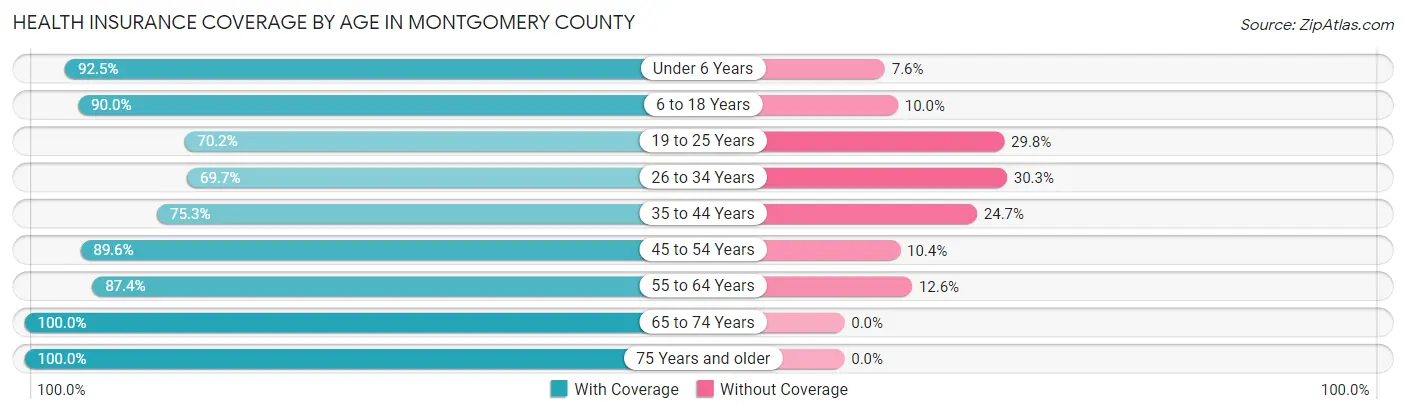
| Age Bracket | With Coverage | Without Coverage |
| Under 6 Years | 502 (92.4%) | 41 (7.5%) |
| 6 to 18 Years | 1,291 (90.0%) | 143 (10.0%) |
| 19 to 25 Years | 735 (70.2%) | 312 (29.8%) |
| 26 to 34 Years | 575 (69.7%) | 250 (30.3%) |
| 35 to 44 Years | 673 (75.3%) | 221 (24.7%) |
| 45 to 54 Years | 854 (89.6%) | 99 (10.4%) |
| 55 to 64 Years | 942 (87.4%) | 136 (12.6%) |
| 65 to 74 Years | 867 (100.0%) | 0 (0.0%) |
| 75 Years and older | 577 (100.0%) | 0 (0.0%) |
| Total | 7,016 (85.4%) | 1,202 (14.6%) |
Health Insurance Coverage by Citizenship Status in Montgomery County
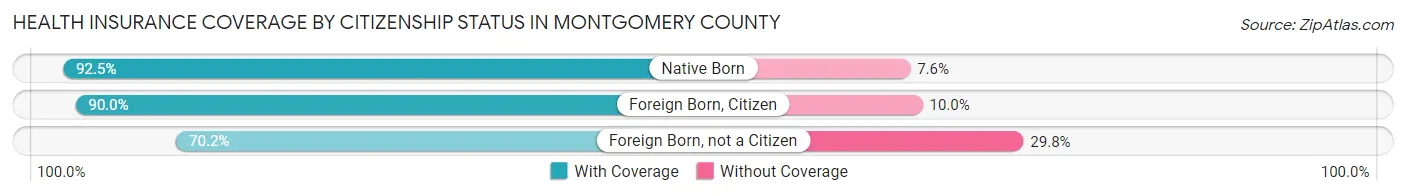
| Citizenship Status | With Coverage | Without Coverage |
| Native Born | 502 (92.4%) | 41 (7.5%) |
| Foreign Born, Citizen | 1,291 (90.0%) | 143 (10.0%) |
| Foreign Born, not a Citizen | 735 (70.2%) | 312 (29.8%) |
Health Insurance Coverage by Household Income in Montgomery County
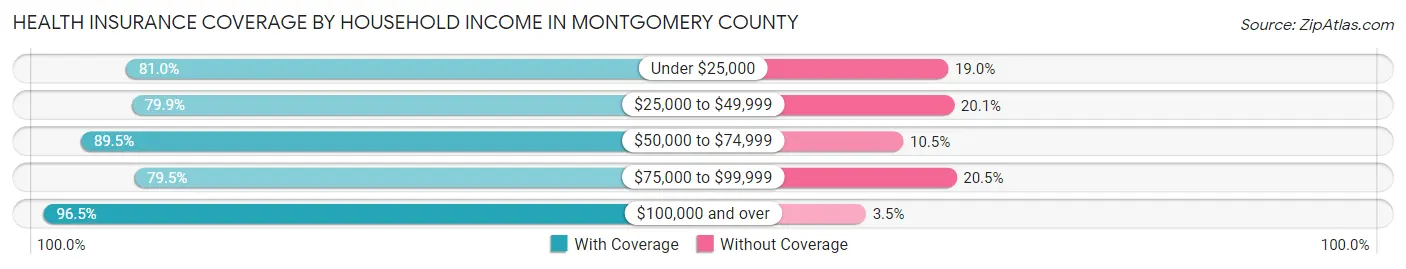
| Household Income | With Coverage | Without Coverage |
| Under $25,000 | 1,043 (81.0%) | 244 (19.0%) |
| $25,000 to $49,999 | 1,721 (79.9%) | 432 (20.1%) |
| $50,000 to $74,999 | 815 (89.5%) | 96 (10.5%) |
| $75,000 to $99,999 | 1,298 (79.5%) | 335 (20.5%) |
| $100,000 and over | 1,826 (96.5%) | 67 (3.5%) |
Public vs Private Health Insurance Coverage by Age in Montgomery County
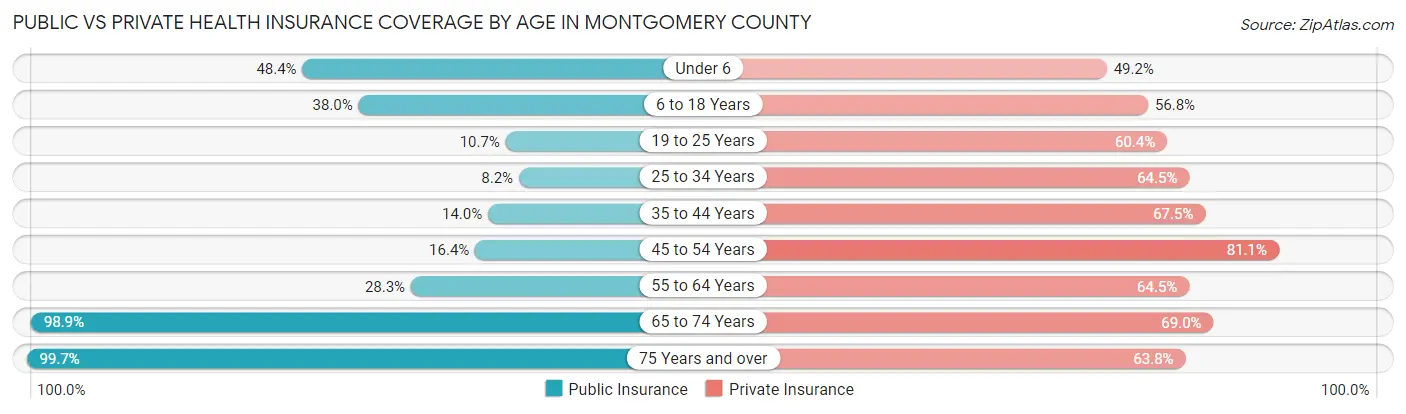
| Age Bracket | Public Insurance | Private Insurance |
| Under 6 | 263 (48.4%) | 267 (49.2%) |
| 6 to 18 Years | 545 (38.0%) | 815 (56.8%) |
| 19 to 25 Years | 112 (10.7%) | 632 (60.4%) |
| 25 to 34 Years | 68 (8.2%) | 532 (64.5%) |
| 35 to 44 Years | 125 (14.0%) | 603 (67.4%) |
| 45 to 54 Years | 156 (16.4%) | 773 (81.1%) |
| 55 to 64 Years | 305 (28.3%) | 695 (64.5%) |
| 65 to 74 Years | 857 (98.9%) | 598 (69.0%) |
| 75 Years and over | 575 (99.7%) | 368 (63.8%) |
| Total | 3,006 (36.6%) | 5,283 (64.3%) |
Disability Status by Sex by Age in Montgomery County
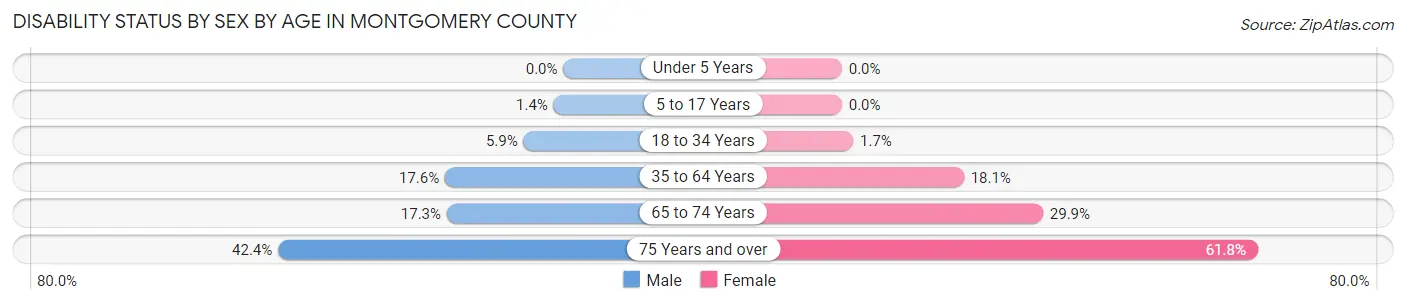
| Age Bracket | Male | Female |
| Under 5 Years | 0 (0.0%) | 0 (0.0%) |
| 5 to 17 Years | 9 (1.4%) | 0 (0.0%) |
| 18 to 34 Years | 63 (5.9%) | 17 (1.7%) |
| 35 to 64 Years | 244 (17.6%) | 278 (18.1%) |
| 65 to 74 Years | 77 (17.3%) | 126 (29.9%) |
| 75 Years and over | 86 (42.4%) | 231 (61.8%) |
Disability Class by Sex by Age in Montgomery County
Disability Class: Hearing Difficulty
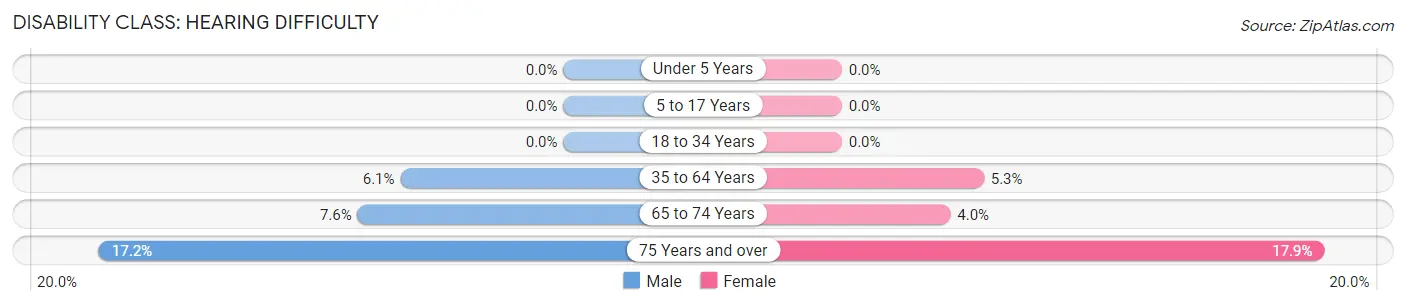
| Age Bracket | Male | Female |
| Under 5 Years | 0 (0.0%) | 0 (0.0%) |
| 5 to 17 Years | 0 (0.0%) | 0 (0.0%) |
| 18 to 34 Years | 0 (0.0%) | 0 (0.0%) |
| 35 to 64 Years | 84 (6.0%) | 81 (5.3%) |
| 65 to 74 Years | 34 (7.6%) | 17 (4.0%) |
| 75 Years and over | 35 (17.2%) | 67 (17.9%) |
Disability Class: Vision Difficulty
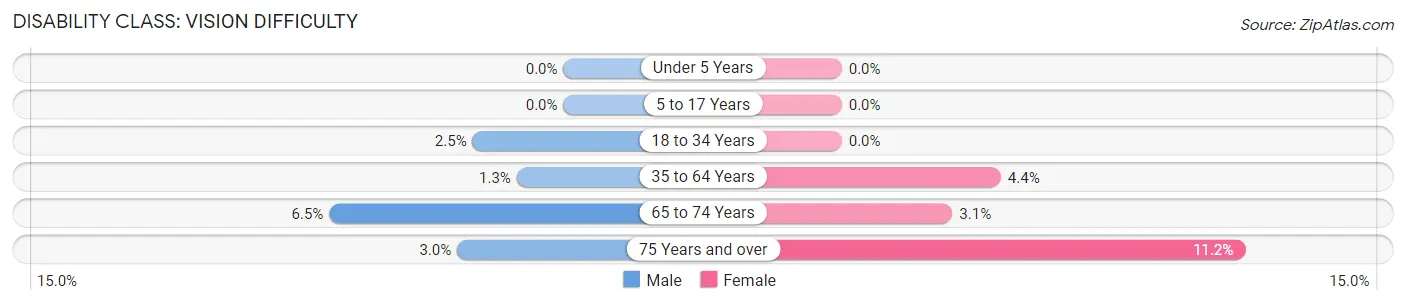
| Age Bracket | Male | Female |
| Under 5 Years | 0 (0.0%) | 0 (0.0%) |
| 5 to 17 Years | 0 (0.0%) | 0 (0.0%) |
| 18 to 34 Years | 27 (2.5%) | 0 (0.0%) |
| 35 to 64 Years | 18 (1.3%) | 68 (4.4%) |
| 65 to 74 Years | 29 (6.5%) | 13 (3.1%) |
| 75 Years and over | 6 (3.0%) | 42 (11.2%) |
Disability Class: Cognitive Difficulty
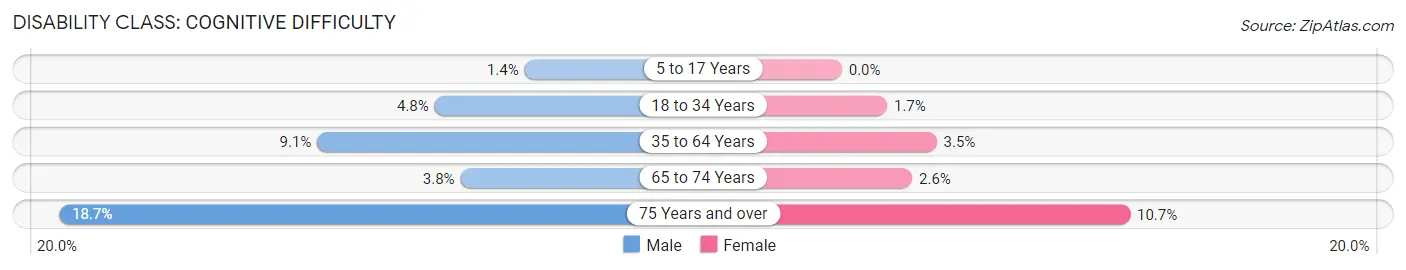
| Age Bracket | Male | Female |
| 5 to 17 Years | 9 (1.4%) | 0 (0.0%) |
| 18 to 34 Years | 51 (4.8%) | 17 (1.7%) |
| 35 to 64 Years | 127 (9.1%) | 54 (3.5%) |
| 65 to 74 Years | 17 (3.8%) | 11 (2.6%) |
| 75 Years and over | 38 (18.7%) | 40 (10.7%) |
Disability Class: Ambulatory Difficulty
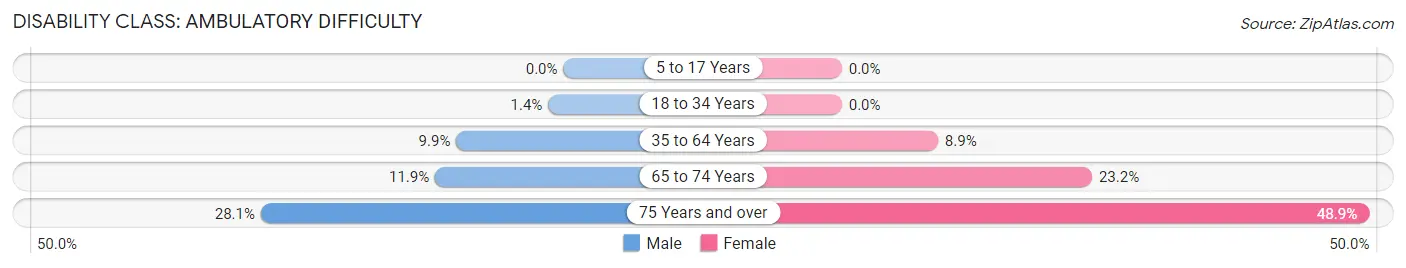
| Age Bracket | Male | Female |
| 5 to 17 Years | 0 (0.0%) | 0 (0.0%) |
| 18 to 34 Years | 15 (1.4%) | 0 (0.0%) |
| 35 to 64 Years | 138 (9.9%) | 137 (8.9%) |
| 65 to 74 Years | 53 (11.9%) | 98 (23.2%) |
| 75 Years and over | 57 (28.1%) | 183 (48.9%) |
Disability Class: Self-Care Difficulty
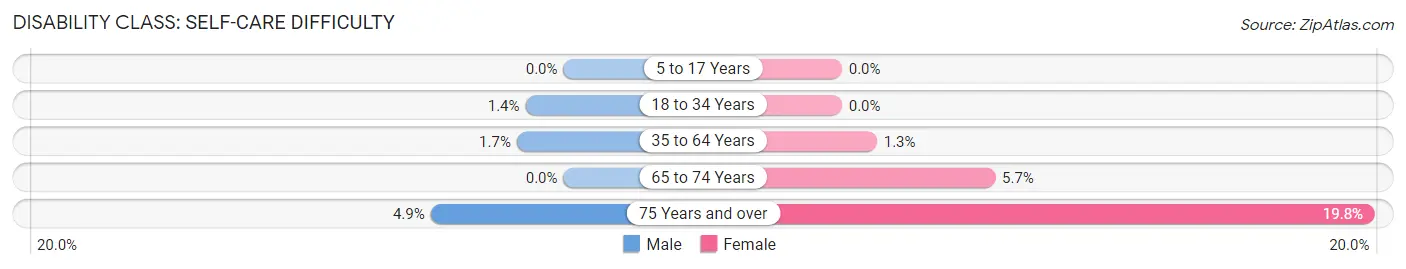
| Age Bracket | Male | Female |
| 5 to 17 Years | 0 (0.0%) | 0 (0.0%) |
| 18 to 34 Years | 15 (1.4%) | 0 (0.0%) |
| 35 to 64 Years | 24 (1.7%) | 20 (1.3%) |
| 65 to 74 Years | 0 (0.0%) | 24 (5.7%) |
| 75 Years and over | 10 (4.9%) | 74 (19.8%) |
Technology Access in Montgomery County
Computing Device Access in Montgomery County
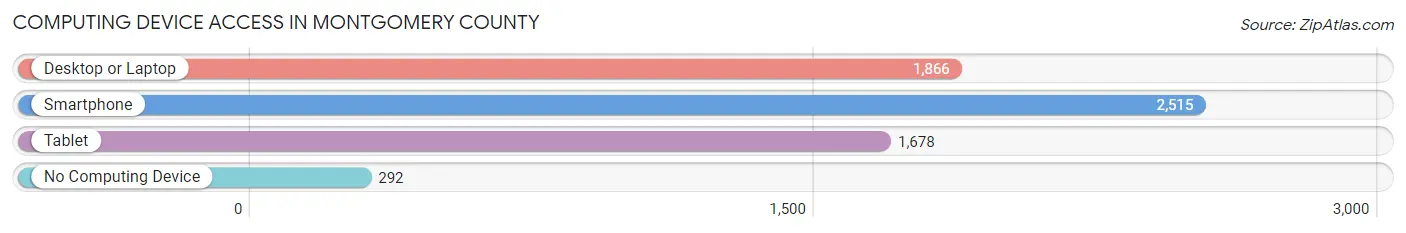
| Device Type | # Households | % Households |
| Desktop or Laptop | 1,866 | 62.9% |
| Smartphone | 2,515 | 84.8% |
| Tablet | 1,678 | 56.6% |
| No Computing Device | 292 | 9.8% |
| Total | 2,966 | 100.0% |
Internet Access in Montgomery County
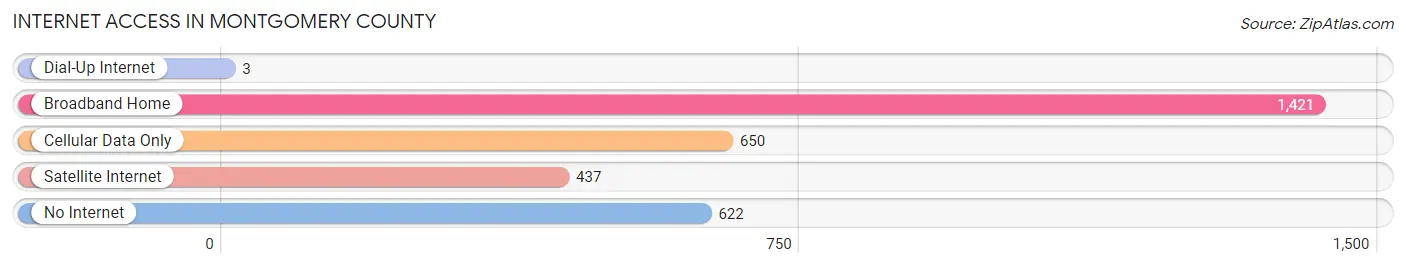
| Internet Type | # Households | % Households |
| Dial-Up Internet | 3 | 0.1% |
| Broadband Home | 1,421 | 47.9% |
| Cellular Data Only | 650 | 21.9% |
| Satellite Internet | 437 | 14.7% |
| No Internet | 622 | 21.0% |
| Total | 2,966 | 100.0% |
Montgomery County Summary
Montgomery County, Georgia is located in the southeastern part of the state, and is part of the Central Savannah River Area (CSRA). It is bordered by Toombs, Tattnall, and Jeff Davis counties to the north, Treutlen County to the east, Wheeler County to the south, and Laurens County to the west. The county seat is Mount Vernon, and the county has a total area of 441 square miles.
History
Montgomery County was created in 1793 from a portion of Washington County. It was named for General Richard Montgomery, who was killed in the Revolutionary War. The county was originally part of the Creek Nation, and the area was home to many Native American tribes. The first European settlers arrived in the area in the late 1700s, and the county was officially established in 1793.
The county was home to several plantations, and the economy was largely based on agriculture. Cotton was the main crop, and the county was home to several large plantations. The county was also home to several small towns, including Mount Vernon, which was established in 1810.
The county was home to several Civil War battles, including the Battle of Griswoldville in 1864. After the war, the county was largely agricultural, and the economy was based on cotton and other crops.
Geography
Montgomery County is located in the southeastern part of the state, and is part of the Central Savannah River Area (CSRA). It is bordered by Toombs, Tattnall, and Jeff Davis counties to the north, Treutlen County to the east, Wheeler County to the south, and Laurens County to the west. The county has a total area of 441 square miles, and is mostly rural. The terrain is mostly flat, with some rolling hills in the northern part of the county. The county is home to several rivers, including the Oconee, Ogeechee, and Altamaha.
The county is home to several state parks, including Magnolia Springs State Park, which is located in the northern part of the county. The park is home to several hiking trails, camping sites, and a lake.
Economy
The economy of Montgomery County is largely based on agriculture. Cotton is the main crop, and the county is home to several large cotton plantations. The county is also home to several small businesses, including restaurants, retail stores, and manufacturing companies.
The county is home to several large employers, including Georgia-Pacific, which is a paper and pulp company. The county is also home to several military bases, including Fort Gordon, which is located in the northern part of the county.
Demographics
As of the 2010 census, the population of Montgomery County was 9,123. The population is mostly white (77.3%), with African Americans making up 19.3% of the population. The median household income is $37,945, and the median age is 38.7.
Conclusion
Montgomery County, Georgia is located in the southeastern part of the state, and is part of the Central Savannah River Area (CSRA). It was created in 1793 from a portion of Washington County, and was named for General Richard Montgomery. The county is mostly rural, and the economy is largely based on agriculture. The population is mostly white, with African Americans making up 19.3% of the population. The county is home to several state parks, military bases, and large employers.
Common Questions
What is Per Capita Income in Montgomery County?
Per Capita income in Montgomery County is $27,994.
What is the Median Family Income in Montgomery County?
Median Family Income in Montgomery County is $66,419.
What is the Median Household income in Montgomery County?
Median Household Income in Montgomery County is $49,138.
What is Income or Wage Gap in Montgomery County?
Income or Wage Gap in Montgomery County is 22.8%.
Women in Montgomery County earn 77.2 cents for every dollar earned by a man.
What is Family Income Deficit in Montgomery County?
Family Income Deficit in Montgomery County is $8,315.
Families that are below poverty line in Montgomery County earn $8,315 less on average than the poverty threshold level.
What is Inequality or Gini Index in Montgomery County?
Inequality or Gini Index in Montgomery County is 0.51.
What is the Total Population of Montgomery County?
Total Population of Montgomery County is 8,687.
What is the Total Male Population of Montgomery County?
Total Male Population of Montgomery County is 4,405.
What is the Total Female Population of Montgomery County?
Total Female Population of Montgomery County is 4,282.
What is the Ratio of Males per 100 Females in Montgomery County?
There are 102.87 Males per 100 Females in Montgomery County.
What is the Ratio of Females per 100 Males in Montgomery County?
There are 97.21 Females per 100 Males in Montgomery County.
What is the Median Population Age in Montgomery County?
Median Population Age in Montgomery County is 37.5 Years.
What is the Average Family Size in Montgomery County
Average Family Size in Montgomery County is 3.3 People.
What is the Average Household Size in Montgomery County
Average Household Size in Montgomery County is 2.7 People.
How Large is the Labor Force in Montgomery County?
There are 3,683 People in the Labor Forcein in Montgomery County.
What is the Percentage of People in the Labor Force in Montgomery County?
52.0% of People are in the Labor Force in Montgomery County.
What is the Unemployment Rate in Montgomery County?
Unemployment Rate in Montgomery County is 6.5%.