Lumpkin County, GA Map & Demographics
Lumpkin County Map
Lumpkin County Overview
$33,322
PER CAPITA INCOME
$81,180
AVG FAMILY INCOME
$67,592
AVG HOUSEHOLD INCOME
14.3%
WAGE / INCOME GAP [ % ]
85.7¢/ $1
WAGE / INCOME GAP [ $ ]
$8,370
FAMILY INCOME DEFICIT
0.50
INEQUALITY / GINI INDEX
33,405
TOTAL POPULATION
16,346
MALE POPULATION
17,059
FEMALE POPULATION
95.82
MALES / 100 FEMALES
104.36
FEMALES / 100 MALES
35.9
MEDIAN AGE
3.3
AVG FAMILY SIZE
2.7
AVG HOUSEHOLD SIZE
16,289
LABOR FORCE [ PEOPLE ]
57.2%
PERCENT IN LABOR FORCE
5.1%
UNEMPLOYMENT RATE
Lumpkin County Area Codes
Income in Lumpkin County
Income Overview in Lumpkin County
Per Capita Income in Lumpkin County is $33,322, while median incomes of families and households are $81,180 and $67,592 respectively.
| Characteristic | Number | Measure |
| Per Capita Income | 33,405 | $33,322 |
| Median Family Income | 7,696 | $81,180 |
| Mean Family Income | 7,696 | $105,482 |
| Median Household Income | 11,450 | $67,592 |
| Mean Household Income | 11,450 | $92,797 |
| Income Deficit | 7,696 | $8,370 |
| Wage / Income Gap (%) | 33,405 | 14.34% |
| Wage / Income Gap ($) | 33,405 | 85.66¢ per $1 |
| Gini / Inequality Index | 33,405 | 0.50 |
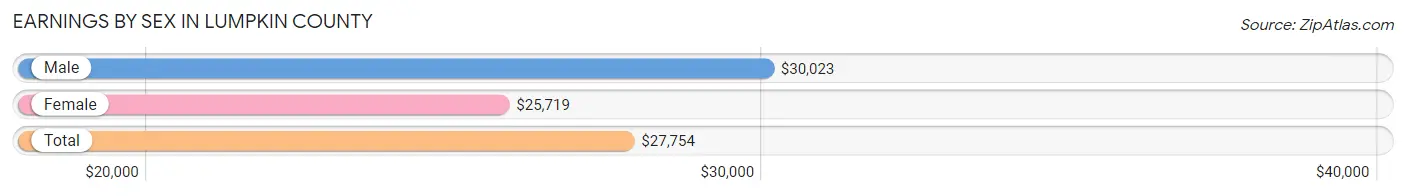
Earnings by Sex in Lumpkin County
Average Earnings in Lumpkin County are $27,754, $30,023 for men and $25,719 for women, a difference of 14.3%.
| Sex | Number | Average Earnings |
| Male | 9,882 (54.5%) | $30,023 |
| Female | 8,251 (45.5%) | $25,719 |
| Total | 18,133 (100.0%) | $27,754 |
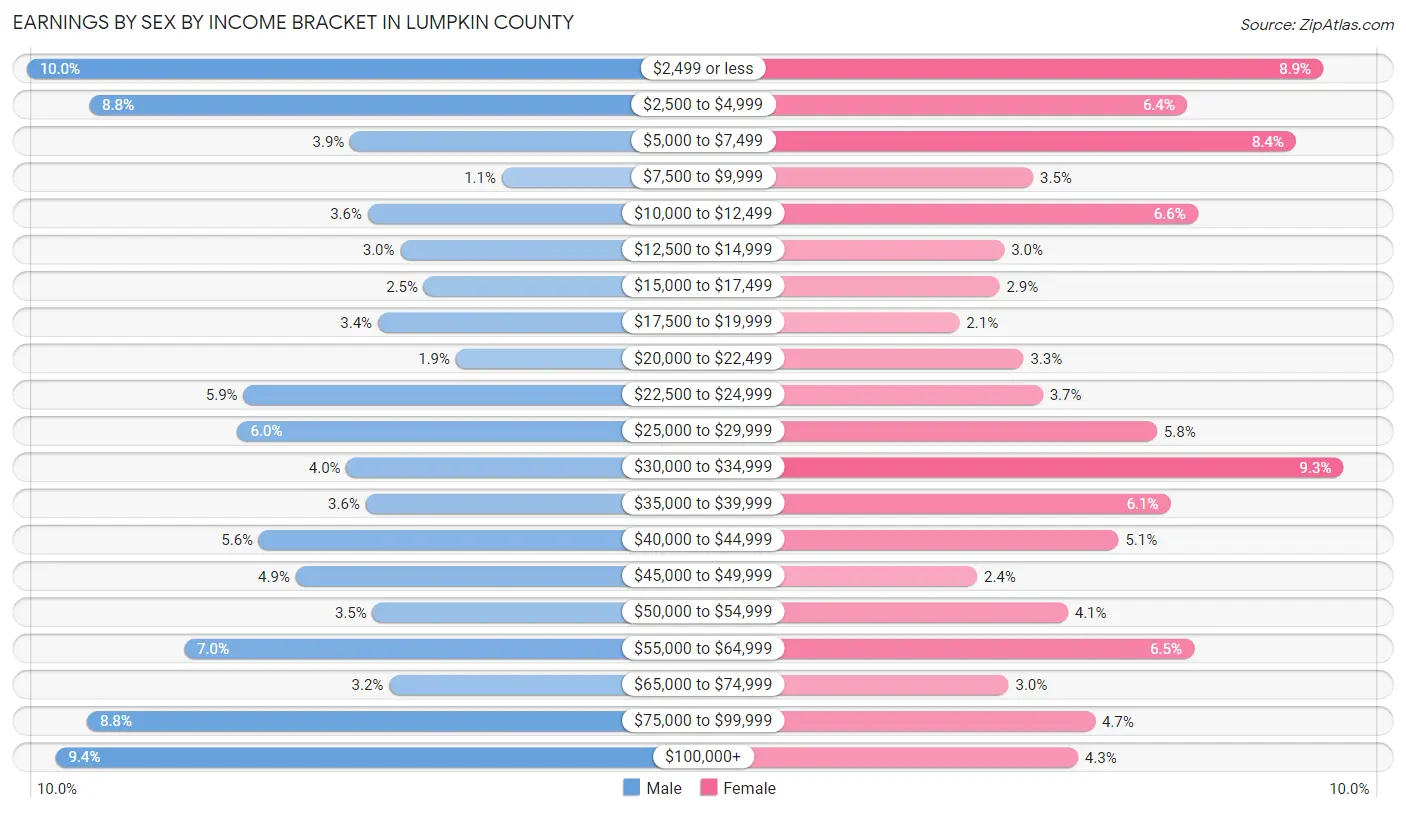
Earnings by Sex by Income Bracket in Lumpkin County
The most common earnings brackets in Lumpkin County are $2,499 or less for men (984 | 10.0%) and $30,000 to $34,999 for women (767 | 9.3%).
| Income | Male | Female |
| $2,499 or less | 984 (10.0%) | 736 (8.9%) |
| $2,500 to $4,999 | 869 (8.8%) | 526 (6.4%) |
| $5,000 to $7,499 | 385 (3.9%) | 694 (8.4%) |
| $7,500 to $9,999 | 105 (1.1%) | 288 (3.5%) |
| $10,000 to $12,499 | 353 (3.6%) | 542 (6.6%) |
| $12,500 to $14,999 | 293 (3.0%) | 243 (2.9%) |
| $15,000 to $17,499 | 249 (2.5%) | 236 (2.9%) |
| $17,500 to $19,999 | 334 (3.4%) | 174 (2.1%) |
| $20,000 to $22,499 | 190 (1.9%) | 273 (3.3%) |
| $22,500 to $24,999 | 583 (5.9%) | 303 (3.7%) |
| $25,000 to $29,999 | 594 (6.0%) | 479 (5.8%) |
| $30,000 to $34,999 | 392 (4.0%) | 767 (9.3%) |
| $35,000 to $39,999 | 357 (3.6%) | 500 (6.1%) |
| $40,000 to $44,999 | 554 (5.6%) | 420 (5.1%) |
| $45,000 to $49,999 | 486 (4.9%) | 201 (2.4%) |
| $50,000 to $54,999 | 344 (3.5%) | 342 (4.1%) |
| $55,000 to $64,999 | 693 (7.0%) | 536 (6.5%) |
| $65,000 to $74,999 | 313 (3.2%) | 250 (3.0%) |
| $75,000 to $99,999 | 873 (8.8%) | 384 (4.6%) |
| $100,000+ | 931 (9.4%) | 357 (4.3%) |
| Total | 9,882 (100.0%) | 8,251 (100.0%) |
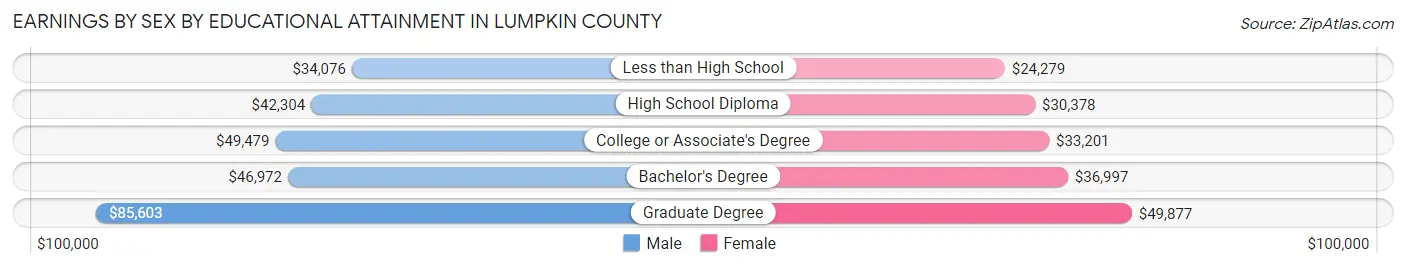
Earnings by Sex by Educational Attainment in Lumpkin County
Average earnings in Lumpkin County are $45,434 for men and $34,981 for women, a difference of 23.0%. Men with an educational attainment of graduate degree enjoy the highest average annual earnings of $85,603, while those with less than high school education earn the least with $34,076. Women with an educational attainment of graduate degree earn the most with the average annual earnings of $49,877, while those with less than high school education have the smallest earnings of $24,279.
| Educational Attainment | Male Income | Female Income |
| Less than High School | $34,076 | $24,279 |
| High School Diploma | $42,304 | $30,378 |
| College or Associate's Degree | $49,479 | $33,201 |
| Bachelor's Degree | $46,972 | $36,997 |
| Graduate Degree | $85,603 | $49,877 |
| Total | $45,434 | $34,981 |
Family Income in Lumpkin County
Family Income Brackets in Lumpkin County
According to the Lumpkin County family income data, there are 1,470 families falling into the $100,000 to $149,999 income range, which is the most common income bracket and makes up 19.1% of all families. Conversely, the less than $10,000 income bracket is the least frequent group with only 85 families (1.1%) belonging to this category.
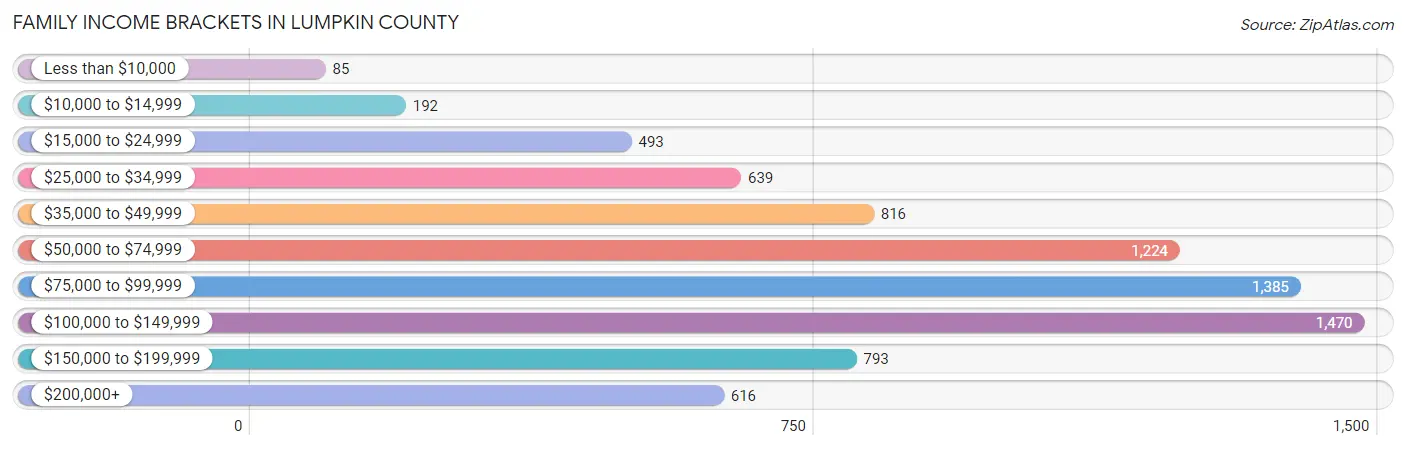
| Income Bracket | # Families | % Families |
| Less than $10,000 | 85 | 1.1% |
| $10,000 to $14,999 | 192 | 2.5% |
| $15,000 to $24,999 | 493 | 6.4% |
| $25,000 to $34,999 | 639 | 8.3% |
| $35,000 to $49,999 | 816 | 10.6% |
| $50,000 to $74,999 | 1,224 | 15.9% |
| $75,000 to $99,999 | 1,385 | 18.0% |
| $100,000 to $149,999 | 1,470 | 19.1% |
| $150,000 to $199,999 | 793 | 10.3% |
| $200,000+ | 616 | 8.0% |
Family Income by Famaliy Size in Lumpkin County
7+ person families (41 | 0.5%) account for the highest median family income in Lumpkin County with $101,285 per family, while 2-person families (3,896 | 50.6%) have the highest median income of $34,980 per family member.
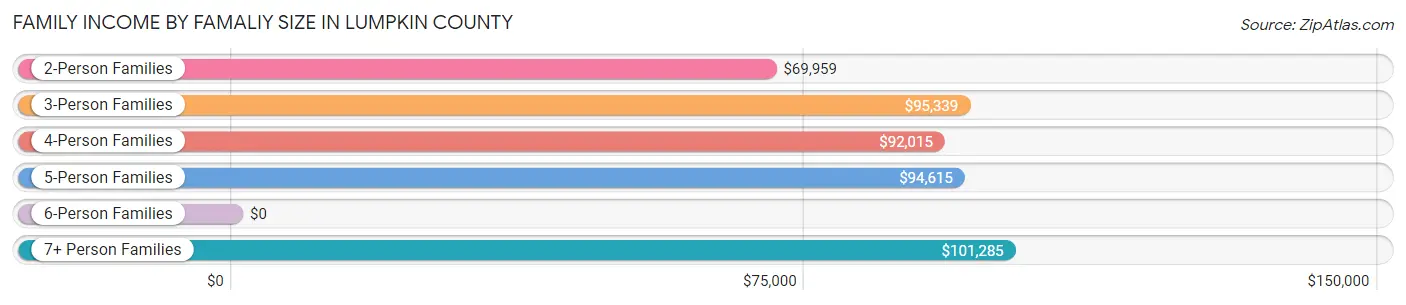
| Income Bracket | # Families | Median Income |
| 2-Person Families | 3,896 (50.6%) | $69,959 |
| 3-Person Families | 1,849 (24.0%) | $95,339 |
| 4-Person Families | 1,364 (17.7%) | $92,015 |
| 5-Person Families | 432 (5.6%) | $94,615 |
| 6-Person Families | 114 (1.5%) | $0 |
| 7+ Person Families | 41 (0.5%) | $101,285 |
| Total | 7,696 (100.0%) | $81,180 |
Family Income by Number of Earners in Lumpkin County
The median family income in Lumpkin County is $81,180, with families comprising 3+ earners (993) having the highest median family income of $132,807, while families with no earners (1,615) have the lowest median family income of $54,375, accounting for 12.9% and 21.0% of families, respectively.
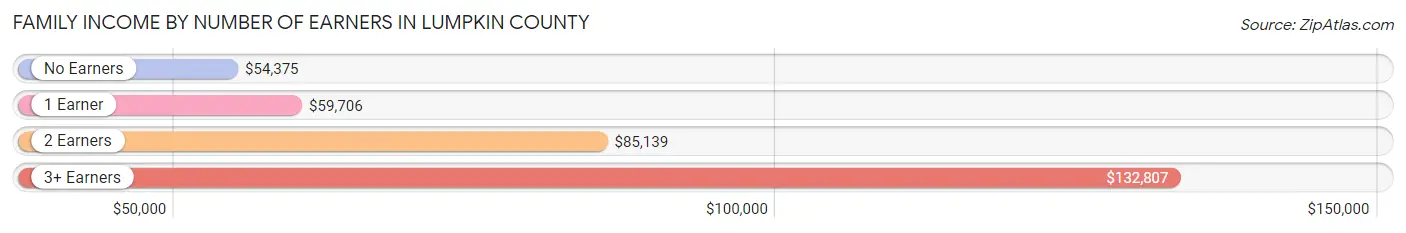
| Number of Earners | # Families | Median Income |
| No Earners | 1,615 (21.0%) | $54,375 |
| 1 Earner | 2,090 (27.2%) | $59,706 |
| 2 Earners | 2,998 (39.0%) | $85,139 |
| 3+ Earners | 993 (12.9%) | $132,807 |
| Total | 7,696 (100.0%) | $81,180 |
Household Income in Lumpkin County
Household Income Brackets in Lumpkin County
With 1,706 households falling in the category, the $75,000 to $99,999 income range is the most frequent in Lumpkin County, accounting for 14.9% of all households. In contrast, only 550 households (4.8%) fall into the less than $10,000 income bracket, making it the least populous group.
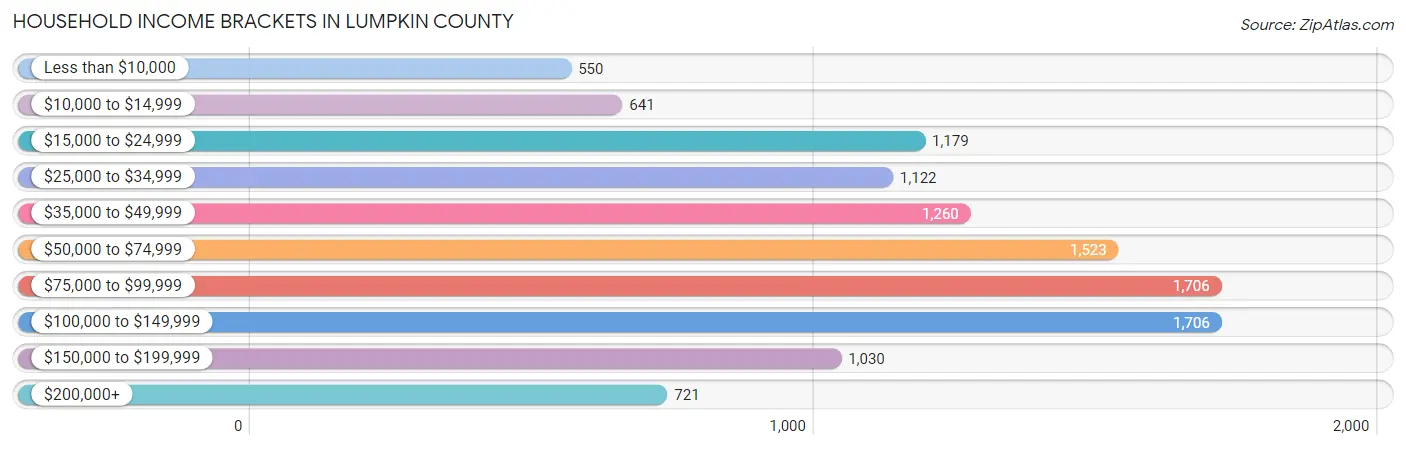
| Income Bracket | # Households | % Households |
| Less than $10,000 | 550 | 4.8% |
| $10,000 to $14,999 | 641 | 5.6% |
| $15,000 to $24,999 | 1,179 | 10.3% |
| $25,000 to $34,999 | 1,122 | 9.8% |
| $35,000 to $49,999 | 1,260 | 11.0% |
| $50,000 to $74,999 | 1,523 | 13.3% |
| $75,000 to $99,999 | 1,706 | 14.9% |
| $100,000 to $149,999 | 1,706 | 14.9% |
| $150,000 to $199,999 | 1,030 | 9.0% |
| $200,000+ | 721 | 6.3% |
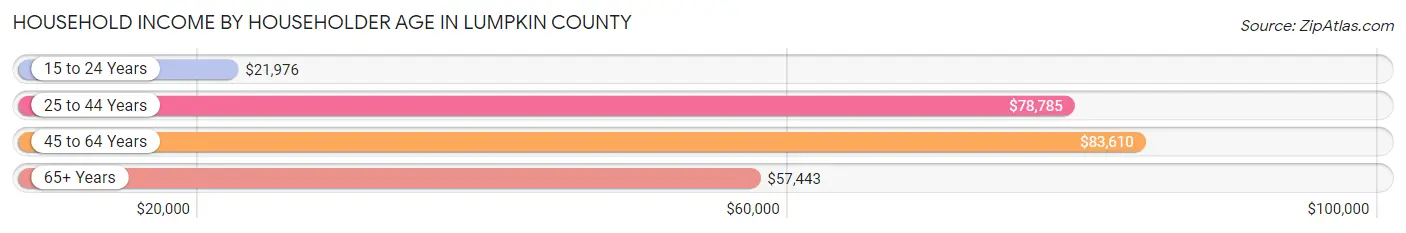
Household Income by Householder Age in Lumpkin County
The median household income in Lumpkin County is $67,592, with the highest median household income of $83,610 found in the 45 to 64 years age bracket for the primary householder. A total of 4,181 households (36.5%) fall into this category. Meanwhile, the 15 to 24 years age bracket for the primary householder has the lowest median household income of $21,976, with 1,011 households (8.8%) in this group.
| Income Bracket | # Households | Median Income |
| 15 to 24 Years | 1,011 (8.8%) | $21,976 |
| 25 to 44 Years | 2,637 (23.0%) | $78,785 |
| 45 to 64 Years | 4,181 (36.5%) | $83,610 |
| 65+ Years | 3,621 (31.6%) | $57,443 |
| Total | 11,450 (100.0%) | $67,592 |
Poverty in Lumpkin County
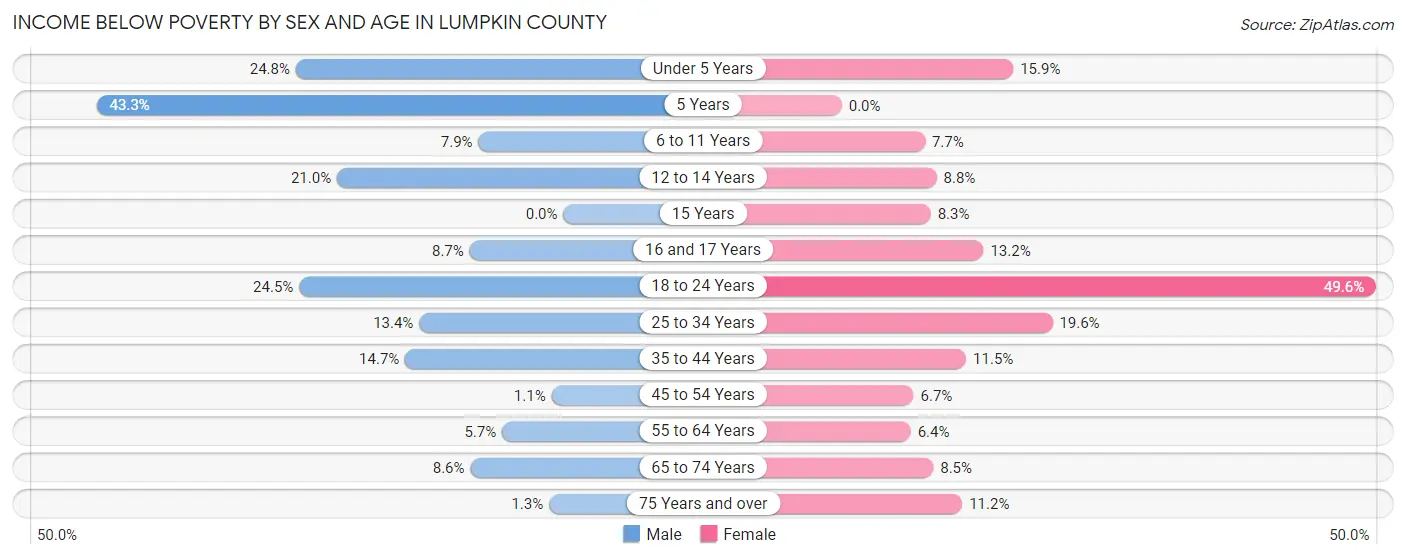
Income Below Poverty by Sex and Age in Lumpkin County
With 12.4% poverty level for males and 16.5% for females among the residents of Lumpkin County, 5 year old males and 18 to 24 year old females are the most vulnerable to poverty, with 52 males (43.3%) and 1,236 females (49.6%) in their respective age groups living below the poverty level.
| Age Bracket | Male | Female |
| Under 5 Years | 178 (24.8%) | 102 (15.9%) |
| 5 Years | 52 (43.3%) | 0 (0.0%) |
| 6 to 11 Years | 52 (7.9%) | 66 (7.7%) |
| 12 to 14 Years | 170 (21.0%) | 50 (8.8%) |
| 15 Years | 0 (0.0%) | 16 (8.3%) |
| 16 and 17 Years | 36 (8.7%) | 53 (13.2%) |
| 18 to 24 Years | 658 (24.5%) | 1,236 (49.6%) |
| 25 to 34 Years | 229 (13.4%) | 356 (19.6%) |
| 35 to 44 Years | 227 (14.7%) | 205 (11.5%) |
| 45 to 54 Years | 18 (1.1%) | 116 (6.7%) |
| 55 to 64 Years | 118 (5.7%) | 147 (6.4%) |
| 65 to 74 Years | 143 (8.6%) | 160 (8.5%) |
| 75 Years and over | 13 (1.3%) | 155 (11.2%) |
| Total | 1,894 (12.4%) | 2,662 (16.5%) |
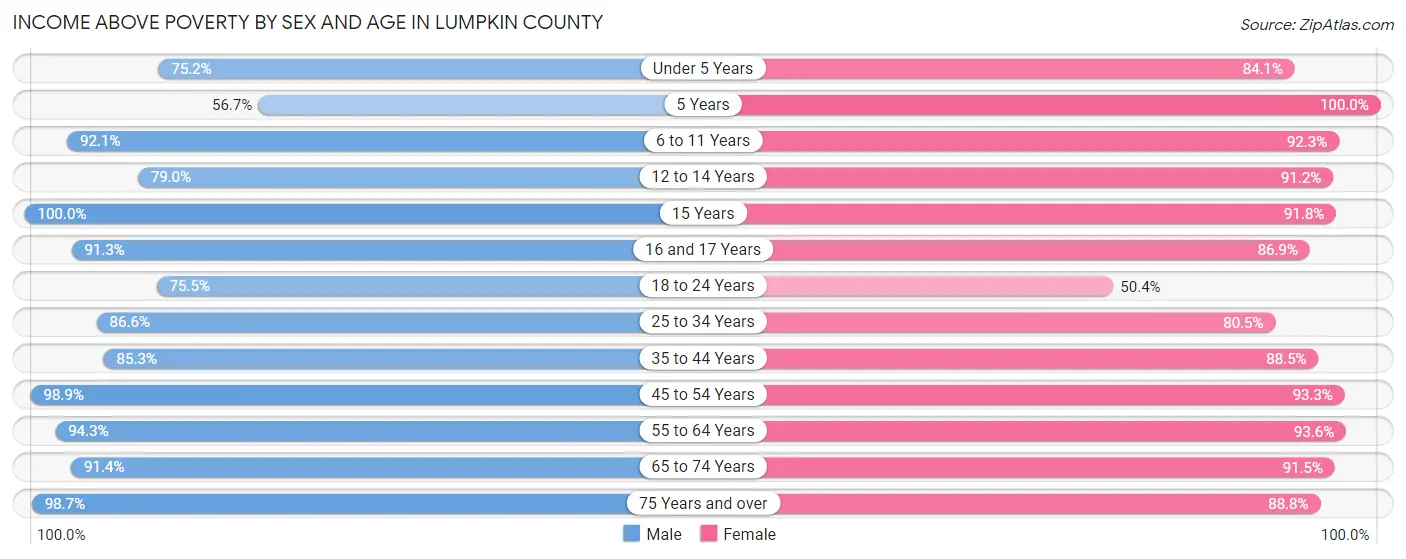
Income Above Poverty by Sex and Age in Lumpkin County
According to the poverty statistics in Lumpkin County, males aged 15 years and females aged 5 years are the age groups that are most secure financially, with 100.0% of males and 100.0% of females in these age groups living above the poverty line.
| Age Bracket | Male | Female |
| Under 5 Years | 539 (75.2%) | 539 (84.1%) |
| 5 Years | 68 (56.7%) | 58 (100.0%) |
| 6 to 11 Years | 608 (92.1%) | 789 (92.3%) |
| 12 to 14 Years | 639 (79.0%) | 518 (91.2%) |
| 15 Years | 233 (100.0%) | 178 (91.7%) |
| 16 and 17 Years | 378 (91.3%) | 350 (86.9%) |
| 18 to 24 Years | 2,026 (75.5%) | 1,257 (50.4%) |
| 25 to 34 Years | 1,482 (86.6%) | 1,465 (80.4%) |
| 35 to 44 Years | 1,319 (85.3%) | 1,571 (88.5%) |
| 45 to 54 Years | 1,611 (98.9%) | 1,625 (93.3%) |
| 55 to 64 Years | 1,957 (94.3%) | 2,150 (93.6%) |
| 65 to 74 Years | 1,514 (91.4%) | 1,725 (91.5%) |
| 75 Years and over | 965 (98.7%) | 1,232 (88.8%) |
| Total | 13,339 (87.6%) | 13,457 (83.5%) |
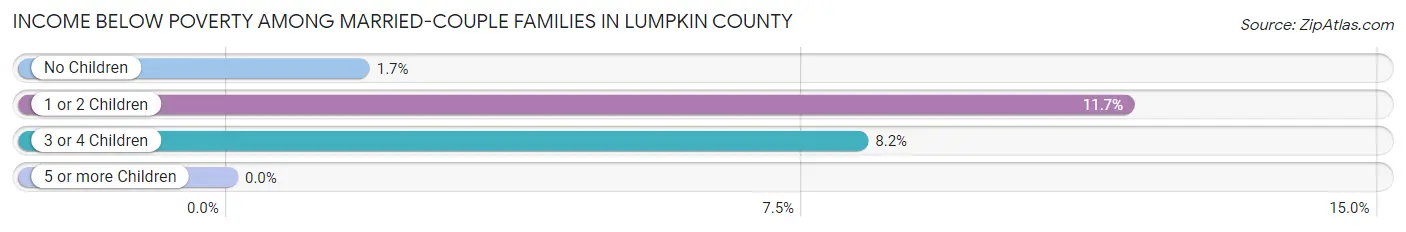
Income Below Poverty Among Married-Couple Families in Lumpkin County
The poverty statistics for married-couple families in Lumpkin County show that 5.3% or 353 of the total 6,676 families live below the poverty line. Families with 1 or 2 children have the highest poverty rate of 11.7%, comprising of 254 families. On the other hand, families with no children have the lowest poverty rate of 1.7%, which includes 72 families.
| Children | Above Poverty | Below Poverty |
| No Children | 4,107 (98.3%) | 72 (1.7%) |
| 1 or 2 Children | 1,915 (88.3%) | 254 (11.7%) |
| 3 or 4 Children | 301 (91.8%) | 27 (8.2%) |
| 5 or more Children | 0 (0.0%) | 0 (0.0%) |
| Total | 6,323 (94.7%) | 353 (5.3%) |
Income Below Poverty Among Single-Parent Households in Lumpkin County
According to the poverty data in Lumpkin County, 18.4% or 64 single-father households and 17.2% or 116 single-mother households are living below the poverty line. Among single-father households, those with no children have the highest poverty rate, with 49 households (27.7%) experiencing poverty. Likewise, among single-mother households, those with 1 or 2 children have the highest poverty rate, with 104 households (34.3%) falling below the poverty line.
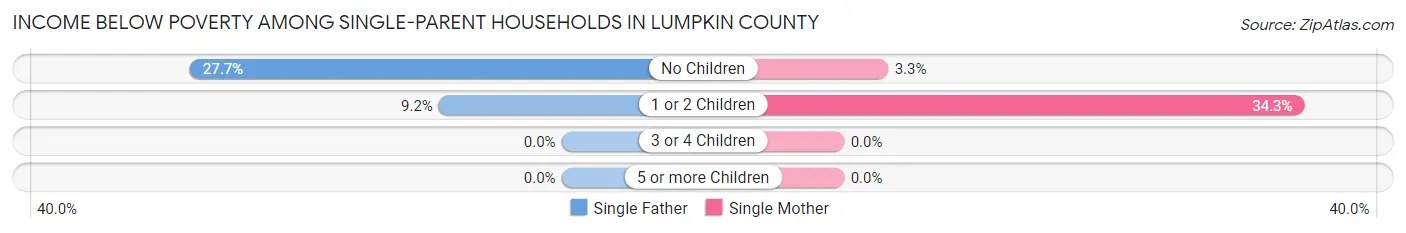
| Children | Single Father | Single Mother |
| No Children | 49 (27.7%) | 12 (3.3%) |
| 1 or 2 Children | 15 (9.1%) | 104 (34.3%) |
| 3 or 4 Children | 0 (0.0%) | 0 (0.0%) |
| 5 or more Children | 0 (0.0%) | 0 (0.0%) |
| Total | 64 (18.4%) | 116 (17.2%) |
Income Below Poverty Among Married-Couple vs Single-Parent Households in Lumpkin County
The poverty data for Lumpkin County shows that 353 of the married-couple family households (5.3%) and 180 of the single-parent households (17.6%) are living below the poverty level. Within the married-couple family households, those with 1 or 2 children have the highest poverty rate, with 254 households (11.7%) falling below the poverty line. Among the single-parent households, those with 1 or 2 children have the highest poverty rate, with 119 household (25.5%) living below poverty.
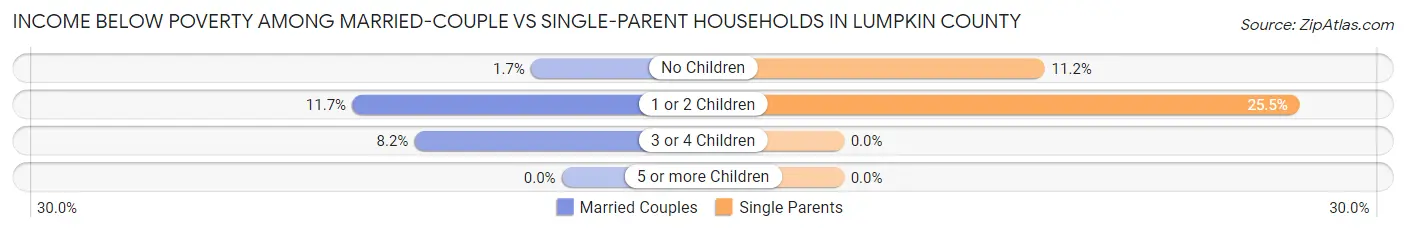
| Children | Married-Couple Families | Single-Parent Households |
| No Children | 72 (1.7%) | 61 (11.2%) |
| 1 or 2 Children | 254 (11.7%) | 119 (25.5%) |
| 3 or 4 Children | 27 (8.2%) | 0 (0.0%) |
| 5 or more Children | 0 (0.0%) | 0 (0.0%) |
| Total | 353 (5.3%) | 180 (17.6%) |
Race in Lumpkin County
The most populous races in Lumpkin County are White / Caucasian (30,782 | 92.1%), Hispanic or Latino (1,736 | 5.2%), and Two or more Races (1,065 | 3.2%).
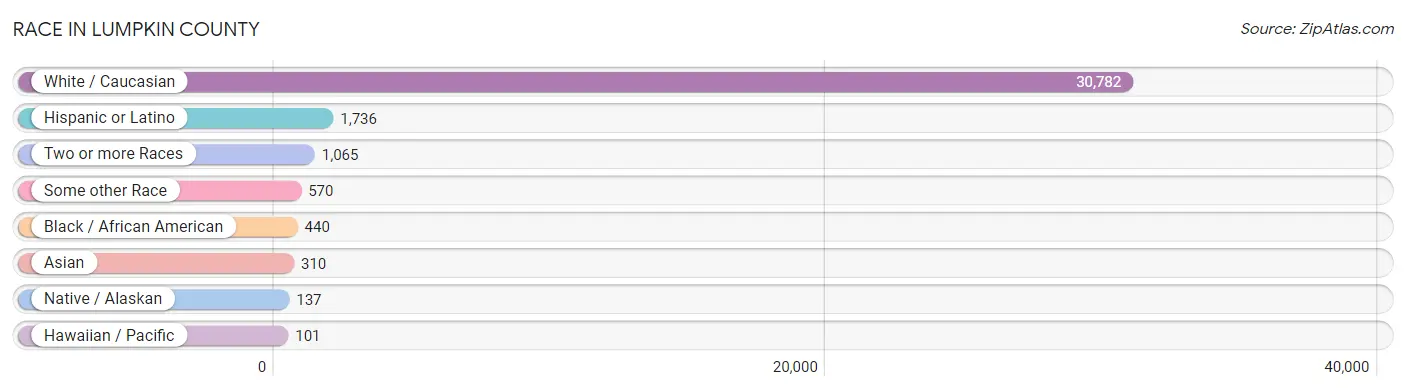
| Race | # Population | % Population |
| Asian | 310 | 0.9% |
| Black / African American | 440 | 1.3% |
| Hawaiian / Pacific | 101 | 0.3% |
| Hispanic or Latino | 1,736 | 5.2% |
| Native / Alaskan | 137 | 0.4% |
| White / Caucasian | 30,782 | 92.1% |
| Two or more Races | 1,065 | 3.2% |
| Some other Race | 570 | 1.7% |
| Total | 33,405 | 100.0% |
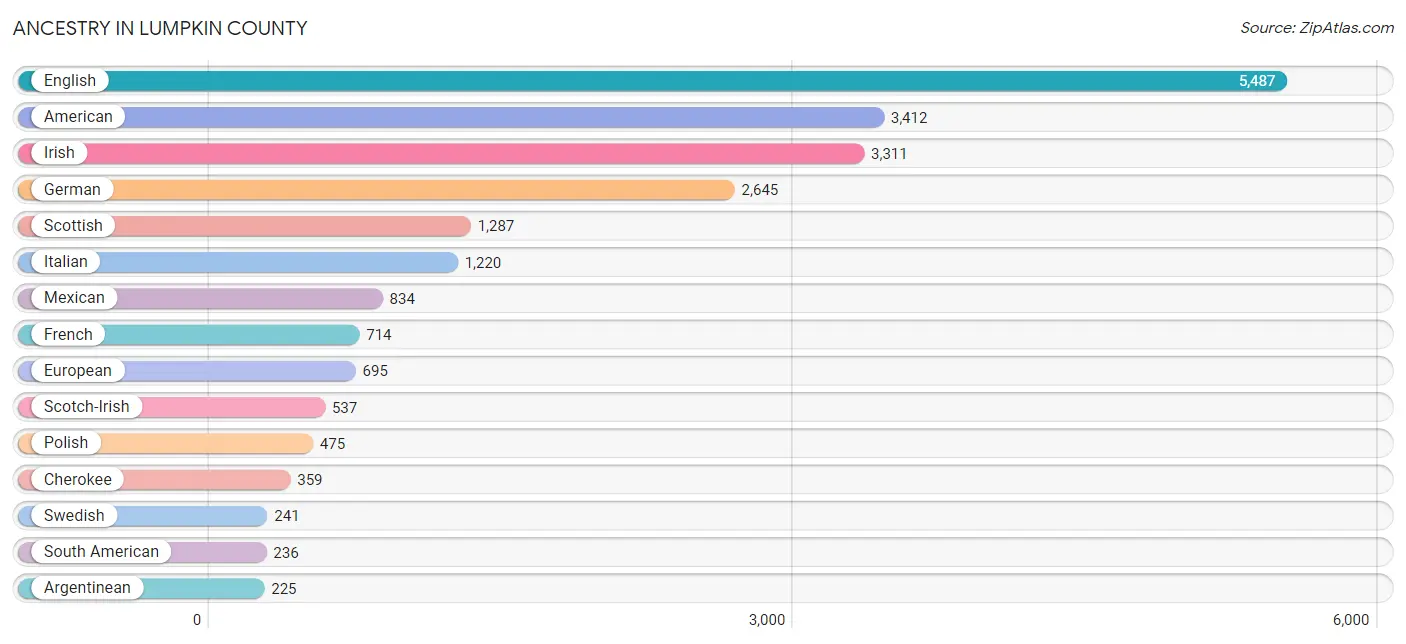
Ancestry in Lumpkin County
The most populous ancestries reported in Lumpkin County are English (5,487 | 16.4%), American (3,412 | 10.2%), Irish (3,311 | 9.9%), German (2,645 | 7.9%), and Scottish (1,287 | 3.8%), together accounting for 48.3% of all Lumpkin County residents.
| Ancestry | # Population | % Population |
| American | 3,412 | 10.2% |
| Arab | 219 | 0.7% |
| Argentinean | 225 | 0.7% |
| Australian | 2 | 0.0% |
| Austrian | 78 | 0.2% |
| Bhutanese | 171 | 0.5% |
| Blackfeet | 4 | 0.0% |
| Bolivian | 1 | 0.0% |
| British | 224 | 0.7% |
| Burmese | 24 | 0.1% |
| Cajun | 2 | 0.0% |
| Canadian | 36 | 0.1% |
| Central American | 190 | 0.6% |
| Central American Indian | 29 | 0.1% |
| Cherokee | 359 | 1.1% |
| Colombian | 8 | 0.0% |
| Creek | 6 | 0.0% |
| Croatian | 2 | 0.0% |
| Crow | 59 | 0.2% |
| Cuban | 41 | 0.1% |
| Czech | 1 | 0.0% |
| Czechoslovakian | 1 | 0.0% |
| Danish | 118 | 0.4% |
| Dominican | 3 | 0.0% |
| Dutch | 151 | 0.4% |
| Eastern European | 42 | 0.1% |
| Egyptian | 203 | 0.6% |
| English | 5,487 | 16.4% |
| European | 695 | 2.1% |
| Finnish | 15 | 0.0% |
| French | 714 | 2.1% |
| French Canadian | 35 | 0.1% |
| German | 2,645 | 7.9% |
| Greek | 57 | 0.2% |
| Guatemalan | 26 | 0.1% |
| Haitian | 5 | 0.0% |
| Honduran | 4 | 0.0% |
| Hungarian | 26 | 0.1% |
| Indian (Asian) | 178 | 0.5% |
| Inupiat | 1 | 0.0% |
| Irish | 3,311 | 9.9% |
| Israeli | 13 | 0.0% |
| Italian | 1,220 | 3.6% |
| Jamaican | 20 | 0.1% |
| Korean | 5 | 0.0% |
| Lebanese | 16 | 0.1% |
| Lithuanian | 50 | 0.2% |
| Mexican | 834 | 2.5% |
| Native Hawaiian | 90 | 0.3% |
| Northern European | 136 | 0.4% |
| Norwegian | 165 | 0.5% |
| Pakistani | 3 | 0.0% |
| Panamanian | 160 | 0.5% |
| Polish | 475 | 1.4% |
| Portuguese | 35 | 0.1% |
| Puerto Rican | 167 | 0.5% |
| Russian | 154 | 0.5% |
| Scandinavian | 193 | 0.6% |
| Scotch-Irish | 537 | 1.6% |
| Scottish | 1,287 | 3.8% |
| Seminole | 4 | 0.0% |
| Sioux | 2 | 0.0% |
| Slovak | 25 | 0.1% |
| South African | 4 | 0.0% |
| South American | 236 | 0.7% |
| Spaniard | 41 | 0.1% |
| Sri Lankan | 12 | 0.0% |
| Subsaharan African | 4 | 0.0% |
| Swedish | 241 | 0.7% |
| Swiss | 76 | 0.2% |
| Thai | 4 | 0.0% |
| Ukrainian | 79 | 0.2% |
| Welsh | 217 | 0.6% |
| West Indian | 2 | 0.0% |
| Yugoslavian | 18 | 0.1% |
| Yup'ik | 13 | 0.0% | View All 76 Rows |
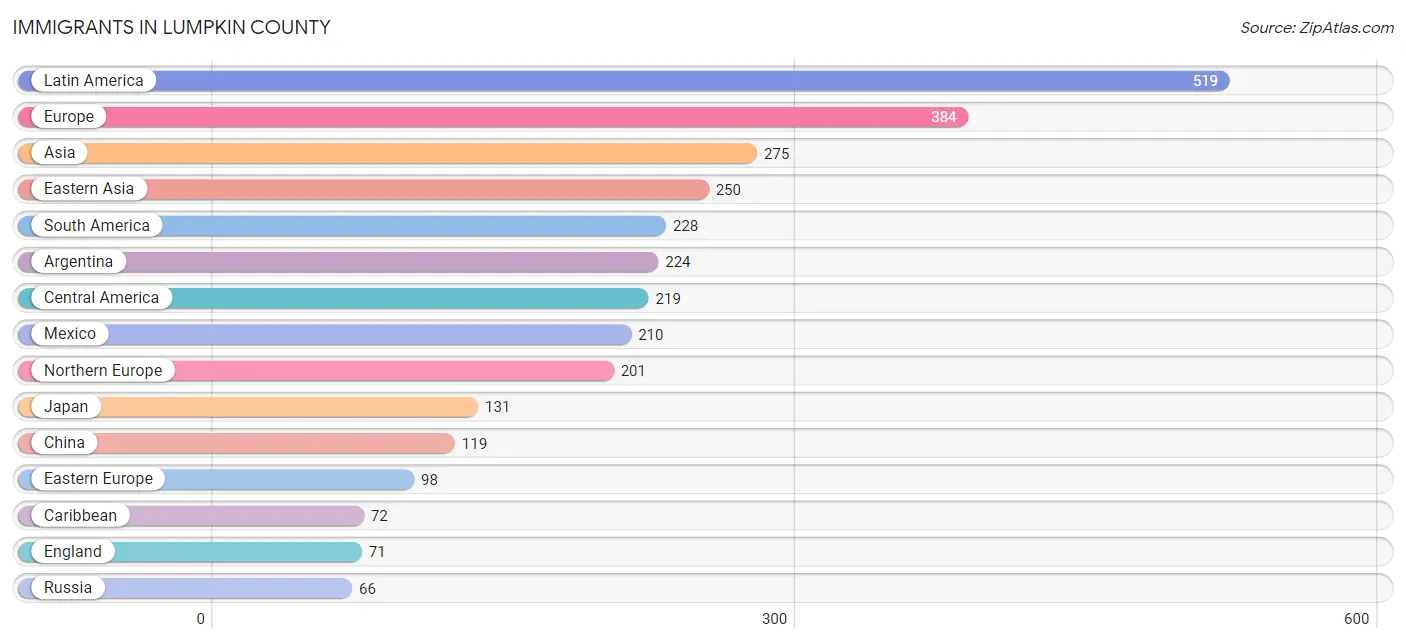
Immigrants in Lumpkin County
The most numerous immigrant groups reported in Lumpkin County came from Latin America (519 | 1.5%), Europe (384 | 1.1%), Asia (275 | 0.8%), Eastern Asia (250 | 0.7%), and South America (228 | 0.7%), together accounting for 5.0% of all Lumpkin County residents.
| Immigration Origin | # Population | % Population |
| Africa | 33 | 0.1% |
| Argentina | 224 | 0.7% |
| Asia | 275 | 0.8% |
| Australia | 3 | 0.0% |
| Barbados | 39 | 0.1% |
| Canada | 18 | 0.1% |
| Caribbean | 72 | 0.2% |
| Central America | 219 | 0.7% |
| China | 119 | 0.4% |
| Colombia | 4 | 0.0% |
| Cuba | 29 | 0.1% |
| Denmark | 11 | 0.0% |
| Eastern Asia | 250 | 0.7% |
| Eastern Europe | 98 | 0.3% |
| Egypt | 29 | 0.1% |
| El Salvador | 5 | 0.0% |
| England | 71 | 0.2% |
| Europe | 384 | 1.1% |
| Fiji | 58 | 0.2% |
| France | 3 | 0.0% |
| Germany | 17 | 0.1% |
| Honduras | 4 | 0.0% |
| Hong Kong | 14 | 0.0% |
| Israel | 2 | 0.0% |
| Italy | 59 | 0.2% |
| Jamaica | 4 | 0.0% |
| Japan | 131 | 0.4% |
| Latin America | 519 | 1.5% |
| Mexico | 210 | 0.6% |
| Netherlands | 6 | 0.0% |
| Northern Africa | 29 | 0.1% |
| Northern Europe | 201 | 0.6% |
| Oceania | 61 | 0.2% |
| Philippines | 4 | 0.0% |
| Romania | 32 | 0.1% |
| Russia | 66 | 0.2% |
| South Africa | 4 | 0.0% |
| South America | 228 | 0.7% |
| South Central Asia | 1 | 0.0% |
| South Eastern Asia | 6 | 0.0% |
| Southern Europe | 59 | 0.2% |
| Taiwan | 1 | 0.0% |
| Thailand | 2 | 0.0% |
| Turkey | 16 | 0.1% |
| Western Asia | 18 | 0.1% |
| Western Europe | 26 | 0.1% | View All 46 Rows |
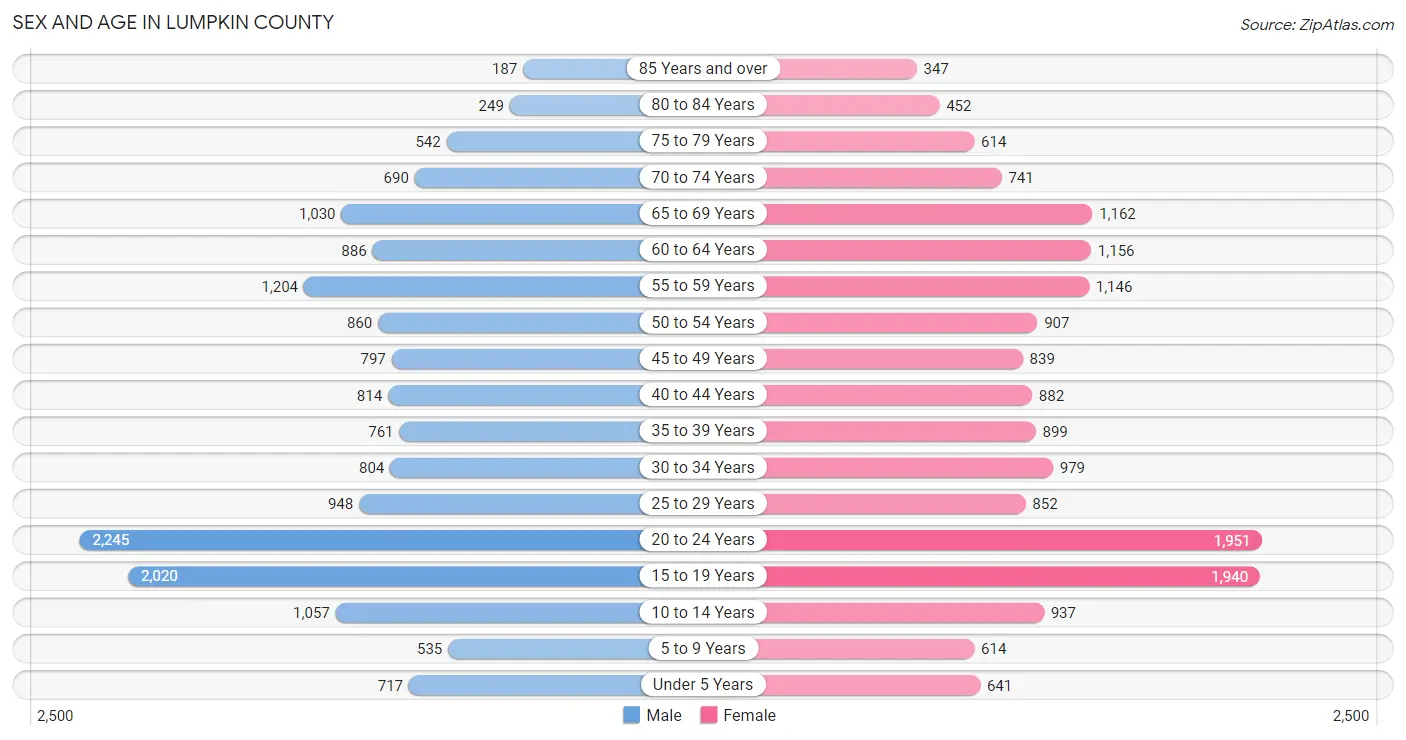
Sex and Age in Lumpkin County
Sex and Age in Lumpkin County
The most populous age groups in Lumpkin County are 20 to 24 Years (2,245 | 13.7%) for men and 20 to 24 Years (1,951 | 11.4%) for women.
| Age Bracket | Male | Female |
| Under 5 Years | 717 (4.4%) | 641 (3.8%) |
| 5 to 9 Years | 535 (3.3%) | 614 (3.6%) |
| 10 to 14 Years | 1,057 (6.5%) | 937 (5.5%) |
| 15 to 19 Years | 2,020 (12.4%) | 1,940 (11.4%) |
| 20 to 24 Years | 2,245 (13.7%) | 1,951 (11.4%) |
| 25 to 29 Years | 948 (5.8%) | 852 (5.0%) |
| 30 to 34 Years | 804 (4.9%) | 979 (5.7%) |
| 35 to 39 Years | 761 (4.7%) | 899 (5.3%) |
| 40 to 44 Years | 814 (5.0%) | 882 (5.2%) |
| 45 to 49 Years | 797 (4.9%) | 839 (4.9%) |
| 50 to 54 Years | 860 (5.3%) | 907 (5.3%) |
| 55 to 59 Years | 1,204 (7.4%) | 1,146 (6.7%) |
| 60 to 64 Years | 886 (5.4%) | 1,156 (6.8%) |
| 65 to 69 Years | 1,030 (6.3%) | 1,162 (6.8%) |
| 70 to 74 Years | 690 (4.2%) | 741 (4.3%) |
| 75 to 79 Years | 542 (3.3%) | 614 (3.6%) |
| 80 to 84 Years | 249 (1.5%) | 452 (2.6%) |
| 85 Years and over | 187 (1.1%) | 347 (2.0%) |
| Total | 16,346 (100.0%) | 17,059 (100.0%) |
Families and Households in Lumpkin County
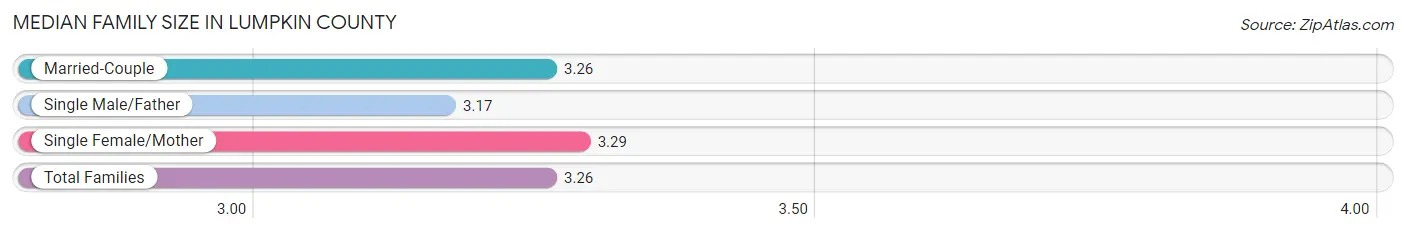
Median Family Size in Lumpkin County
The median family size in Lumpkin County is 3.26 persons per family, with single female/mother families (673 | 8.7%) accounting for the largest median family size of 3.29 persons per family. On the other hand, single male/father families (347 | 4.5%) represent the smallest median family size with 3.17 persons per family.
| Family Type | # Families | Family Size |
| Married-Couple | 6,676 (86.8%) | 3.26 |
| Single Male/Father | 347 (4.5%) | 3.17 |
| Single Female/Mother | 673 (8.7%) | 3.29 |
| Total Families | 7,696 (100.0%) | 3.26 |
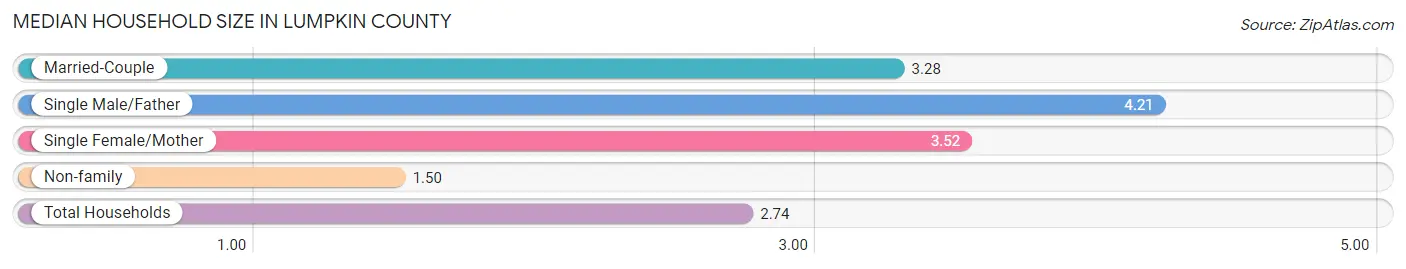
Median Household Size in Lumpkin County
The median household size in Lumpkin County is 2.74 persons per household, with single male/father households (347 | 3.0%) accounting for the largest median household size of 4.21 persons per household. non-family households (3,754 | 32.8%) represent the smallest median household size with 1.50 persons per household.
| Household Type | # Households | Household Size |
| Married-Couple | 6,676 (58.3%) | 3.28 |
| Single Male/Father | 347 (3.0%) | 4.21 |
| Single Female/Mother | 673 (5.9%) | 3.52 |
| Non-family | 3,754 (32.8%) | 1.50 |
| Total Households | 11,450 (100.0%) | 2.74 |
Household Size by Marriage Status in Lumpkin County
Out of a total of 11,450 households in Lumpkin County, 7,696 (67.2%) are family households, while 3,754 (32.8%) are nonfamily households. The most numerous type of family households are 2-person households, comprising 3,735, and the most common type of nonfamily households are 1-person households, comprising 2,814.
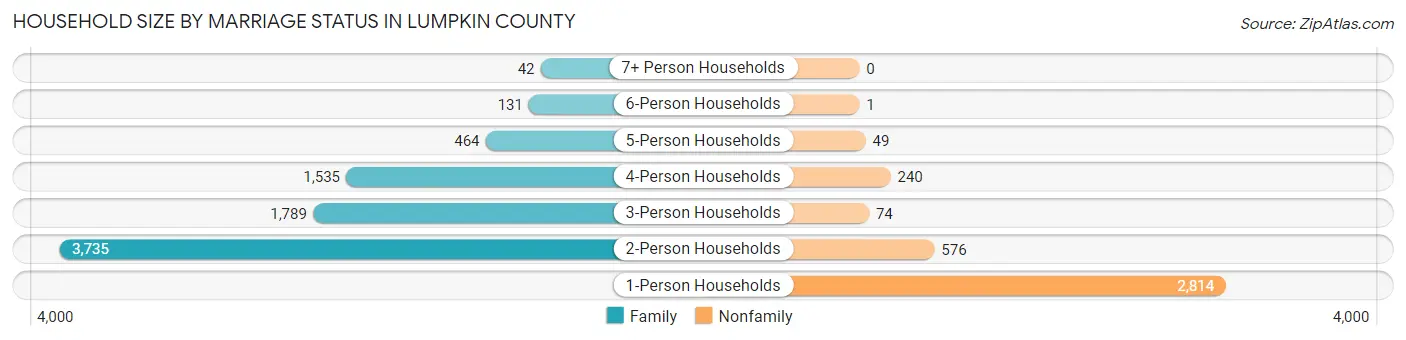
| Household Size | Family Households | Nonfamily Households |
| 1-Person Households | - | 2,814 (24.6%) |
| 2-Person Households | 3,735 (32.6%) | 576 (5.0%) |
| 3-Person Households | 1,789 (15.6%) | 74 (0.6%) |
| 4-Person Households | 1,535 (13.4%) | 240 (2.1%) |
| 5-Person Households | 464 (4.1%) | 49 (0.4%) |
| 6-Person Households | 131 (1.1%) | 1 (0.0%) |
| 7+ Person Households | 42 (0.4%) | 0 (0.0%) |
| Total | 7,696 (67.2%) | 3,754 (32.8%) |
Female Fertility in Lumpkin County
Fertility by Age in Lumpkin County
Average fertility rate in Lumpkin County is 65.0 births per 1,000 women. Women in the age bracket of 20 to 34 years have the highest fertility rate with 115.0 births per 1,000 women. Women in the age bracket of 20 to 34 years acount for 77.6% of all women with births.
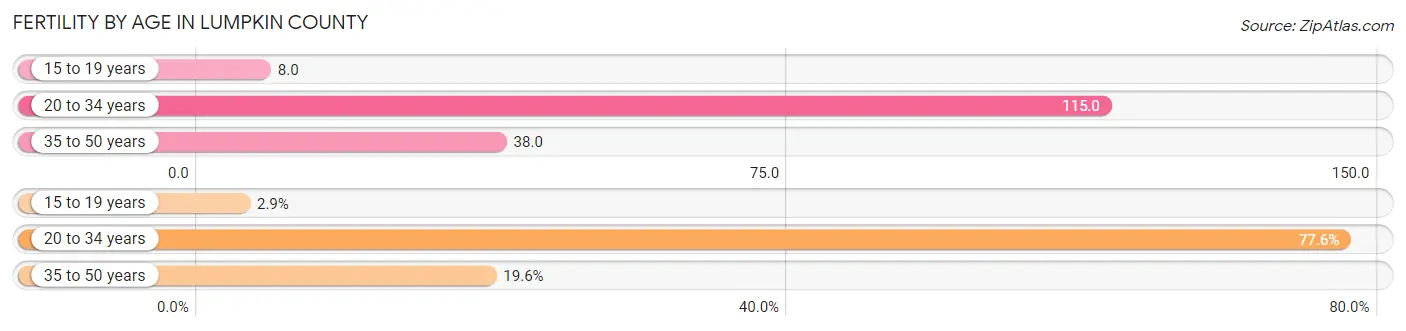
| Age Bracket | Women with Births | Births / 1,000 Women |
| 15 to 19 years | 16 (2.9%) | 8.0 |
| 20 to 34 years | 436 (77.6%) | 115.0 |
| 35 to 50 years | 110 (19.6%) | 38.0 |
| Total | 562 (100.0%) | 65.0 |
Fertility by Age by Marriage Status in Lumpkin County
86.1% of women with births (562) in Lumpkin County are married. The highest percentage of unmarried women with births falls into 15 to 19 years age bracket with 100.0% of them unmarried at the time of birth, while the lowest percentage of unmarried women with births belong to 35 to 50 years age bracket with 0.0% of them unmarried.
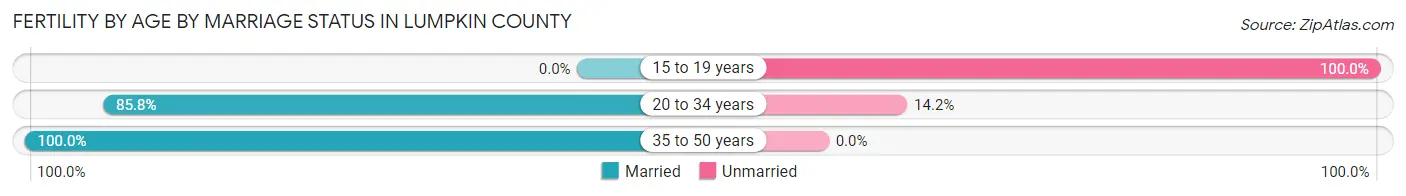
| Age Bracket | Married | Unmarried |
| 15 to 19 years | 0 (0.0%) | 16 (100.0%) |
| 20 to 34 years | 374 (85.8%) | 62 (14.2%) |
| 35 to 50 years | 110 (100.0%) | 0 (0.0%) |
| Total | 484 (86.1%) | 78 (13.9%) |
Fertility by Education in Lumpkin County
Average fertility rate in Lumpkin County is 65.0 births per 1,000 women. Women with the education attainment of bachelor's degree have the highest fertility rate of 224.0 births per 1,000 women, while women with the education attainment of less than high school have the lowest fertility at 21.0 births per 1,000 women. Women with the education attainment of bachelor's degree represent 55.0% of all women with births.
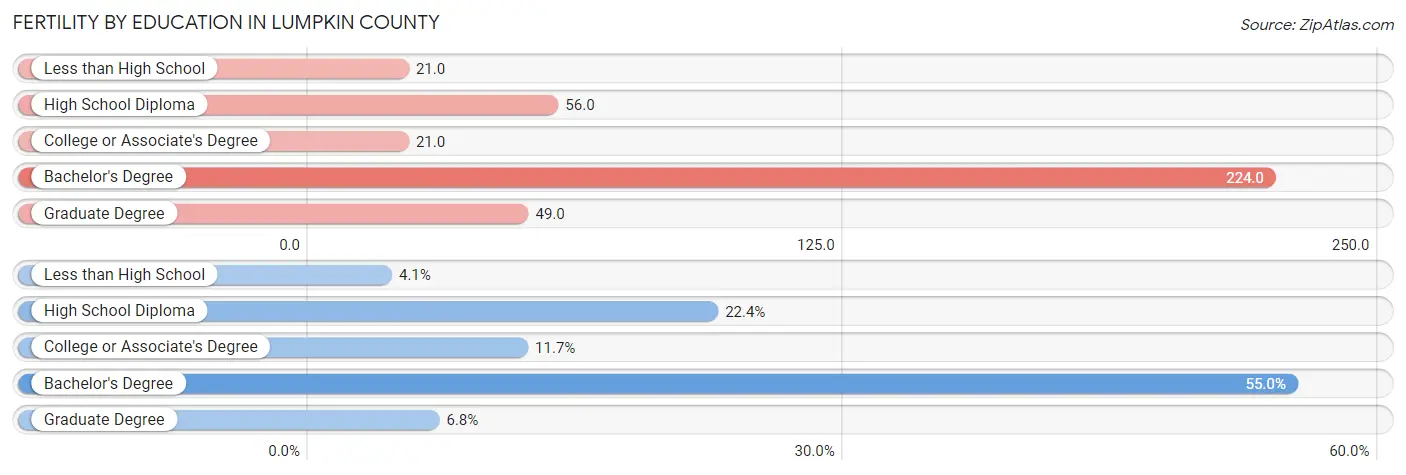
| Educational Attainment | Women with Births | Births / 1,000 Women |
| Less than High School | 23 (4.1%) | 21.0 |
| High School Diploma | 126 (22.4%) | 56.0 |
| College or Associate's Degree | 66 (11.7%) | 21.0 |
| Bachelor's Degree | 309 (55.0%) | 224.0 |
| Graduate Degree | 38 (6.8%) | 49.0 |
| Total | 562 (100.0%) | 65.0 |
Fertility by Education by Marriage Status in Lumpkin County
13.9% of women with births in Lumpkin County are unmarried. Women with the educational attainment of less than high school are most likely to be married with 100.0% of them married at childbirth, while women with the educational attainment of high school diploma are least likely to be married with 57.9% of them unmarried at childbirth.
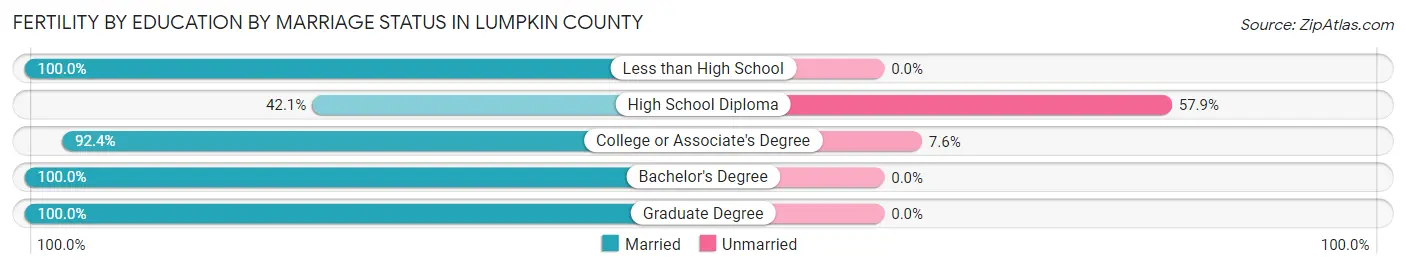
| Educational Attainment | Married | Unmarried |
| Less than High School | 23 (100.0%) | 0 (0.0%) |
| High School Diploma | 53 (42.1%) | 73 (57.9%) |
| College or Associate's Degree | 61 (92.4%) | 5 (7.6%) |
| Bachelor's Degree | 309 (100.0%) | 0 (0.0%) |
| Graduate Degree | 38 (100.0%) | 0 (0.0%) |
| Total | 484 (86.1%) | 78 (13.9%) |
Employment Characteristics in Lumpkin County
Employment by Class of Employer in Lumpkin County
Among the 15,172 employed individuals in Lumpkin County, private company employees (9,191 | 60.6%), local government employees (1,574 | 10.4%), and not-for-profit organizations (1,307 | 8.6%) make up the most common classes of employment.
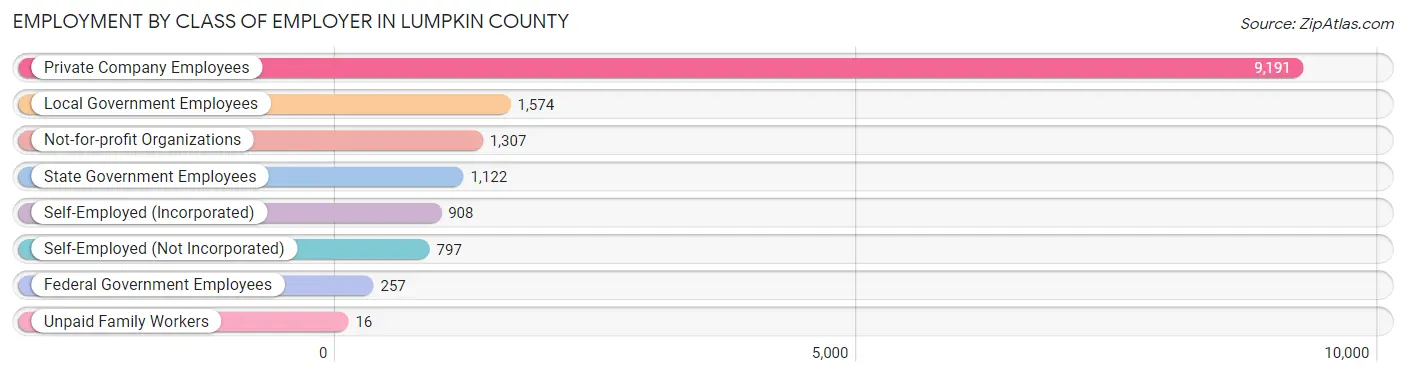
| Employer Class | # Employees | % Employees |
| Private Company Employees | 9,191 | 60.6% |
| Self-Employed (Incorporated) | 908 | 6.0% |
| Self-Employed (Not Incorporated) | 797 | 5.2% |
| Not-for-profit Organizations | 1,307 | 8.6% |
| Local Government Employees | 1,574 | 10.4% |
| State Government Employees | 1,122 | 7.4% |
| Federal Government Employees | 257 | 1.7% |
| Unpaid Family Workers | 16 | 0.1% |
| Total | 15,172 | 100.0% |
Employment Status by Age in Lumpkin County
According to the labor force statistics for Lumpkin County, out of the total population over 16 years of age (28,477), 57.2% or 16,289 individuals are in the labor force, with 5.1% or 831 of them unemployed. The age group with the highest labor force participation rate is 45 to 54 years, with 86.7% or 2,950 individuals in the labor force. Within the labor force, the 75 years and over age range has the highest percentage of unemployed individuals, with 11.0% or 18 of them being unemployed.
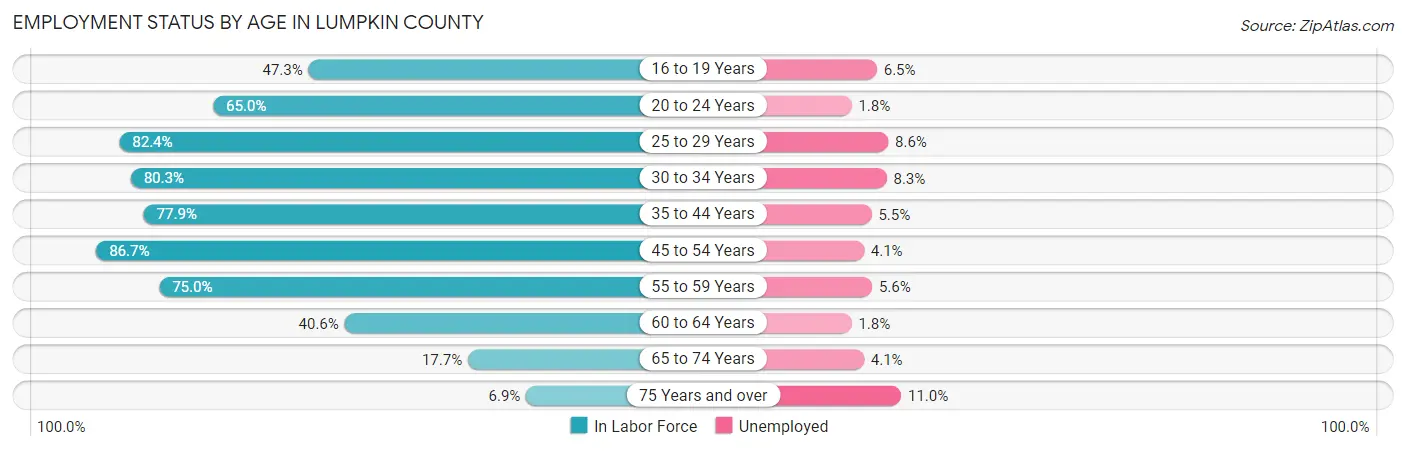
| Age Bracket | In Labor Force | Unemployed |
| 16 to 19 Years | 1,671 (47.3%) | 109 (6.5%) |
| 20 to 24 Years | 2,727 (65.0%) | 49 (1.8%) |
| 25 to 29 Years | 1,483 (82.4%) | 128 (8.6%) |
| 30 to 34 Years | 1,432 (80.3%) | 119 (8.3%) |
| 35 to 44 Years | 2,614 (77.9%) | 144 (5.5%) |
| 45 to 54 Years | 2,950 (86.7%) | 121 (4.1%) |
| 55 to 59 Years | 1,762 (75.0%) | 99 (5.6%) |
| 60 to 64 Years | 829 (40.6%) | 15 (1.8%) |
| 65 to 74 Years | 641 (17.7%) | 26 (4.1%) |
| 75 Years and over | 165 (6.9%) | 18 (11.0%) |
| Total | 16,289 (57.2%) | 831 (5.1%) |
Employment Status by Educational Attainment in Lumpkin County
According to labor force statistics for Lumpkin County, 75.2% of individuals (11,080) out of the total population between 25 and 64 years of age (14,734) are in the labor force, with 5.6% or 620 of them being unemployed. The group with the highest labor force participation rate are those with the educational attainment of bachelor's degree or higher, with 84.2% or 3,953 individuals in the labor force. Within the labor force, individuals with less than high school education have the highest percentage of unemployment, with 16.8% or 218 of them being unemployed.
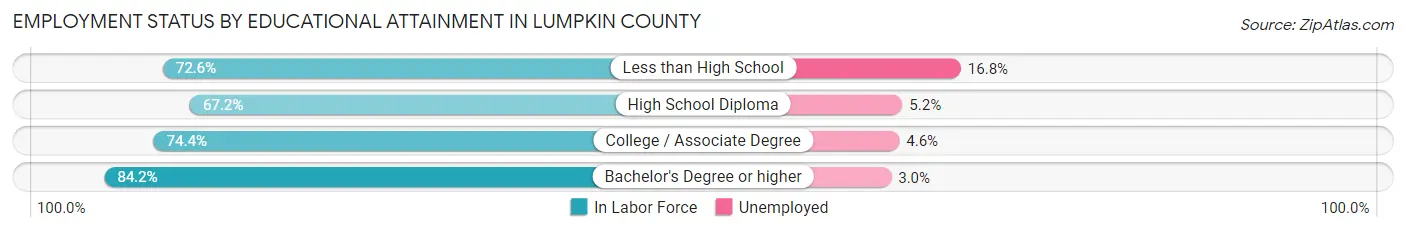
| Educational Attainment | In Labor Force | Unemployed |
| Less than High School | 1,298 (72.6%) | 300 (16.8%) |
| High School Diploma | 2,959 (67.2%) | 229 (5.2%) |
| College / Associate Degree | 2,863 (74.4%) | 177 (4.6%) |
| Bachelor's Degree or higher | 3,953 (84.2%) | 141 (3.0%) |
| Total | 11,080 (75.2%) | 825 (5.6%) |
Employment Occupations by Sex in Lumpkin County
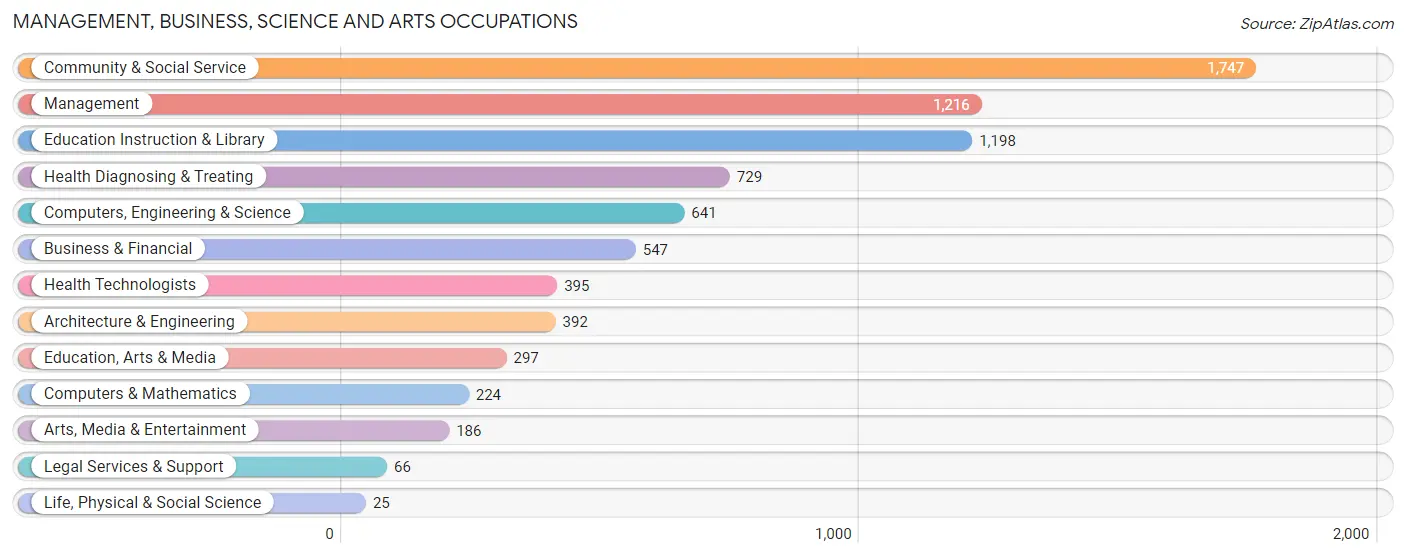
Management, Business, Science and Arts Occupations
The most common Management, Business, Science and Arts occupations in Lumpkin County are Community & Social Service (1,747 | 11.4%), Management (1,216 | 7.9%), Education Instruction & Library (1,198 | 7.8%), Health Diagnosing & Treating (729 | 4.8%), and Computers, Engineering & Science (641 | 4.2%).
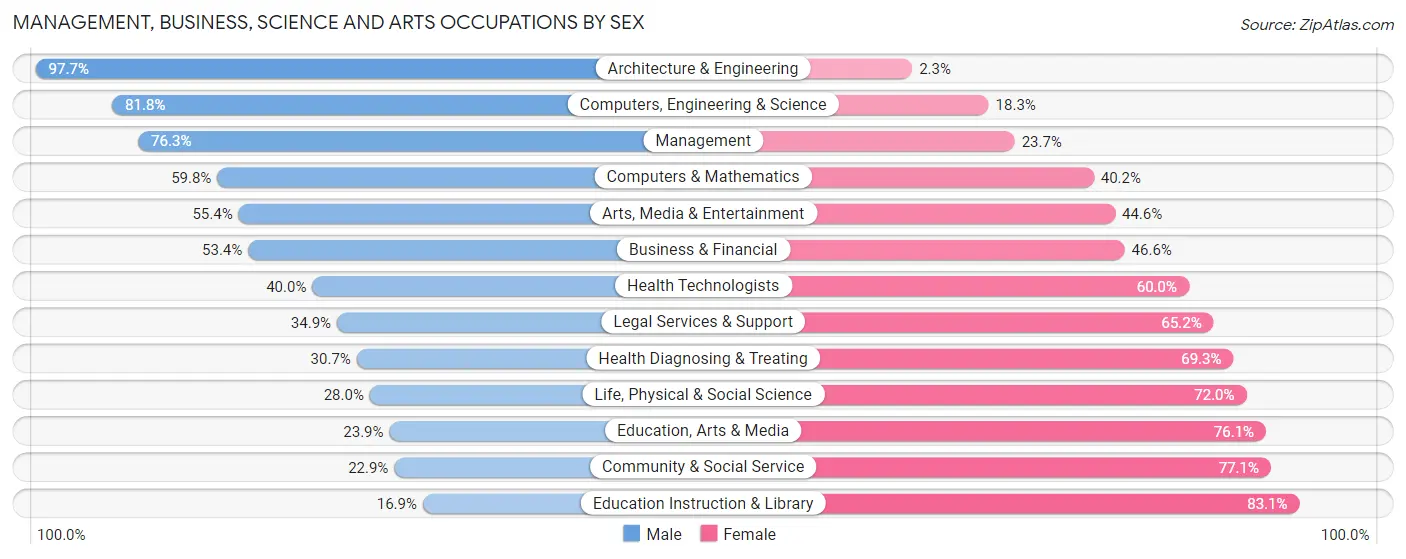
Management, Business, Science and Arts Occupations by Sex
Within the Management, Business, Science and Arts occupations in Lumpkin County, the most male-oriented occupations are Architecture & Engineering (97.7%), Computers, Engineering & Science (81.8%), and Management (76.3%), while the most female-oriented occupations are Education Instruction & Library (83.1%), Community & Social Service (77.1%), and Education, Arts & Media (76.1%).
| Occupation | Male | Female |
| Management | 928 (76.3%) | 288 (23.7%) |
| Business & Financial | 292 (53.4%) | 255 (46.6%) |
| Computers, Engineering & Science | 524 (81.8%) | 117 (18.2%) |
| Computers & Mathematics | 134 (59.8%) | 90 (40.2%) |
| Architecture & Engineering | 383 (97.7%) | 9 (2.3%) |
| Life, Physical & Social Science | 7 (28.0%) | 18 (72.0%) |
| Community & Social Service | 400 (22.9%) | 1,347 (77.1%) |
| Education, Arts & Media | 71 (23.9%) | 226 (76.1%) |
| Legal Services & Support | 23 (34.8%) | 43 (65.1%) |
| Education Instruction & Library | 203 (16.9%) | 995 (83.1%) |
| Arts, Media & Entertainment | 103 (55.4%) | 83 (44.6%) |
| Health Diagnosing & Treating | 224 (30.7%) | 505 (69.3%) |
| Health Technologists | 158 (40.0%) | 237 (60.0%) |
| Total (Category) | 2,368 (48.5%) | 2,512 (51.5%) |
| Total (Overall) | 8,101 (52.8%) | 7,226 (47.1%) |
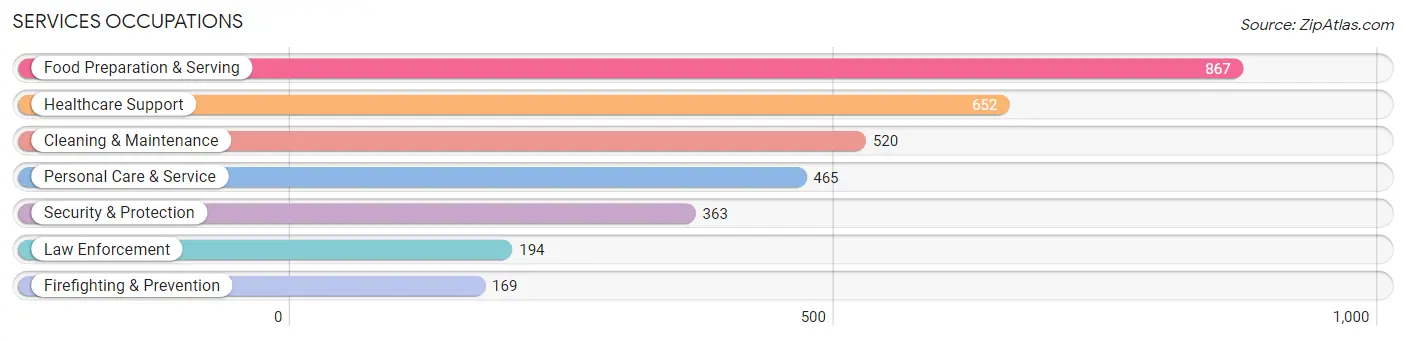
Services Occupations
The most common Services occupations in Lumpkin County are Food Preparation & Serving (867 | 5.7%), Healthcare Support (652 | 4.3%), Cleaning & Maintenance (520 | 3.4%), Personal Care & Service (465 | 3.0%), and Security & Protection (363 | 2.4%).
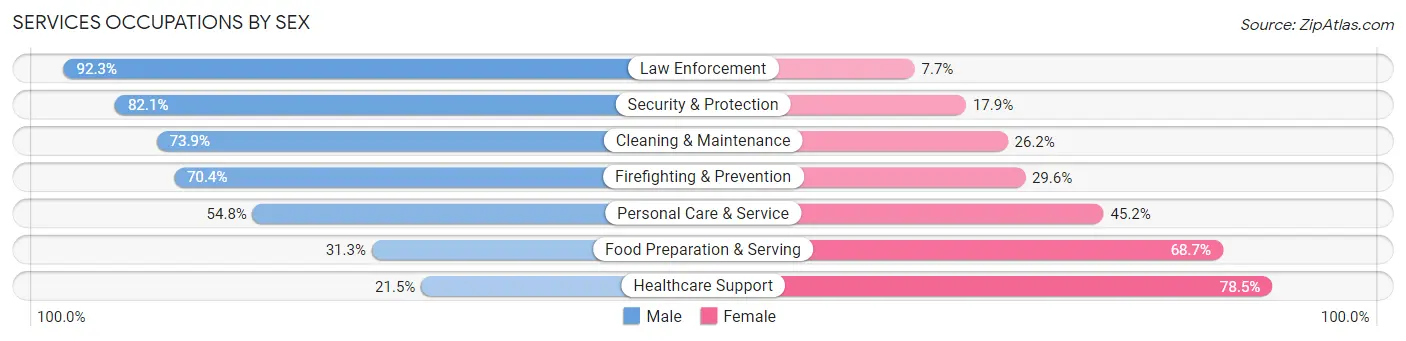
Services Occupations by Sex
Within the Services occupations in Lumpkin County, the most male-oriented occupations are Law Enforcement (92.3%), Security & Protection (82.1%), and Cleaning & Maintenance (73.9%), while the most female-oriented occupations are Healthcare Support (78.5%), Food Preparation & Serving (68.7%), and Personal Care & Service (45.2%).
| Occupation | Male | Female |
| Healthcare Support | 140 (21.5%) | 512 (78.5%) |
| Security & Protection | 298 (82.1%) | 65 (17.9%) |
| Firefighting & Prevention | 119 (70.4%) | 50 (29.6%) |
| Law Enforcement | 179 (92.3%) | 15 (7.7%) |
| Food Preparation & Serving | 271 (31.3%) | 596 (68.7%) |
| Cleaning & Maintenance | 384 (73.9%) | 136 (26.2%) |
| Personal Care & Service | 255 (54.8%) | 210 (45.2%) |
| Total (Category) | 1,348 (47.0%) | 1,519 (53.0%) |
| Total (Overall) | 8,101 (52.8%) | 7,226 (47.1%) |
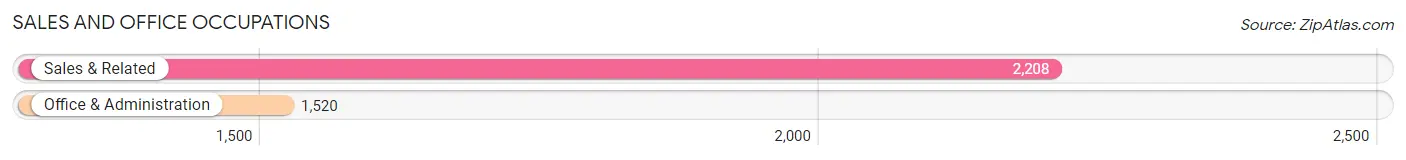
Sales and Office Occupations
The most common Sales and Office occupations in Lumpkin County are Sales & Related (2,208 | 14.4%), and Office & Administration (1,520 | 9.9%).
Sales and Office Occupations by Sex
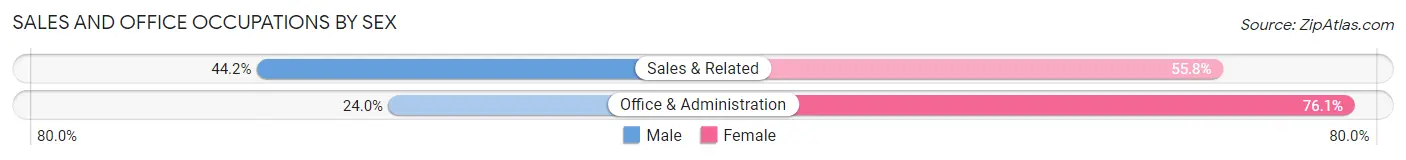
| Occupation | Male | Female |
| Sales & Related | 976 (44.2%) | 1,232 (55.8%) |
| Office & Administration | 364 (23.9%) | 1,156 (76.0%) |
| Total (Category) | 1,340 (35.9%) | 2,388 (64.1%) |
| Total (Overall) | 8,101 (52.8%) | 7,226 (47.1%) |
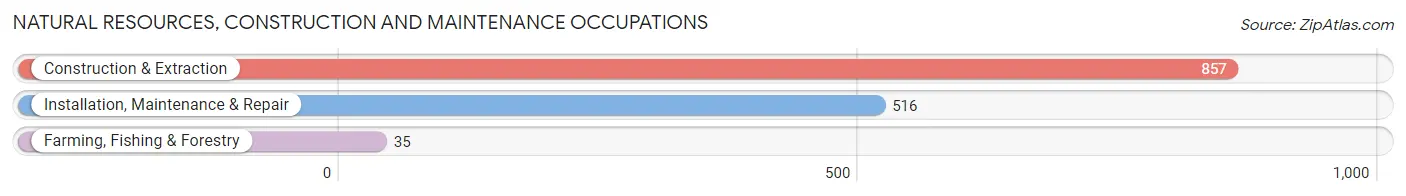
Natural Resources, Construction and Maintenance Occupations
The most common Natural Resources, Construction and Maintenance occupations in Lumpkin County are Construction & Extraction (857 | 5.6%), Installation, Maintenance & Repair (516 | 3.4%), and Farming, Fishing & Forestry (35 | 0.2%).
Natural Resources, Construction and Maintenance Occupations by Sex
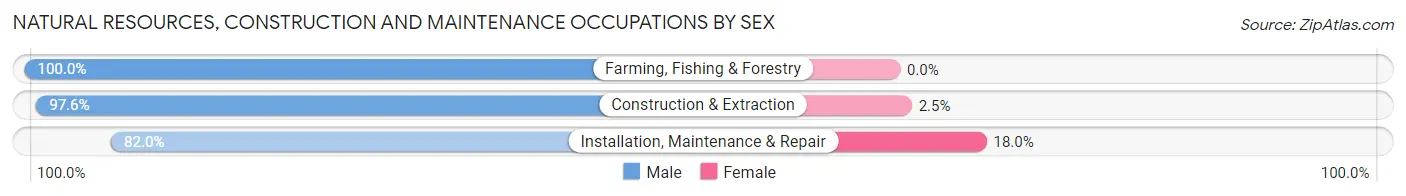
| Occupation | Male | Female |
| Farming, Fishing & Forestry | 35 (100.0%) | 0 (0.0%) |
| Construction & Extraction | 836 (97.6%) | 21 (2.5%) |
| Installation, Maintenance & Repair | 423 (82.0%) | 93 (18.0%) |
| Total (Category) | 1,294 (91.9%) | 114 (8.1%) |
| Total (Overall) | 8,101 (52.8%) | 7,226 (47.1%) |
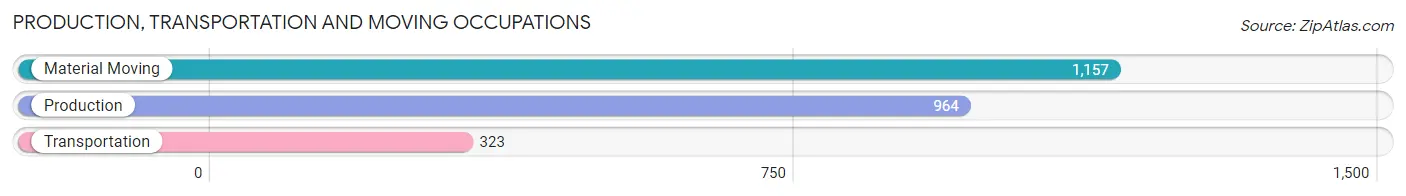
Production, Transportation and Moving Occupations
The most common Production, Transportation and Moving occupations in Lumpkin County are Material Moving (1,157 | 7.5%), Production (964 | 6.3%), and Transportation (323 | 2.1%).
Production, Transportation and Moving Occupations by Sex
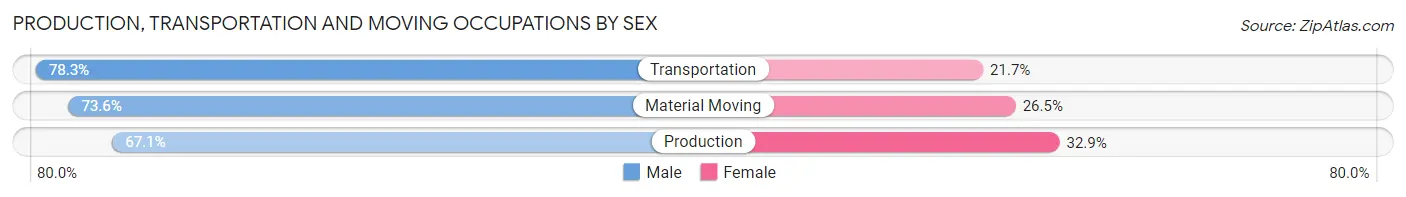
| Occupation | Male | Female |
| Production | 647 (67.1%) | 317 (32.9%) |
| Transportation | 253 (78.3%) | 70 (21.7%) |
| Material Moving | 851 (73.6%) | 306 (26.5%) |
| Total (Category) | 1,751 (71.6%) | 693 (28.4%) |
| Total (Overall) | 8,101 (52.8%) | 7,226 (47.1%) |
Employment Industries by Sex in Lumpkin County
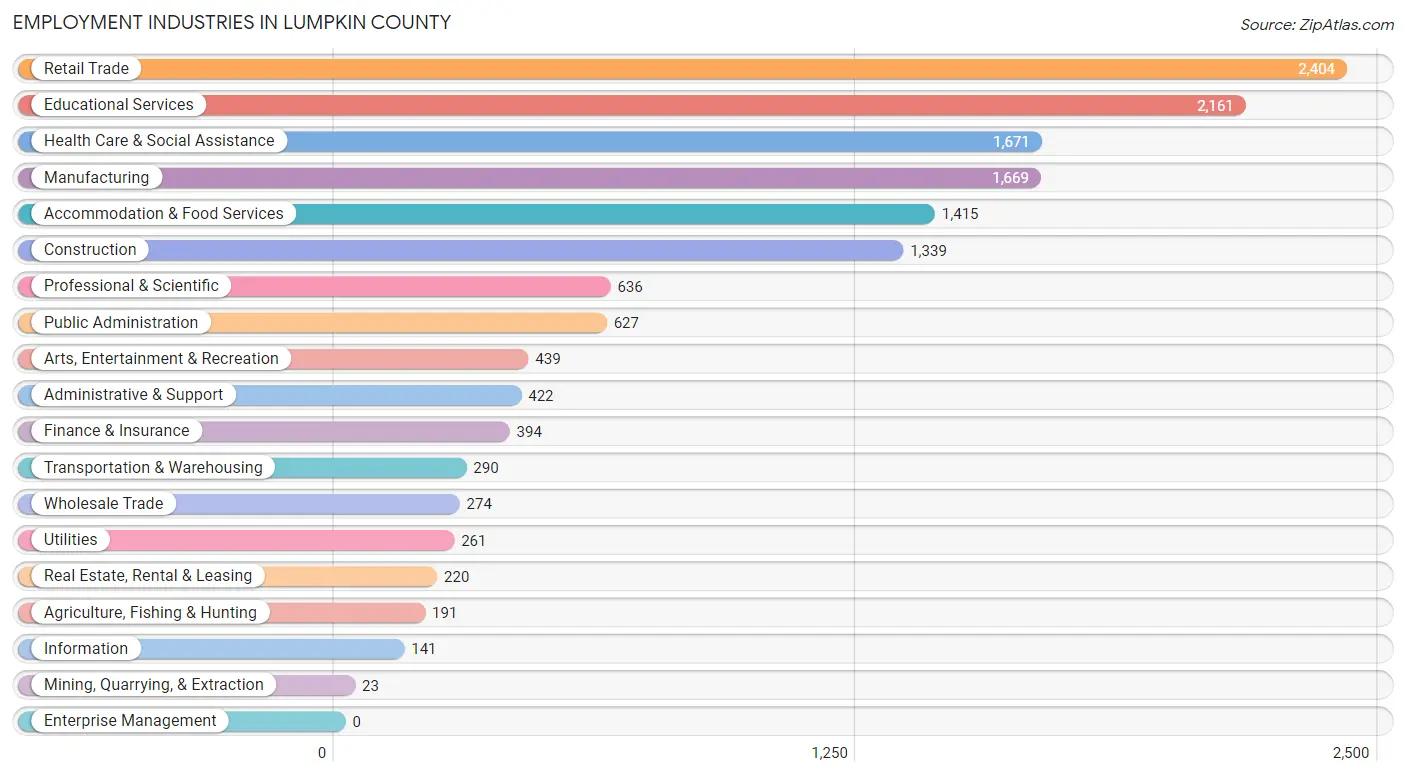
Employment Industries in Lumpkin County
The major employment industries in Lumpkin County include Retail Trade (2,404 | 15.7%), Educational Services (2,161 | 14.1%), Health Care & Social Assistance (1,671 | 10.9%), Manufacturing (1,669 | 10.9%), and Accommodation & Food Services (1,415 | 9.2%).
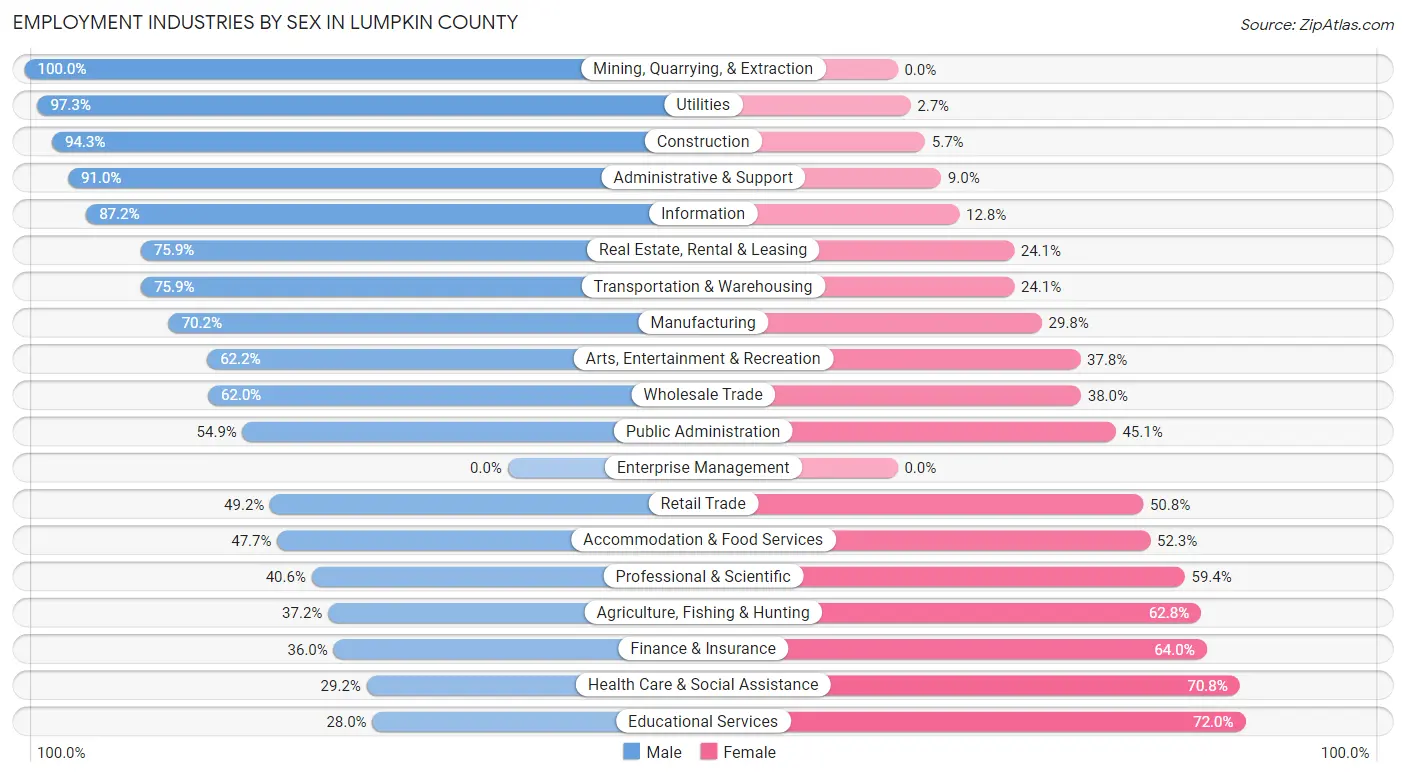
Employment Industries by Sex in Lumpkin County
The Lumpkin County industries that see more men than women are Mining, Quarrying, & Extraction (100.0%), Utilities (97.3%), and Construction (94.3%), whereas the industries that tend to have a higher number of women are Educational Services (72.0%), Health Care & Social Assistance (70.8%), and Finance & Insurance (64.0%).
| Industry | Male | Female |
| Agriculture, Fishing & Hunting | 71 (37.2%) | 120 (62.8%) |
| Mining, Quarrying, & Extraction | 23 (100.0%) | 0 (0.0%) |
| Construction | 1,263 (94.3%) | 76 (5.7%) |
| Manufacturing | 1,171 (70.2%) | 498 (29.8%) |
| Wholesale Trade | 170 (62.0%) | 104 (38.0%) |
| Retail Trade | 1,182 (49.2%) | 1,222 (50.8%) |
| Transportation & Warehousing | 220 (75.9%) | 70 (24.1%) |
| Utilities | 254 (97.3%) | 7 (2.7%) |
| Information | 123 (87.2%) | 18 (12.8%) |
| Finance & Insurance | 142 (36.0%) | 252 (64.0%) |
| Real Estate, Rental & Leasing | 167 (75.9%) | 53 (24.1%) |
| Professional & Scientific | 258 (40.6%) | 378 (59.4%) |
| Enterprise Management | 0 (0.0%) | 0 (0.0%) |
| Administrative & Support | 384 (91.0%) | 38 (9.0%) |
| Educational Services | 605 (28.0%) | 1,556 (72.0%) |
| Health Care & Social Assistance | 488 (29.2%) | 1,183 (70.8%) |
| Arts, Entertainment & Recreation | 273 (62.2%) | 166 (37.8%) |
| Accommodation & Food Services | 675 (47.7%) | 740 (52.3%) |
| Public Administration | 344 (54.9%) | 283 (45.1%) |
| Total | 8,101 (52.8%) | 7,226 (47.1%) |
Education in Lumpkin County
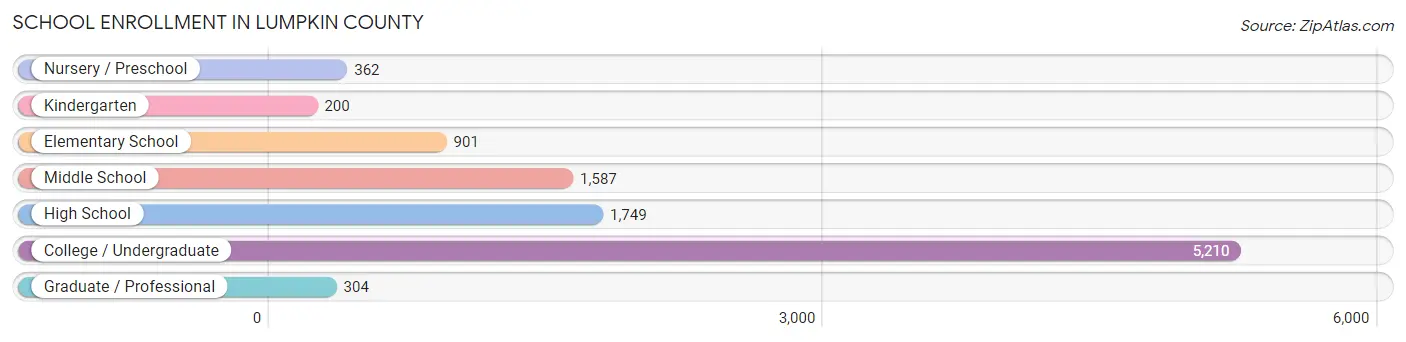
School Enrollment in Lumpkin County
The most common levels of schooling among the 10,313 students in Lumpkin County are college / undergraduate (5,210 | 50.5%), high school (1,749 | 17.0%), and middle school (1,587 | 15.4%).
| School Level | # Students | % Students |
| Nursery / Preschool | 362 | 3.5% |
| Kindergarten | 200 | 1.9% |
| Elementary School | 901 | 8.7% |
| Middle School | 1,587 | 15.4% |
| High School | 1,749 | 17.0% |
| College / Undergraduate | 5,210 | 50.5% |
| Graduate / Professional | 304 | 2.9% |
| Total | 10,313 | 100.0% |
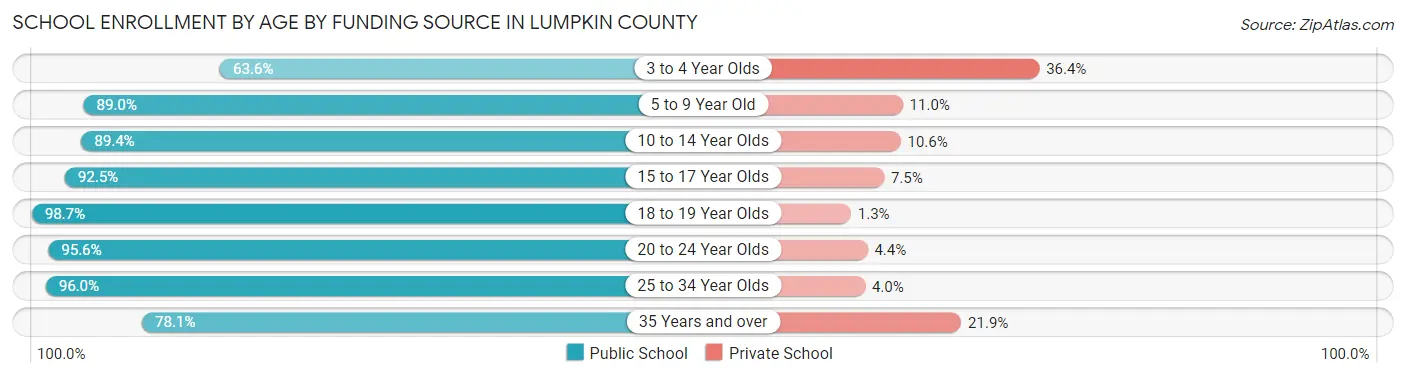
School Enrollment by Age by Funding Source in Lumpkin County
Out of a total of 10,313 students who are enrolled in schools in Lumpkin County, 804 (7.8%) attend a private institution, while the remaining 9,509 (92.2%) are enrolled in public schools. The age group of 3 to 4 year olds has the highest likelihood of being enrolled in private schools, with 110 (36.4% in the age bracket) enrolled. Conversely, the age group of 18 to 19 year olds has the lowest likelihood of being enrolled in a private school, with 2,139 (98.7% in the age bracket) attending a public institution.
| Age Bracket | Public School | Private School |
| 3 to 4 Year Olds | 192 (63.6%) | 110 (36.4%) |
| 5 to 9 Year Old | 907 (89.0%) | 112 (11.0%) |
| 10 to 14 Year Olds | 1,706 (89.4%) | 202 (10.6%) |
| 15 to 17 Year Olds | 1,121 (92.5%) | 91 (7.5%) |
| 18 to 19 Year Olds | 2,139 (98.7%) | 29 (1.3%) |
| 20 to 24 Year Olds | 2,698 (95.6%) | 125 (4.4%) |
| 25 to 34 Year Olds | 315 (96.0%) | 13 (4.0%) |
| 35 Years and over | 432 (78.1%) | 121 (21.9%) |
| Total | 9,509 (92.2%) | 804 (7.8%) |
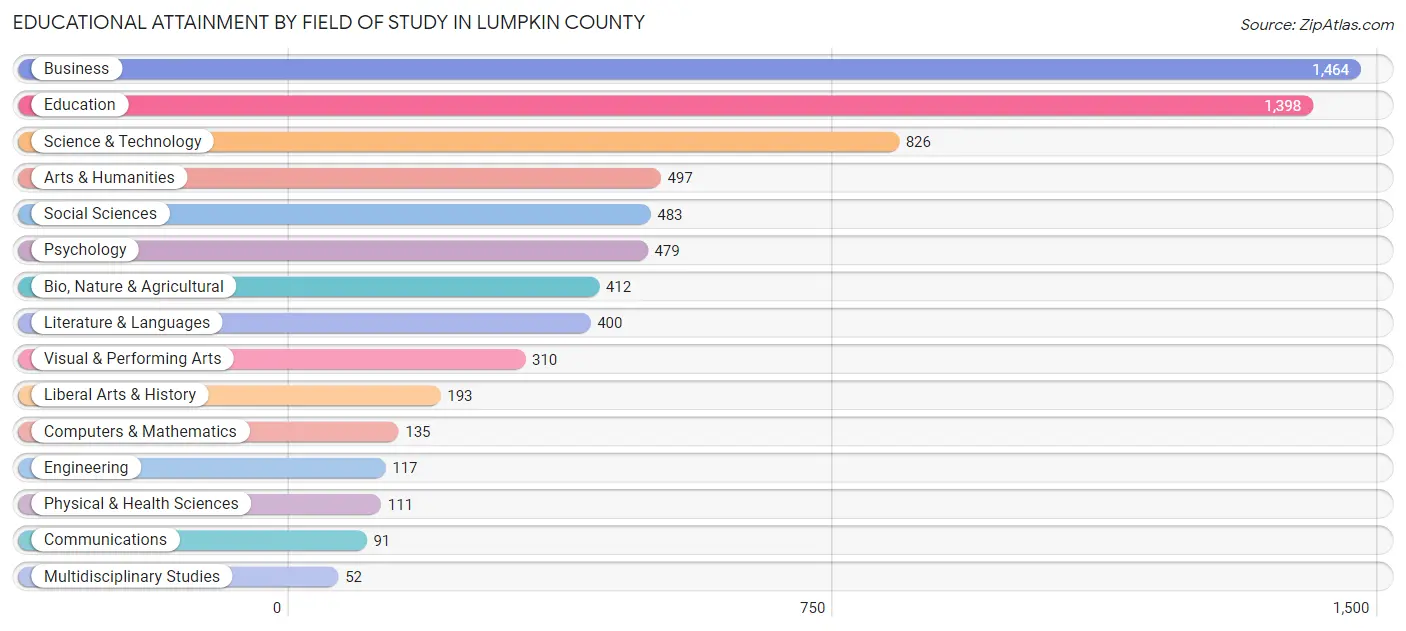
Educational Attainment by Field of Study in Lumpkin County
Business (1,464 | 21.0%), education (1,398 | 20.1%), science & technology (826 | 11.8%), arts & humanities (497 | 7.1%), and social sciences (483 | 6.9%) are the most common fields of study among 6,968 individuals in Lumpkin County who have obtained a bachelor's degree or higher.
| Field of Study | # Graduates | % Graduates |
| Computers & Mathematics | 135 | 1.9% |
| Bio, Nature & Agricultural | 412 | 5.9% |
| Physical & Health Sciences | 111 | 1.6% |
| Psychology | 479 | 6.9% |
| Social Sciences | 483 | 6.9% |
| Engineering | 117 | 1.7% |
| Multidisciplinary Studies | 52 | 0.7% |
| Science & Technology | 826 | 11.8% |
| Business | 1,464 | 21.0% |
| Education | 1,398 | 20.1% |
| Literature & Languages | 400 | 5.7% |
| Liberal Arts & History | 193 | 2.8% |
| Visual & Performing Arts | 310 | 4.4% |
| Communications | 91 | 1.3% |
| Arts & Humanities | 497 | 7.1% |
| Total | 6,968 | 100.0% |
Transportation & Commute in Lumpkin County
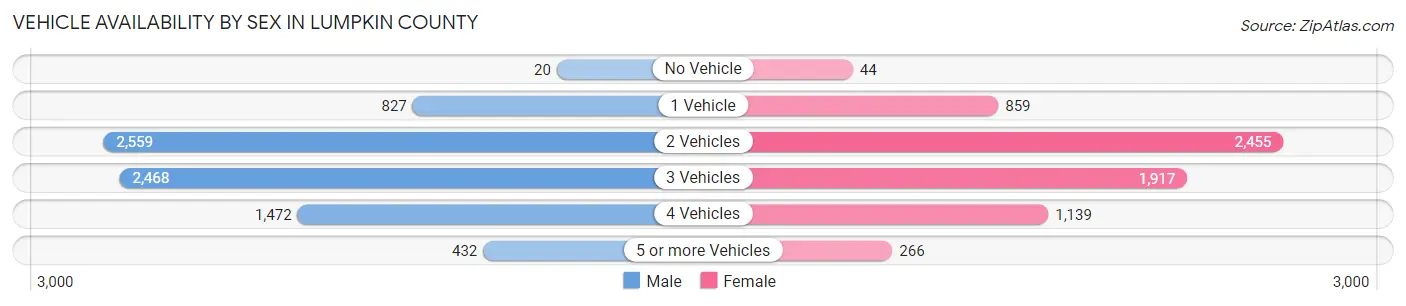
Vehicle Availability by Sex in Lumpkin County
The most prevalent vehicle ownership categories in Lumpkin County are males with 2 vehicles (2,559, accounting for 32.9%) and females with 2 vehicles (2,455, making up 38.3%).
| Vehicles Available | Male | Female |
| No Vehicle | 20 (0.3%) | 44 (0.7%) |
| 1 Vehicle | 827 (10.6%) | 859 (12.9%) |
| 2 Vehicles | 2,559 (32.9%) | 2,455 (36.7%) |
| 3 Vehicles | 2,468 (31.7%) | 1,917 (28.7%) |
| 4 Vehicles | 1,472 (18.9%) | 1,139 (17.1%) |
| 5 or more Vehicles | 432 (5.6%) | 266 (4.0%) |
| Total | 7,778 (100.0%) | 6,680 (100.0%) |
Commute Time in Lumpkin County
The most frequently occuring commute durations in Lumpkin County are 20 to 24 minutes (2,160 commuters, 15.5%), 10 to 14 minutes (1,926 commuters, 13.8%), and 45 to 59 minutes (1,885 commuters, 13.5%).
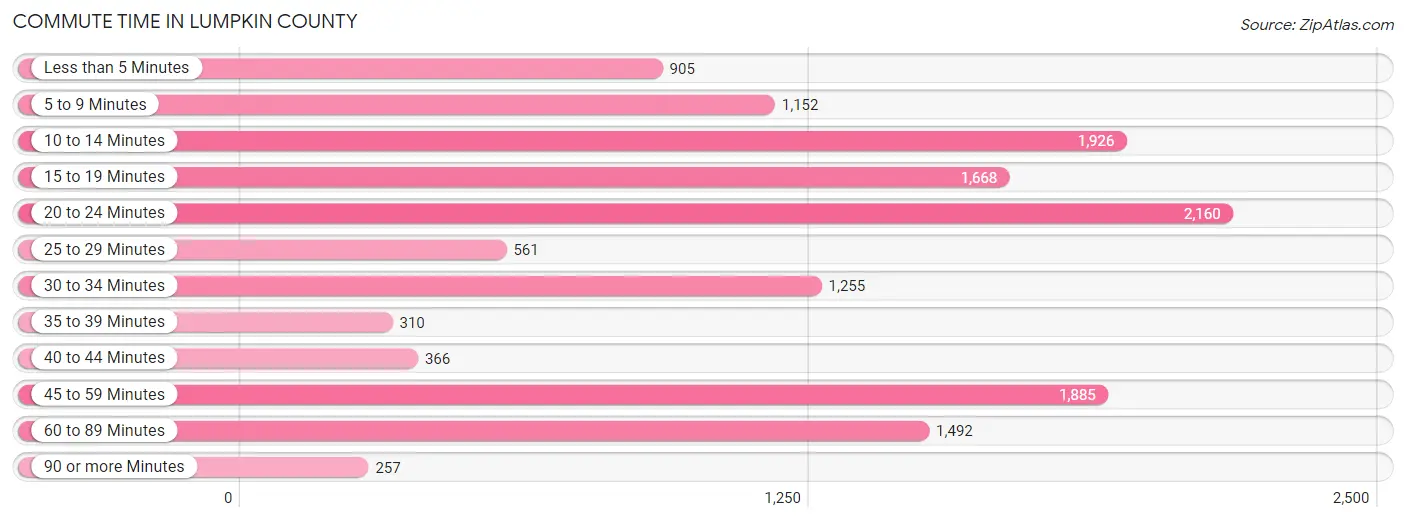
| Commute Time | # Commuters | % Commuters |
| Less than 5 Minutes | 905 | 6.5% |
| 5 to 9 Minutes | 1,152 | 8.3% |
| 10 to 14 Minutes | 1,926 | 13.8% |
| 15 to 19 Minutes | 1,668 | 12.0% |
| 20 to 24 Minutes | 2,160 | 15.5% |
| 25 to 29 Minutes | 561 | 4.0% |
| 30 to 34 Minutes | 1,255 | 9.0% |
| 35 to 39 Minutes | 310 | 2.2% |
| 40 to 44 Minutes | 366 | 2.6% |
| 45 to 59 Minutes | 1,885 | 13.5% |
| 60 to 89 Minutes | 1,492 | 10.7% |
| 90 or more Minutes | 257 | 1.8% |
Commute Time by Sex in Lumpkin County
The most common commute times in Lumpkin County are 15 to 19 minutes (1,114 commuters, 14.9%) for males and 10 to 14 minutes (1,212 commuters, 18.7%) for females.
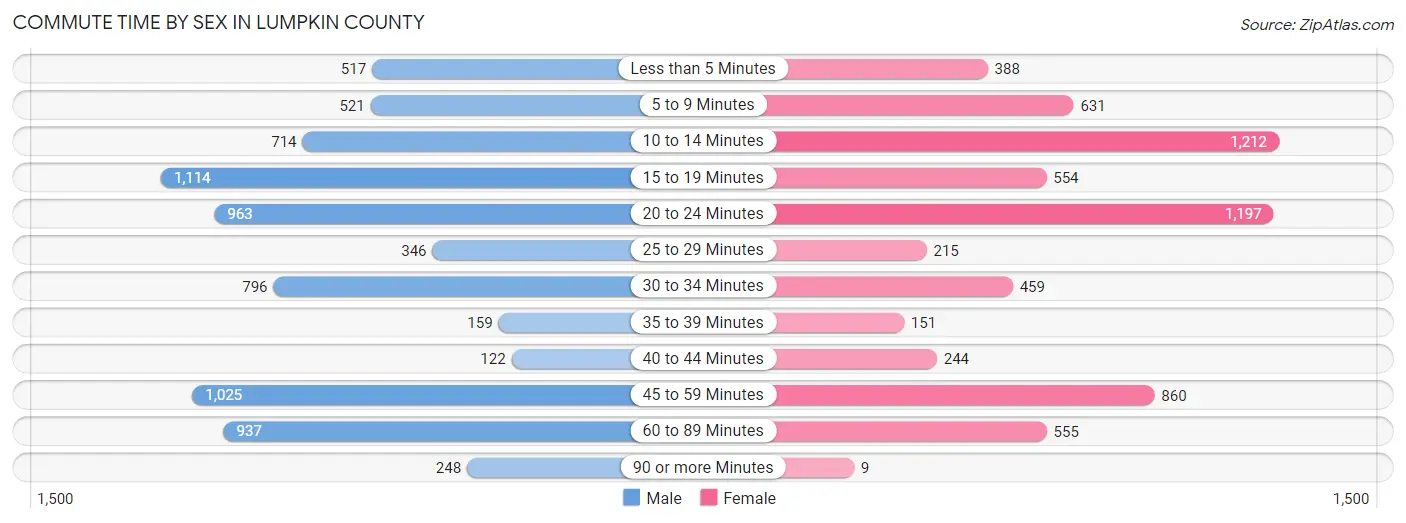
| Commute Time | Male | Female |
| Less than 5 Minutes | 517 (6.9%) | 388 (6.0%) |
| 5 to 9 Minutes | 521 (7.0%) | 631 (9.8%) |
| 10 to 14 Minutes | 714 (9.6%) | 1,212 (18.7%) |
| 15 to 19 Minutes | 1,114 (14.9%) | 554 (8.6%) |
| 20 to 24 Minutes | 963 (12.9%) | 1,197 (18.5%) |
| 25 to 29 Minutes | 346 (4.6%) | 215 (3.3%) |
| 30 to 34 Minutes | 796 (10.7%) | 459 (7.1%) |
| 35 to 39 Minutes | 159 (2.1%) | 151 (2.3%) |
| 40 to 44 Minutes | 122 (1.6%) | 244 (3.8%) |
| 45 to 59 Minutes | 1,025 (13.7%) | 860 (13.3%) |
| 60 to 89 Minutes | 937 (12.6%) | 555 (8.6%) |
| 90 or more Minutes | 248 (3.3%) | 9 (0.1%) |
Time of Departure to Work by Sex in Lumpkin County
The most frequent times of departure to work in Lumpkin County are 6:30 AM to 6:59 AM (1,130, 15.1%) for males and 7:00 AM to 7:29 AM (993, 15.3%) for females.
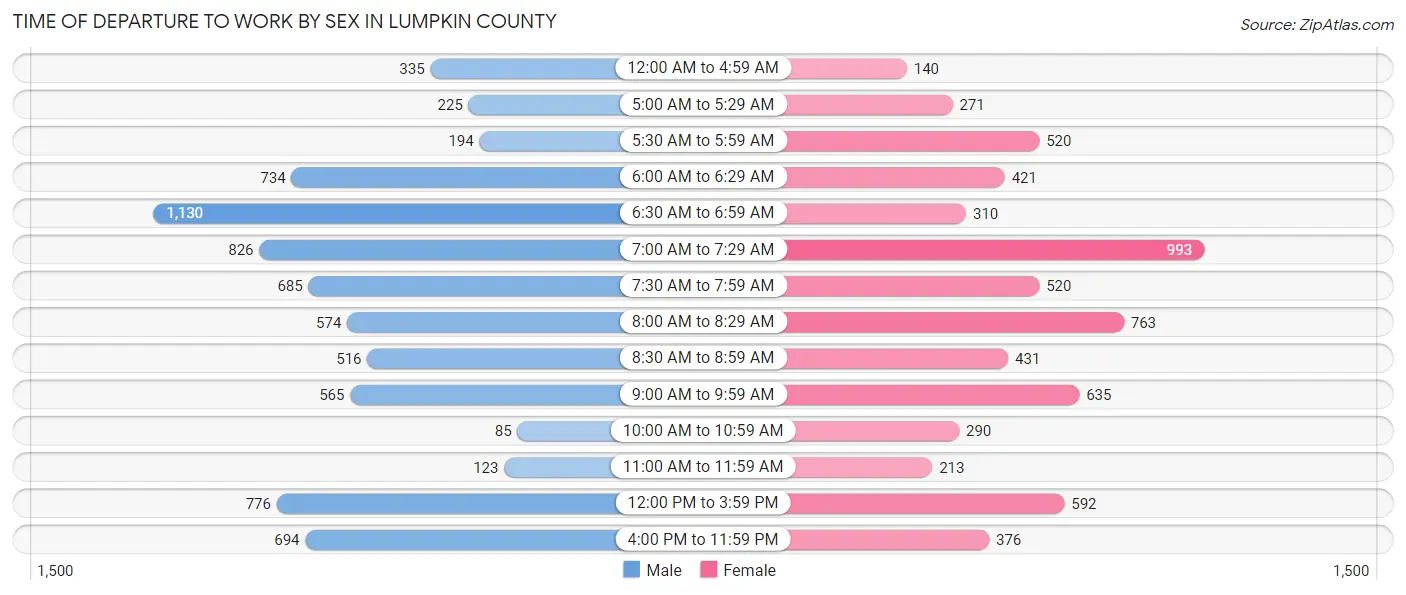
| Time of Departure | Male | Female |
| 12:00 AM to 4:59 AM | 335 (4.5%) | 140 (2.2%) |
| 5:00 AM to 5:29 AM | 225 (3.0%) | 271 (4.2%) |
| 5:30 AM to 5:59 AM | 194 (2.6%) | 520 (8.0%) |
| 6:00 AM to 6:29 AM | 734 (9.8%) | 421 (6.5%) |
| 6:30 AM to 6:59 AM | 1,130 (15.1%) | 310 (4.8%) |
| 7:00 AM to 7:29 AM | 826 (11.1%) | 993 (15.3%) |
| 7:30 AM to 7:59 AM | 685 (9.2%) | 520 (8.0%) |
| 8:00 AM to 8:29 AM | 574 (7.7%) | 763 (11.8%) |
| 8:30 AM to 8:59 AM | 516 (6.9%) | 431 (6.7%) |
| 9:00 AM to 9:59 AM | 565 (7.6%) | 635 (9.8%) |
| 10:00 AM to 10:59 AM | 85 (1.1%) | 290 (4.5%) |
| 11:00 AM to 11:59 AM | 123 (1.7%) | 213 (3.3%) |
| 12:00 PM to 3:59 PM | 776 (10.4%) | 592 (9.1%) |
| 4:00 PM to 11:59 PM | 694 (9.3%) | 376 (5.8%) |
| Total | 7,462 (100.0%) | 6,475 (100.0%) |
Housing Occupancy in Lumpkin County
Occupancy by Ownership in Lumpkin County
Of the total 11,450 dwellings in Lumpkin County, owner-occupied units account for 8,798 (76.8%), while renter-occupied units make up 2,652 (23.2%).
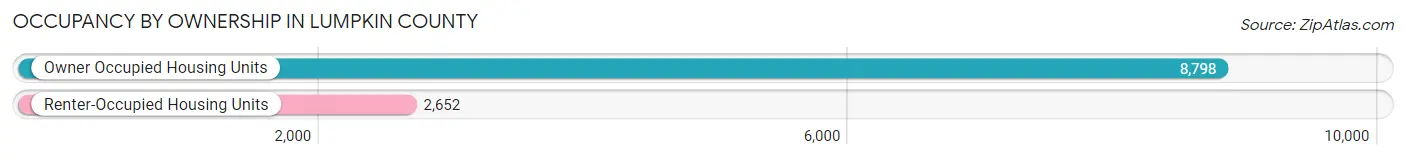
| Occupancy | # Housing Units | % Housing Units |
| Owner Occupied Housing Units | 8,798 | 76.8% |
| Renter-Occupied Housing Units | 2,652 | 23.2% |
| Total Occupied Housing Units | 11,450 | 100.0% |
Occupancy by Household Size in Lumpkin County
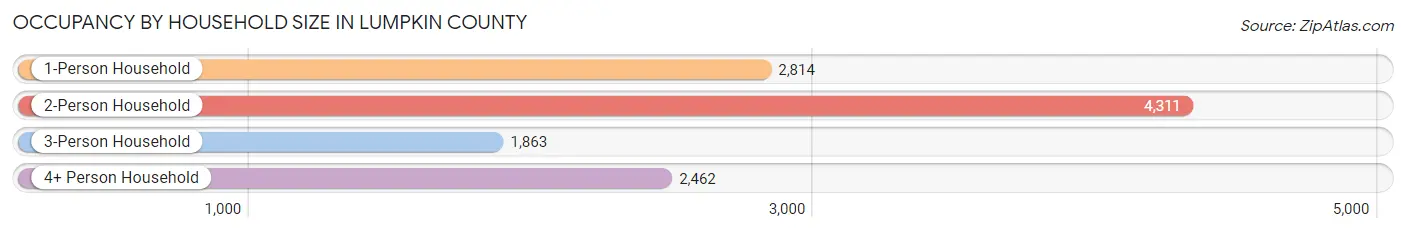
| Household Size | # Housing Units | % Housing Units |
| 1-Person Household | 2,814 | 24.6% |
| 2-Person Household | 4,311 | 37.7% |
| 3-Person Household | 1,863 | 16.3% |
| 4+ Person Household | 2,462 | 21.5% |
| Total Housing Units | 11,450 | 100.0% |
Occupancy by Ownership by Household Size in Lumpkin County
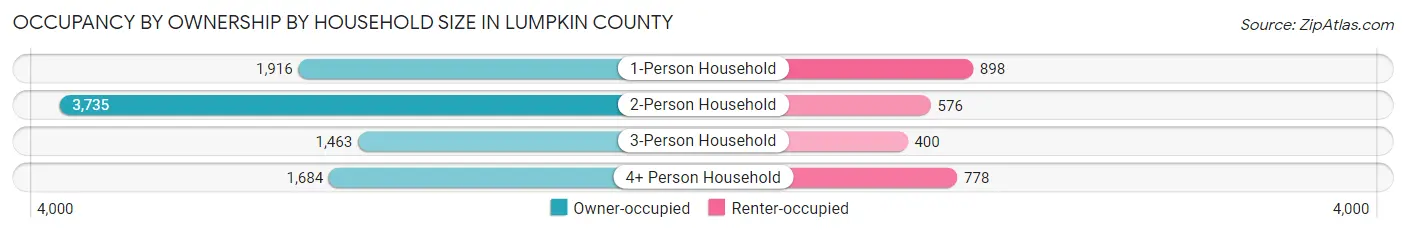
| Household Size | Owner-occupied | Renter-occupied |
| 1-Person Household | 1,916 (68.1%) | 898 (31.9%) |
| 2-Person Household | 3,735 (86.6%) | 576 (13.4%) |
| 3-Person Household | 1,463 (78.5%) | 400 (21.5%) |
| 4+ Person Household | 1,684 (68.4%) | 778 (31.6%) |
| Total Housing Units | 8,798 (76.8%) | 2,652 (23.2%) |
Occupancy by Educational Attainment in Lumpkin County
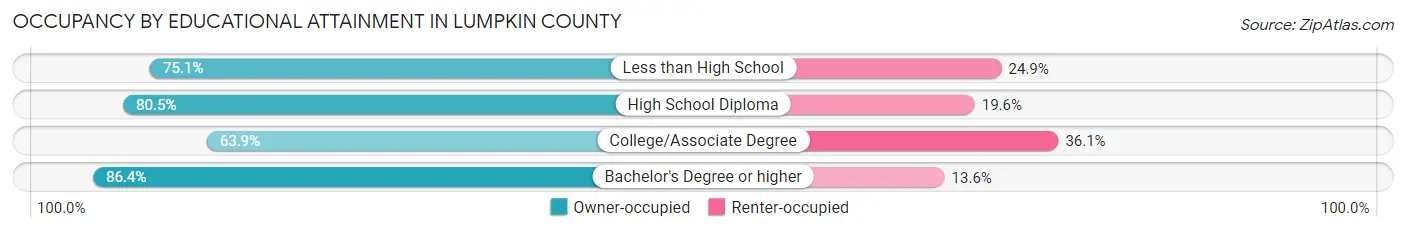
| Household Size | Owner-occupied | Renter-occupied |
| Less than High School | 879 (75.1%) | 291 (24.9%) |
| High School Diploma | 2,280 (80.4%) | 554 (19.6%) |
| College/Associate Degree | 2,253 (63.9%) | 1,275 (36.1%) |
| Bachelor's Degree or higher | 3,386 (86.4%) | 532 (13.6%) |
Occupancy by Age of Householder in Lumpkin County
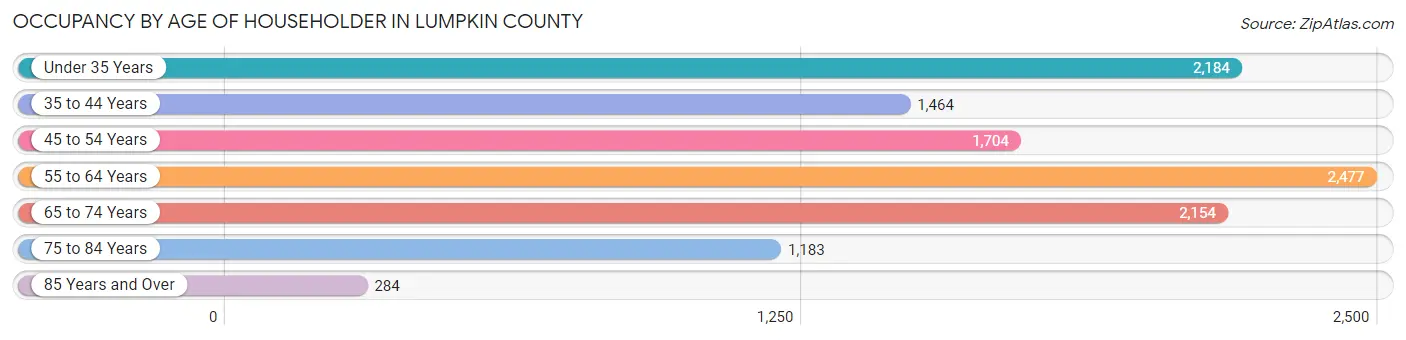
| Age Bracket | # Households | % Households |
| Under 35 Years | 2,184 | 19.1% |
| 35 to 44 Years | 1,464 | 12.8% |
| 45 to 54 Years | 1,704 | 14.9% |
| 55 to 64 Years | 2,477 | 21.6% |
| 65 to 74 Years | 2,154 | 18.8% |
| 75 to 84 Years | 1,183 | 10.3% |
| 85 Years and Over | 284 | 2.5% |
| Total | 11,450 | 100.0% |
Housing Finances in Lumpkin County
Median Income by Occupancy in Lumpkin County
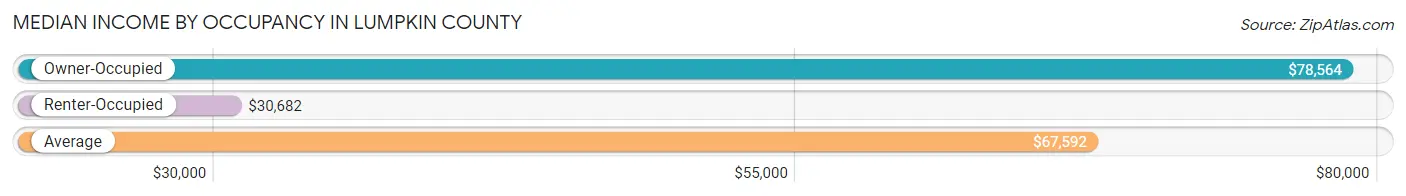
| Occupancy Type | # Households | Median Income |
| Owner-Occupied | 8,798 (76.8%) | $78,564 |
| Renter-Occupied | 2,652 (23.2%) | $30,682 |
| Average | 11,450 (100.0%) | $67,592 |
Occupancy by Householder Income Bracket in Lumpkin County
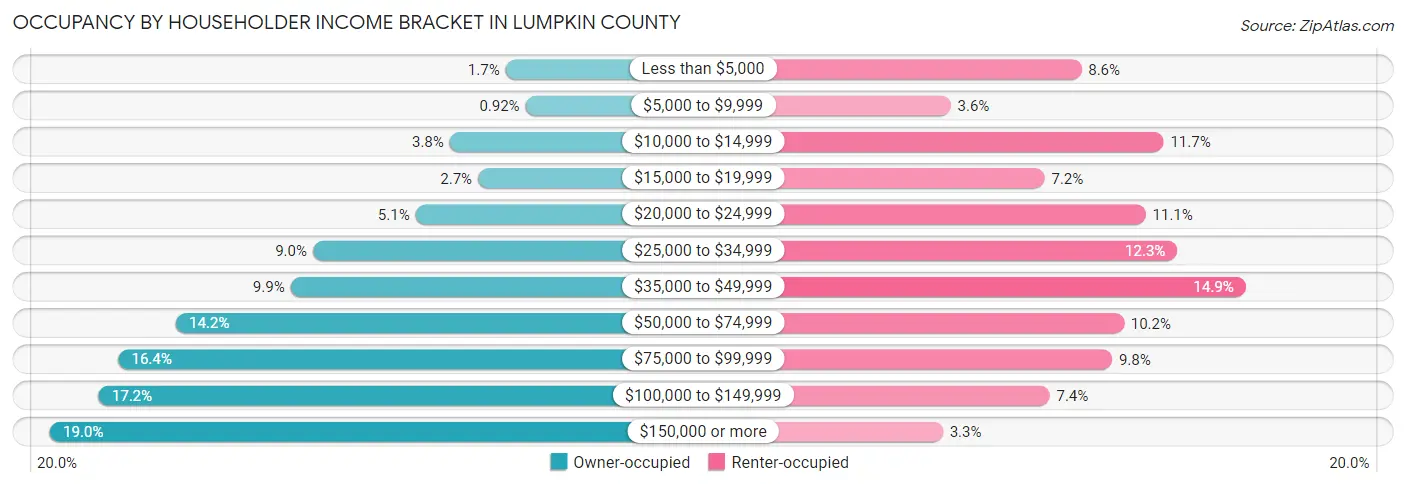
| Income Bracket | Owner-occupied | Renter-occupied |
| Less than $5,000 | 148 (1.7%) | 228 (8.6%) |
| $5,000 to $9,999 | 81 (0.9%) | 96 (3.6%) |
| $10,000 to $14,999 | 335 (3.8%) | 311 (11.7%) |
| $15,000 to $19,999 | 240 (2.7%) | 191 (7.2%) |
| $20,000 to $24,999 | 450 (5.1%) | 293 (11.1%) |
| $25,000 to $34,999 | 794 (9.0%) | 325 (12.2%) |
| $35,000 to $49,999 | 868 (9.9%) | 394 (14.9%) |
| $50,000 to $74,999 | 1,252 (14.2%) | 271 (10.2%) |
| $75,000 to $99,999 | 1,445 (16.4%) | 259 (9.8%) |
| $100,000 to $149,999 | 1,511 (17.2%) | 196 (7.4%) |
| $150,000 or more | 1,674 (19.0%) | 88 (3.3%) |
| Total | 8,798 (100.0%) | 2,652 (100.0%) |
Monthly Housing Cost Tiers in Lumpkin County
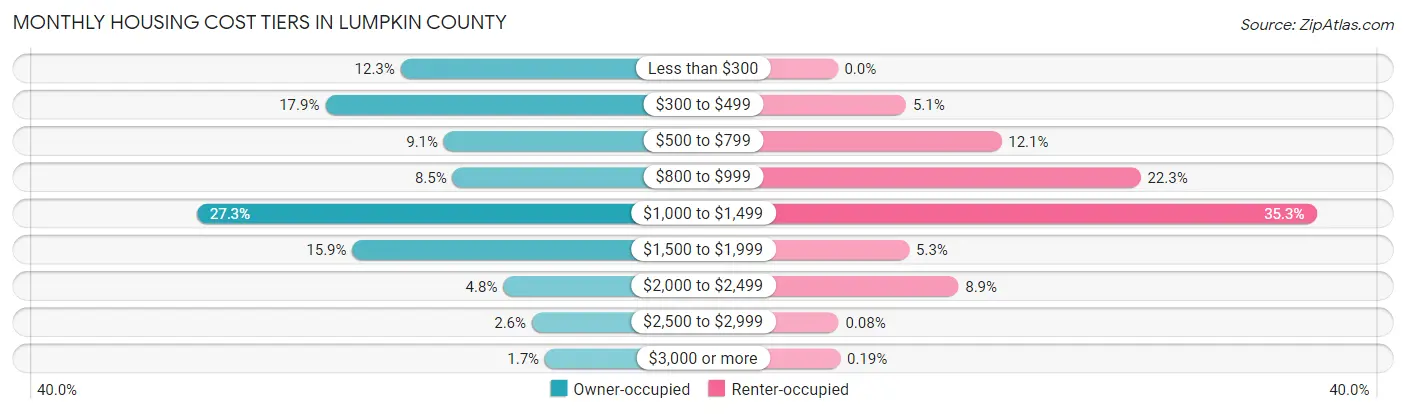
| Monthly Cost | Owner-occupied | Renter-occupied |
| Less than $300 | 1,083 (12.3%) | 0 (0.0%) |
| $300 to $499 | 1,571 (17.9%) | 134 (5.1%) |
| $500 to $799 | 802 (9.1%) | 320 (12.1%) |
| $800 to $999 | 746 (8.5%) | 592 (22.3%) |
| $1,000 to $1,499 | 2,403 (27.3%) | 935 (35.3%) |
| $1,500 to $1,999 | 1,395 (15.9%) | 140 (5.3%) |
| $2,000 to $2,499 | 418 (4.8%) | 236 (8.9%) |
| $2,500 to $2,999 | 232 (2.6%) | 2 (0.1%) |
| $3,000 or more | 148 (1.7%) | 5 (0.2%) |
| Total | 8,798 (100.0%) | 2,652 (100.0%) |
Physical Housing Characteristics in Lumpkin County
Housing Structures in Lumpkin County
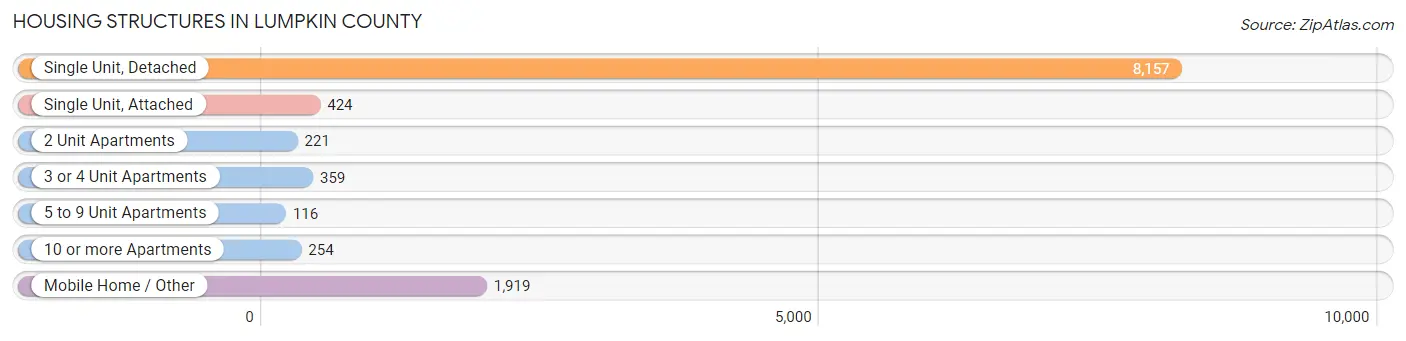
| Structure Type | # Housing Units | % Housing Units |
| Single Unit, Detached | 8,157 | 71.2% |
| Single Unit, Attached | 424 | 3.7% |
| 2 Unit Apartments | 221 | 1.9% |
| 3 or 4 Unit Apartments | 359 | 3.1% |
| 5 to 9 Unit Apartments | 116 | 1.0% |
| 10 or more Apartments | 254 | 2.2% |
| Mobile Home / Other | 1,919 | 16.8% |
| Total | 11,450 | 100.0% |
Housing Structures by Occupancy in Lumpkin County
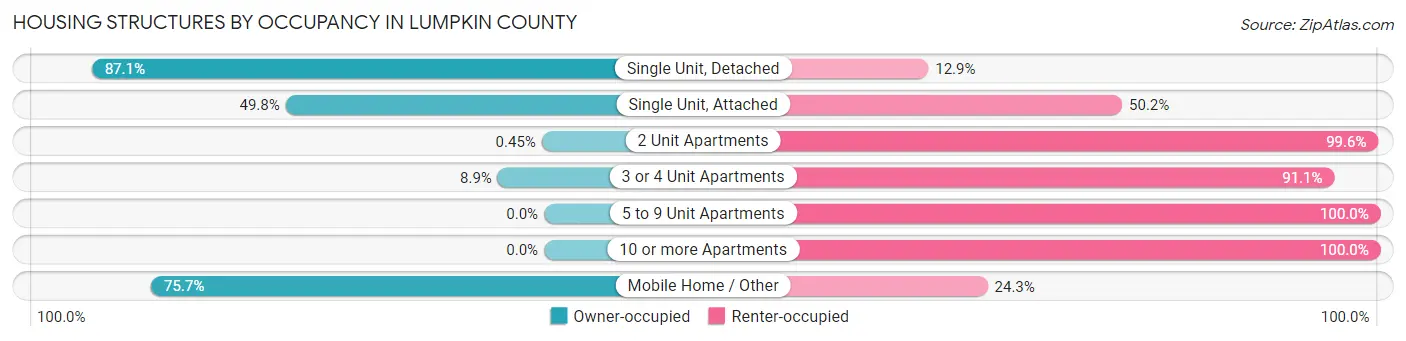
| Structure Type | Owner-occupied | Renter-occupied |
| Single Unit, Detached | 7,102 (87.1%) | 1,055 (12.9%) |
| Single Unit, Attached | 211 (49.8%) | 213 (50.2%) |
| 2 Unit Apartments | 1 (0.4%) | 220 (99.6%) |
| 3 or 4 Unit Apartments | 32 (8.9%) | 327 (91.1%) |
| 5 to 9 Unit Apartments | 0 (0.0%) | 116 (100.0%) |
| 10 or more Apartments | 0 (0.0%) | 254 (100.0%) |
| Mobile Home / Other | 1,452 (75.7%) | 467 (24.3%) |
| Total | 8,798 (76.8%) | 2,652 (23.2%) |
Housing Structures by Number of Rooms in Lumpkin County
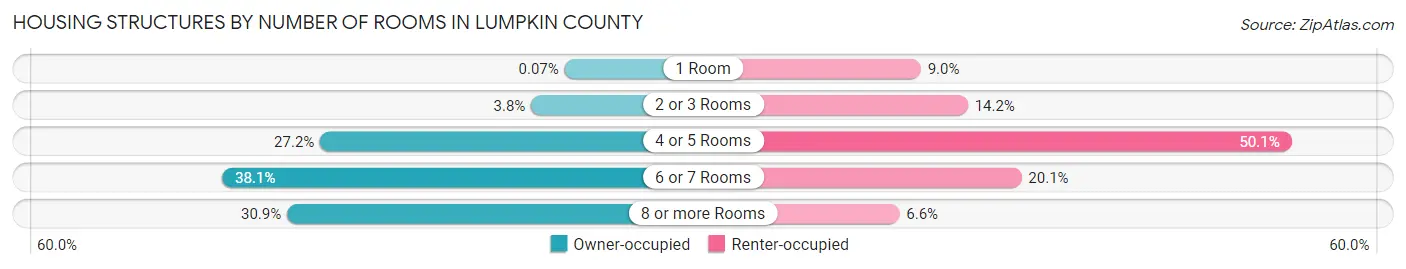
| Number of Rooms | Owner-occupied | Renter-occupied |
| 1 Room | 6 (0.1%) | 238 (9.0%) |
| 2 or 3 Rooms | 333 (3.8%) | 376 (14.2%) |
| 4 or 5 Rooms | 2,393 (27.2%) | 1,329 (50.1%) |
| 6 or 7 Rooms | 3,350 (38.1%) | 534 (20.1%) |
| 8 or more Rooms | 2,716 (30.9%) | 175 (6.6%) |
| Total | 8,798 (100.0%) | 2,652 (100.0%) |
Housing Structure by Heating Type in Lumpkin County
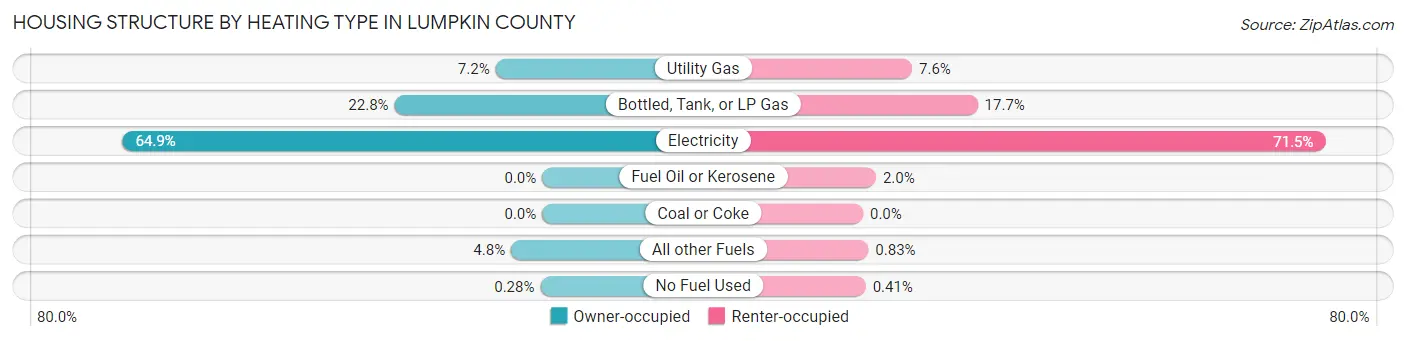
| Heating Type | Owner-occupied | Renter-occupied |
| Utility Gas | 634 (7.2%) | 201 (7.6%) |
| Bottled, Tank, or LP Gas | 2,009 (22.8%) | 470 (17.7%) |
| Electricity | 5,707 (64.9%) | 1,895 (71.5%) |
| Fuel Oil or Kerosene | 0 (0.0%) | 53 (2.0%) |
| Coal or Coke | 0 (0.0%) | 0 (0.0%) |
| All other Fuels | 423 (4.8%) | 22 (0.8%) |
| No Fuel Used | 25 (0.3%) | 11 (0.4%) |
| Total | 8,798 (100.0%) | 2,652 (100.0%) |
Household Vehicle Usage in Lumpkin County
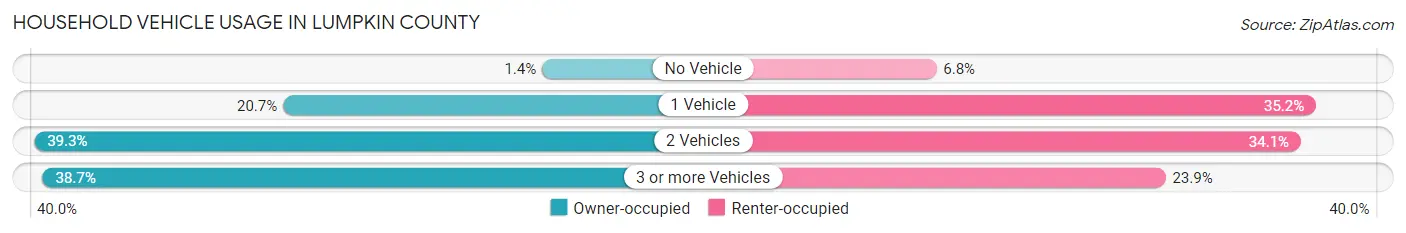
| Vehicles per Household | Owner-occupied | Renter-occupied |
| No Vehicle | 120 (1.4%) | 181 (6.8%) |
| 1 Vehicle | 1,821 (20.7%) | 933 (35.2%) |
| 2 Vehicles | 3,456 (39.3%) | 903 (34.1%) |
| 3 or more Vehicles | 3,401 (38.7%) | 635 (23.9%) |
| Total | 8,798 (100.0%) | 2,652 (100.0%) |
Real Estate & Mortgages in Lumpkin County
Real Estate and Mortgage Overview in Lumpkin County
| Characteristic | Without Mortgage | With Mortgage |
| Housing Units | 3,719 | 5,079 |
| Median Property Value | $260,200 | $245,000 |
| Median Household Income | $61,361 | $975 |
| Monthly Housing Costs | $421 | $147 |
| Real Estate Taxes | $1,478 | $408 |
Property Value by Mortgage Status in Lumpkin County
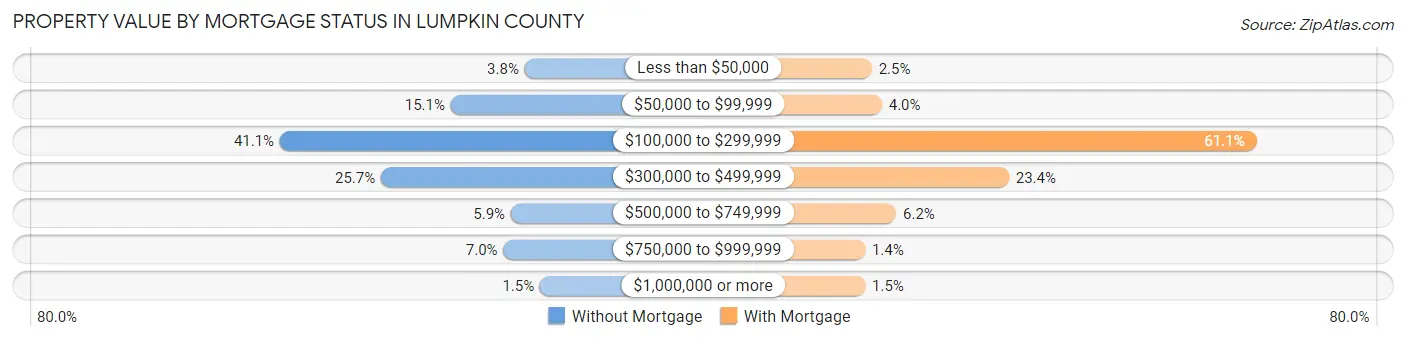
| Property Value | Without Mortgage | With Mortgage |
| Less than $50,000 | 141 (3.8%) | 125 (2.5%) |
| $50,000 to $99,999 | 560 (15.1%) | 203 (4.0%) |
| $100,000 to $299,999 | 1,528 (41.1%) | 3,104 (61.1%) |
| $300,000 to $499,999 | 955 (25.7%) | 1,186 (23.4%) |
| $500,000 to $749,999 | 219 (5.9%) | 314 (6.2%) |
| $750,000 to $999,999 | 262 (7.0%) | 73 (1.4%) |
| $1,000,000 or more | 54 (1.5%) | 74 (1.5%) |
| Total | 3,719 (100.0%) | 5,079 (100.0%) |
Household Income by Mortgage Status in Lumpkin County
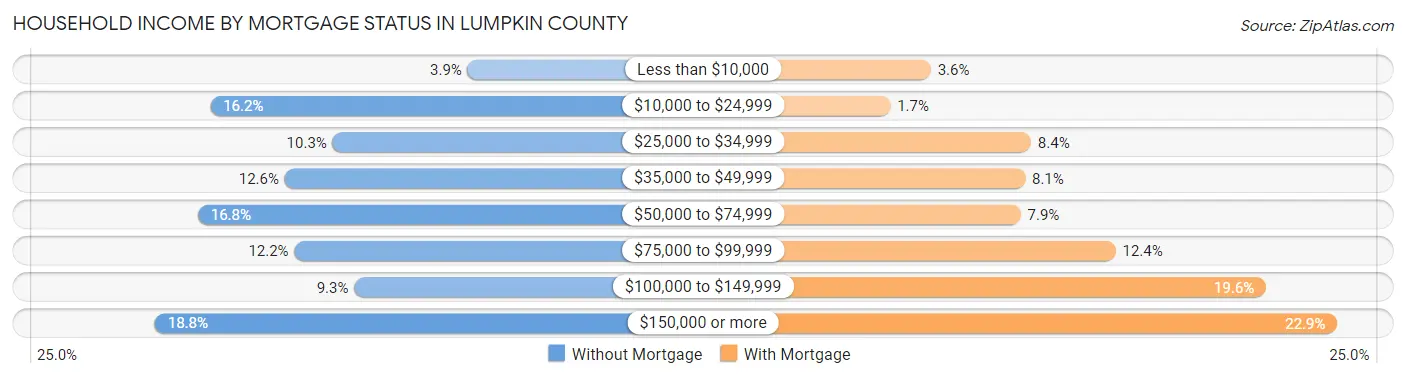
| Household Income | Without Mortgage | With Mortgage |
| Less than $10,000 | 145 (3.9%) | 182 (3.6%) |
| $10,000 to $24,999 | 601 (16.2%) | 84 (1.7%) |
| $25,000 to $34,999 | 384 (10.3%) | 424 (8.4%) |
| $35,000 to $49,999 | 469 (12.6%) | 410 (8.1%) |
| $50,000 to $74,999 | 623 (16.8%) | 399 (7.9%) |
| $75,000 to $99,999 | 452 (12.1%) | 629 (12.4%) |
| $100,000 to $149,999 | 346 (9.3%) | 993 (19.6%) |
| $150,000 or more | 699 (18.8%) | 1,165 (22.9%) |
| Total | 3,719 (100.0%) | 5,079 (100.0%) |
Property Value to Household Income Ratio in Lumpkin County
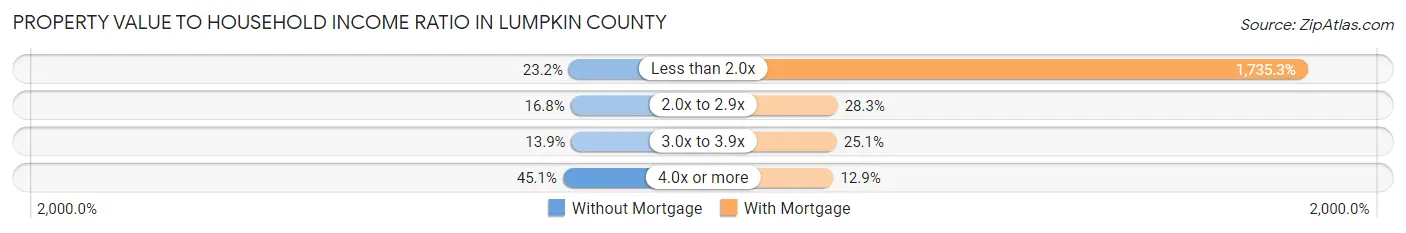
| Value-to-Income Ratio | Without Mortgage | With Mortgage |
| Less than 2.0x | 861 (23.2%) | 88,137 (1,735.3%) |
| 2.0x to 2.9x | 624 (16.8%) | 1,439 (28.3%) |
| 3.0x to 3.9x | 517 (13.9%) | 1,273 (25.1%) |
| 4.0x or more | 1,676 (45.1%) | 656 (12.9%) |
| Total | 3,719 (100.0%) | 5,079 (100.0%) |
Real Estate Taxes by Mortgage Status in Lumpkin County
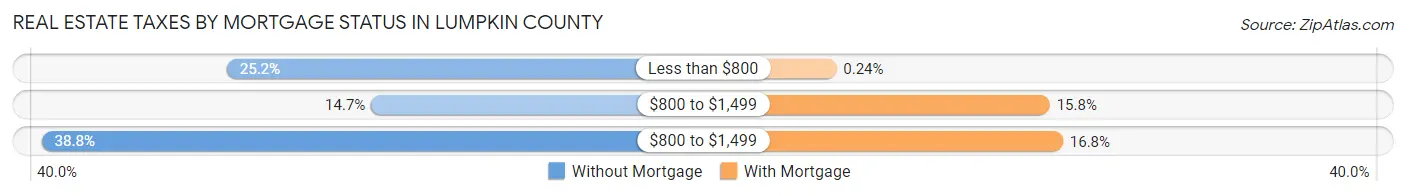
| Property Taxes | Without Mortgage | With Mortgage |
| Less than $800 | 938 (25.2%) | 12 (0.2%) |
| $800 to $1,499 | 546 (14.7%) | 804 (15.8%) |
| $800 to $1,499 | 1,441 (38.8%) | 853 (16.8%) |
| Total | 3,719 (100.0%) | 5,079 (100.0%) |
Health & Disability in Lumpkin County
Health Insurance Coverage by Age in Lumpkin County
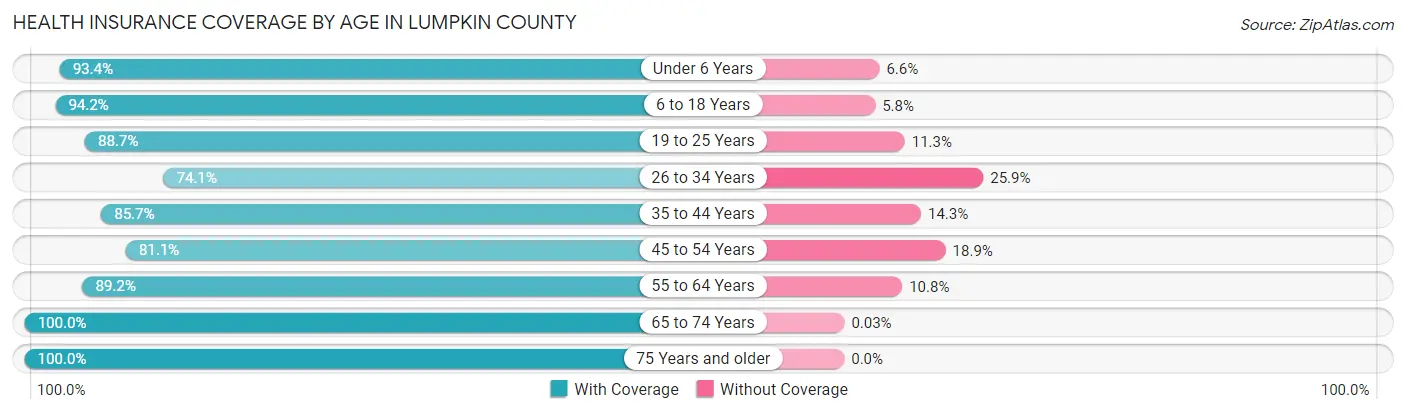
| Age Bracket | With Coverage | Without Coverage |
| Under 6 Years | 1,438 (93.4%) | 101 (6.6%) |
| 6 to 18 Years | 4,970 (94.2%) | 304 (5.8%) |
| 19 to 25 Years | 5,527 (88.7%) | 703 (11.3%) |
| 26 to 34 Years | 2,261 (74.1%) | 791 (25.9%) |
| 35 to 44 Years | 2,838 (85.7%) | 474 (14.3%) |
| 45 to 54 Years | 2,724 (81.1%) | 635 (18.9%) |
| 55 to 64 Years | 3,900 (89.2%) | 472 (10.8%) |
| 65 to 74 Years | 3,541 (100.0%) | 1 (0.0%) |
| 75 Years and older | 2,365 (100.0%) | 0 (0.0%) |
| Total | 29,564 (89.5%) | 3,481 (10.5%) |
Health Insurance Coverage by Citizenship Status in Lumpkin County
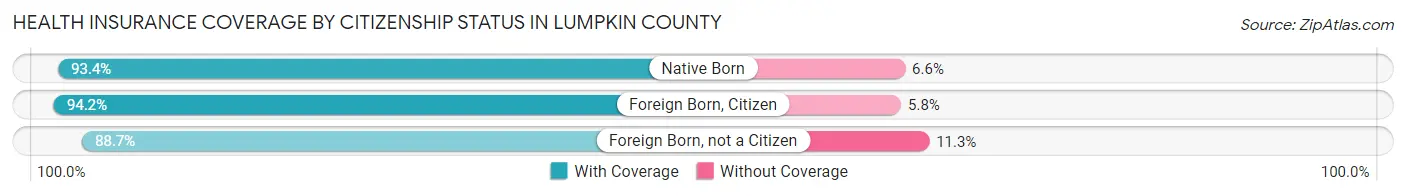
| Citizenship Status | With Coverage | Without Coverage |
| Native Born | 1,438 (93.4%) | 101 (6.6%) |
| Foreign Born, Citizen | 4,970 (94.2%) | 304 (5.8%) |
| Foreign Born, not a Citizen | 5,527 (88.7%) | 703 (11.3%) |
Health Insurance Coverage by Household Income in Lumpkin County
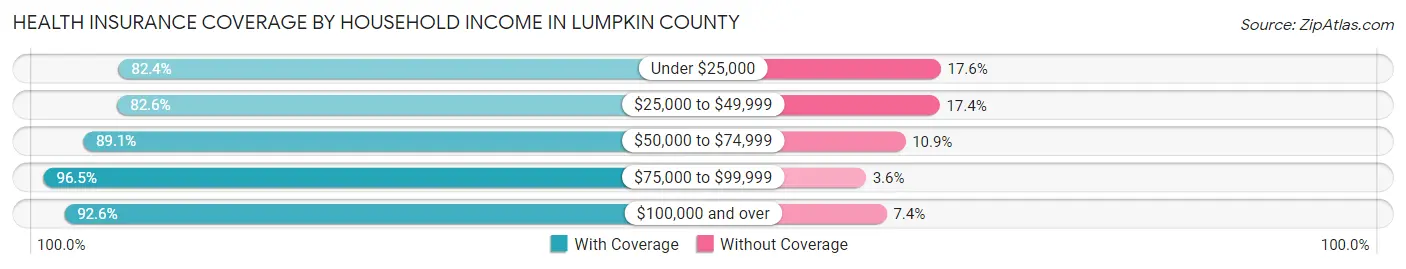
| Household Income | With Coverage | Without Coverage |
| Under $25,000 | 3,992 (82.4%) | 851 (17.6%) |
| $25,000 to $49,999 | 4,737 (82.6%) | 996 (17.4%) |
| $50,000 to $74,999 | 3,681 (89.1%) | 452 (10.9%) |
| $75,000 to $99,999 | 4,595 (96.5%) | 169 (3.5%) |
| $100,000 and over | 10,909 (92.6%) | 875 (7.4%) |
Public vs Private Health Insurance Coverage by Age in Lumpkin County
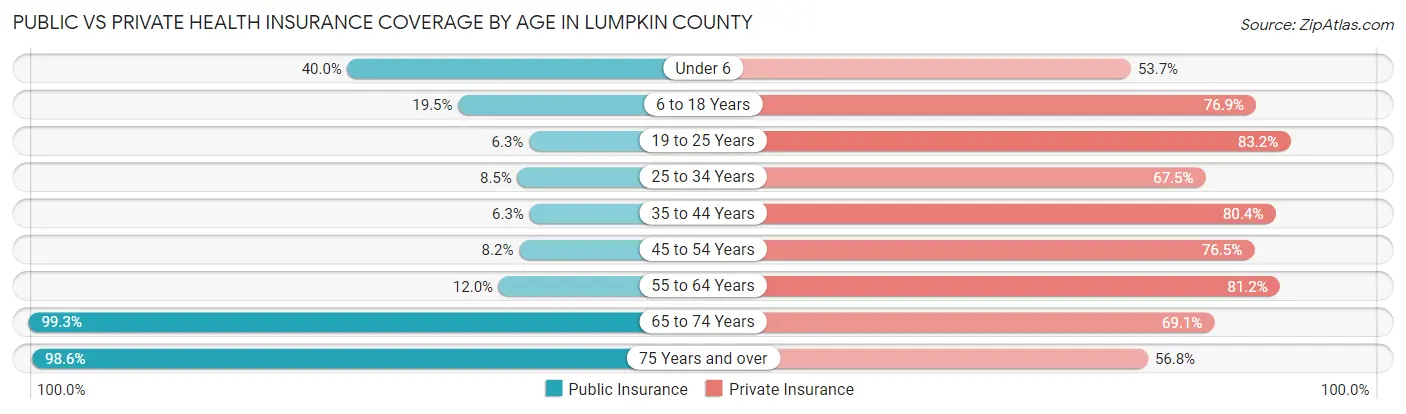
| Age Bracket | Public Insurance | Private Insurance |
| Under 6 | 616 (40.0%) | 826 (53.7%) |
| 6 to 18 Years | 1,028 (19.5%) | 4,054 (76.9%) |
| 19 to 25 Years | 395 (6.3%) | 5,183 (83.2%) |
| 25 to 34 Years | 259 (8.5%) | 2,059 (67.5%) |
| 35 to 44 Years | 207 (6.2%) | 2,664 (80.4%) |
| 45 to 54 Years | 275 (8.2%) | 2,570 (76.5%) |
| 55 to 64 Years | 523 (12.0%) | 3,552 (81.2%) |
| 65 to 74 Years | 3,516 (99.3%) | 2,448 (69.1%) |
| 75 Years and over | 2,332 (98.6%) | 1,344 (56.8%) |
| Total | 9,151 (27.7%) | 24,700 (74.8%) |
Disability Status by Sex by Age in Lumpkin County
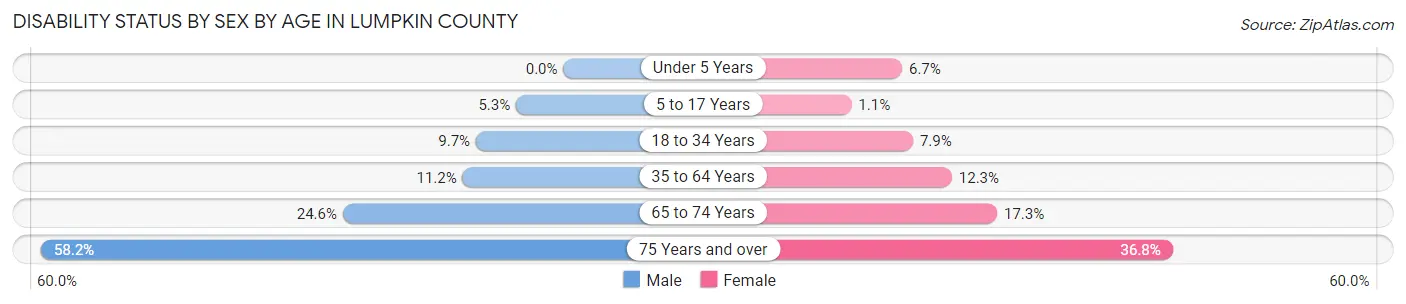
| Age Bracket | Male | Female |
| Under 5 Years | 0 (0.0%) | 43 (6.7%) |
| 5 to 17 Years | 118 (5.3%) | 23 (1.1%) |
| 18 to 34 Years | 510 (9.7%) | 405 (7.9%) |
| 35 to 64 Years | 587 (11.2%) | 713 (12.3%) |
| 65 to 74 Years | 407 (24.6%) | 326 (17.3%) |
| 75 Years and over | 569 (58.2%) | 511 (36.8%) |
Disability Class by Sex by Age in Lumpkin County
Disability Class: Hearing Difficulty
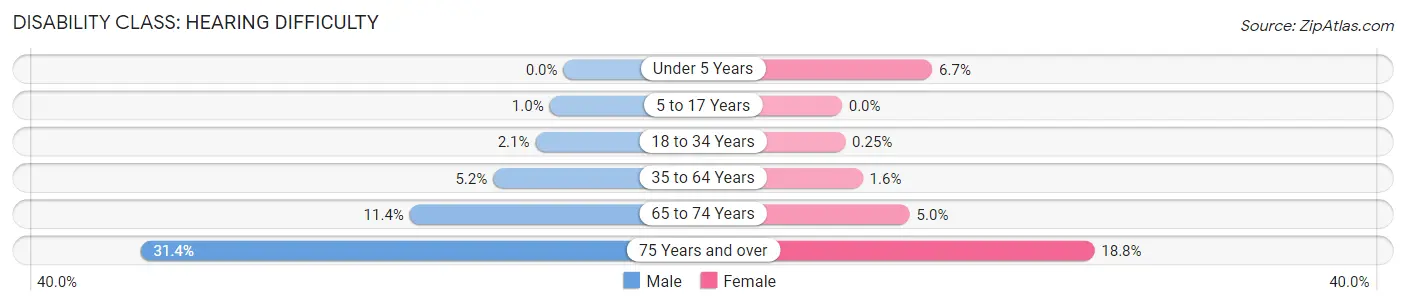
| Age Bracket | Male | Female |
| Under 5 Years | 0 (0.0%) | 43 (6.7%) |
| 5 to 17 Years | 23 (1.0%) | 0 (0.0%) |
| 18 to 34 Years | 109 (2.1%) | 13 (0.3%) |
| 35 to 64 Years | 273 (5.2%) | 90 (1.5%) |
| 65 to 74 Years | 189 (11.4%) | 95 (5.0%) |
| 75 Years and over | 307 (31.4%) | 260 (18.8%) |
Disability Class: Vision Difficulty
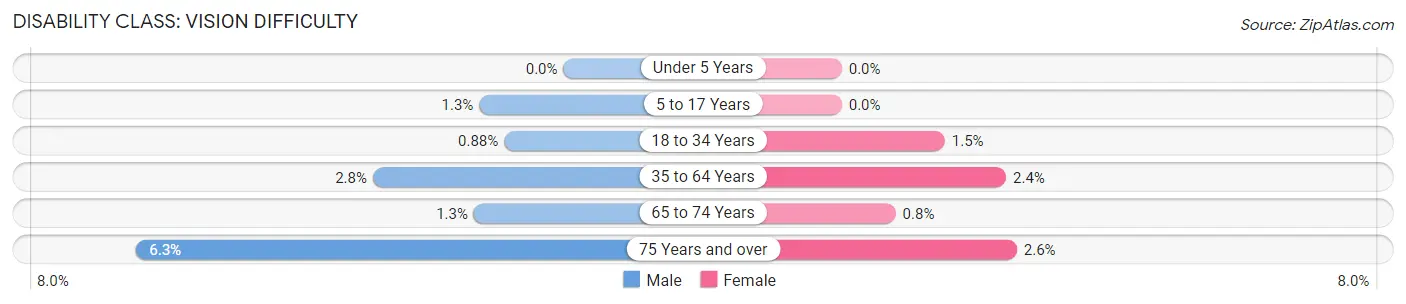
| Age Bracket | Male | Female |
| Under 5 Years | 0 (0.0%) | 0 (0.0%) |
| 5 to 17 Years | 28 (1.3%) | 0 (0.0%) |
| 18 to 34 Years | 46 (0.9%) | 78 (1.5%) |
| 35 to 64 Years | 148 (2.8%) | 142 (2.4%) |
| 65 to 74 Years | 22 (1.3%) | 15 (0.8%) |
| 75 Years and over | 62 (6.3%) | 36 (2.6%) |
Disability Class: Cognitive Difficulty
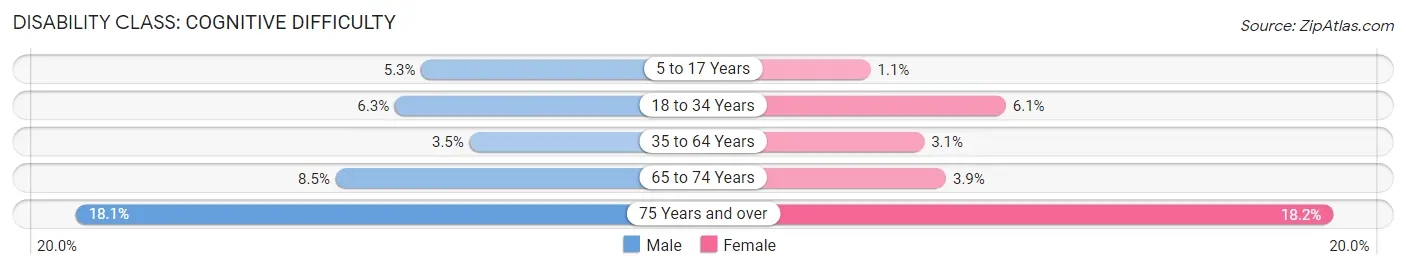
| Age Bracket | Male | Female |
| 5 to 17 Years | 118 (5.3%) | 23 (1.1%) |
| 18 to 34 Years | 327 (6.2%) | 311 (6.1%) |
| 35 to 64 Years | 182 (3.5%) | 178 (3.1%) |
| 65 to 74 Years | 140 (8.5%) | 73 (3.9%) |
| 75 Years and over | 177 (18.1%) | 253 (18.2%) |
Disability Class: Ambulatory Difficulty
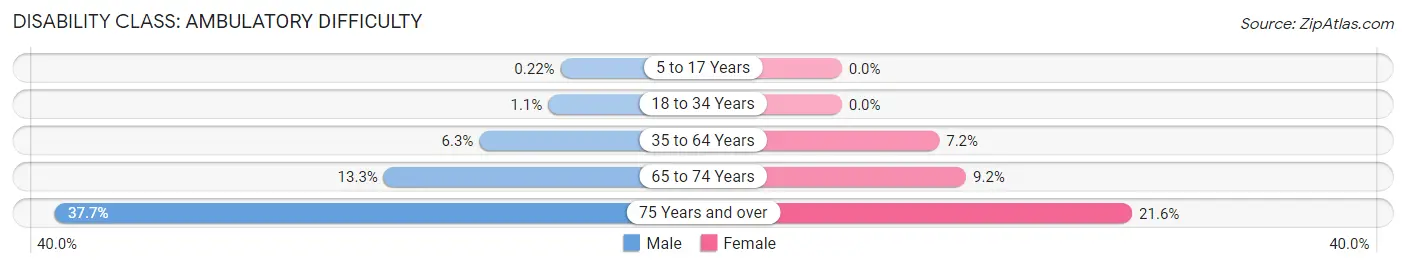
| Age Bracket | Male | Female |
| 5 to 17 Years | 5 (0.2%) | 0 (0.0%) |
| 18 to 34 Years | 59 (1.1%) | 0 (0.0%) |
| 35 to 64 Years | 327 (6.2%) | 421 (7.2%) |
| 65 to 74 Years | 221 (13.3%) | 174 (9.2%) |
| 75 Years and over | 369 (37.7%) | 299 (21.6%) |
Disability Class: Self-Care Difficulty
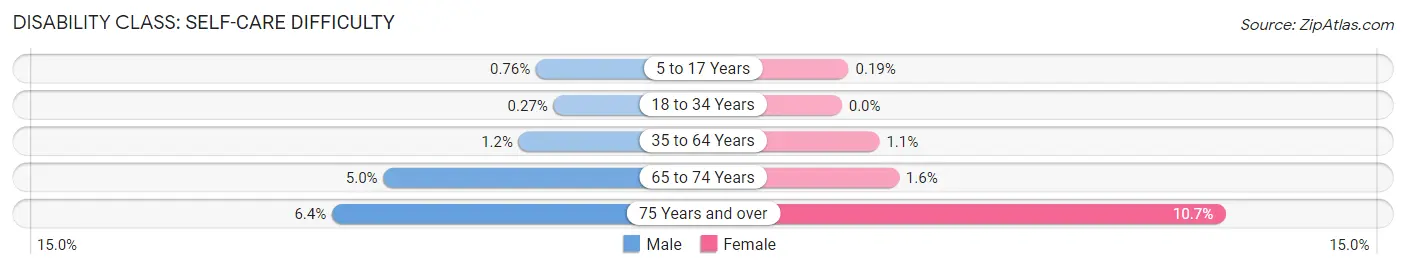
| Age Bracket | Male | Female |
| 5 to 17 Years | 17 (0.8%) | 4 (0.2%) |
| 18 to 34 Years | 14 (0.3%) | 0 (0.0%) |
| 35 to 64 Years | 65 (1.2%) | 61 (1.1%) |
| 65 to 74 Years | 83 (5.0%) | 30 (1.6%) |
| 75 Years and over | 63 (6.4%) | 148 (10.7%) |
Technology Access in Lumpkin County
Computing Device Access in Lumpkin County
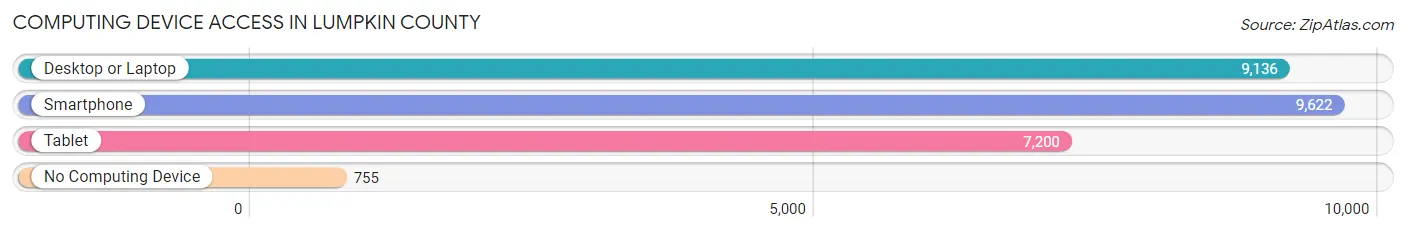
| Device Type | # Households | % Households |
| Desktop or Laptop | 9,136 | 79.8% |
| Smartphone | 9,622 | 84.0% |
| Tablet | 7,200 | 62.9% |
| No Computing Device | 755 | 6.6% |
| Total | 11,450 | 100.0% |
Internet Access in Lumpkin County
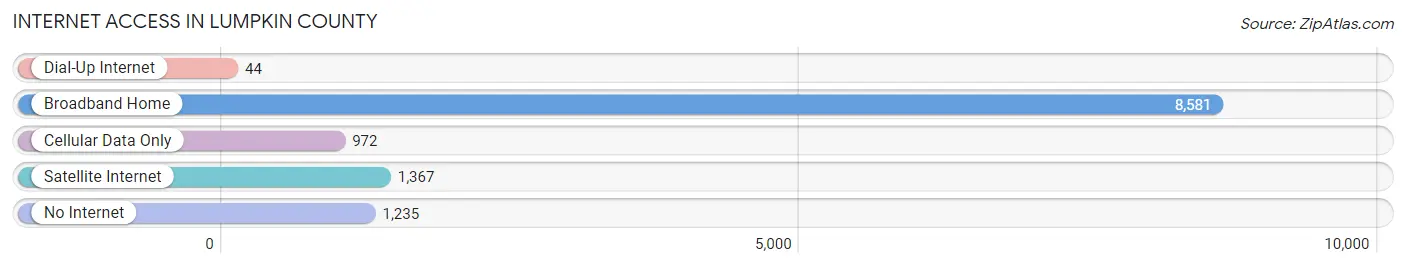
| Internet Type | # Households | % Households |
| Dial-Up Internet | 44 | 0.4% |
| Broadband Home | 8,581 | 74.9% |
| Cellular Data Only | 972 | 8.5% |
| Satellite Internet | 1,367 | 11.9% |
| No Internet | 1,235 | 10.8% |
| Total | 11,450 | 100.0% |
Lumpkin County Summary
Lumpkin County is located in the north-central part of the state of Georgia, in the foothills of the Blue Ridge Mountains. It is bordered by Dawson, Forsyth, Hall, and White counties. The county seat is Dahlonega, and the county is named for Wilson Lumpkin, who served as Governor of Georgia from 1831 to 1835.
Geography
Lumpkin County covers an area of approximately 250 square miles. The terrain is mostly mountainous, with elevations ranging from 1,000 to 3,000 feet. The county is drained by the Etowah and Chestatee Rivers, as well as several smaller streams. The county is home to several state parks, including Amicalola Falls State Park, Vogel State Park, and Unicoi State Park.
Demographics
As of the 2010 census, Lumpkin County had a population of 29,966. The racial makeup of the county was 90.2% White, 5.3% Black or African American, 0.5% Native American, 0.7% Asian, 0.1% Pacific Islander, 1.7% from other races, and 1.5% from two or more races. Hispanic or Latino of any race were 4.2% of the population.
Economy
Lumpkin County’s economy is largely based on agriculture and tourism. The county is home to several wineries, and is known for its apple orchards. The county is also home to several manufacturing companies, including a carpet mill and a furniture factory. The county is also home to several state parks, which attract visitors from all over the country.
History
Lumpkin County was created in 1832 from parts of Cherokee, Hall, and Habersham counties. The county was named for Wilson Lumpkin, who served as Governor of Georgia from 1831 to 1835. The county seat was originally located in the town of Auraria, but was moved to Dahlonega in 1833.
In 1828, gold was discovered in the area, and the town of Dahlonega quickly became a center of the gold rush. The town was home to the first U.S. Mint outside of Philadelphia, and the gold rush brought thousands of people to the area. The gold rush ended in the late 1840s, but the town of Dahlonega remains a popular tourist destination.
In the late 19th century, the county was home to several textile mills, which provided employment for many of the county’s residents. The county was also home to several sawmills and gristmills, which provided lumber and grain for the local economy.
Today, Lumpkin County is a popular tourist destination, with several wineries, state parks, and other attractions. The county is also home to several manufacturing companies, and is a popular retirement destination.
Common Questions
What is Per Capita Income in Lumpkin County?
Per Capita income in Lumpkin County is $33,322.
What is the Median Family Income in Lumpkin County?
Median Family Income in Lumpkin County is $81,180.
What is the Median Household income in Lumpkin County?
Median Household Income in Lumpkin County is $67,592.
What is Income or Wage Gap in Lumpkin County?
Income or Wage Gap in Lumpkin County is 14.3%.
Women in Lumpkin County earn 85.7 cents for every dollar earned by a man.
What is Family Income Deficit in Lumpkin County?
Family Income Deficit in Lumpkin County is $8,370.
Families that are below poverty line in Lumpkin County earn $8,370 less on average than the poverty threshold level.
What is Inequality or Gini Index in Lumpkin County?
Inequality or Gini Index in Lumpkin County is 0.50.
What is the Total Population of Lumpkin County?
Total Population of Lumpkin County is 33,405.
What is the Total Male Population of Lumpkin County?
Total Male Population of Lumpkin County is 16,346.
What is the Total Female Population of Lumpkin County?
Total Female Population of Lumpkin County is 17,059.
What is the Ratio of Males per 100 Females in Lumpkin County?
There are 95.82 Males per 100 Females in Lumpkin County.
What is the Ratio of Females per 100 Males in Lumpkin County?
There are 104.36 Females per 100 Males in Lumpkin County.
What is the Median Population Age in Lumpkin County?
Median Population Age in Lumpkin County is 35.9 Years.
What is the Average Family Size in Lumpkin County
Average Family Size in Lumpkin County is 3.3 People.
What is the Average Household Size in Lumpkin County
Average Household Size in Lumpkin County is 2.7 People.
How Large is the Labor Force in Lumpkin County?
There are 16,289 People in the Labor Forcein in Lumpkin County.
What is the Percentage of People in the Labor Force in Lumpkin County?
57.2% of People are in the Labor Force in Lumpkin County.
What is the Unemployment Rate in Lumpkin County?
Unemployment Rate in Lumpkin County is 5.1%.