Long County, GA Map & Demographics
Long County Map
Long County Overview
$26,995
PER CAPITA INCOME
$67,071
AVG FAMILY INCOME
$56,819
AVG HOUSEHOLD INCOME
38.6%
WAGE / INCOME GAP [ % ]
61.4¢/ $1
WAGE / INCOME GAP [ $ ]
$7,962
FAMILY INCOME DEFICIT
0.41
INEQUALITY / GINI INDEX
16,804
TOTAL POPULATION
8,679
MALE POPULATION
8,125
FEMALE POPULATION
106.82
MALES / 100 FEMALES
93.62
FEMALES / 100 MALES
34.4
MEDIAN AGE
3.4
AVG FAMILY SIZE
3.0
AVG HOUSEHOLD SIZE
7,881
LABOR FORCE [ PEOPLE ]
61.9%
PERCENT IN LABOR FORCE
4.5%
UNEMPLOYMENT RATE
Long County Area Codes
Income in Long County
Income Overview in Long County
Per Capita Income in Long County is $26,995, while median incomes of families and households are $67,071 and $56,819 respectively.
| Characteristic | Number | Measure |
| Per Capita Income | 16,804 | $26,995 |
| Median Family Income | 3,846 | $67,071 |
| Mean Family Income | 3,846 | $81,050 |
| Median Household Income | 5,547 | $56,819 |
| Mean Household Income | 5,547 | $69,881 |
| Income Deficit | 3,846 | $7,962 |
| Wage / Income Gap (%) | 16,804 | 38.62% |
| Wage / Income Gap ($) | 16,804 | 61.38¢ per $1 |
| Gini / Inequality Index | 16,804 | 0.41 |
Earnings by Sex in Long County
Average Earnings in Long County are $37,738, $46,025 for men and $28,251 for women, a difference of 38.6%.
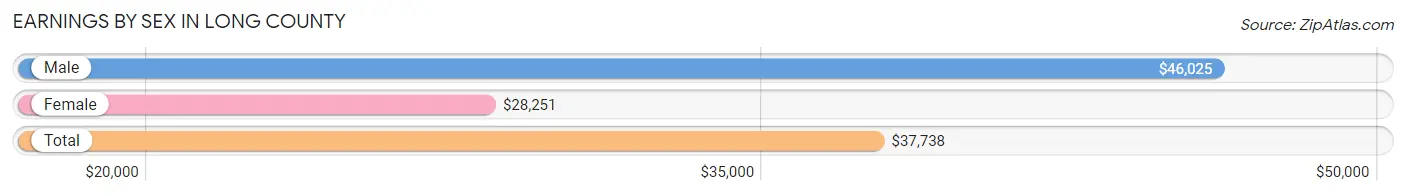
| Sex | Number | Average Earnings |
| Male | 4,751 (59.0%) | $46,025 |
| Female | 3,305 (41.0%) | $28,251 |
| Total | 8,056 (100.0%) | $37,738 |
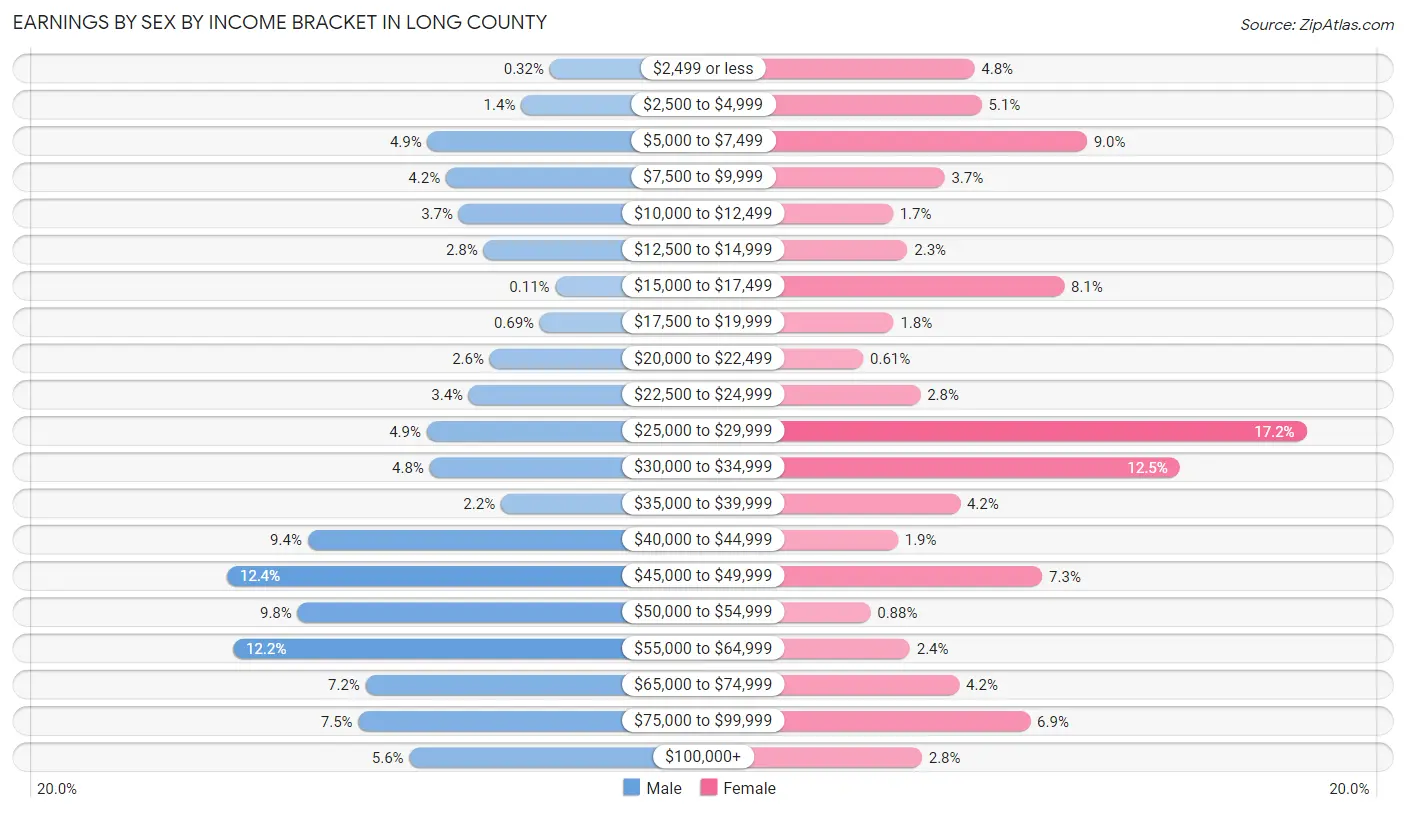
Earnings by Sex by Income Bracket in Long County
The most common earnings brackets in Long County are $45,000 to $49,999 for men (590 | 12.4%) and $25,000 to $29,999 for women (569 | 17.2%).
| Income | Male | Female |
| $2,499 or less | 15 (0.3%) | 158 (4.8%) |
| $2,500 to $4,999 | 66 (1.4%) | 167 (5.1%) |
| $5,000 to $7,499 | 233 (4.9%) | 297 (9.0%) |
| $7,500 to $9,999 | 200 (4.2%) | 121 (3.7%) |
| $10,000 to $12,499 | 177 (3.7%) | 57 (1.7%) |
| $12,500 to $14,999 | 133 (2.8%) | 75 (2.3%) |
| $15,000 to $17,499 | 5 (0.1%) | 269 (8.1%) |
| $17,500 to $19,999 | 33 (0.7%) | 58 (1.8%) |
| $20,000 to $22,499 | 122 (2.6%) | 20 (0.6%) |
| $22,500 to $24,999 | 159 (3.4%) | 91 (2.8%) |
| $25,000 to $29,999 | 234 (4.9%) | 569 (17.2%) |
| $30,000 to $34,999 | 229 (4.8%) | 412 (12.5%) |
| $35,000 to $39,999 | 102 (2.1%) | 140 (4.2%) |
| $40,000 to $44,999 | 446 (9.4%) | 63 (1.9%) |
| $45,000 to $49,999 | 590 (12.4%) | 242 (7.3%) |
| $50,000 to $54,999 | 464 (9.8%) | 29 (0.9%) |
| $55,000 to $64,999 | 579 (12.2%) | 78 (2.4%) |
| $65,000 to $74,999 | 343 (7.2%) | 139 (4.2%) |
| $75,000 to $99,999 | 356 (7.5%) | 227 (6.9%) |
| $100,000+ | 265 (5.6%) | 93 (2.8%) |
| Total | 4,751 (100.0%) | 3,305 (100.0%) |
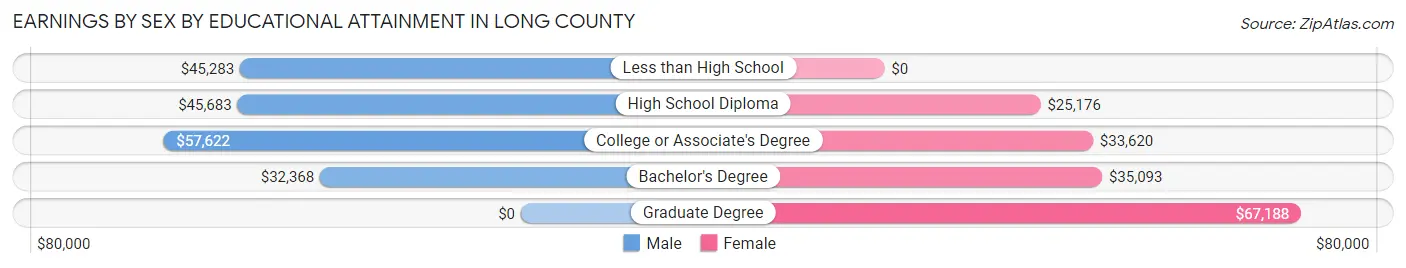
Earnings by Sex by Educational Attainment in Long County
Average earnings in Long County are $47,191 for men and $29,805 for women, a difference of 36.8%. Men with an educational attainment of college or associate's degree enjoy the highest average annual earnings of $57,622, while those with bachelor's degree education earn the least with $32,368. Women with an educational attainment of graduate degree earn the most with the average annual earnings of $67,188, while those with high school diploma education have the smallest earnings of $25,176.
| Educational Attainment | Male Income | Female Income |
| Less than High School | $45,283 | $0 |
| High School Diploma | $45,683 | $25,176 |
| College or Associate's Degree | $57,622 | $33,620 |
| Bachelor's Degree | $32,368 | $35,093 |
| Graduate Degree | - | - |
| Total | $47,191 | $29,805 |
Family Income in Long County
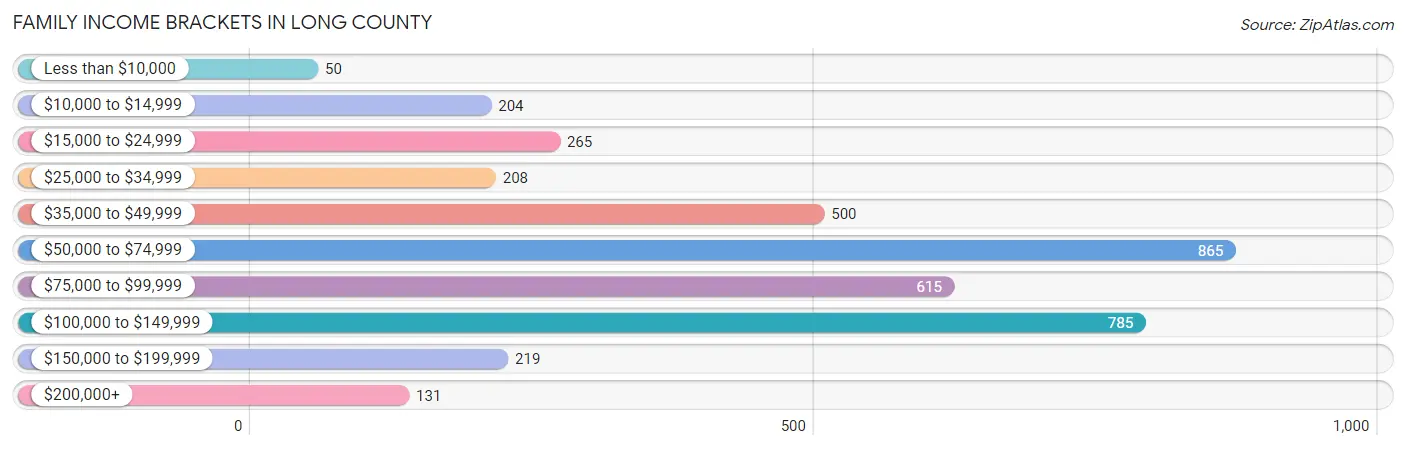
Family Income Brackets in Long County
According to the Long County family income data, there are 865 families falling into the $50,000 to $74,999 income range, which is the most common income bracket and makes up 22.5% of all families. Conversely, the less than $10,000 income bracket is the least frequent group with only 50 families (1.3%) belonging to this category.
| Income Bracket | # Families | % Families |
| Less than $10,000 | 50 | 1.3% |
| $10,000 to $14,999 | 204 | 5.3% |
| $15,000 to $24,999 | 265 | 6.9% |
| $25,000 to $34,999 | 208 | 5.4% |
| $35,000 to $49,999 | 500 | 13.0% |
| $50,000 to $74,999 | 865 | 22.5% |
| $75,000 to $99,999 | 615 | 16.0% |
| $100,000 to $149,999 | 785 | 20.4% |
| $150,000 to $199,999 | 219 | 5.7% |
| $200,000+ | 131 | 3.4% |
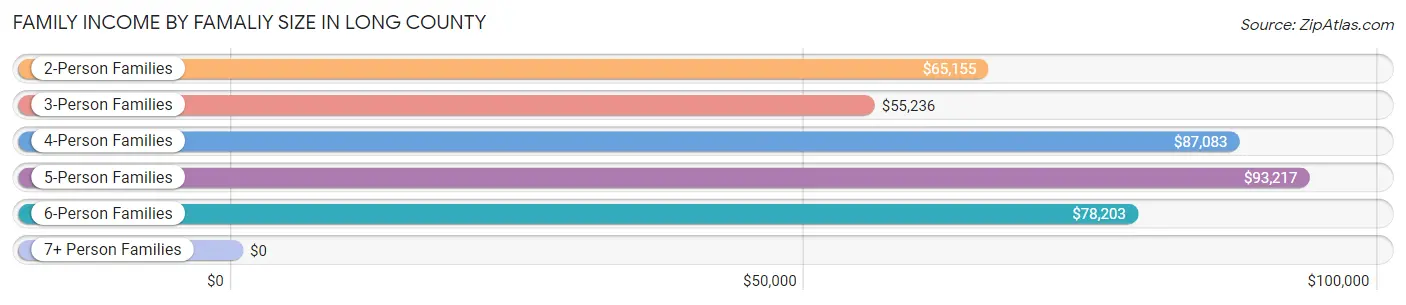
Family Income by Famaliy Size in Long County
5-person families (287 | 7.5%) account for the highest median family income in Long County with $93,217 per family, while 2-person families (1,726 | 44.9%) have the highest median income of $32,578 per family member.
| Income Bracket | # Families | Median Income |
| 2-Person Families | 1,726 (44.9%) | $65,155 |
| 3-Person Families | 768 (20.0%) | $55,236 |
| 4-Person Families | 784 (20.4%) | $87,083 |
| 5-Person Families | 287 (7.5%) | $93,217 |
| 6-Person Families | 267 (6.9%) | $78,203 |
| 7+ Person Families | 14 (0.4%) | $0 |
| Total | 3,846 (100.0%) | $67,071 |
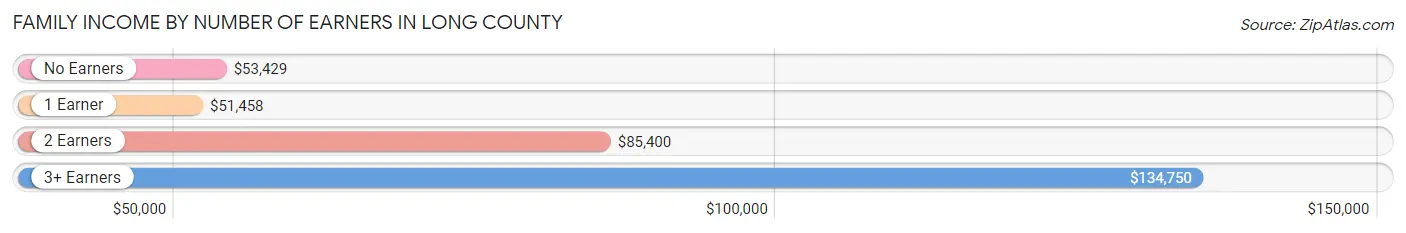
Family Income by Number of Earners in Long County
The median family income in Long County is $67,071, with families comprising 3+ earners (214) having the highest median family income of $134,750, while families with 1 earner (1,670) have the lowest median family income of $51,458, accounting for 5.6% and 43.4% of families, respectively.
| Number of Earners | # Families | Median Income |
| No Earners | 511 (13.3%) | $53,429 |
| 1 Earner | 1,670 (43.4%) | $51,458 |
| 2 Earners | 1,451 (37.7%) | $85,400 |
| 3+ Earners | 214 (5.6%) | $134,750 |
| Total | 3,846 (100.0%) | $67,071 |
Household Income in Long County
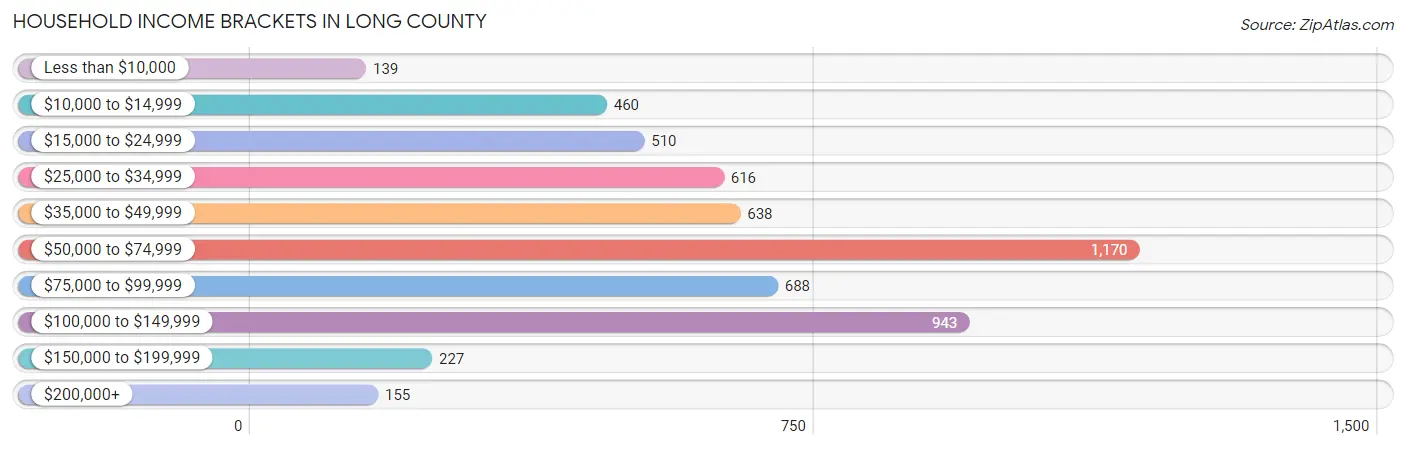
Household Income Brackets in Long County
With 1,170 households falling in the category, the $50,000 to $74,999 income range is the most frequent in Long County, accounting for 21.1% of all households. In contrast, only 139 households (2.5%) fall into the less than $10,000 income bracket, making it the least populous group.
| Income Bracket | # Households | % Households |
| Less than $10,000 | 139 | 2.5% |
| $10,000 to $14,999 | 460 | 8.3% |
| $15,000 to $24,999 | 510 | 9.2% |
| $25,000 to $34,999 | 616 | 11.1% |
| $35,000 to $49,999 | 638 | 11.5% |
| $50,000 to $74,999 | 1,170 | 21.1% |
| $75,000 to $99,999 | 688 | 12.4% |
| $100,000 to $149,999 | 943 | 17.0% |
| $150,000 to $199,999 | 227 | 4.1% |
| $200,000+ | 155 | 2.8% |
Household Income by Householder Age in Long County
The median household income in Long County is $56,819, with the highest median household income of $63,864 found in the 25 to 44 years age bracket for the primary householder. A total of 2,342 households (42.2%) fall into this category. Meanwhile, the 45 to 64 years age bracket for the primary householder has the lowest median household income of $45,278, with 2,258 households (40.7%) in this group.
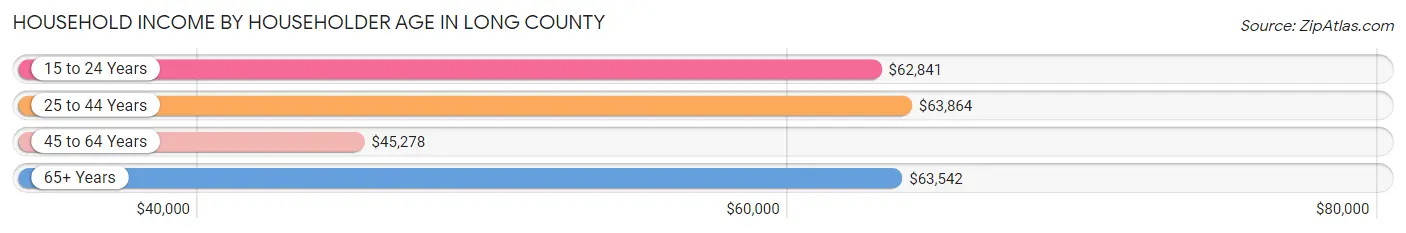
| Income Bracket | # Households | Median Income |
| 15 to 24 Years | 121 (2.2%) | $62,841 |
| 25 to 44 Years | 2,342 (42.2%) | $63,864 |
| 45 to 64 Years | 2,258 (40.7%) | $45,278 |
| 65+ Years | 826 (14.9%) | $63,542 |
| Total | 5,547 (100.0%) | $56,819 |
Poverty in Long County
Income Below Poverty by Sex and Age in Long County
With 11.1% poverty level for males and 20.7% for females among the residents of Long County, 6 to 11 year old males and 16 and 17 year old females are the most vulnerable to poverty, with 260 males (26.0%) and 107 females (45.2%) in their respective age groups living below the poverty level.
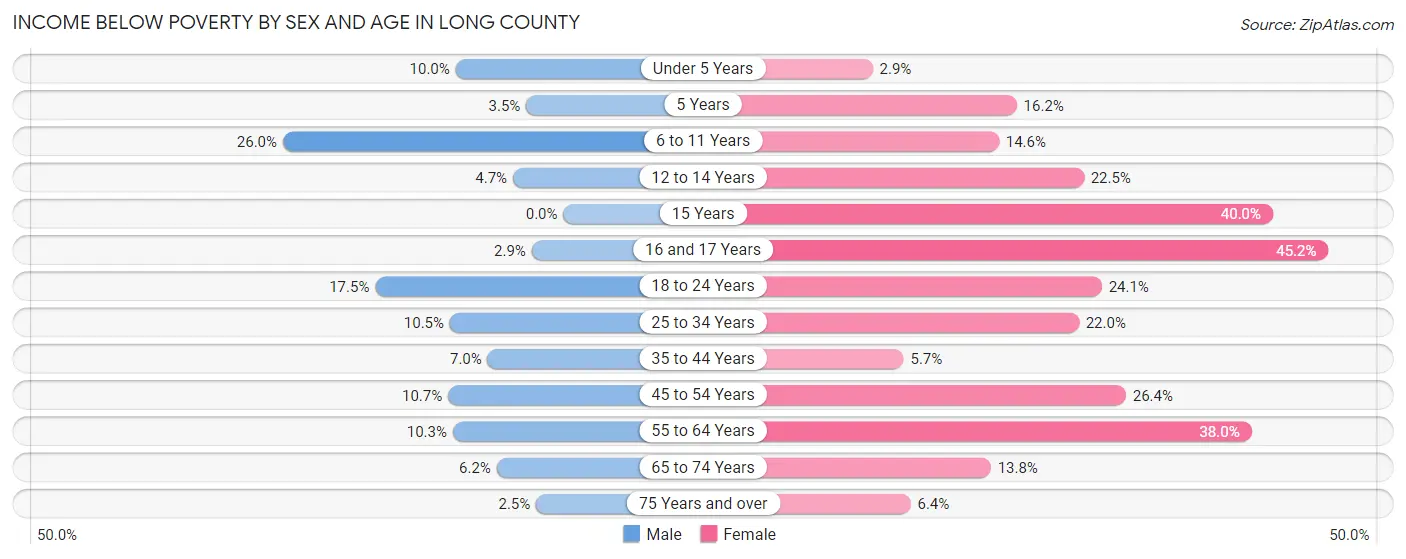
| Age Bracket | Male | Female |
| Under 5 Years | 57 (10.0%) | 12 (2.9%) |
| 5 Years | 4 (3.5%) | 25 (16.2%) |
| 6 to 11 Years | 260 (26.0%) | 102 (14.6%) |
| 12 to 14 Years | 16 (4.7%) | 88 (22.5%) |
| 15 Years | 0 (0.0%) | 30 (40.0%) |
| 16 and 17 Years | 9 (2.9%) | 107 (45.2%) |
| 18 to 24 Years | 118 (17.5%) | 171 (24.1%) |
| 25 to 34 Years | 142 (10.5%) | 272 (22.0%) |
| 35 to 44 Years | 100 (7.0%) | 66 (5.7%) |
| 45 to 54 Years | 102 (10.7%) | 257 (26.4%) |
| 55 to 64 Years | 98 (10.3%) | 433 (38.0%) |
| 65 to 74 Years | 28 (6.2%) | 77 (13.8%) |
| 75 Years and over | 5 (2.5%) | 15 (6.4%) |
| Total | 939 (11.1%) | 1,655 (20.7%) |
Income Above Poverty by Sex and Age in Long County
According to the poverty statistics in Long County, males aged 15 years and females aged under 5 years are the age groups that are most secure financially, with 100.0% of males and 97.1% of females in these age groups living above the poverty line.
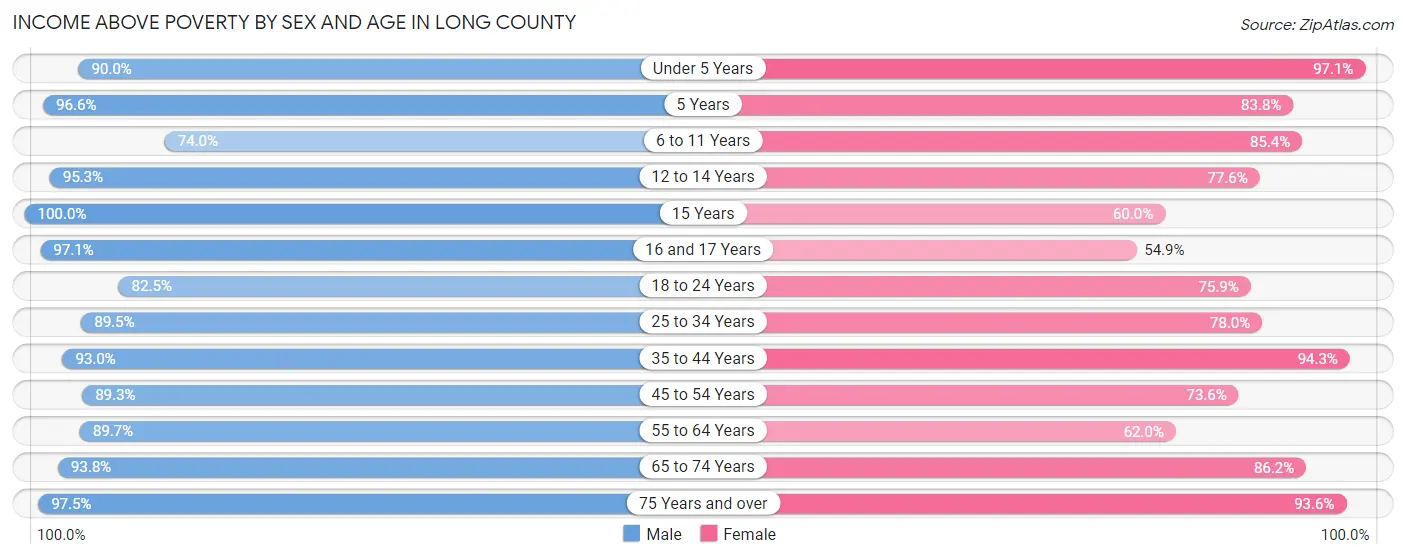
| Age Bracket | Male | Female |
| Under 5 Years | 513 (90.0%) | 408 (97.1%) |
| 5 Years | 112 (96.6%) | 129 (83.8%) |
| 6 to 11 Years | 739 (74.0%) | 598 (85.4%) |
| 12 to 14 Years | 326 (95.3%) | 304 (77.5%) |
| 15 Years | 130 (100.0%) | 45 (60.0%) |
| 16 and 17 Years | 297 (97.1%) | 130 (54.8%) |
| 18 to 24 Years | 558 (82.5%) | 538 (75.9%) |
| 25 to 34 Years | 1,206 (89.5%) | 965 (78.0%) |
| 35 to 44 Years | 1,323 (93.0%) | 1,086 (94.3%) |
| 45 to 54 Years | 851 (89.3%) | 718 (73.6%) |
| 55 to 64 Years | 857 (89.7%) | 706 (62.0%) |
| 65 to 74 Years | 424 (93.8%) | 480 (86.2%) |
| 75 Years and over | 193 (97.5%) | 220 (93.6%) |
| Total | 7,529 (88.9%) | 6,327 (79.3%) |
Income Below Poverty Among Married-Couple Families in Long County
The poverty statistics for married-couple families in Long County show that 5.0% or 138 of the total 2,764 families live below the poverty line. Families with 3 or 4 children have the highest poverty rate of 7.8%, comprising of 41 families. On the other hand, families with 5 or more children have the lowest poverty rate of 0.0%, which includes 0 families.
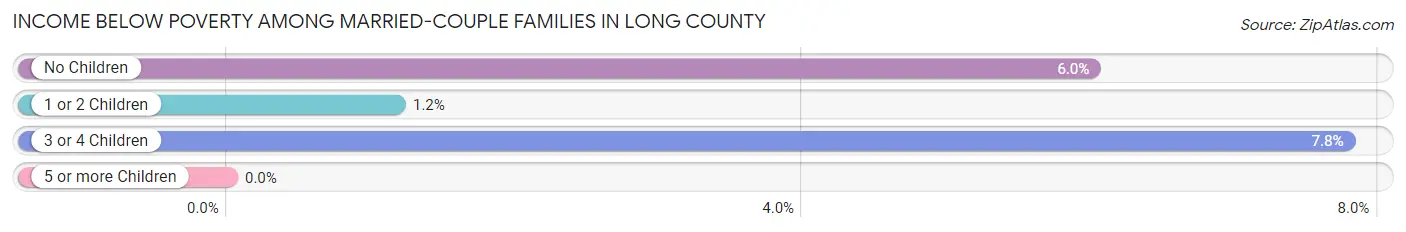
| Children | Above Poverty | Below Poverty |
| No Children | 1,376 (94.0%) | 88 (6.0%) |
| 1 or 2 Children | 762 (98.8%) | 9 (1.2%) |
| 3 or 4 Children | 486 (92.2%) | 41 (7.8%) |
| 5 or more Children | 2 (100.0%) | 0 (0.0%) |
| Total | 2,626 (95.0%) | 138 (5.0%) |
Income Below Poverty Among Single-Parent Households in Long County
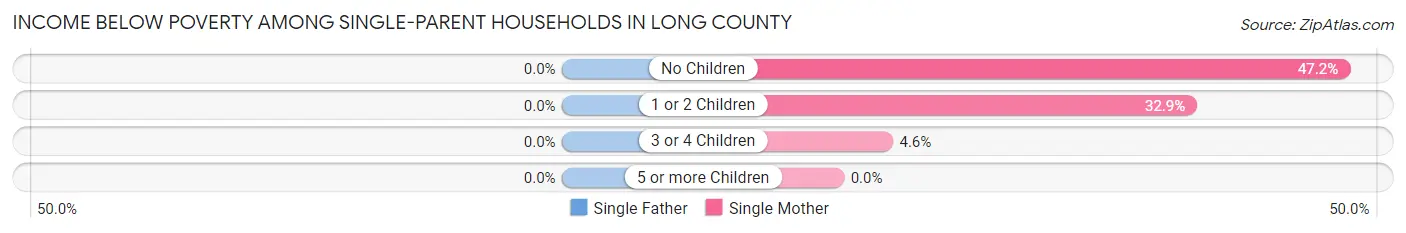
| Children | Single Father | Single Mother |
| No Children | 0 (0.0%) | 116 (47.1%) |
| 1 or 2 Children | 0 (0.0%) | 131 (32.9%) |
| 3 or 4 Children | 0 (0.0%) | 4 (4.5%) |
| 5 or more Children | 0 (0.0%) | 0 (0.0%) |
| Total | 0 (0.0%) | 251 (34.3%) |
Income Below Poverty Among Married-Couple vs Single-Parent Households in Long County
The poverty data for Long County shows that 138 of the married-couple family households (5.0%) and 251 of the single-parent households (23.2%) are living below the poverty level. Within the married-couple family households, those with 3 or 4 children have the highest poverty rate, with 41 households (7.8%) falling below the poverty line. Among the single-parent households, those with no children have the highest poverty rate, with 116 household (26.0%) living below poverty.
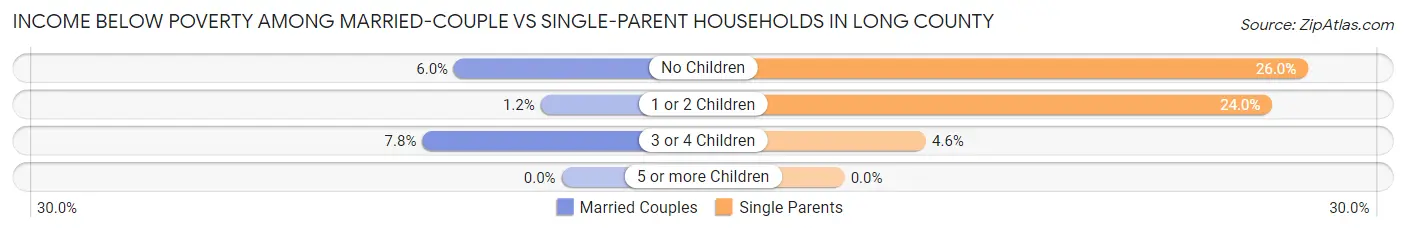
| Children | Married-Couple Families | Single-Parent Households |
| No Children | 88 (6.0%) | 116 (26.0%) |
| 1 or 2 Children | 9 (1.2%) | 131 (23.9%) |
| 3 or 4 Children | 41 (7.8%) | 4 (4.5%) |
| 5 or more Children | 0 (0.0%) | 0 (0.0%) |
| Total | 138 (5.0%) | 251 (23.2%) |
Race in Long County
The most populous races in Long County are White / Caucasian (9,781 | 58.2%), Black / African American (3,966 | 23.6%), and Hispanic or Latino (1,965 | 11.7%).
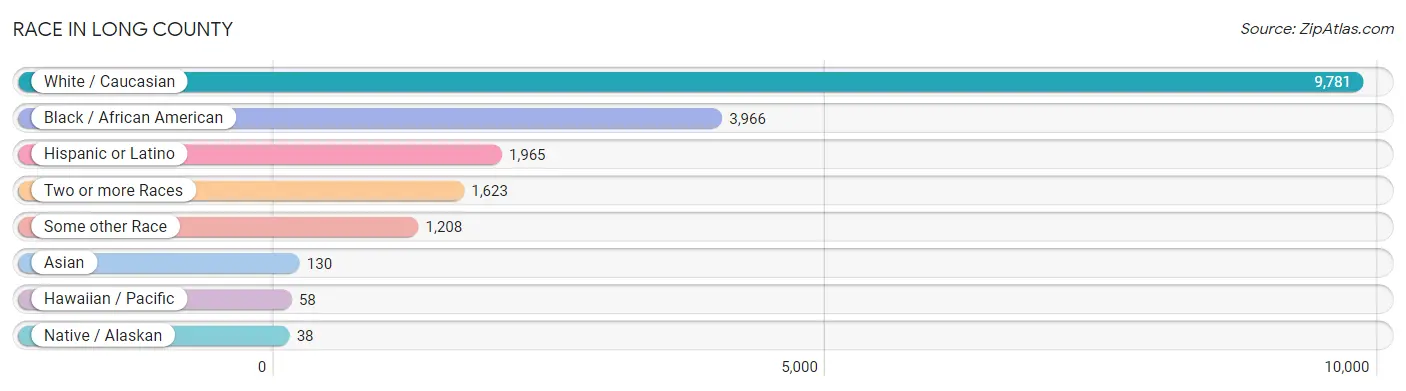
| Race | # Population | % Population |
| Asian | 130 | 0.8% |
| Black / African American | 3,966 | 23.6% |
| Hawaiian / Pacific | 58 | 0.4% |
| Hispanic or Latino | 1,965 | 11.7% |
| Native / Alaskan | 38 | 0.2% |
| White / Caucasian | 9,781 | 58.2% |
| Two or more Races | 1,623 | 9.7% |
| Some other Race | 1,208 | 7.2% |
| Total | 16,804 | 100.0% |
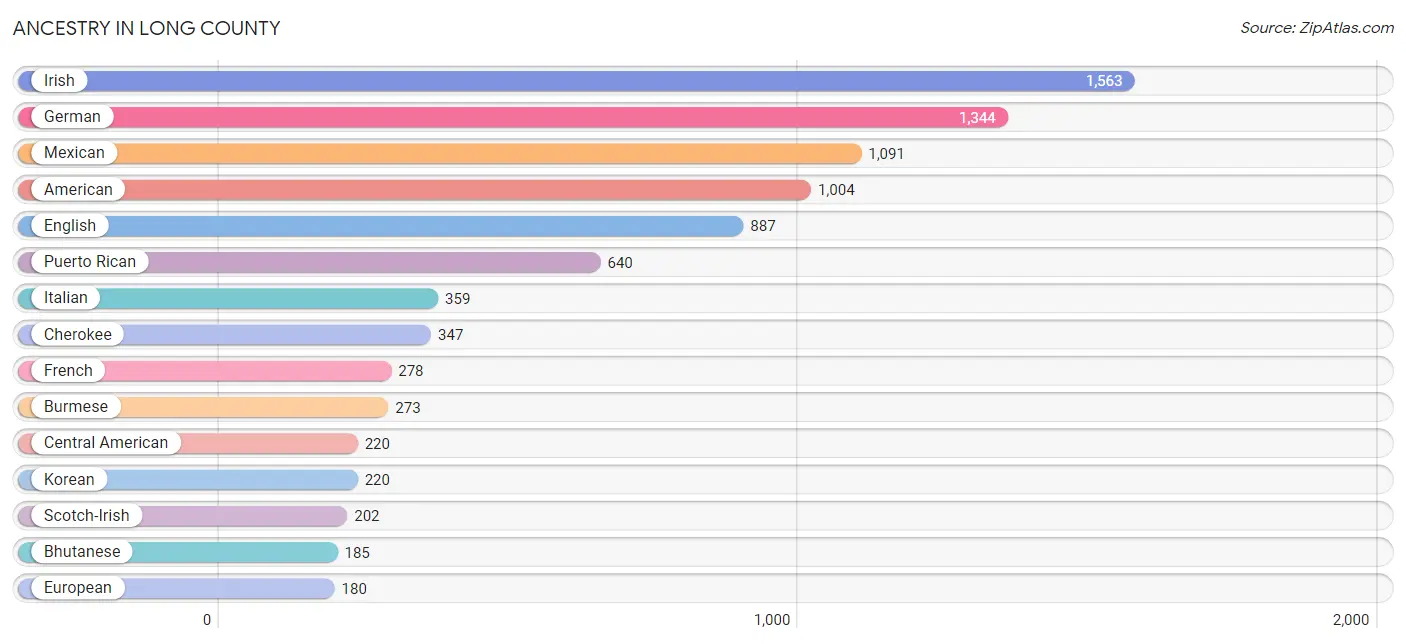
Ancestry in Long County
The most populous ancestries reported in Long County are Irish (1,563 | 9.3%), German (1,344 | 8.0%), Mexican (1,091 | 6.5%), American (1,004 | 6.0%), and English (887 | 5.3%), together accounting for 35.0% of all Long County residents.
| Ancestry | # Population | % Population |
| American | 1,004 | 6.0% |
| Apache | 5 | 0.0% |
| Arab | 48 | 0.3% |
| Austrian | 3 | 0.0% |
| Belgian | 9 | 0.1% |
| Bhutanese | 185 | 1.1% |
| Brazilian | 20 | 0.1% |
| British | 24 | 0.1% |
| Burmese | 273 | 1.6% |
| Central American | 220 | 1.3% |
| Cherokee | 347 | 2.1% |
| Creek | 16 | 0.1% |
| Cuban | 8 | 0.1% |
| Czech | 10 | 0.1% |
| Dominican | 6 | 0.0% |
| Dutch | 92 | 0.5% |
| English | 887 | 5.3% |
| European | 180 | 1.1% |
| French | 278 | 1.7% |
| French Canadian | 40 | 0.2% |
| German | 1,344 | 8.0% |
| Greek | 104 | 0.6% |
| Guamanian / Chamorro | 50 | 0.3% |
| Haitian | 75 | 0.4% |
| Honduran | 31 | 0.2% |
| Hopi | 24 | 0.1% |
| Hungarian | 168 | 1.0% |
| Irish | 1,563 | 9.3% |
| Iroquois | 41 | 0.2% |
| Italian | 359 | 2.1% |
| Jamaican | 62 | 0.4% |
| Korean | 220 | 1.3% |
| Lebanese | 32 | 0.2% |
| Lumbee | 25 | 0.2% |
| Mexican | 1,091 | 6.5% |
| Mexican American Indian | 14 | 0.1% |
| Moroccan | 16 | 0.1% |
| Native Hawaiian | 69 | 0.4% |
| Nicaraguan | 79 | 0.5% |
| Norwegian | 5 | 0.0% |
| Panamanian | 81 | 0.5% |
| Polish | 48 | 0.3% |
| Pueblo | 4 | 0.0% |
| Puerto Rican | 640 | 3.8% |
| Russian | 41 | 0.2% |
| Salvadoran | 29 | 0.2% |
| Scandinavian | 6 | 0.0% |
| Scotch-Irish | 202 | 1.2% |
| Scottish | 123 | 0.7% |
| Serbian | 6 | 0.0% |
| Sri Lankan | 25 | 0.2% |
| Swedish | 9 | 0.1% |
| U.S. Virgin Islander | 60 | 0.4% |
| Welsh | 55 | 0.3% | View All 54 Rows |
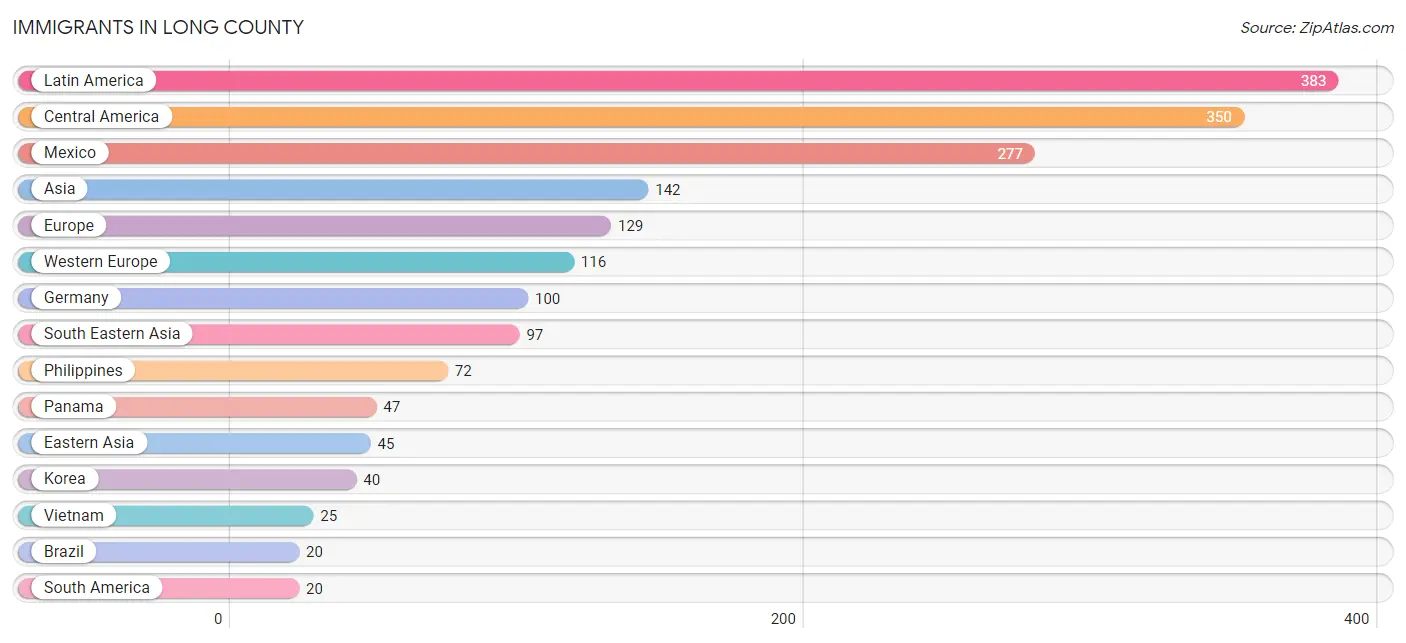
Immigrants in Long County
The most numerous immigrant groups reported in Long County came from Latin America (383 | 2.3%), Central America (350 | 2.1%), Mexico (277 | 1.7%), Asia (142 | 0.9%), and Europe (129 | 0.8%), together accounting for 7.6% of all Long County residents.
| Immigration Origin | # Population | % Population |
| Africa | 16 | 0.1% |
| Asia | 142 | 0.9% |
| Brazil | 20 | 0.1% |
| Caribbean | 13 | 0.1% |
| Central America | 350 | 2.1% |
| Eastern Asia | 45 | 0.3% |
| Eastern Europe | 13 | 0.1% |
| El Salvador | 9 | 0.1% |
| Europe | 129 | 0.8% |
| France | 16 | 0.1% |
| Germany | 100 | 0.6% |
| Ghana | 16 | 0.1% |
| Haiti | 13 | 0.1% |
| Honduras | 17 | 0.1% |
| Hungary | 13 | 0.1% |
| Japan | 5 | 0.0% |
| Korea | 40 | 0.2% |
| Latin America | 383 | 2.3% |
| Mexico | 277 | 1.7% |
| Micronesia | 11 | 0.1% |
| Oceania | 11 | 0.1% |
| Panama | 47 | 0.3% |
| Philippines | 72 | 0.4% |
| South America | 20 | 0.1% |
| South Eastern Asia | 97 | 0.6% |
| Vietnam | 25 | 0.2% |
| Western Africa | 16 | 0.1% |
| Western Europe | 116 | 0.7% | View All 28 Rows |
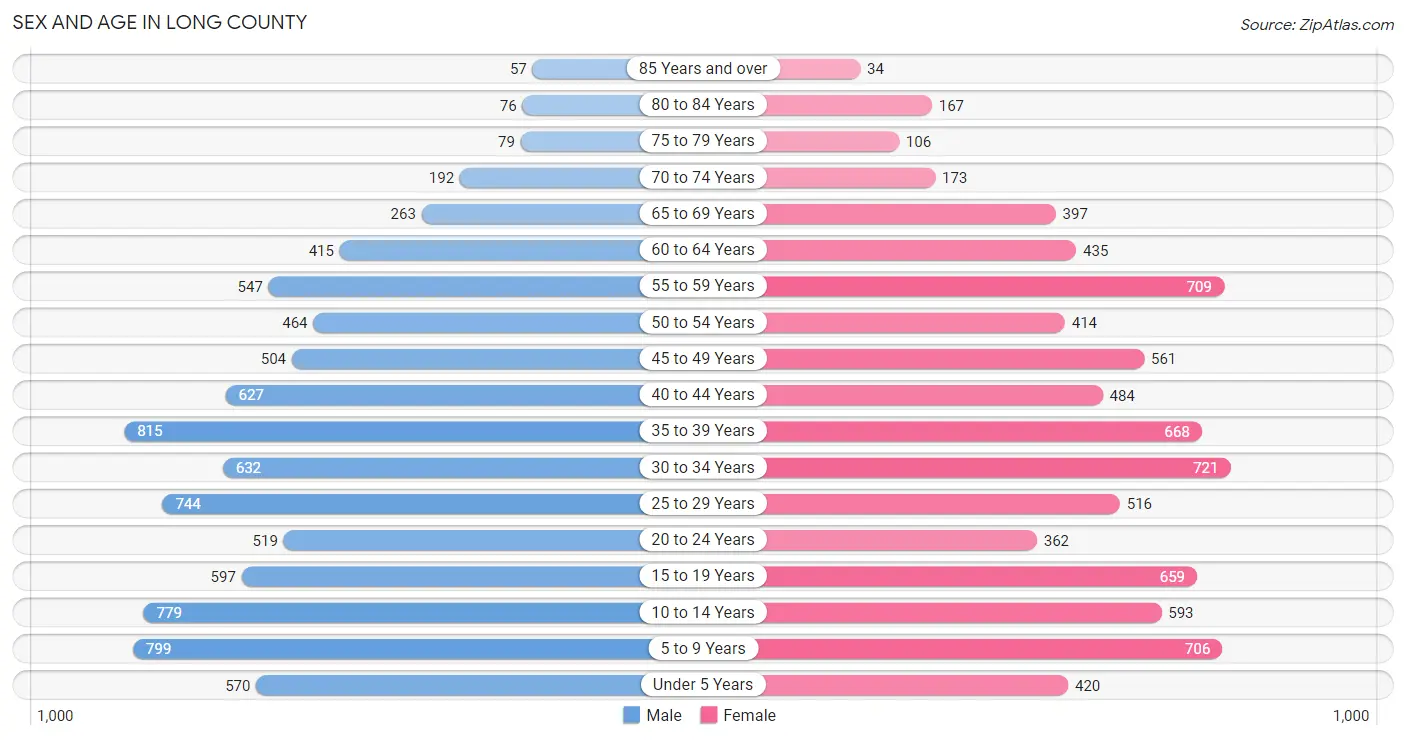
Sex and Age in Long County
Sex and Age in Long County
The most populous age groups in Long County are 35 to 39 Years (815 | 9.4%) for men and 30 to 34 Years (721 | 8.9%) for women.
| Age Bracket | Male | Female |
| Under 5 Years | 570 (6.6%) | 420 (5.2%) |
| 5 to 9 Years | 799 (9.2%) | 706 (8.7%) |
| 10 to 14 Years | 779 (9.0%) | 593 (7.3%) |
| 15 to 19 Years | 597 (6.9%) | 659 (8.1%) |
| 20 to 24 Years | 519 (6.0%) | 362 (4.5%) |
| 25 to 29 Years | 744 (8.6%) | 516 (6.4%) |
| 30 to 34 Years | 632 (7.3%) | 721 (8.9%) |
| 35 to 39 Years | 815 (9.4%) | 668 (8.2%) |
| 40 to 44 Years | 627 (7.2%) | 484 (6.0%) |
| 45 to 49 Years | 504 (5.8%) | 561 (6.9%) |
| 50 to 54 Years | 464 (5.3%) | 414 (5.1%) |
| 55 to 59 Years | 547 (6.3%) | 709 (8.7%) |
| 60 to 64 Years | 415 (4.8%) | 435 (5.3%) |
| 65 to 69 Years | 263 (3.0%) | 397 (4.9%) |
| 70 to 74 Years | 192 (2.2%) | 173 (2.1%) |
| 75 to 79 Years | 79 (0.9%) | 106 (1.3%) |
| 80 to 84 Years | 76 (0.9%) | 167 (2.1%) |
| 85 Years and over | 57 (0.7%) | 34 (0.4%) |
| Total | 8,679 (100.0%) | 8,125 (100.0%) |
Families and Households in Long County
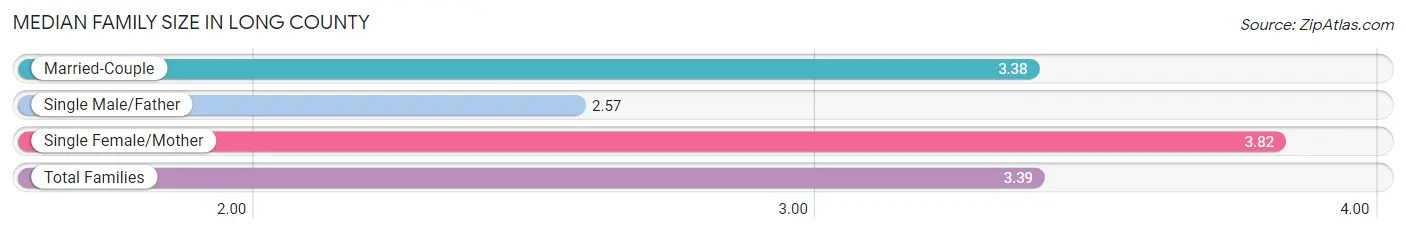
Median Family Size in Long County
The median family size in Long County is 3.39 persons per family, with single female/mother families (732 | 19.0%) accounting for the largest median family size of 3.82 persons per family. On the other hand, single male/father families (350 | 9.1%) represent the smallest median family size with 2.57 persons per family.
| Family Type | # Families | Family Size |
| Married-Couple | 2,764 (71.9%) | 3.38 |
| Single Male/Father | 350 (9.1%) | 2.57 |
| Single Female/Mother | 732 (19.0%) | 3.82 |
| Total Families | 3,846 (100.0%) | 3.39 |
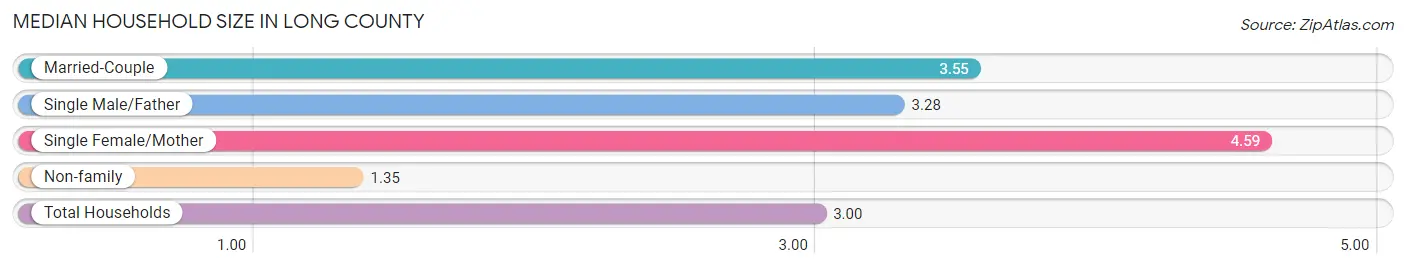
Median Household Size in Long County
The median household size in Long County is 3.00 persons per household, with single female/mother households (732 | 13.2%) accounting for the largest median household size of 4.59 persons per household. non-family households (1,701 | 30.7%) represent the smallest median household size with 1.35 persons per household.
| Household Type | # Households | Household Size |
| Married-Couple | 2,764 (49.8%) | 3.55 |
| Single Male/Father | 350 (6.3%) | 3.28 |
| Single Female/Mother | 732 (13.2%) | 4.59 |
| Non-family | 1,701 (30.7%) | 1.35 |
| Total Households | 5,547 (100.0%) | 3.00 |
Household Size by Marriage Status in Long County
Out of a total of 5,547 households in Long County, 3,846 (69.3%) are family households, while 1,701 (30.7%) are nonfamily households. The most numerous type of family households are 2-person households, comprising 1,504, and the most common type of nonfamily households are 1-person households, comprising 1,563.
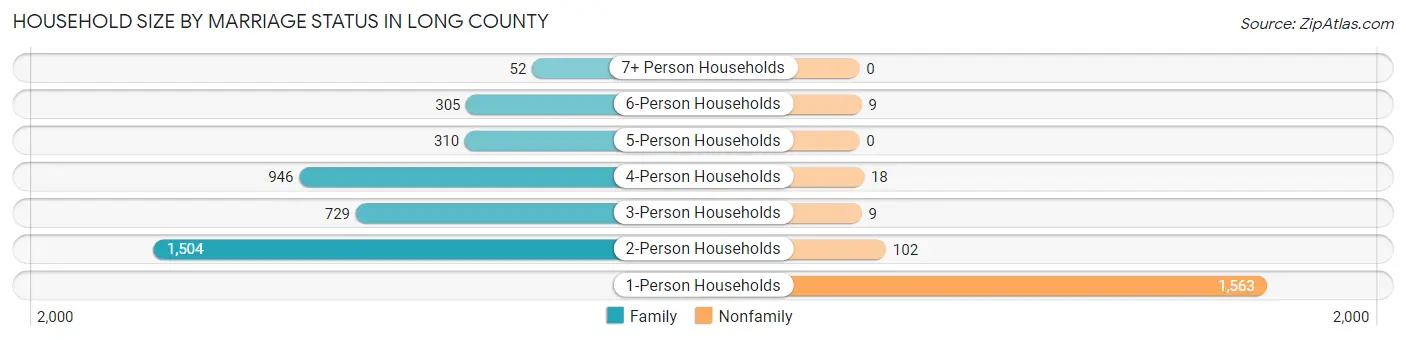
| Household Size | Family Households | Nonfamily Households |
| 1-Person Households | - | 1,563 (28.2%) |
| 2-Person Households | 1,504 (27.1%) | 102 (1.8%) |
| 3-Person Households | 729 (13.1%) | 9 (0.2%) |
| 4-Person Households | 946 (17.1%) | 18 (0.3%) |
| 5-Person Households | 310 (5.6%) | 0 (0.0%) |
| 6-Person Households | 305 (5.5%) | 9 (0.2%) |
| 7+ Person Households | 52 (0.9%) | 0 (0.0%) |
| Total | 3,846 (69.3%) | 1,701 (30.7%) |
Female Fertility in Long County
Fertility by Age in Long County
Average fertility rate in Long County is 48.0 births per 1,000 women. Women in the age bracket of 20 to 34 years have the highest fertility rate with 114.0 births per 1,000 women. Women in the age bracket of 20 to 34 years acount for 93.8% of all women with births.
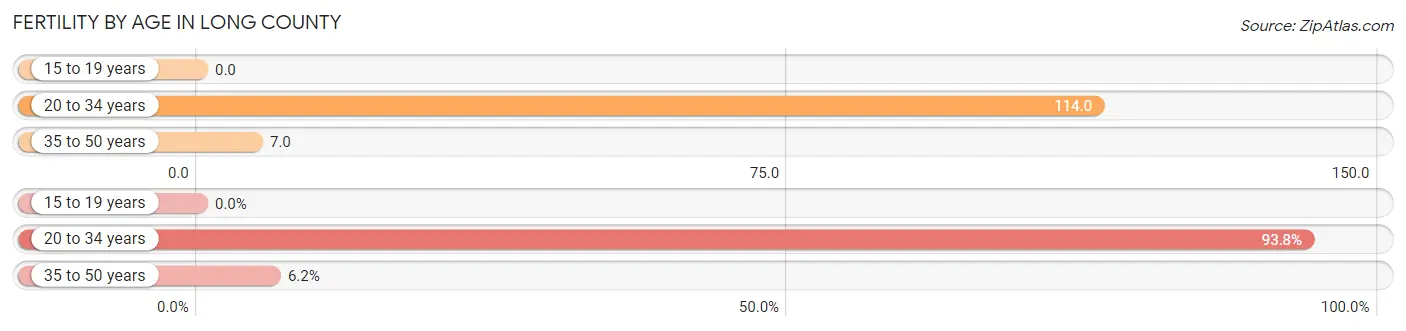
| Age Bracket | Women with Births | Births / 1,000 Women |
| 15 to 19 years | 0 (0.0%) | 0.0 |
| 20 to 34 years | 182 (93.8%) | 114.0 |
| 35 to 50 years | 12 (6.2%) | 7.0 |
| Total | 194 (100.0%) | 48.0 |
Fertility by Age by Marriage Status in Long County
88.1% of women with births (194) in Long County are married. The highest percentage of unmarried women with births falls into 20 to 34 years age bracket with 12.6% of them unmarried at the time of birth, while the lowest percentage of unmarried women with births belong to 35 to 50 years age bracket with 0.0% of them unmarried.
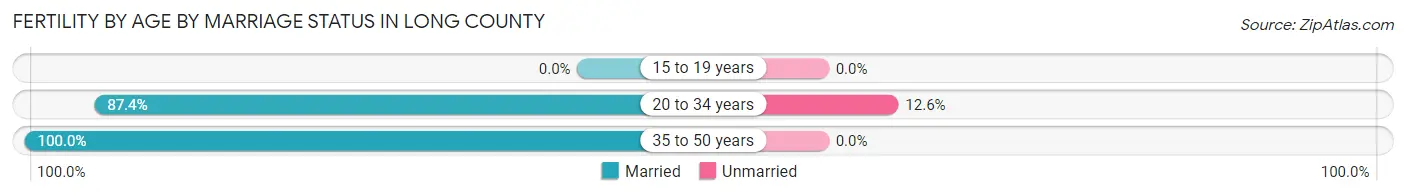
| Age Bracket | Married | Unmarried |
| 15 to 19 years | 0 (0.0%) | 0 (0.0%) |
| 20 to 34 years | 159 (87.4%) | 23 (12.6%) |
| 35 to 50 years | 12 (100.0%) | 0 (0.0%) |
| Total | 171 (88.1%) | 23 (11.9%) |
Fertility by Education in Long County
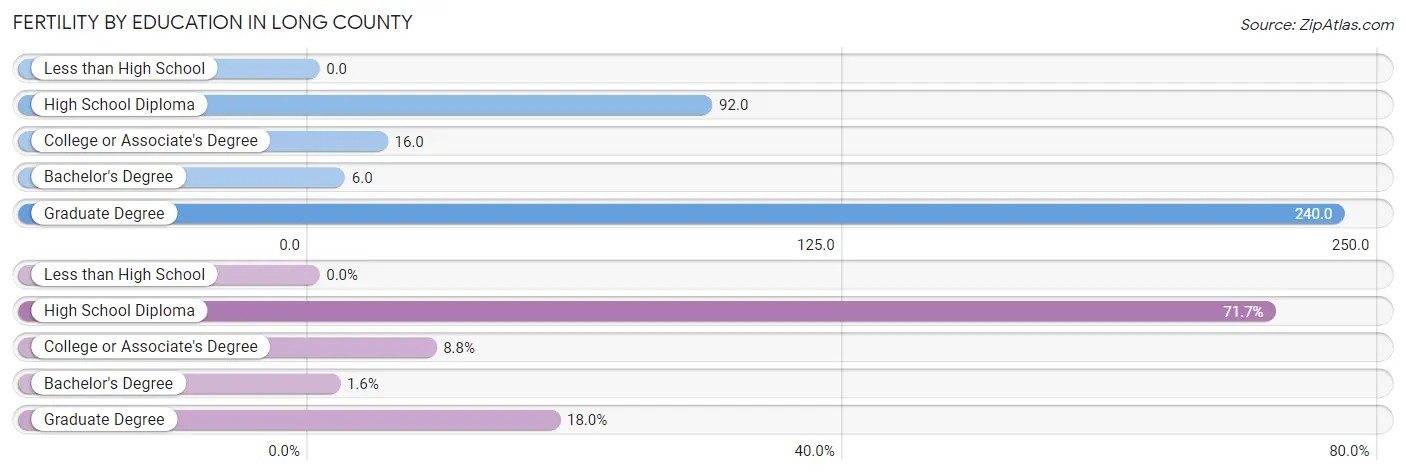
| Educational Attainment | Women with Births | Births / 1,000 Women |
| Less than High School | 0 (0.0%) | 0.0 |
| High School Diploma | 139 (71.7%) | 92.0 |
| College or Associate's Degree | 17 (8.8%) | 16.0 |
| Bachelor's Degree | 3 (1.5%) | 6.0 |
| Graduate Degree | 35 (18.0%) | 240.0 |
| Total | 194 (100.0%) | 48.0 |
Fertility by Education by Marriage Status in Long County
11.9% of women with births in Long County are unmarried. Women with the educational attainment of high school diploma are most likely to be married with 100.0% of them married at childbirth, while women with the educational attainment of graduate degree are least likely to be married with 65.7% of them unmarried at childbirth.
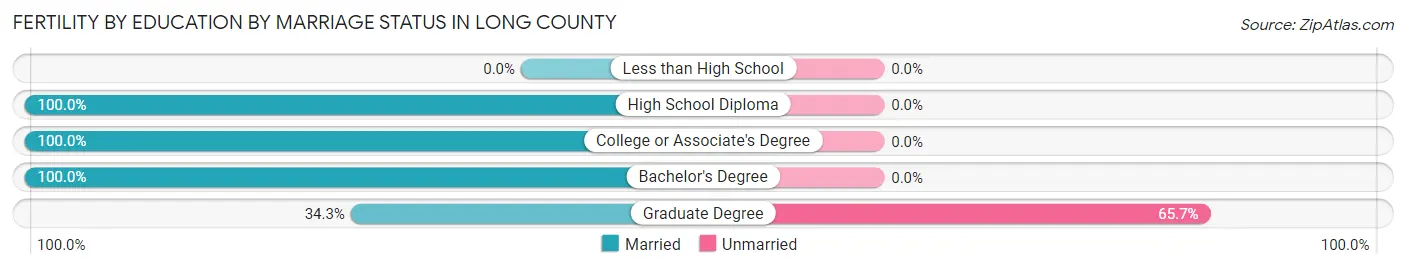
| Educational Attainment | Married | Unmarried |
| Less than High School | 0 (0.0%) | 0 (0.0%) |
| High School Diploma | 139 (100.0%) | 0 (0.0%) |
| College or Associate's Degree | 17 (100.0%) | 0 (0.0%) |
| Bachelor's Degree | 3 (100.0%) | 0 (0.0%) |
| Graduate Degree | 12 (34.3%) | 23 (65.7%) |
| Total | 171 (88.1%) | 23 (11.9%) |
Employment Characteristics in Long County
Employment by Class of Employer in Long County
Among the 7,445 employed individuals in Long County, private company employees (4,455 | 59.8%), federal government employees (1,132 | 15.2%), and local government employees (642 | 8.6%) make up the most common classes of employment.
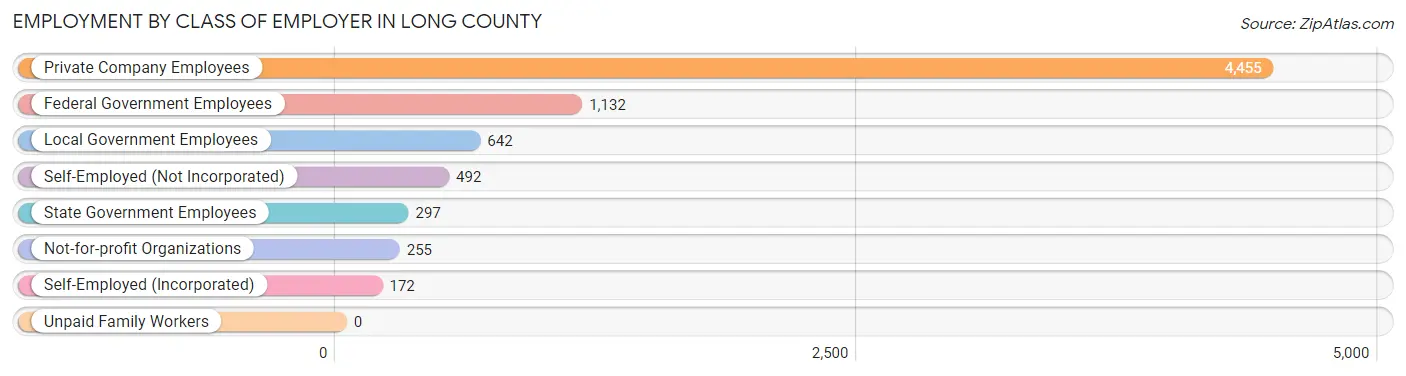
| Employer Class | # Employees | % Employees |
| Private Company Employees | 4,455 | 59.8% |
| Self-Employed (Incorporated) | 172 | 2.3% |
| Self-Employed (Not Incorporated) | 492 | 6.6% |
| Not-for-profit Organizations | 255 | 3.4% |
| Local Government Employees | 642 | 8.6% |
| State Government Employees | 297 | 4.0% |
| Federal Government Employees | 1,132 | 15.2% |
| Unpaid Family Workers | 0 | 0.0% |
| Total | 7,445 | 100.0% |
Employment Status by Age in Long County
According to the labor force statistics for Long County, out of the total population over 16 years of age (12,732), 61.9% or 7,881 individuals are in the labor force, with 4.5% or 355 of them unemployed. The age group with the highest labor force participation rate is 35 to 44 years, with 88.7% or 2,301 individuals in the labor force. Within the labor force, the 16 to 19 years age range has the highest percentage of unemployed individuals, with 21.2% or 56 of them being unemployed.
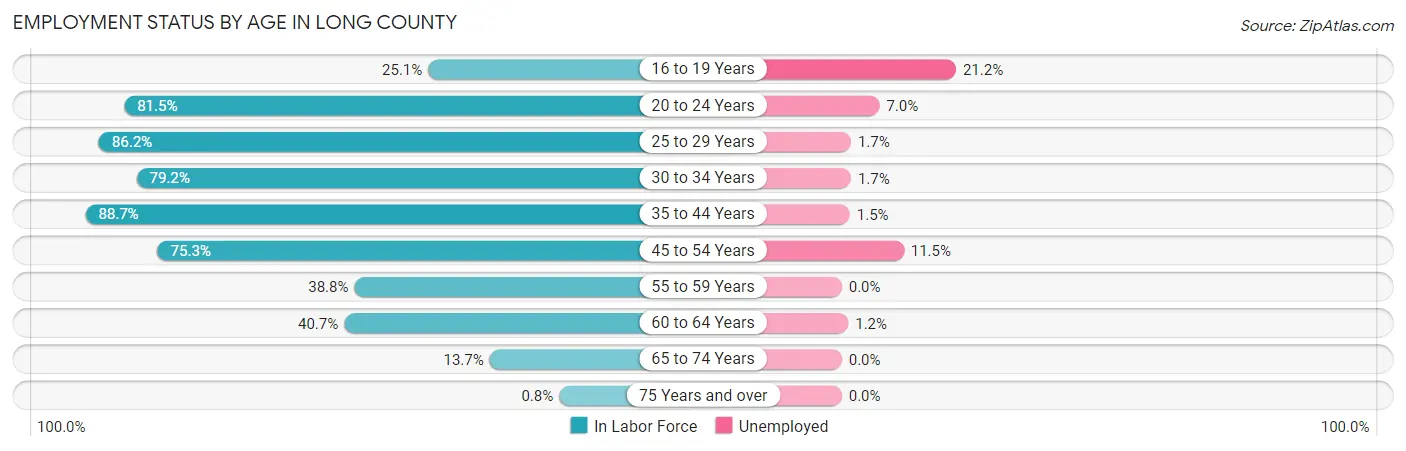
| Age Bracket | In Labor Force | Unemployed |
| 16 to 19 Years | 264 (25.1%) | 56 (21.2%) |
| 20 to 24 Years | 718 (81.5%) | 50 (7.0%) |
| 25 to 29 Years | 1,086 (86.2%) | 18 (1.7%) |
| 30 to 34 Years | 1,072 (79.2%) | 18 (1.7%) |
| 35 to 44 Years | 2,301 (88.7%) | 35 (1.5%) |
| 45 to 54 Years | 1,463 (75.3%) | 168 (11.5%) |
| 55 to 59 Years | 487 (38.8%) | 0 (0.0%) |
| 60 to 64 Years | 346 (40.7%) | 4 (1.2%) |
| 65 to 74 Years | 140 (13.7%) | 0 (0.0%) |
| 75 Years and over | 4 (0.8%) | 0 (0.0%) |
| Total | 7,881 (61.9%) | 355 (4.5%) |
Employment Status by Educational Attainment in Long County
According to labor force statistics for Long County, 73.0% of individuals (6,757) out of the total population between 25 and 64 years of age (9,256) are in the labor force, with 3.7% or 250 of them being unemployed. The group with the highest labor force participation rate are those with the educational attainment of bachelor's degree or higher, with 91.3% or 1,137 individuals in the labor force. Within the labor force, individuals with college / associate degree education have the highest percentage of unemployment, with 10.5% or 216 of them being unemployed.
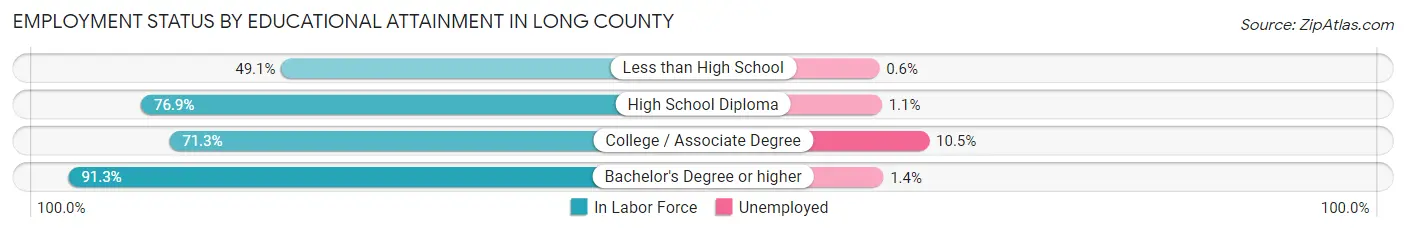
| Educational Attainment | In Labor Force | Unemployed |
| Less than High School | 678 (49.1%) | 8 (0.6%) |
| High School Diploma | 2,881 (76.9%) | 41 (1.1%) |
| College / Associate Degree | 2,057 (71.3%) | 303 (10.5%) |
| Bachelor's Degree or higher | 1,137 (91.3%) | 17 (1.4%) |
| Total | 6,757 (73.0%) | 342 (3.7%) |
Employment Occupations by Sex in Long County
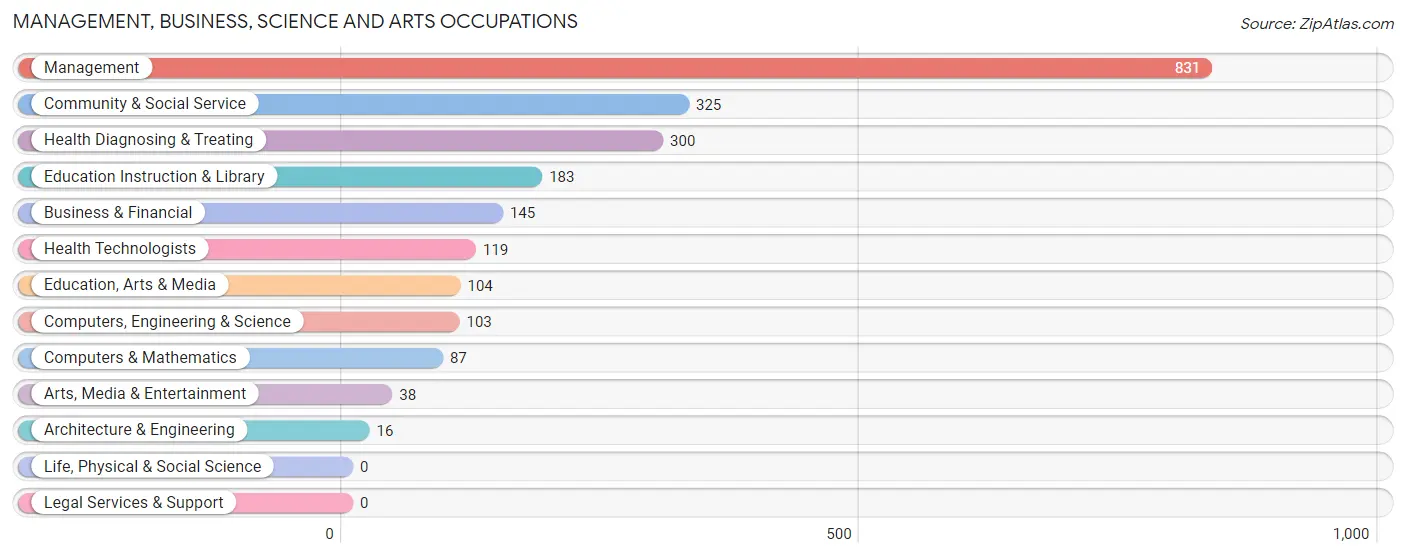
Management, Business, Science and Arts Occupations
The most common Management, Business, Science and Arts occupations in Long County are Management (831 | 12.1%), Community & Social Service (325 | 4.7%), Health Diagnosing & Treating (300 | 4.4%), Education Instruction & Library (183 | 2.7%), and Business & Financial (145 | 2.1%).
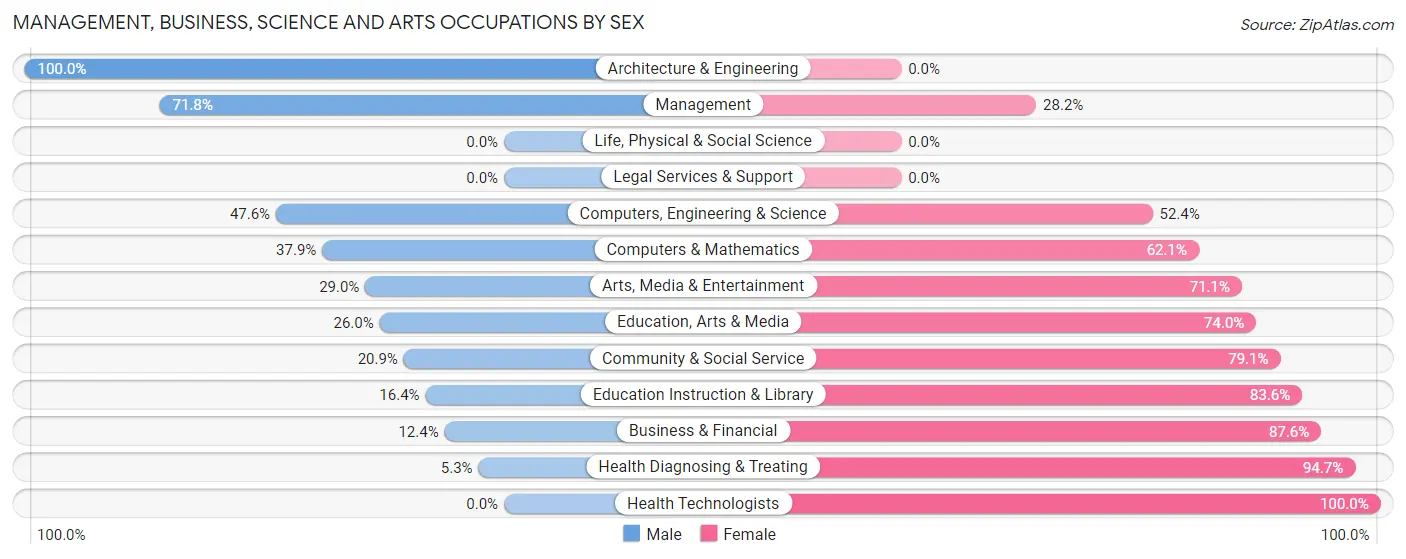
Management, Business, Science and Arts Occupations by Sex
Within the Management, Business, Science and Arts occupations in Long County, the most male-oriented occupations are Architecture & Engineering (100.0%), Management (71.8%), and Computers, Engineering & Science (47.6%), while the most female-oriented occupations are Health Technologists (100.0%), Health Diagnosing & Treating (94.7%), and Business & Financial (87.6%).
| Occupation | Male | Female |
| Management | 597 (71.8%) | 234 (28.2%) |
| Business & Financial | 18 (12.4%) | 127 (87.6%) |
| Computers, Engineering & Science | 49 (47.6%) | 54 (52.4%) |
| Computers & Mathematics | 33 (37.9%) | 54 (62.1%) |
| Architecture & Engineering | 16 (100.0%) | 0 (0.0%) |
| Life, Physical & Social Science | 0 (0.0%) | 0 (0.0%) |
| Community & Social Service | 68 (20.9%) | 257 (79.1%) |
| Education, Arts & Media | 27 (26.0%) | 77 (74.0%) |
| Legal Services & Support | 0 (0.0%) | 0 (0.0%) |
| Education Instruction & Library | 30 (16.4%) | 153 (83.6%) |
| Arts, Media & Entertainment | 11 (28.9%) | 27 (71.1%) |
| Health Diagnosing & Treating | 16 (5.3%) | 284 (94.7%) |
| Health Technologists | 0 (0.0%) | 119 (100.0%) |
| Total (Category) | 748 (43.9%) | 956 (56.1%) |
| Total (Overall) | 3,841 (55.9%) | 3,032 (44.1%) |
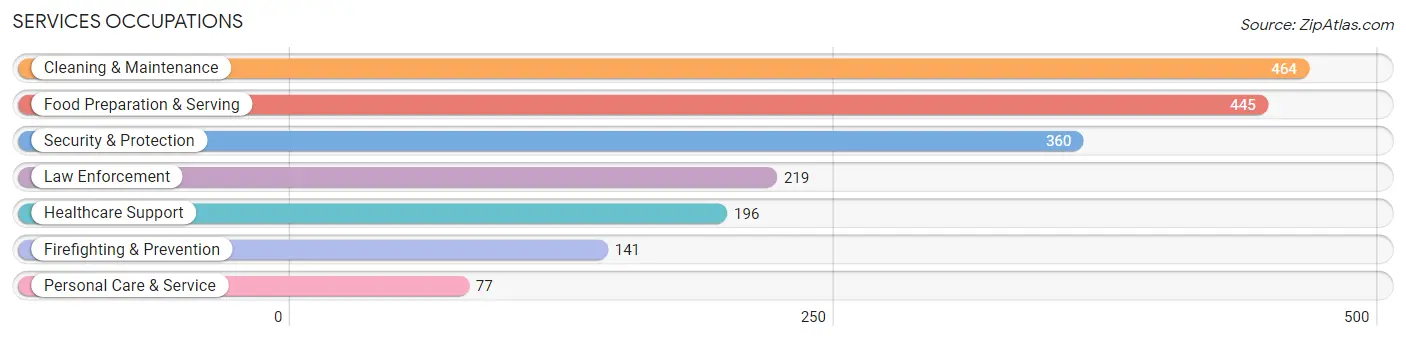
Services Occupations
The most common Services occupations in Long County are Cleaning & Maintenance (464 | 6.8%), Food Preparation & Serving (445 | 6.5%), Security & Protection (360 | 5.2%), Law Enforcement (219 | 3.2%), and Healthcare Support (196 | 2.9%).
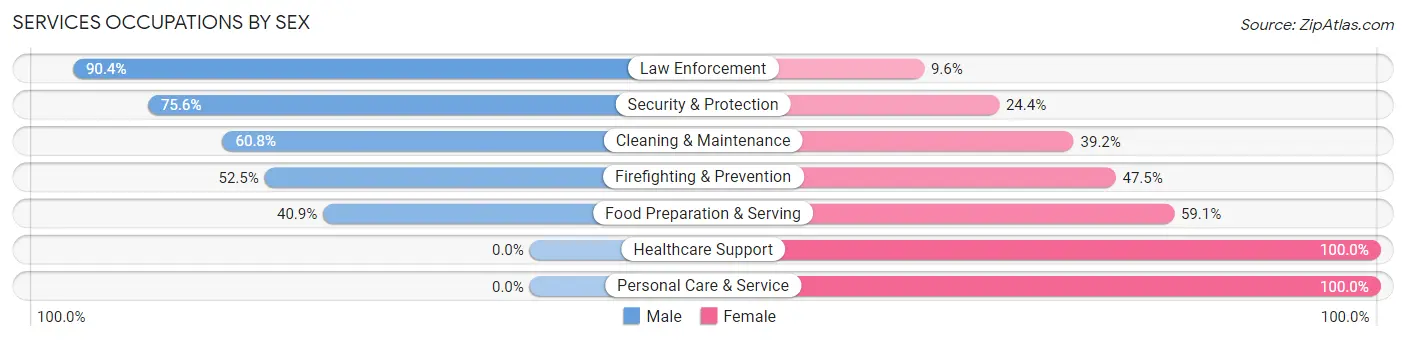
Services Occupations by Sex
Within the Services occupations in Long County, the most male-oriented occupations are Law Enforcement (90.4%), Security & Protection (75.6%), and Cleaning & Maintenance (60.8%), while the most female-oriented occupations are Healthcare Support (100.0%), Personal Care & Service (100.0%), and Food Preparation & Serving (59.1%).
| Occupation | Male | Female |
| Healthcare Support | 0 (0.0%) | 196 (100.0%) |
| Security & Protection | 272 (75.6%) | 88 (24.4%) |
| Firefighting & Prevention | 74 (52.5%) | 67 (47.5%) |
| Law Enforcement | 198 (90.4%) | 21 (9.6%) |
| Food Preparation & Serving | 182 (40.9%) | 263 (59.1%) |
| Cleaning & Maintenance | 282 (60.8%) | 182 (39.2%) |
| Personal Care & Service | 0 (0.0%) | 77 (100.0%) |
| Total (Category) | 736 (47.7%) | 806 (52.3%) |
| Total (Overall) | 3,841 (55.9%) | 3,032 (44.1%) |
Sales and Office Occupations
The most common Sales and Office occupations in Long County are Sales & Related (560 | 8.2%), and Office & Administration (501 | 7.3%).
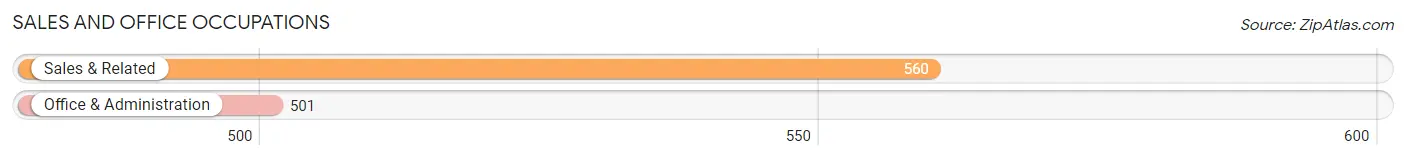
Sales and Office Occupations by Sex
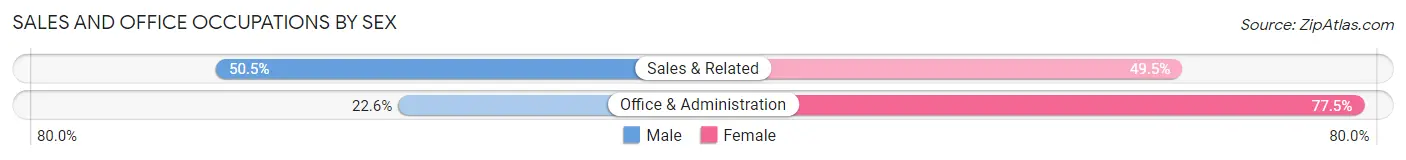
| Occupation | Male | Female |
| Sales & Related | 283 (50.5%) | 277 (49.5%) |
| Office & Administration | 113 (22.6%) | 388 (77.4%) |
| Total (Category) | 396 (37.3%) | 665 (62.7%) |
| Total (Overall) | 3,841 (55.9%) | 3,032 (44.1%) |
Natural Resources, Construction and Maintenance Occupations
The most common Natural Resources, Construction and Maintenance occupations in Long County are Construction & Extraction (547 | 8.0%), Installation, Maintenance & Repair (308 | 4.5%), and Farming, Fishing & Forestry (83 | 1.2%).
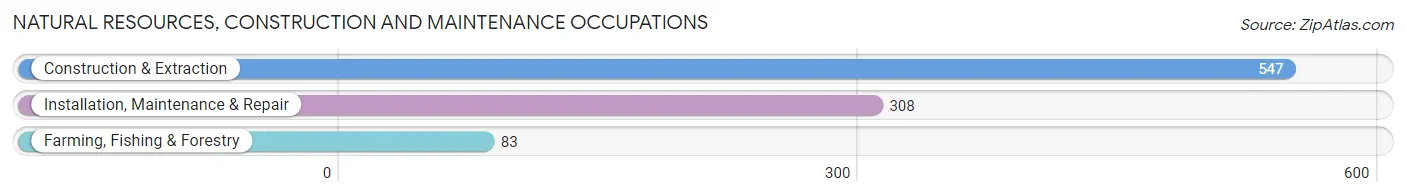
Natural Resources, Construction and Maintenance Occupations by Sex
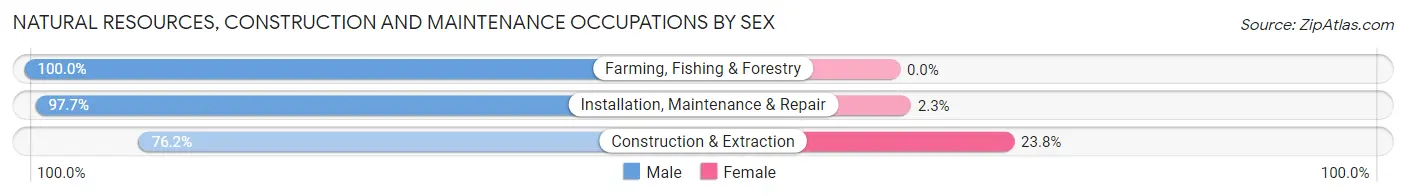
| Occupation | Male | Female |
| Farming, Fishing & Forestry | 83 (100.0%) | 0 (0.0%) |
| Construction & Extraction | 417 (76.2%) | 130 (23.8%) |
| Installation, Maintenance & Repair | 301 (97.7%) | 7 (2.3%) |
| Total (Category) | 801 (85.4%) | 137 (14.6%) |
| Total (Overall) | 3,841 (55.9%) | 3,032 (44.1%) |
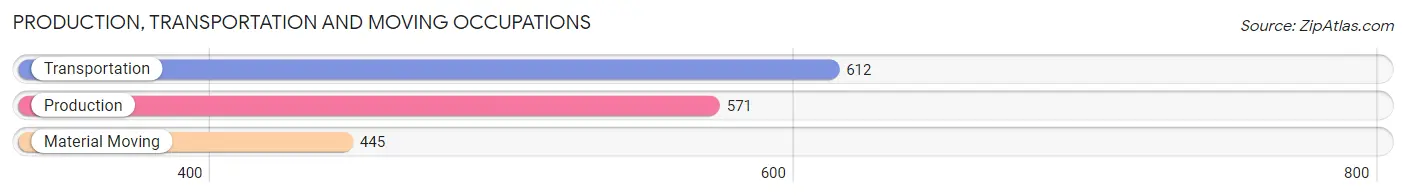
Production, Transportation and Moving Occupations
The most common Production, Transportation and Moving occupations in Long County are Transportation (612 | 8.9%), Production (571 | 8.3%), and Material Moving (445 | 6.5%).
Production, Transportation and Moving Occupations by Sex
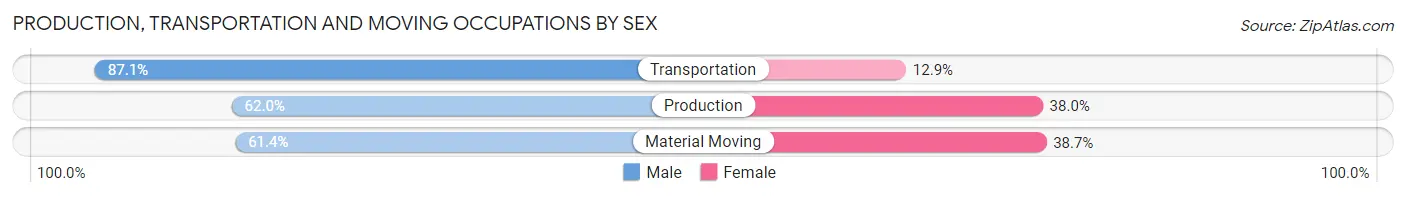
| Occupation | Male | Female |
| Production | 354 (62.0%) | 217 (38.0%) |
| Transportation | 533 (87.1%) | 79 (12.9%) |
| Material Moving | 273 (61.4%) | 172 (38.7%) |
| Total (Category) | 1,160 (71.3%) | 468 (28.7%) |
| Total (Overall) | 3,841 (55.9%) | 3,032 (44.1%) |
Employment Industries by Sex in Long County
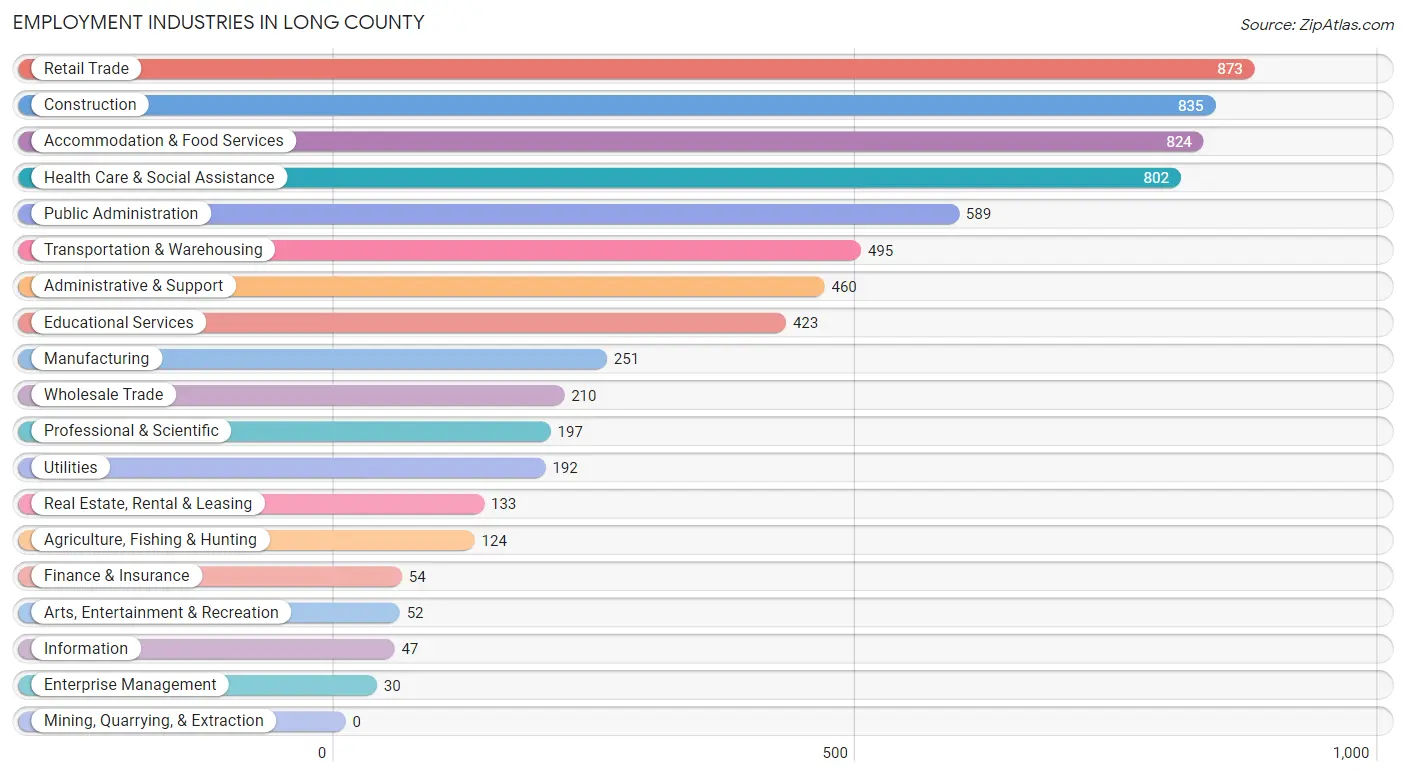
Employment Industries in Long County
The major employment industries in Long County include Retail Trade (873 | 12.7%), Construction (835 | 12.1%), Accommodation & Food Services (824 | 12.0%), Health Care & Social Assistance (802 | 11.7%), and Public Administration (589 | 8.6%).
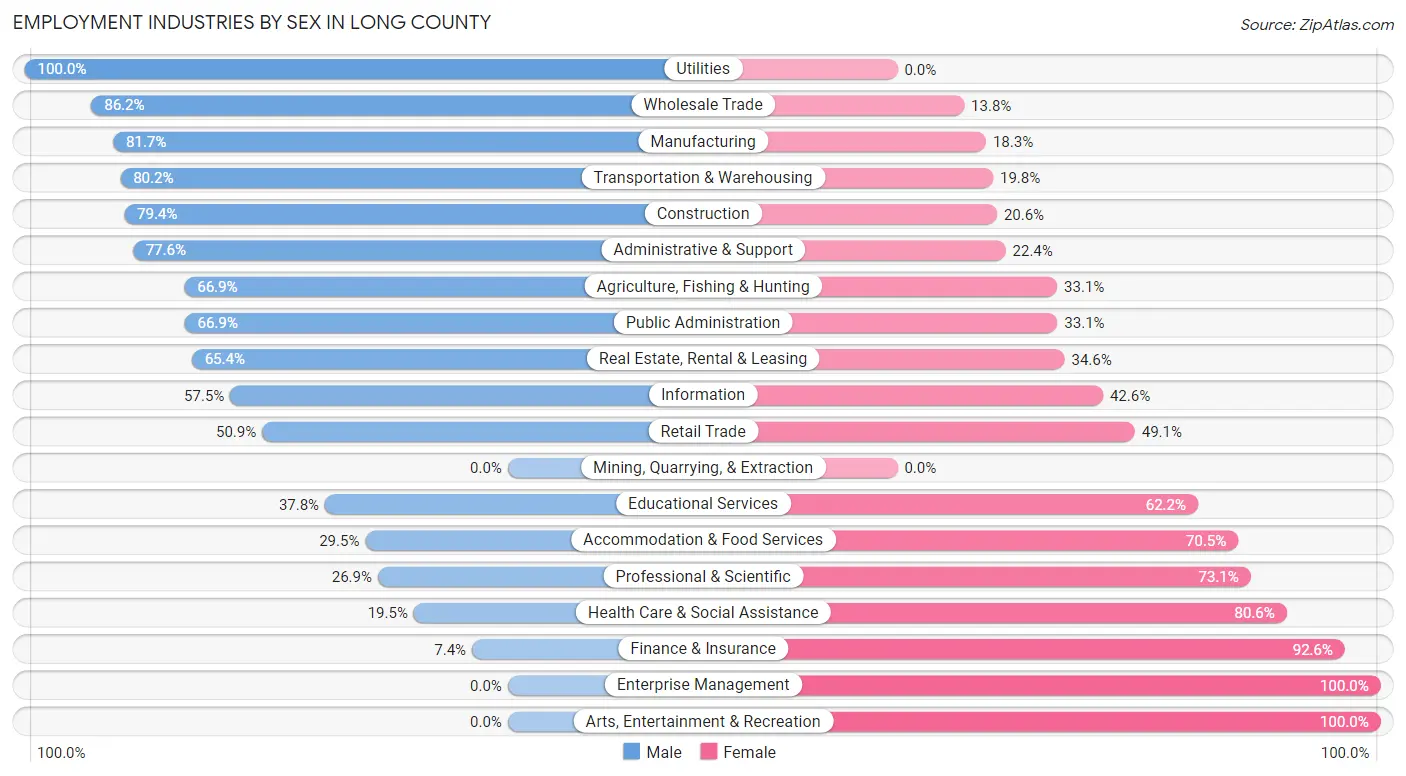
Employment Industries by Sex in Long County
The Long County industries that see more men than women are Utilities (100.0%), Wholesale Trade (86.2%), and Manufacturing (81.7%), whereas the industries that tend to have a higher number of women are Enterprise Management (100.0%), Arts, Entertainment & Recreation (100.0%), and Finance & Insurance (92.6%).
| Industry | Male | Female |
| Agriculture, Fishing & Hunting | 83 (66.9%) | 41 (33.1%) |
| Mining, Quarrying, & Extraction | 0 (0.0%) | 0 (0.0%) |
| Construction | 663 (79.4%) | 172 (20.6%) |
| Manufacturing | 205 (81.7%) | 46 (18.3%) |
| Wholesale Trade | 181 (86.2%) | 29 (13.8%) |
| Retail Trade | 444 (50.9%) | 429 (49.1%) |
| Transportation & Warehousing | 397 (80.2%) | 98 (19.8%) |
| Utilities | 192 (100.0%) | 0 (0.0%) |
| Information | 27 (57.5%) | 20 (42.5%) |
| Finance & Insurance | 4 (7.4%) | 50 (92.6%) |
| Real Estate, Rental & Leasing | 87 (65.4%) | 46 (34.6%) |
| Professional & Scientific | 53 (26.9%) | 144 (73.1%) |
| Enterprise Management | 0 (0.0%) | 30 (100.0%) |
| Administrative & Support | 357 (77.6%) | 103 (22.4%) |
| Educational Services | 160 (37.8%) | 263 (62.2%) |
| Health Care & Social Assistance | 156 (19.5%) | 646 (80.5%) |
| Arts, Entertainment & Recreation | 0 (0.0%) | 52 (100.0%) |
| Accommodation & Food Services | 243 (29.5%) | 581 (70.5%) |
| Public Administration | 394 (66.9%) | 195 (33.1%) |
| Total | 3,841 (55.9%) | 3,032 (44.1%) |
Education in Long County
School Enrollment in Long County
The most common levels of schooling among the 4,424 students in Long County are middle school (1,226 | 27.7%), elementary school (1,074 | 24.3%), and high school (862 | 19.5%).
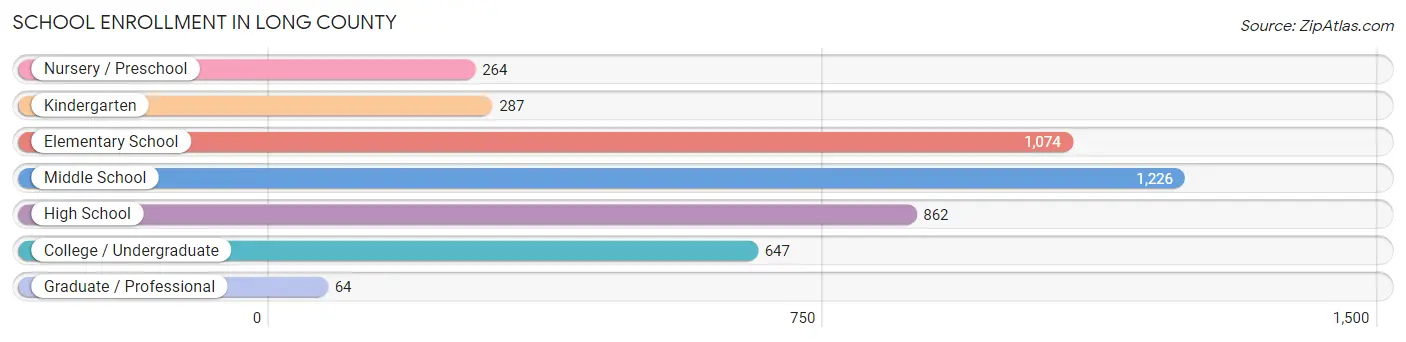
| School Level | # Students | % Students |
| Nursery / Preschool | 264 | 6.0% |
| Kindergarten | 287 | 6.5% |
| Elementary School | 1,074 | 24.3% |
| Middle School | 1,226 | 27.7% |
| High School | 862 | 19.5% |
| College / Undergraduate | 647 | 14.6% |
| Graduate / Professional | 64 | 1.5% |
| Total | 4,424 | 100.0% |
School Enrollment by Age by Funding Source in Long County
Out of a total of 4,424 students who are enrolled in schools in Long County, 398 (9.0%) attend a private institution, while the remaining 4,026 (91.0%) are enrolled in public schools. The age group of 25 to 34 year olds has the highest likelihood of being enrolled in private schools, with 54 (38.0% in the age bracket) enrolled. Conversely, the age group of 3 to 4 year olds has the lowest likelihood of being enrolled in a private school, with 204 (96.7% in the age bracket) attending a public institution.
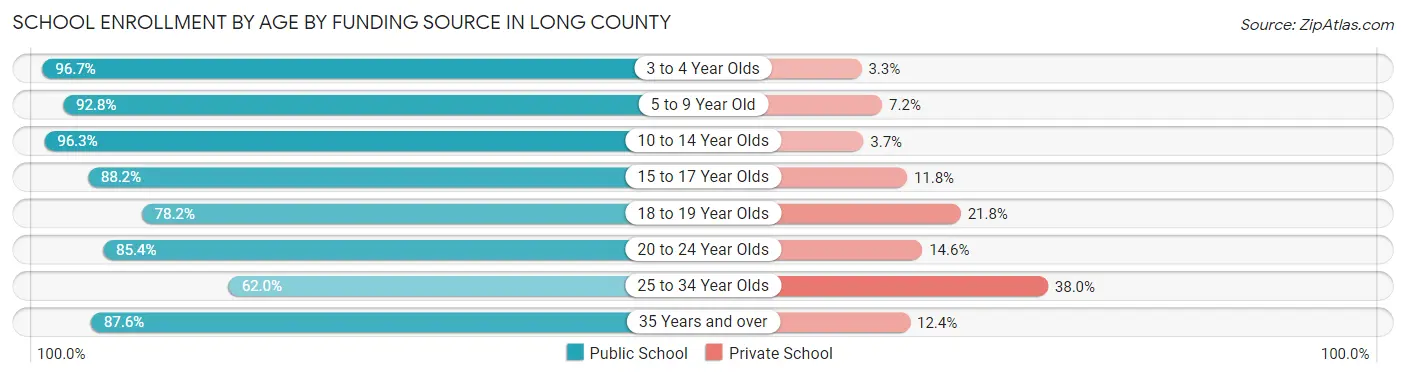
| Age Bracket | Public School | Private School |
| 3 to 4 Year Olds | 204 (96.7%) | 7 (3.3%) |
| 5 to 9 Year Old | 1,256 (92.8%) | 97 (7.2%) |
| 10 to 14 Year Olds | 1,260 (96.3%) | 48 (3.7%) |
| 15 to 17 Year Olds | 606 (88.2%) | 81 (11.8%) |
| 18 to 19 Year Olds | 165 (78.2%) | 46 (21.8%) |
| 20 to 24 Year Olds | 140 (85.4%) | 24 (14.6%) |
| 25 to 34 Year Olds | 88 (62.0%) | 54 (38.0%) |
| 35 Years and over | 305 (87.6%) | 43 (12.4%) |
| Total | 4,026 (91.0%) | 398 (9.0%) |
Educational Attainment by Field of Study in Long County
Business (269 | 18.2%), education (250 | 16.9%), liberal arts & history (208 | 14.1%), communications (147 | 9.9%), and psychology (120 | 8.1%) are the most common fields of study among 1,480 individuals in Long County who have obtained a bachelor's degree or higher.
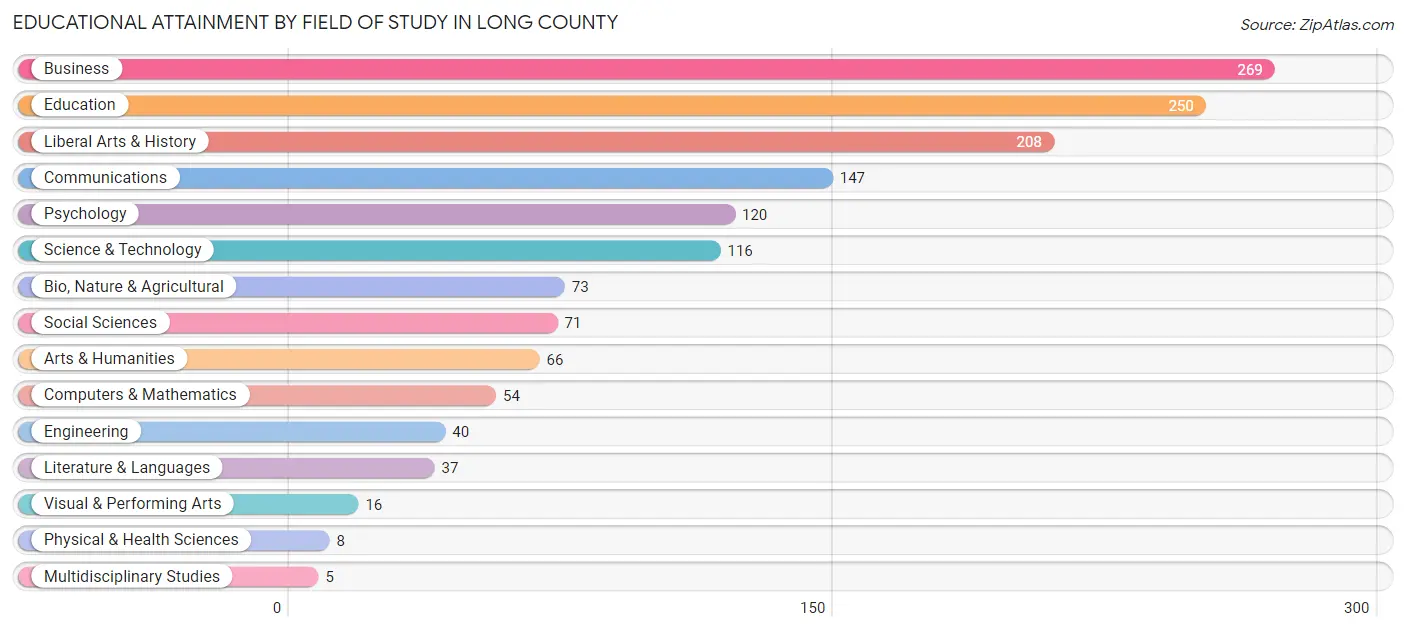
| Field of Study | # Graduates | % Graduates |
| Computers & Mathematics | 54 | 3.6% |
| Bio, Nature & Agricultural | 73 | 4.9% |
| Physical & Health Sciences | 8 | 0.5% |
| Psychology | 120 | 8.1% |
| Social Sciences | 71 | 4.8% |
| Engineering | 40 | 2.7% |
| Multidisciplinary Studies | 5 | 0.3% |
| Science & Technology | 116 | 7.8% |
| Business | 269 | 18.2% |
| Education | 250 | 16.9% |
| Literature & Languages | 37 | 2.5% |
| Liberal Arts & History | 208 | 14.1% |
| Visual & Performing Arts | 16 | 1.1% |
| Communications | 147 | 9.9% |
| Arts & Humanities | 66 | 4.5% |
| Total | 1,480 | 100.0% |
Transportation & Commute in Long County
Vehicle Availability by Sex in Long County
The most prevalent vehicle ownership categories in Long County are males with 2 vehicles (1,391, accounting for 31.2%) and females with 2 vehicles (1,129, making up 46.5%).
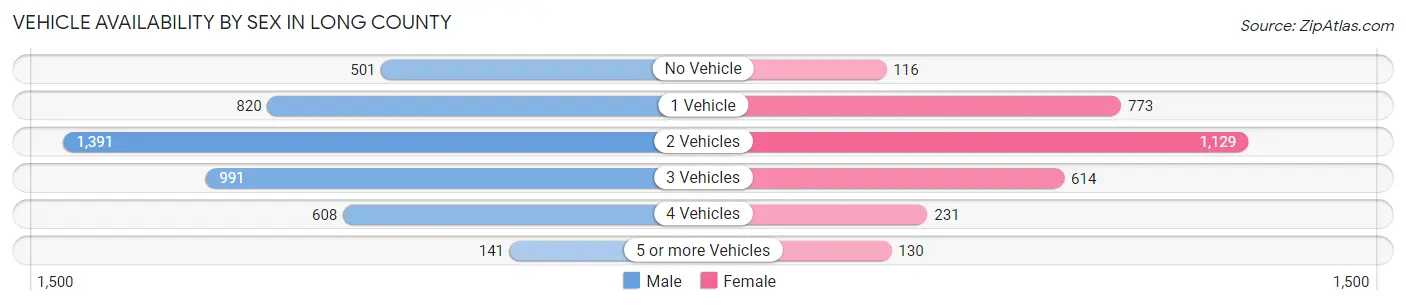
| Vehicles Available | Male | Female |
| No Vehicle | 501 (11.3%) | 116 (3.9%) |
| 1 Vehicle | 820 (18.4%) | 773 (25.8%) |
| 2 Vehicles | 1,391 (31.2%) | 1,129 (37.7%) |
| 3 Vehicles | 991 (22.3%) | 614 (20.5%) |
| 4 Vehicles | 608 (13.7%) | 231 (7.7%) |
| 5 or more Vehicles | 141 (3.2%) | 130 (4.3%) |
| Total | 4,452 (100.0%) | 2,993 (100.0%) |
Commute Time in Long County
The most frequently occuring commute durations in Long County are 20 to 24 minutes (1,540 commuters, 21.9%), 15 to 19 minutes (1,070 commuters, 15.2%), and 30 to 34 minutes (1,045 commuters, 14.8%).
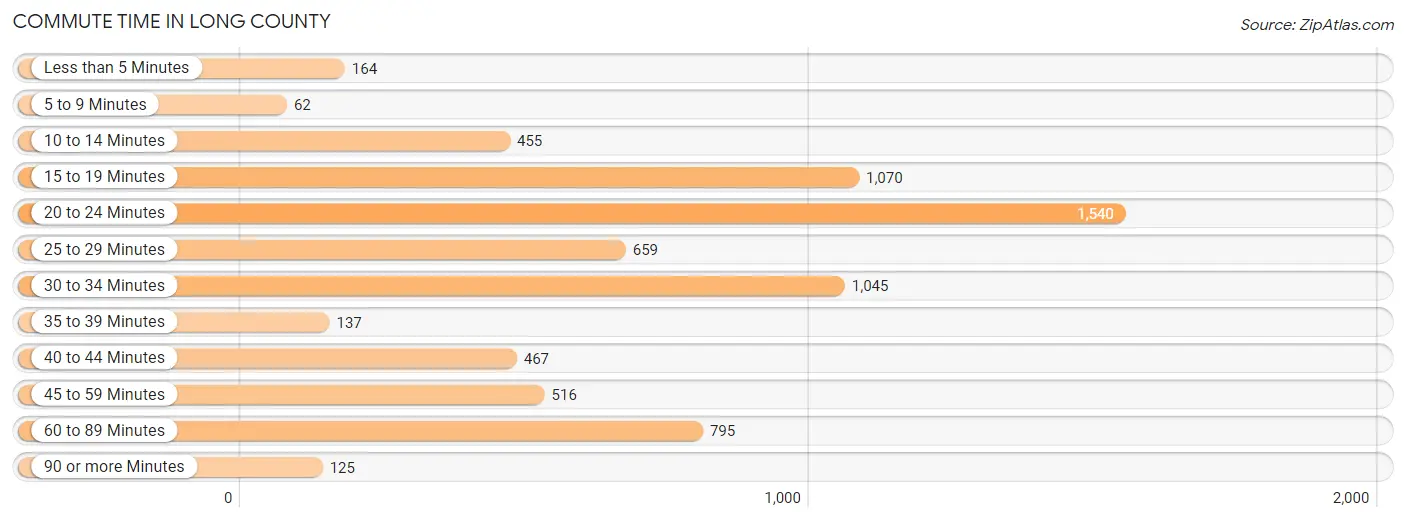
| Commute Time | # Commuters | % Commuters |
| Less than 5 Minutes | 164 | 2.3% |
| 5 to 9 Minutes | 62 | 0.9% |
| 10 to 14 Minutes | 455 | 6.5% |
| 15 to 19 Minutes | 1,070 | 15.2% |
| 20 to 24 Minutes | 1,540 | 21.9% |
| 25 to 29 Minutes | 659 | 9.4% |
| 30 to 34 Minutes | 1,045 | 14.8% |
| 35 to 39 Minutes | 137 | 1.9% |
| 40 to 44 Minutes | 467 | 6.6% |
| 45 to 59 Minutes | 516 | 7.3% |
| 60 to 89 Minutes | 795 | 11.3% |
| 90 or more Minutes | 125 | 1.8% |
Commute Time by Sex in Long County
The most common commute times in Long County are 20 to 24 minutes (865 commuters, 20.5%) for males and 20 to 24 minutes (675 commuters, 24.0%) for females.
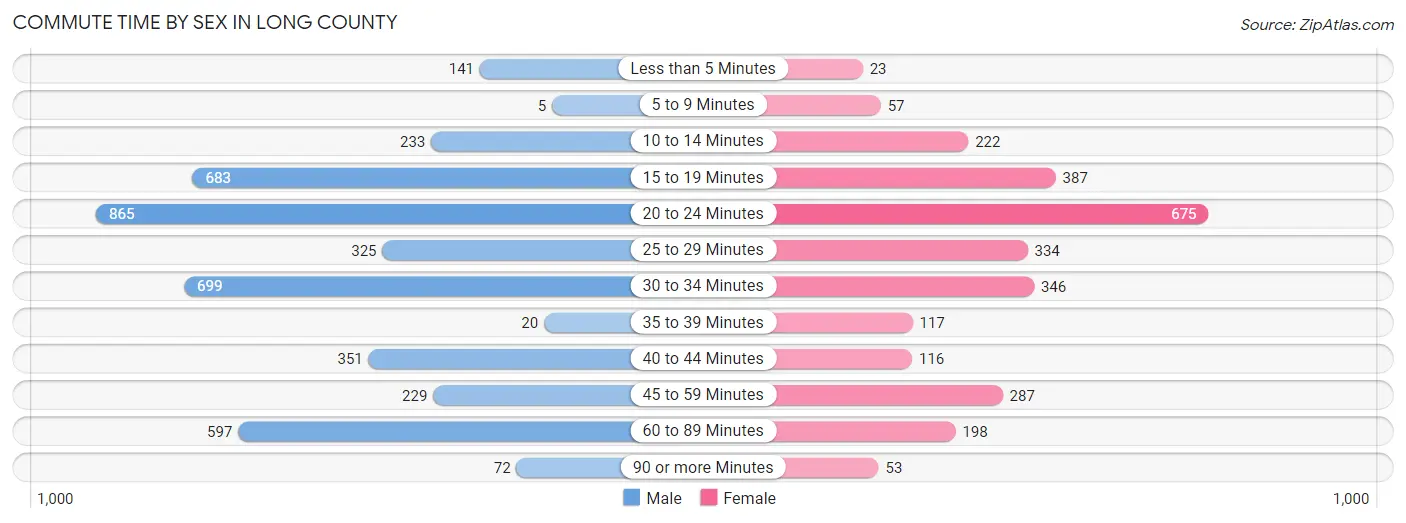
| Commute Time | Male | Female |
| Less than 5 Minutes | 141 (3.3%) | 23 (0.8%) |
| 5 to 9 Minutes | 5 (0.1%) | 57 (2.0%) |
| 10 to 14 Minutes | 233 (5.5%) | 222 (7.9%) |
| 15 to 19 Minutes | 683 (16.2%) | 387 (13.8%) |
| 20 to 24 Minutes | 865 (20.5%) | 675 (24.0%) |
| 25 to 29 Minutes | 325 (7.7%) | 334 (11.9%) |
| 30 to 34 Minutes | 699 (16.6%) | 346 (12.3%) |
| 35 to 39 Minutes | 20 (0.5%) | 117 (4.2%) |
| 40 to 44 Minutes | 351 (8.3%) | 116 (4.1%) |
| 45 to 59 Minutes | 229 (5.4%) | 287 (10.2%) |
| 60 to 89 Minutes | 597 (14.1%) | 198 (7.0%) |
| 90 or more Minutes | 72 (1.7%) | 53 (1.9%) |
Time of Departure to Work by Sex in Long County
The most frequent times of departure to work in Long County are 7:00 AM to 7:29 AM (791, 18.7%) for males and 7:00 AM to 7:29 AM (762, 27.1%) for females.
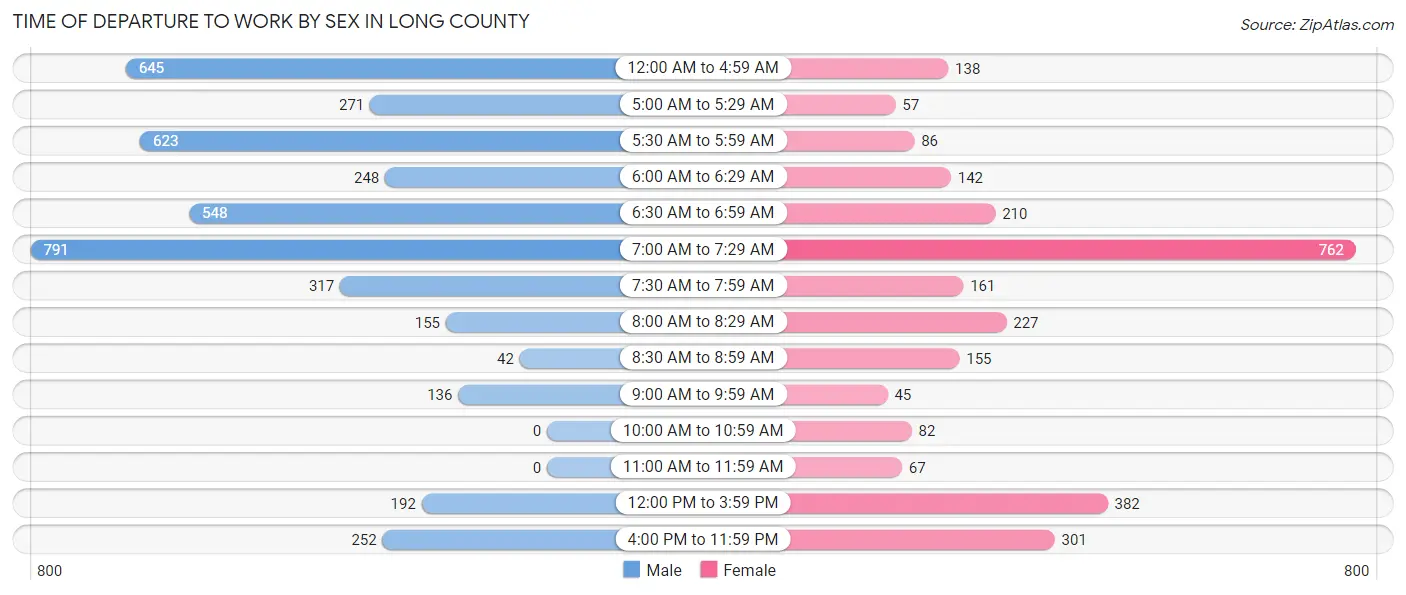
| Time of Departure | Male | Female |
| 12:00 AM to 4:59 AM | 645 (15.3%) | 138 (4.9%) |
| 5:00 AM to 5:29 AM | 271 (6.4%) | 57 (2.0%) |
| 5:30 AM to 5:59 AM | 623 (14.8%) | 86 (3.1%) |
| 6:00 AM to 6:29 AM | 248 (5.9%) | 142 (5.0%) |
| 6:30 AM to 6:59 AM | 548 (13.0%) | 210 (7.5%) |
| 7:00 AM to 7:29 AM | 791 (18.7%) | 762 (27.1%) |
| 7:30 AM to 7:59 AM | 317 (7.5%) | 161 (5.7%) |
| 8:00 AM to 8:29 AM | 155 (3.7%) | 227 (8.1%) |
| 8:30 AM to 8:59 AM | 42 (1.0%) | 155 (5.5%) |
| 9:00 AM to 9:59 AM | 136 (3.2%) | 45 (1.6%) |
| 10:00 AM to 10:59 AM | 0 (0.0%) | 82 (2.9%) |
| 11:00 AM to 11:59 AM | 0 (0.0%) | 67 (2.4%) |
| 12:00 PM to 3:59 PM | 192 (4.5%) | 382 (13.6%) |
| 4:00 PM to 11:59 PM | 252 (6.0%) | 301 (10.7%) |
| Total | 4,220 (100.0%) | 2,815 (100.0%) |
Housing Occupancy in Long County
Occupancy by Ownership in Long County
Of the total 5,547 dwellings in Long County, owner-occupied units account for 3,374 (60.8%), while renter-occupied units make up 2,173 (39.2%).
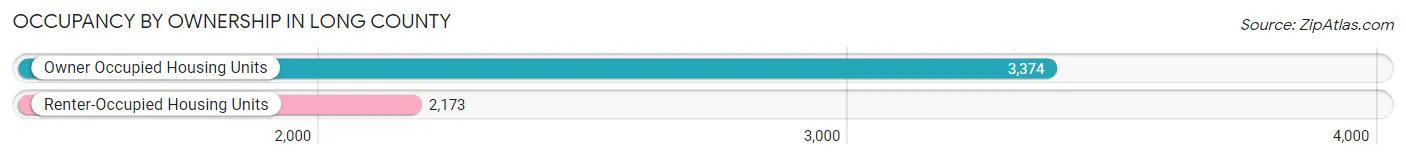
| Occupancy | # Housing Units | % Housing Units |
| Owner Occupied Housing Units | 3,374 | 60.8% |
| Renter-Occupied Housing Units | 2,173 | 39.2% |
| Total Occupied Housing Units | 5,547 | 100.0% |
Occupancy by Household Size in Long County
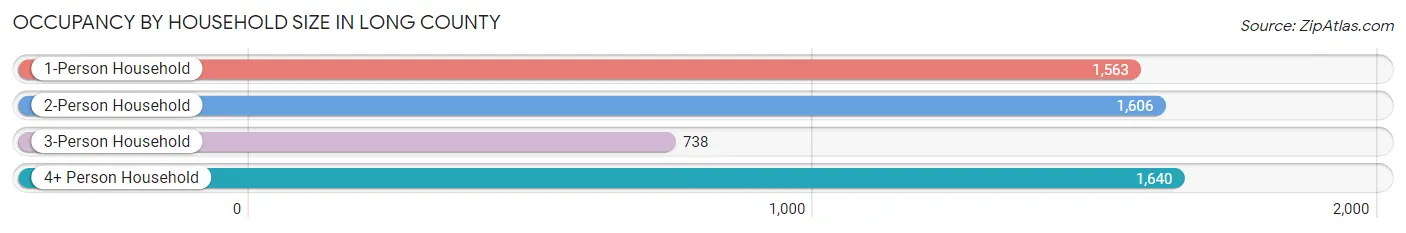
| Household Size | # Housing Units | % Housing Units |
| 1-Person Household | 1,563 | 28.2% |
| 2-Person Household | 1,606 | 28.9% |
| 3-Person Household | 738 | 13.3% |
| 4+ Person Household | 1,640 | 29.6% |
| Total Housing Units | 5,547 | 100.0% |
Occupancy by Ownership by Household Size in Long County
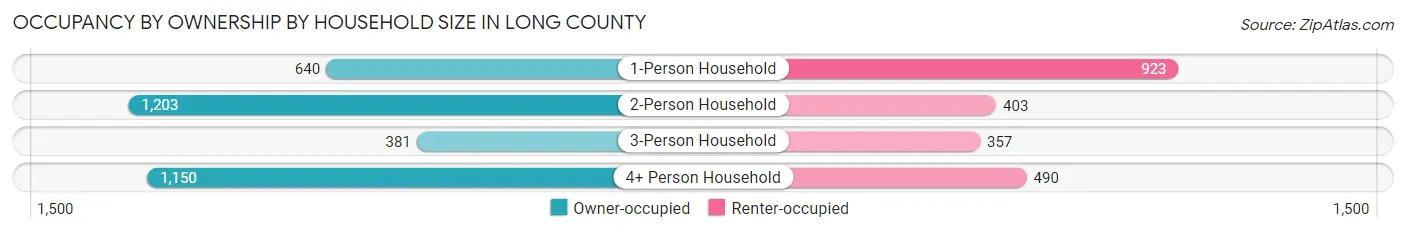
| Household Size | Owner-occupied | Renter-occupied |
| 1-Person Household | 640 (40.9%) | 923 (59.1%) |
| 2-Person Household | 1,203 (74.9%) | 403 (25.1%) |
| 3-Person Household | 381 (51.6%) | 357 (48.4%) |
| 4+ Person Household | 1,150 (70.1%) | 490 (29.9%) |
| Total Housing Units | 3,374 (60.8%) | 2,173 (39.2%) |
Occupancy by Educational Attainment in Long County
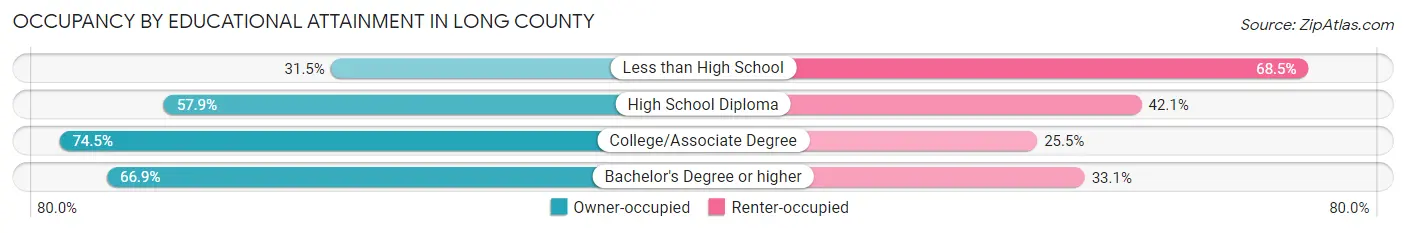
| Household Size | Owner-occupied | Renter-occupied |
| Less than High School | 263 (31.5%) | 573 (68.5%) |
| High School Diploma | 1,182 (57.9%) | 859 (42.1%) |
| College/Associate Degree | 1,405 (74.5%) | 482 (25.5%) |
| Bachelor's Degree or higher | 524 (66.9%) | 259 (33.1%) |
Occupancy by Age of Householder in Long County
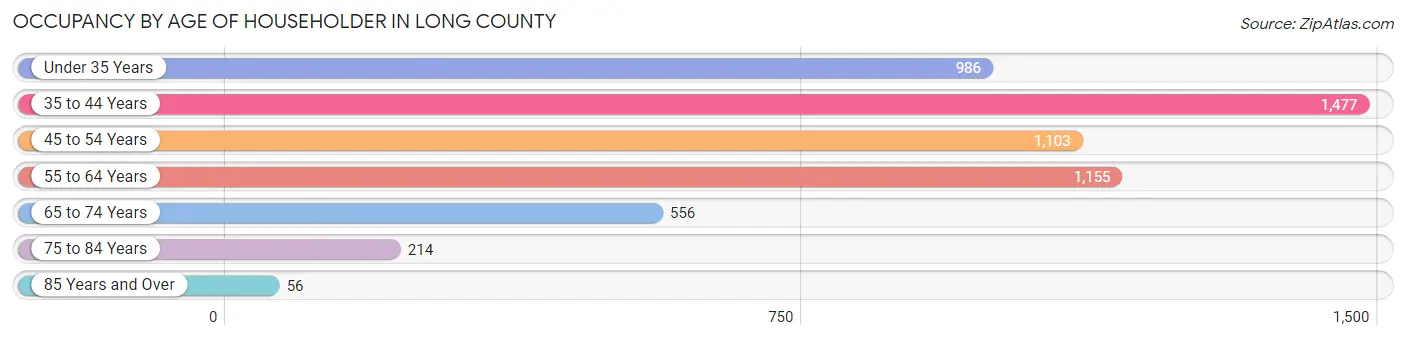
| Age Bracket | # Households | % Households |
| Under 35 Years | 986 | 17.8% |
| 35 to 44 Years | 1,477 | 26.6% |
| 45 to 54 Years | 1,103 | 19.9% |
| 55 to 64 Years | 1,155 | 20.8% |
| 65 to 74 Years | 556 | 10.0% |
| 75 to 84 Years | 214 | 3.9% |
| 85 Years and Over | 56 | 1.0% |
| Total | 5,547 | 100.0% |
Housing Finances in Long County
Median Income by Occupancy in Long County
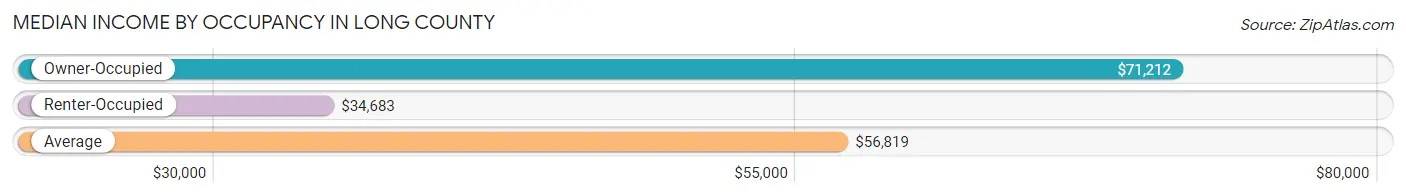
| Occupancy Type | # Households | Median Income |
| Owner-Occupied | 3,374 (60.8%) | $71,212 |
| Renter-Occupied | 2,173 (39.2%) | $34,683 |
| Average | 5,547 (100.0%) | $56,819 |
Occupancy by Householder Income Bracket in Long County
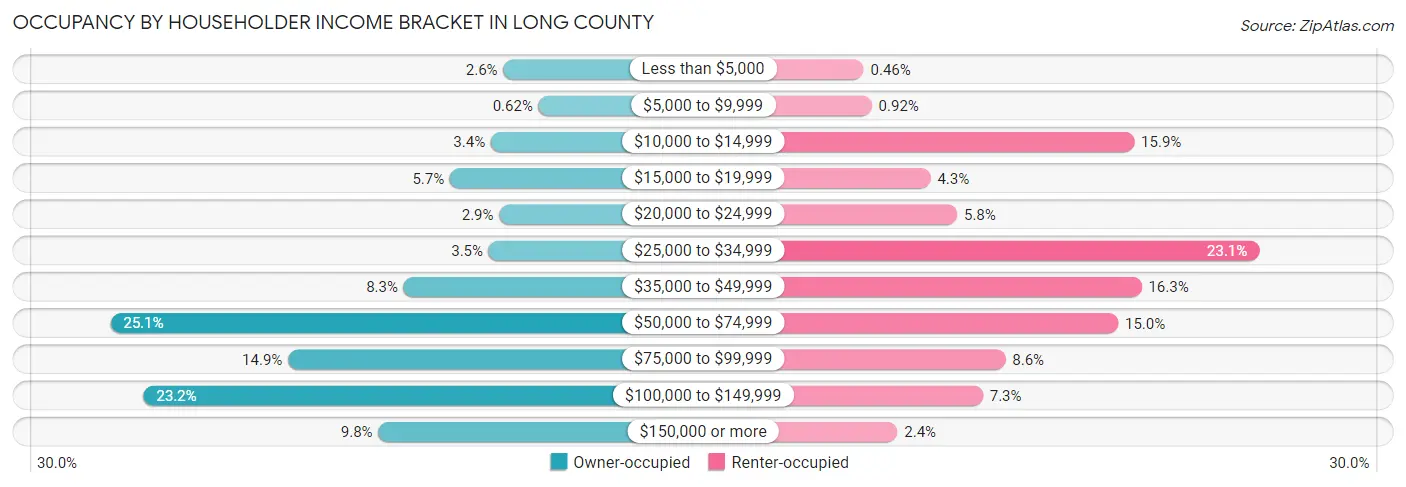
| Income Bracket | Owner-occupied | Renter-occupied |
| Less than $5,000 | 89 (2.6%) | 10 (0.5%) |
| $5,000 to $9,999 | 21 (0.6%) | 20 (0.9%) |
| $10,000 to $14,999 | 113 (3.4%) | 346 (15.9%) |
| $15,000 to $19,999 | 192 (5.7%) | 93 (4.3%) |
| $20,000 to $24,999 | 97 (2.9%) | 126 (5.8%) |
| $25,000 to $34,999 | 117 (3.5%) | 501 (23.1%) |
| $35,000 to $49,999 | 281 (8.3%) | 355 (16.3%) |
| $50,000 to $74,999 | 847 (25.1%) | 326 (15.0%) |
| $75,000 to $99,999 | 504 (14.9%) | 186 (8.6%) |
| $100,000 to $149,999 | 783 (23.2%) | 158 (7.3%) |
| $150,000 or more | 330 (9.8%) | 52 (2.4%) |
| Total | 3,374 (100.0%) | 2,173 (100.0%) |
Monthly Housing Cost Tiers in Long County
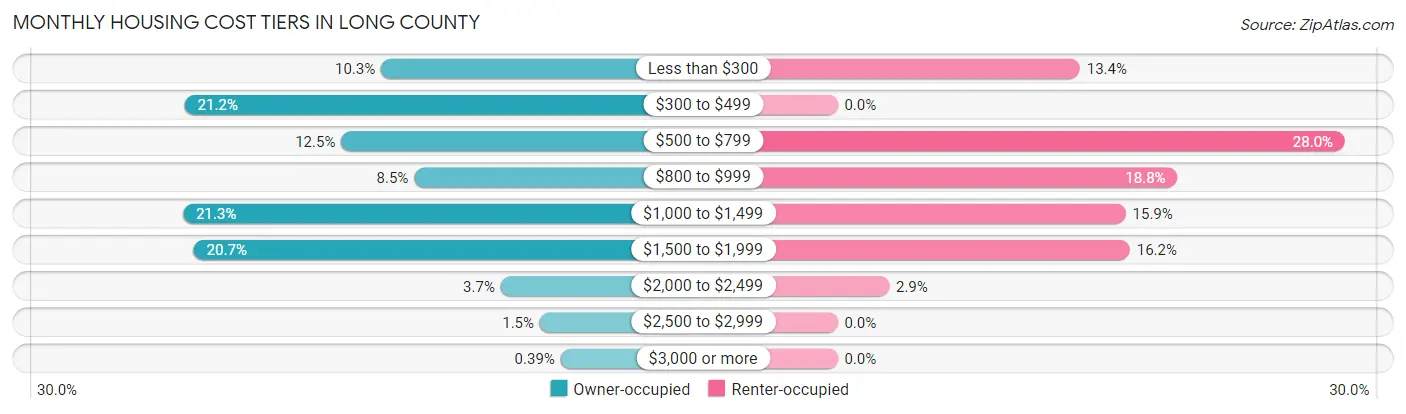
| Monthly Cost | Owner-occupied | Renter-occupied |
| Less than $300 | 348 (10.3%) | 291 (13.4%) |
| $300 to $499 | 714 (21.2%) | 0 (0.0%) |
| $500 to $799 | 422 (12.5%) | 609 (28.0%) |
| $800 to $999 | 286 (8.5%) | 408 (18.8%) |
| $1,000 to $1,499 | 717 (21.2%) | 346 (15.9%) |
| $1,500 to $1,999 | 697 (20.7%) | 351 (16.2%) |
| $2,000 to $2,499 | 125 (3.7%) | 62 (2.9%) |
| $2,500 to $2,999 | 52 (1.5%) | 0 (0.0%) |
| $3,000 or more | 13 (0.4%) | 0 (0.0%) |
| Total | 3,374 (100.0%) | 2,173 (100.0%) |
Physical Housing Characteristics in Long County
Housing Structures in Long County
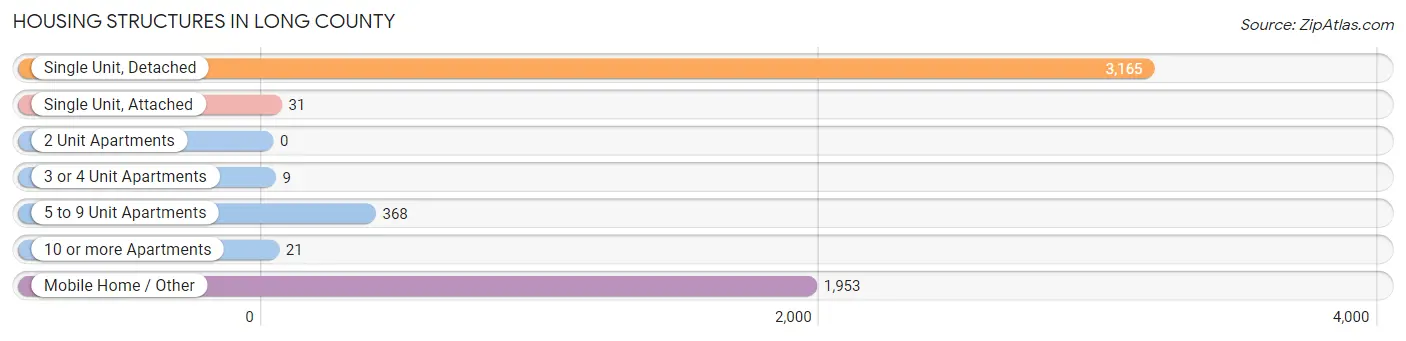
| Structure Type | # Housing Units | % Housing Units |
| Single Unit, Detached | 3,165 | 57.1% |
| Single Unit, Attached | 31 | 0.6% |
| 2 Unit Apartments | 0 | 0.0% |
| 3 or 4 Unit Apartments | 9 | 0.2% |
| 5 to 9 Unit Apartments | 368 | 6.6% |
| 10 or more Apartments | 21 | 0.4% |
| Mobile Home / Other | 1,953 | 35.2% |
| Total | 5,547 | 100.0% |
Housing Structures by Occupancy in Long County
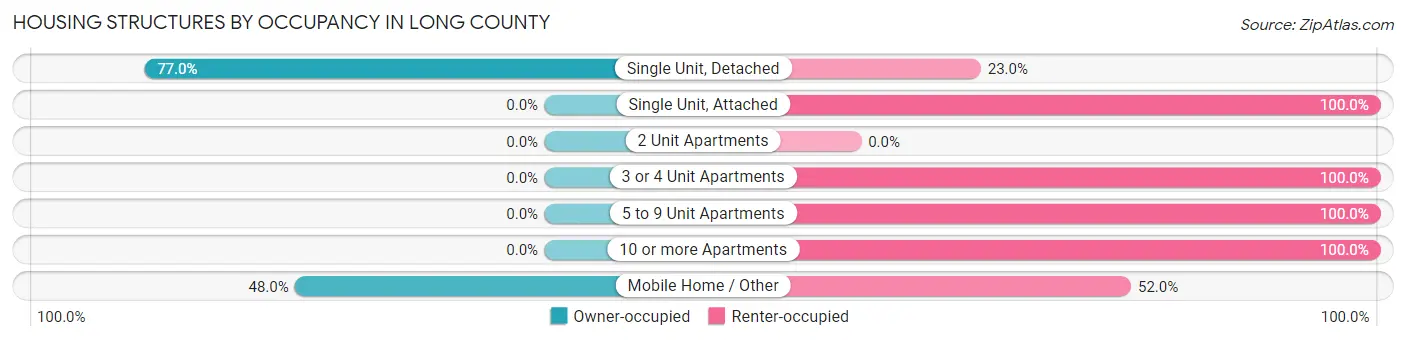
| Structure Type | Owner-occupied | Renter-occupied |
| Single Unit, Detached | 2,436 (77.0%) | 729 (23.0%) |
| Single Unit, Attached | 0 (0.0%) | 31 (100.0%) |
| 2 Unit Apartments | 0 (0.0%) | 0 (0.0%) |
| 3 or 4 Unit Apartments | 0 (0.0%) | 9 (100.0%) |
| 5 to 9 Unit Apartments | 0 (0.0%) | 368 (100.0%) |
| 10 or more Apartments | 0 (0.0%) | 21 (100.0%) |
| Mobile Home / Other | 938 (48.0%) | 1,015 (52.0%) |
| Total | 3,374 (60.8%) | 2,173 (39.2%) |
Housing Structures by Number of Rooms in Long County
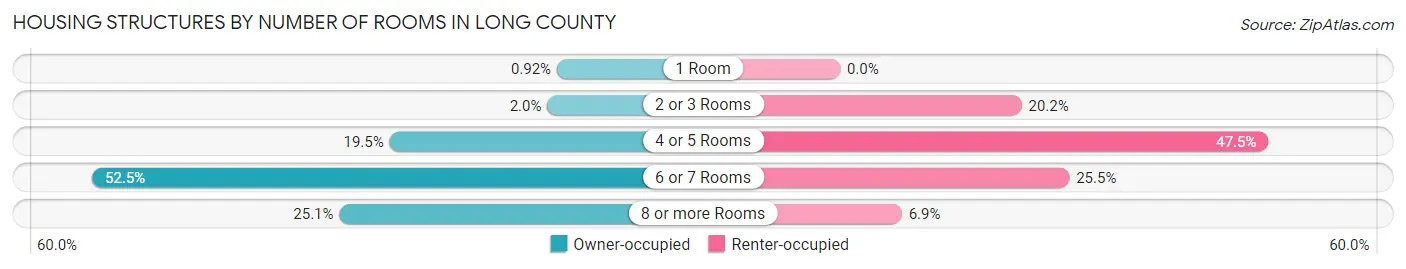
| Number of Rooms | Owner-occupied | Renter-occupied |
| 1 Room | 31 (0.9%) | 0 (0.0%) |
| 2 or 3 Rooms | 67 (2.0%) | 438 (20.2%) |
| 4 or 5 Rooms | 658 (19.5%) | 1,033 (47.5%) |
| 6 or 7 Rooms | 1,772 (52.5%) | 553 (25.5%) |
| 8 or more Rooms | 846 (25.1%) | 149 (6.9%) |
| Total | 3,374 (100.0%) | 2,173 (100.0%) |
Housing Structure by Heating Type in Long County
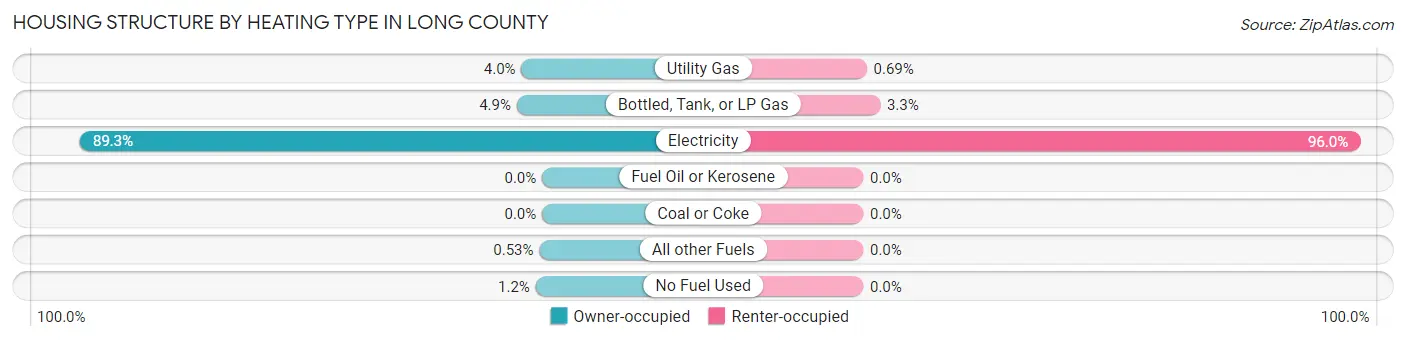
| Heating Type | Owner-occupied | Renter-occupied |
| Utility Gas | 135 (4.0%) | 15 (0.7%) |
| Bottled, Tank, or LP Gas | 165 (4.9%) | 71 (3.3%) |
| Electricity | 3,014 (89.3%) | 2,087 (96.0%) |
| Fuel Oil or Kerosene | 0 (0.0%) | 0 (0.0%) |
| Coal or Coke | 0 (0.0%) | 0 (0.0%) |
| All other Fuels | 18 (0.5%) | 0 (0.0%) |
| No Fuel Used | 42 (1.2%) | 0 (0.0%) |
| Total | 3,374 (100.0%) | 2,173 (100.0%) |
Household Vehicle Usage in Long County
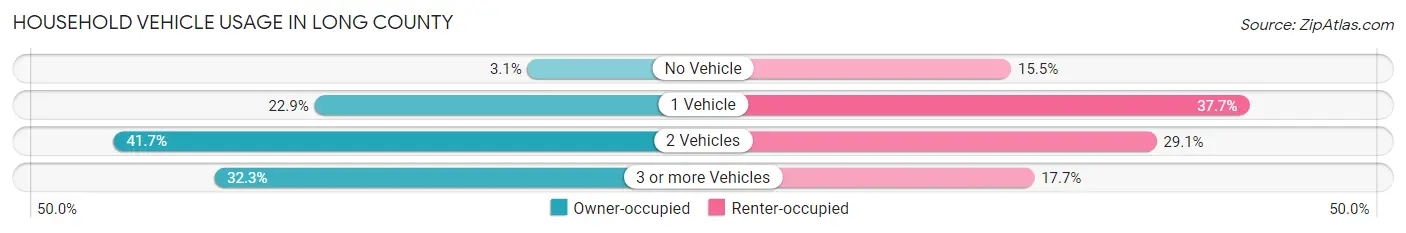
| Vehicles per Household | Owner-occupied | Renter-occupied |
| No Vehicle | 103 (3.0%) | 337 (15.5%) |
| 1 Vehicle | 774 (22.9%) | 820 (37.7%) |
| 2 Vehicles | 1,407 (41.7%) | 632 (29.1%) |
| 3 or more Vehicles | 1,090 (32.3%) | 384 (17.7%) |
| Total | 3,374 (100.0%) | 2,173 (100.0%) |
Real Estate & Mortgages in Long County
Real Estate and Mortgage Overview in Long County
| Characteristic | Without Mortgage | With Mortgage |
| Housing Units | 1,485 | 1,889 |
| Median Property Value | $98,300 | $190,100 |
| Median Household Income | $65,528 | $248 |
| Monthly Housing Costs | $404 | $13 |
| Real Estate Taxes | $1,292 | $138 |
Property Value by Mortgage Status in Long County
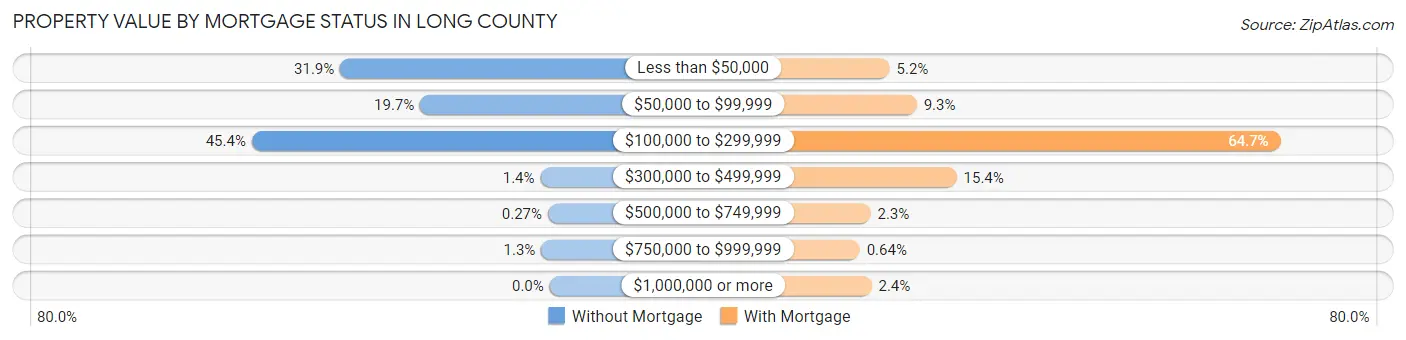
| Property Value | Without Mortgage | With Mortgage |
| Less than $50,000 | 474 (31.9%) | 98 (5.2%) |
| $50,000 to $99,999 | 293 (19.7%) | 176 (9.3%) |
| $100,000 to $299,999 | 674 (45.4%) | 1,223 (64.7%) |
| $300,000 to $499,999 | 21 (1.4%) | 291 (15.4%) |
| $500,000 to $749,999 | 4 (0.3%) | 43 (2.3%) |
| $750,000 to $999,999 | 19 (1.3%) | 12 (0.6%) |
| $1,000,000 or more | 0 (0.0%) | 46 (2.4%) |
| Total | 1,485 (100.0%) | 1,889 (100.0%) |
Household Income by Mortgage Status in Long County
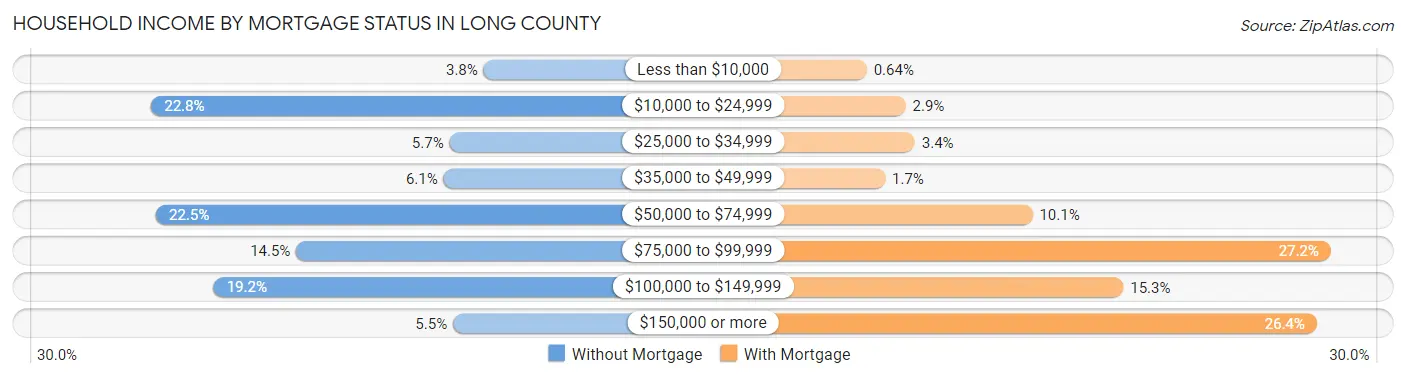
| Household Income | Without Mortgage | With Mortgage |
| Less than $10,000 | 56 (3.8%) | 12 (0.6%) |
| $10,000 to $24,999 | 338 (22.8%) | 54 (2.9%) |
| $25,000 to $34,999 | 85 (5.7%) | 64 (3.4%) |
| $35,000 to $49,999 | 90 (6.1%) | 32 (1.7%) |
| $50,000 to $74,999 | 334 (22.5%) | 191 (10.1%) |
| $75,000 to $99,999 | 215 (14.5%) | 513 (27.2%) |
| $100,000 to $149,999 | 285 (19.2%) | 289 (15.3%) |
| $150,000 or more | 82 (5.5%) | 498 (26.4%) |
| Total | 1,485 (100.0%) | 1,889 (100.0%) |
Property Value to Household Income Ratio in Long County
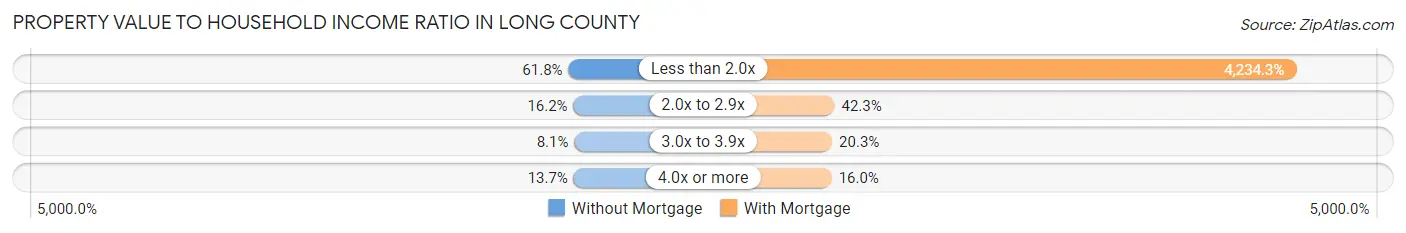
| Value-to-Income Ratio | Without Mortgage | With Mortgage |
| Less than 2.0x | 918 (61.8%) | 79,986 (4,234.3%) |
| 2.0x to 2.9x | 241 (16.2%) | 799 (42.3%) |
| 3.0x to 3.9x | 120 (8.1%) | 383 (20.3%) |
| 4.0x or more | 203 (13.7%) | 303 (16.0%) |
| Total | 1,485 (100.0%) | 1,889 (100.0%) |
Real Estate Taxes by Mortgage Status in Long County
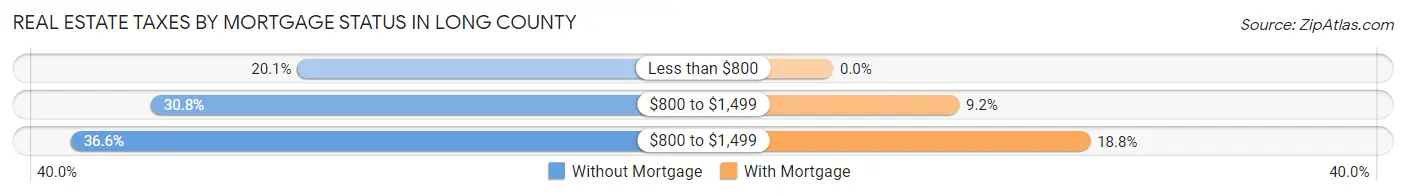
| Property Taxes | Without Mortgage | With Mortgage |
| Less than $800 | 298 (20.1%) | 0 (0.0%) |
| $800 to $1,499 | 457 (30.8%) | 174 (9.2%) |
| $800 to $1,499 | 544 (36.6%) | 355 (18.8%) |
| Total | 1,485 (100.0%) | 1,889 (100.0%) |
Health & Disability in Long County
Health Insurance Coverage by Age in Long County
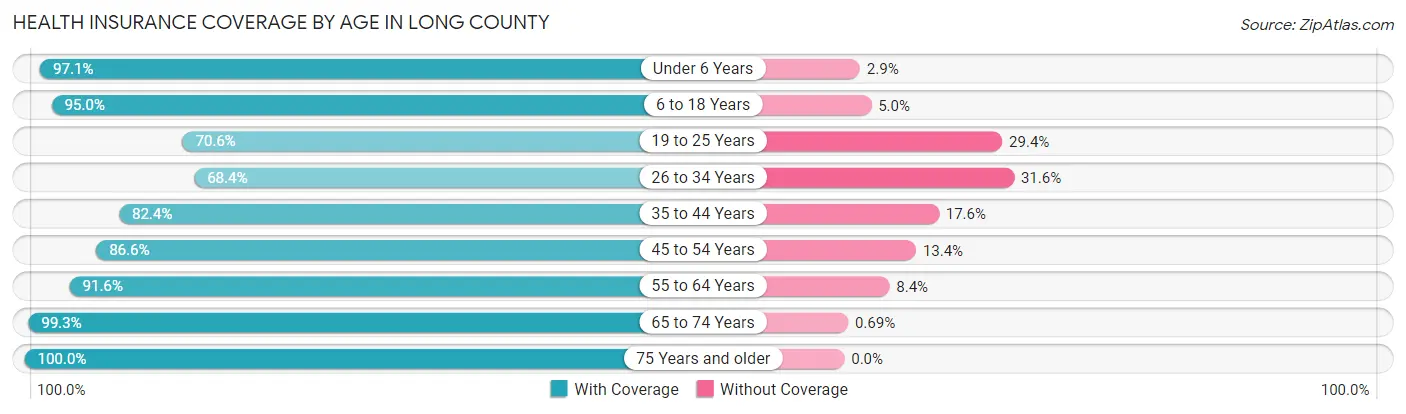
| Age Bracket | With Coverage | Without Coverage |
| Under 6 Years | 1,234 (97.1%) | 37 (2.9%) |
| 6 to 18 Years | 3,425 (95.0%) | 181 (5.0%) |
| 19 to 25 Years | 930 (70.6%) | 388 (29.4%) |
| 26 to 34 Years | 1,342 (68.4%) | 621 (31.6%) |
| 35 to 44 Years | 1,968 (82.4%) | 421 (17.6%) |
| 45 to 54 Years | 1,608 (86.6%) | 248 (13.4%) |
| 55 to 64 Years | 1,918 (91.6%) | 176 (8.4%) |
| 65 to 74 Years | 1,002 (99.3%) | 7 (0.7%) |
| 75 Years and older | 433 (100.0%) | 0 (0.0%) |
| Total | 13,860 (87.0%) | 2,079 (13.0%) |
Health Insurance Coverage by Citizenship Status in Long County
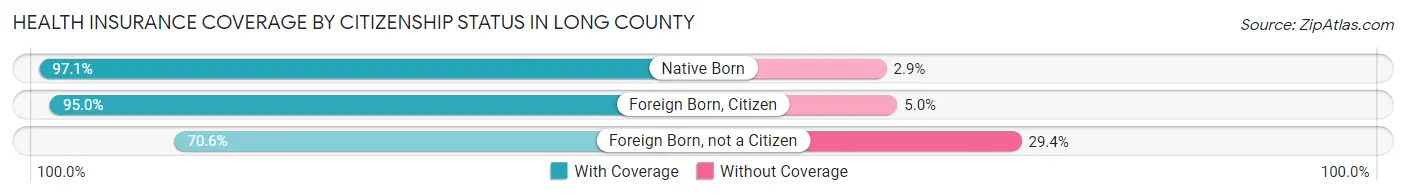
| Citizenship Status | With Coverage | Without Coverage |
| Native Born | 1,234 (97.1%) | 37 (2.9%) |
| Foreign Born, Citizen | 3,425 (95.0%) | 181 (5.0%) |
| Foreign Born, not a Citizen | 930 (70.6%) | 388 (29.4%) |
Health Insurance Coverage by Household Income in Long County
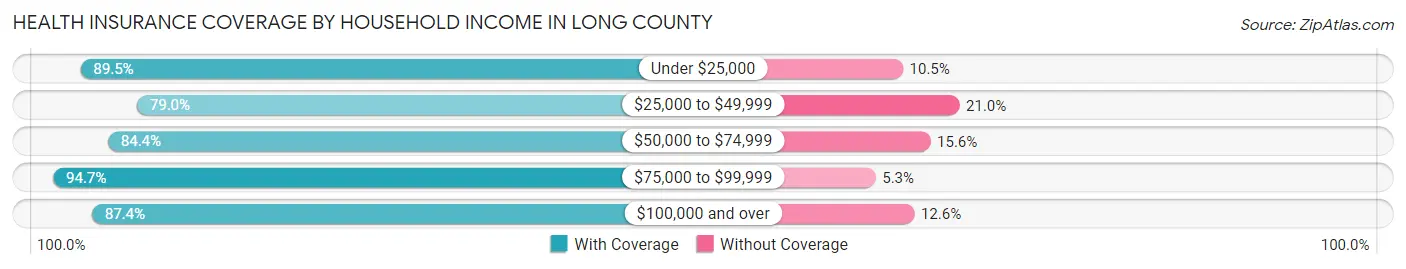
| Household Income | With Coverage | Without Coverage |
| Under $25,000 | 2,071 (89.5%) | 242 (10.5%) |
| $25,000 to $49,999 | 2,211 (79.0%) | 589 (21.0%) |
| $50,000 to $74,999 | 2,601 (84.4%) | 481 (15.6%) |
| $75,000 to $99,999 | 2,713 (94.7%) | 153 (5.3%) |
| $100,000 and over | 4,264 (87.4%) | 614 (12.6%) |
Public vs Private Health Insurance Coverage by Age in Long County
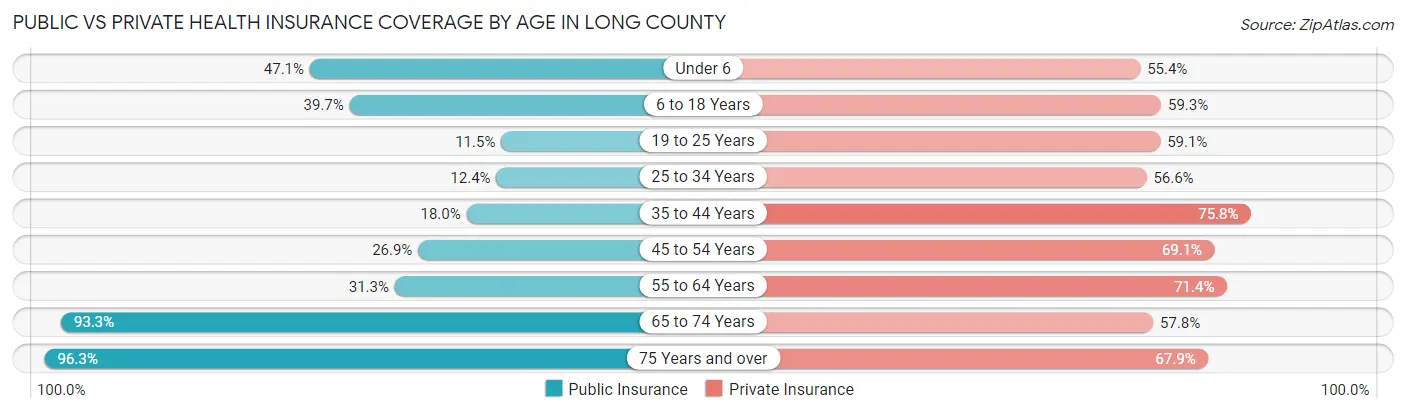
| Age Bracket | Public Insurance | Private Insurance |
| Under 6 | 598 (47.0%) | 704 (55.4%) |
| 6 to 18 Years | 1,431 (39.7%) | 2,137 (59.3%) |
| 19 to 25 Years | 152 (11.5%) | 779 (59.1%) |
| 25 to 34 Years | 244 (12.4%) | 1,110 (56.6%) |
| 35 to 44 Years | 429 (18.0%) | 1,811 (75.8%) |
| 45 to 54 Years | 500 (26.9%) | 1,282 (69.1%) |
| 55 to 64 Years | 655 (31.3%) | 1,494 (71.4%) |
| 65 to 74 Years | 941 (93.3%) | 583 (57.8%) |
| 75 Years and over | 417 (96.3%) | 294 (67.9%) |
| Total | 5,367 (33.7%) | 10,194 (64.0%) |
Disability Status by Sex by Age in Long County
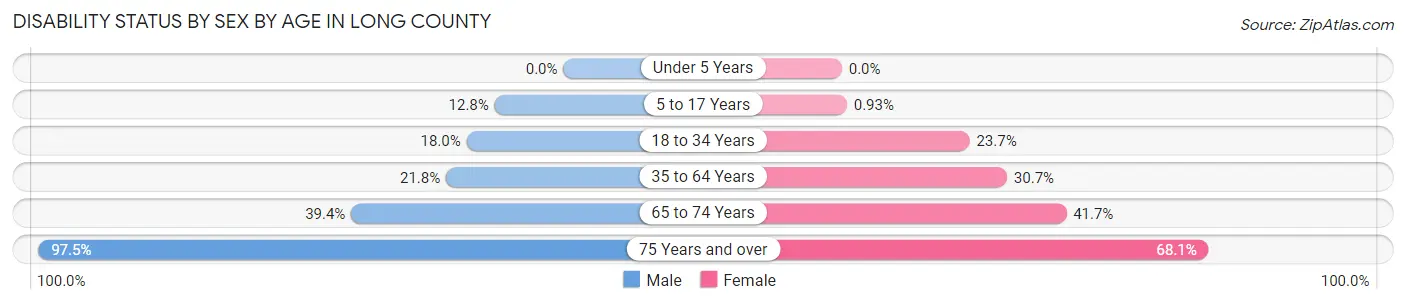
| Age Bracket | Male | Female |
| Under 5 Years | 0 (0.0%) | 0 (0.0%) |
| 5 to 17 Years | 257 (12.8%) | 15 (0.9%) |
| 18 to 34 Years | 291 (18.0%) | 456 (23.7%) |
| 35 to 64 Years | 669 (21.8%) | 1,001 (30.6%) |
| 65 to 74 Years | 178 (39.4%) | 232 (41.6%) |
| 75 Years and over | 193 (97.5%) | 160 (68.1%) |
Disability Class by Sex by Age in Long County
Disability Class: Hearing Difficulty
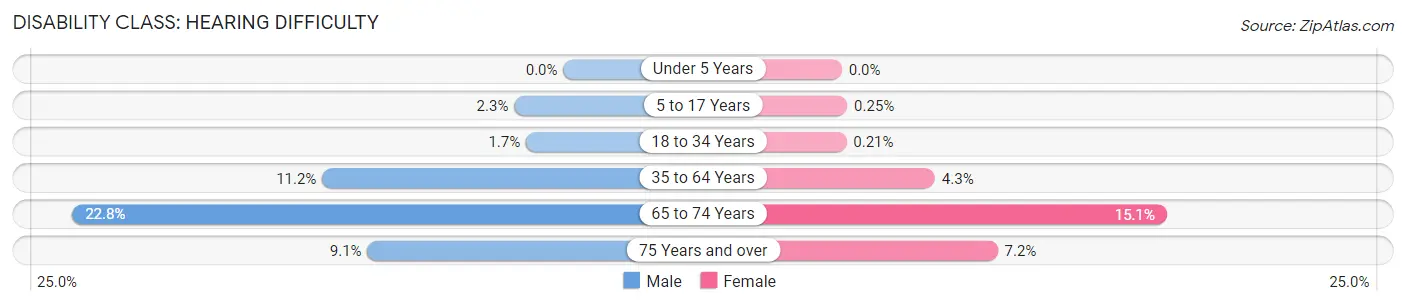
| Age Bracket | Male | Female |
| Under 5 Years | 0 (0.0%) | 0 (0.0%) |
| 5 to 17 Years | 46 (2.3%) | 4 (0.3%) |
| 18 to 34 Years | 28 (1.7%) | 4 (0.2%) |
| 35 to 64 Years | 344 (11.2%) | 141 (4.3%) |
| 65 to 74 Years | 103 (22.8%) | 84 (15.1%) |
| 75 Years and over | 18 (9.1%) | 17 (7.2%) |
Disability Class: Vision Difficulty
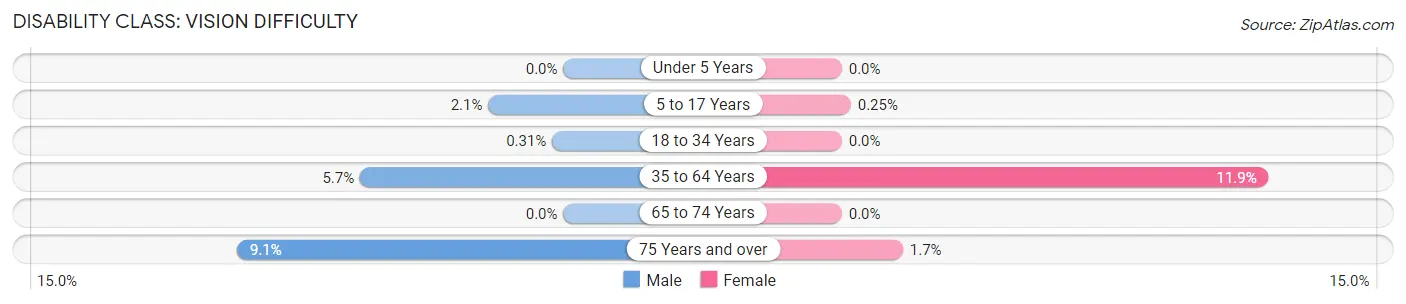
| Age Bracket | Male | Female |
| Under 5 Years | 0 (0.0%) | 0 (0.0%) |
| 5 to 17 Years | 42 (2.1%) | 4 (0.3%) |
| 18 to 34 Years | 5 (0.3%) | 0 (0.0%) |
| 35 to 64 Years | 174 (5.7%) | 388 (11.9%) |
| 65 to 74 Years | 0 (0.0%) | 0 (0.0%) |
| 75 Years and over | 18 (9.1%) | 4 (1.7%) |
Disability Class: Cognitive Difficulty
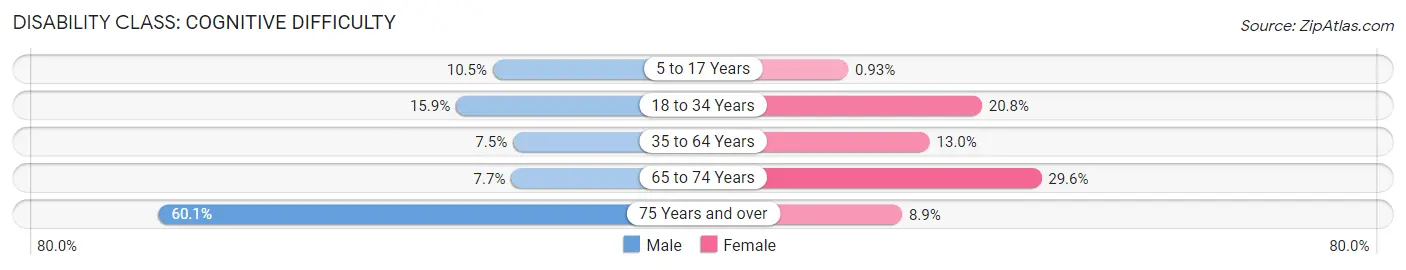
| Age Bracket | Male | Female |
| 5 to 17 Years | 211 (10.5%) | 15 (0.9%) |
| 18 to 34 Years | 258 (15.9%) | 400 (20.8%) |
| 35 to 64 Years | 230 (7.5%) | 426 (13.0%) |
| 65 to 74 Years | 35 (7.7%) | 165 (29.6%) |
| 75 Years and over | 119 (60.1%) | 21 (8.9%) |
Disability Class: Ambulatory Difficulty
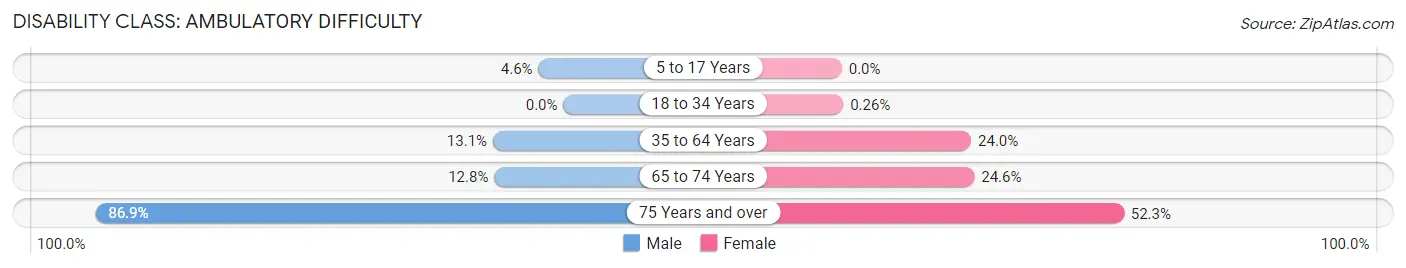
| Age Bracket | Male | Female |
| 5 to 17 Years | 93 (4.6%) | 0 (0.0%) |
| 18 to 34 Years | 0 (0.0%) | 5 (0.3%) |
| 35 to 64 Years | 402 (13.1%) | 784 (24.0%) |
| 65 to 74 Years | 58 (12.8%) | 137 (24.6%) |
| 75 Years and over | 172 (86.9%) | 123 (52.3%) |
Disability Class: Self-Care Difficulty
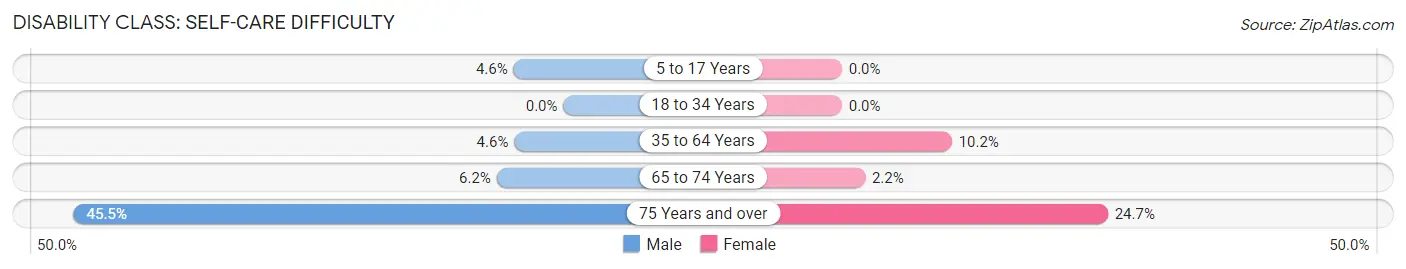
| Age Bracket | Male | Female |
| 5 to 17 Years | 93 (4.6%) | 0 (0.0%) |
| 18 to 34 Years | 0 (0.0%) | 0 (0.0%) |
| 35 to 64 Years | 140 (4.6%) | 333 (10.2%) |
| 65 to 74 Years | 28 (6.2%) | 12 (2.1%) |
| 75 Years and over | 90 (45.5%) | 58 (24.7%) |
Technology Access in Long County
Computing Device Access in Long County
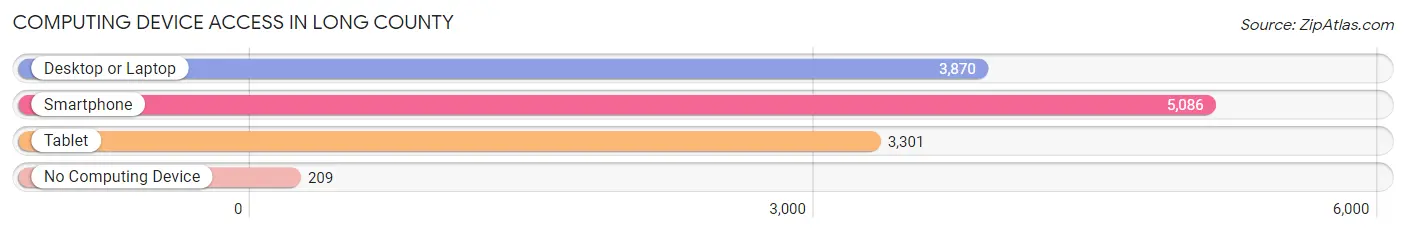
| Device Type | # Households | % Households |
| Desktop or Laptop | 3,870 | 69.8% |
| Smartphone | 5,086 | 91.7% |
| Tablet | 3,301 | 59.5% |
| No Computing Device | 209 | 3.8% |
| Total | 5,547 | 100.0% |
Internet Access in Long County
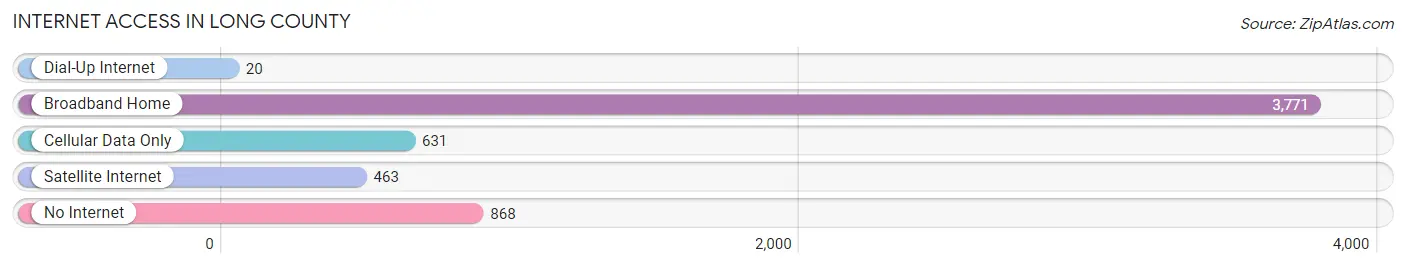
| Internet Type | # Households | % Households |
| Dial-Up Internet | 20 | 0.4% |
| Broadband Home | 3,771 | 68.0% |
| Cellular Data Only | 631 | 11.4% |
| Satellite Internet | 463 | 8.4% |
| No Internet | 868 | 15.7% |
| Total | 5,547 | 100.0% |
Long County Summary
Long County is a county located in the southeastern part of the U.S. state of Georgia. As of the 2010 census, the population was 14,464. The county seat is Ludowici. The county was created on August 17, 1920.
Geography
Long County is located in the southeastern part of Georgia, along the Atlantic Ocean. It is bordered by McIntosh County to the north, Liberty County to the east, and Wayne County to the south. The county has a total area of 441 square miles, of which 437 square miles is land and 4.2 square miles (1.0%) is water.
The Altamaha River forms the western boundary of the county. The county is located in the Altamaha River sub-basin of the larger basin by the same name.
Demographics
As of the 2010 United States Census, there were 14,464 people, 5,093 households, and 3,717 families residing in the county. The population density was 33.0 inhabitants per square mile (12.7/km2). There were 6,072 housing units at an average density of 13.9 per square mile (5.4/km2). The racial makeup of the county was 68.2% white, 27.2% black or African American, 0.7% Asian, 0.3% American Indian, 2.2% from other races, and 1.4% from two or more races. Those of Hispanic or Latino origin made up 4.2% of the population.
In terms of ancestry 11 2 were American 8 2 were English and 6 2 were Irish
Of the 5,093 households, 36.3% had children under the age of 18 living with them, 48.2% were married couples living together, 17.7% had a female householder with no husband present, 28.2% were non-families, and 23.7% of all households were made up of individuals. The average household size was 2.64 and the average family size was 3.11. The median age was 36.2 years.
The median income for a household in the county was $37,845 and the median income for a family was $45,945. Males had a median income of $35,945 versus $25,945 for females. The per capita income for the county was $17,845. About 14.2% of families and 17.2% of the population were below the poverty line, including 22.2% of those under age 18 and 14.2% of those age 65 or over.
Economy
Long County is a rural county with a largely agricultural economy. The county is home to several large farms, including the Long County Farm Bureau, which is the largest farm in the county. The county also has a number of small businesses, including a number of restaurants, convenience stores, and other retail establishments.
The county is also home to a number of industrial and manufacturing businesses, including a paper mill, a lumber mill, and a number of other manufacturing plants. The county is also home to a number of military installations, including the Marine Corps Logistics Base in nearby Hinesville.
The county is served by the Long County School System, which includes four elementary schools, one middle school, and one high school. The county is also home to a number of private schools, including the Long County Christian Academy.
Conclusion
Long County is a rural county located in the southeastern part of Georgia. The county has a population of 14,464 and is home to a largely agricultural economy. The county is served by the Long County School System and is home to a number of military installations. The county is also home to a number of small businesses and industrial and manufacturing businesses.
Common Questions
What is Per Capita Income in Long County?
Per Capita income in Long County is $26,995.
What is the Median Family Income in Long County?
Median Family Income in Long County is $67,071.
What is the Median Household income in Long County?
Median Household Income in Long County is $56,819.
What is Income or Wage Gap in Long County?
Income or Wage Gap in Long County is 38.6%.
Women in Long County earn 61.4 cents for every dollar earned by a man.
What is Family Income Deficit in Long County?
Family Income Deficit in Long County is $7,962.
Families that are below poverty line in Long County earn $7,962 less on average than the poverty threshold level.
What is Inequality or Gini Index in Long County?
Inequality or Gini Index in Long County is 0.41.
What is the Total Population of Long County?
Total Population of Long County is 16,804.
What is the Total Male Population of Long County?
Total Male Population of Long County is 8,679.
What is the Total Female Population of Long County?
Total Female Population of Long County is 8,125.
What is the Ratio of Males per 100 Females in Long County?
There are 106.82 Males per 100 Females in Long County.
What is the Ratio of Females per 100 Males in Long County?
There are 93.62 Females per 100 Males in Long County.
What is the Median Population Age in Long County?
Median Population Age in Long County is 34.4 Years.
What is the Average Family Size in Long County
Average Family Size in Long County is 3.4 People.
What is the Average Household Size in Long County
Average Household Size in Long County is 3.0 People.
How Large is the Labor Force in Long County?
There are 7,881 People in the Labor Forcein in Long County.
What is the Percentage of People in the Labor Force in Long County?
61.9% of People are in the Labor Force in Long County.
What is the Unemployment Rate in Long County?
Unemployment Rate in Long County is 4.5%.