Lincoln County, GA Map & Demographics
Lincoln County Map
Lincoln County Overview
$28,414
PER CAPITA INCOME
$63,958
AVG FAMILY INCOME
$50,754
AVG HOUSEHOLD INCOME
31.1%
WAGE / INCOME GAP [ % ]
68.9¢/ $1
WAGE / INCOME GAP [ $ ]
$7,244
FAMILY INCOME DEFICIT
0.44
INEQUALITY / GINI INDEX
7,726
TOTAL POPULATION
3,794
MALE POPULATION
3,932
FEMALE POPULATION
96.49
MALES / 100 FEMALES
103.64
FEMALES / 100 MALES
47.1
MEDIAN AGE
3.0
AVG FAMILY SIZE
2.5
AVG HOUSEHOLD SIZE
3,360
LABOR FORCE [ PEOPLE ]
52.0%
PERCENT IN LABOR FORCE
3.6%
UNEMPLOYMENT RATE
Lincoln County Area Codes
Income in Lincoln County
Income Overview in Lincoln County
Per Capita Income in Lincoln County is $28,414, while median incomes of families and households are $63,958 and $50,754 respectively.
| Characteristic | Number | Measure |
| Per Capita Income | 7,726 | $28,414 |
| Median Family Income | 2,156 | $63,958 |
| Mean Family Income | 2,156 | $85,104 |
| Median Household Income | 3,015 | $50,754 |
| Mean Household Income | 3,015 | $71,037 |
| Income Deficit | 2,156 | $7,244 |
| Wage / Income Gap (%) | 7,726 | 31.10% |
| Wage / Income Gap ($) | 7,726 | 68.90¢ per $1 |
| Gini / Inequality Index | 7,726 | 0.44 |
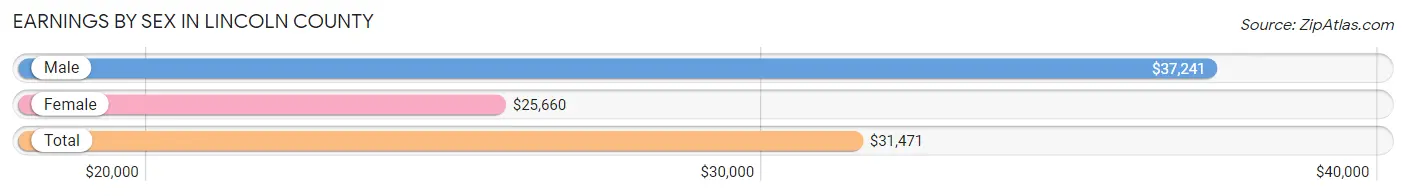
Earnings by Sex in Lincoln County
Average Earnings in Lincoln County are $31,471, $37,241 for men and $25,660 for women, a difference of 31.1%.
| Sex | Number | Average Earnings |
| Male | 1,754 (50.0%) | $37,241 |
| Female | 1,754 (50.0%) | $25,660 |
| Total | 3,508 (100.0%) | $31,471 |
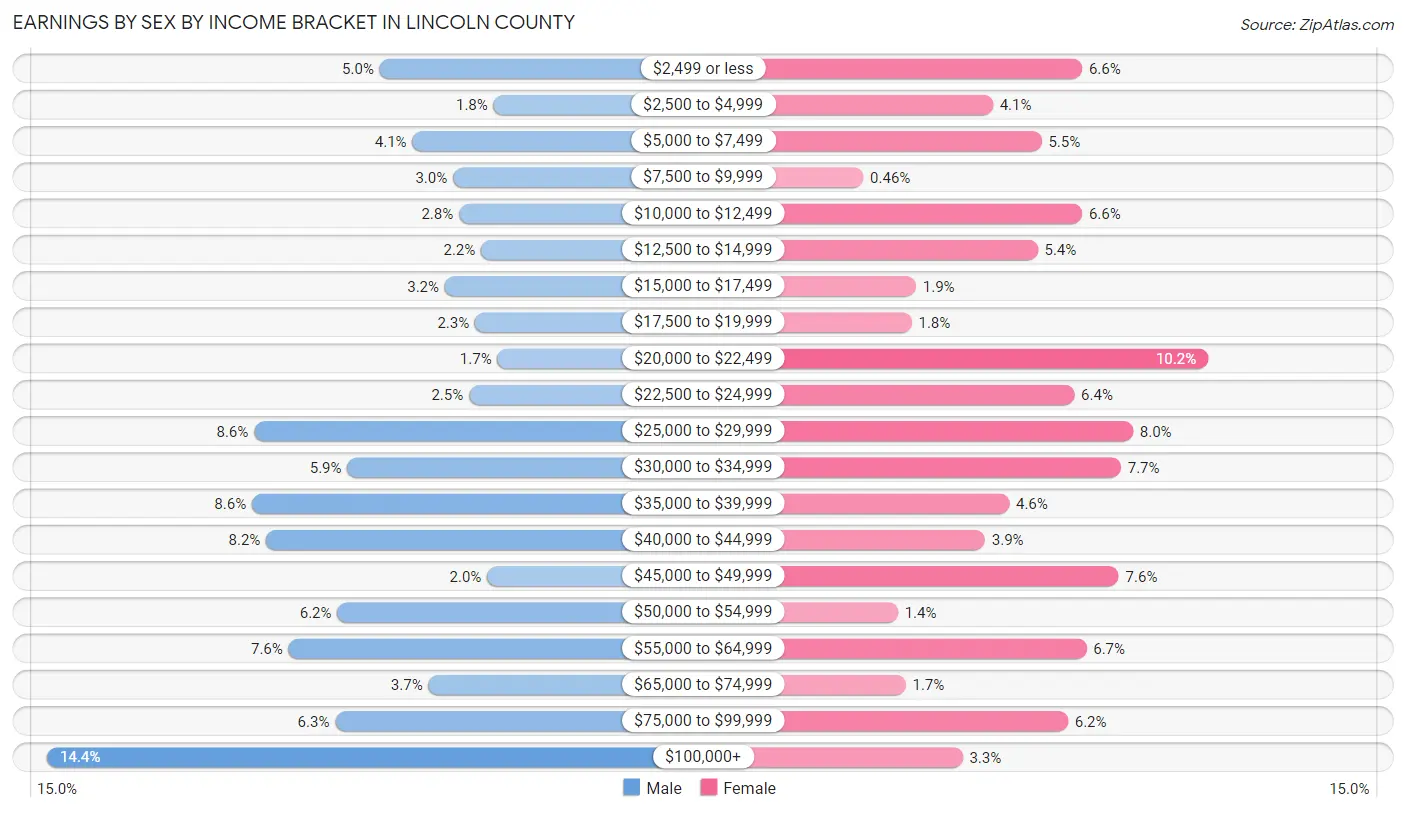
Earnings by Sex by Income Bracket in Lincoln County
The most common earnings brackets in Lincoln County are $100,000+ for men (252 | 14.4%) and $20,000 to $22,499 for women (178 | 10.2%).
| Income | Male | Female |
| $2,499 or less | 88 (5.0%) | 116 (6.6%) |
| $2,500 to $4,999 | 32 (1.8%) | 72 (4.1%) |
| $5,000 to $7,499 | 72 (4.1%) | 96 (5.5%) |
| $7,500 to $9,999 | 52 (3.0%) | 8 (0.5%) |
| $10,000 to $12,499 | 49 (2.8%) | 116 (6.6%) |
| $12,500 to $14,999 | 38 (2.2%) | 94 (5.4%) |
| $15,000 to $17,499 | 56 (3.2%) | 34 (1.9%) |
| $17,500 to $19,999 | 41 (2.3%) | 32 (1.8%) |
| $20,000 to $22,499 | 30 (1.7%) | 178 (10.2%) |
| $22,500 to $24,999 | 44 (2.5%) | 112 (6.4%) |
| $25,000 to $29,999 | 150 (8.6%) | 141 (8.0%) |
| $30,000 to $34,999 | 104 (5.9%) | 135 (7.7%) |
| $35,000 to $39,999 | 151 (8.6%) | 80 (4.6%) |
| $40,000 to $44,999 | 144 (8.2%) | 68 (3.9%) |
| $45,000 to $49,999 | 35 (2.0%) | 134 (7.6%) |
| $50,000 to $54,999 | 109 (6.2%) | 25 (1.4%) |
| $55,000 to $64,999 | 133 (7.6%) | 118 (6.7%) |
| $65,000 to $74,999 | 64 (3.6%) | 29 (1.7%) |
| $75,000 to $99,999 | 110 (6.3%) | 109 (6.2%) |
| $100,000+ | 252 (14.4%) | 57 (3.3%) |
| Total | 1,754 (100.0%) | 1,754 (100.0%) |
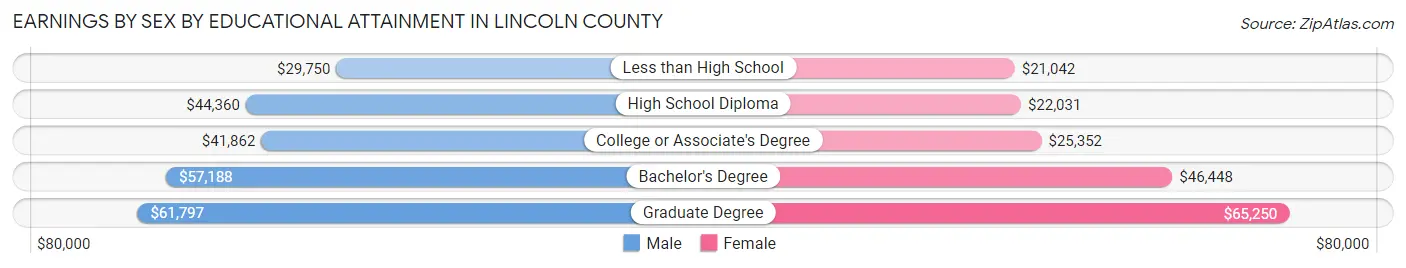
Earnings by Sex by Educational Attainment in Lincoln County
Average earnings in Lincoln County are $42,234 for men and $27,591 for women, a difference of 34.7%. Men with an educational attainment of graduate degree enjoy the highest average annual earnings of $61,797, while those with less than high school education earn the least with $29,750. Women with an educational attainment of graduate degree earn the most with the average annual earnings of $65,250, while those with less than high school education have the smallest earnings of $21,042.
| Educational Attainment | Male Income | Female Income |
| Less than High School | $29,750 | $21,042 |
| High School Diploma | $44,360 | $22,031 |
| College or Associate's Degree | $41,862 | $25,352 |
| Bachelor's Degree | $57,188 | $46,448 |
| Graduate Degree | $61,797 | $65,250 |
| Total | $42,234 | $27,591 |
Family Income in Lincoln County
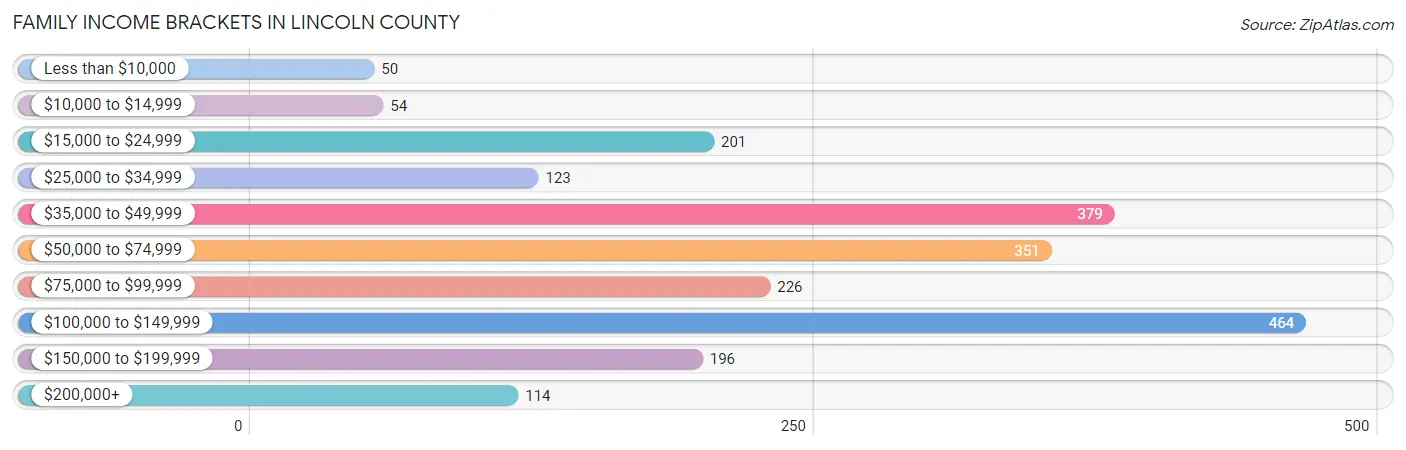
Family Income Brackets in Lincoln County
According to the Lincoln County family income data, there are 464 families falling into the $100,000 to $149,999 income range, which is the most common income bracket and makes up 21.5% of all families. Conversely, the less than $10,000 income bracket is the least frequent group with only 50 families (2.3%) belonging to this category.
| Income Bracket | # Families | % Families |
| Less than $10,000 | 50 | 2.3% |
| $10,000 to $14,999 | 54 | 2.5% |
| $15,000 to $24,999 | 201 | 9.3% |
| $25,000 to $34,999 | 123 | 5.7% |
| $35,000 to $49,999 | 379 | 17.6% |
| $50,000 to $74,999 | 351 | 16.3% |
| $75,000 to $99,999 | 226 | 10.5% |
| $100,000 to $149,999 | 464 | 21.5% |
| $150,000 to $199,999 | 196 | 9.1% |
| $200,000+ | 114 | 5.3% |
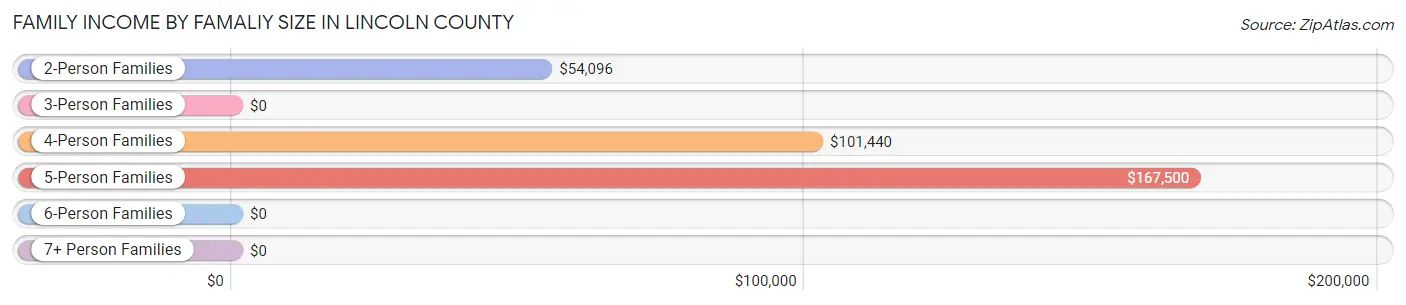
Family Income by Famaliy Size in Lincoln County
5-person families (146 | 6.8%) account for the highest median family income in Lincoln County with $167,500 per family, while 5-person families (146 | 6.8%) have the highest median income of $33,500 per family member.
| Income Bracket | # Families | Median Income |
| 2-Person Families | 1,312 (60.9%) | $54,096 |
| 3-Person Families | 385 (17.9%) | $0 |
| 4-Person Families | 263 (12.2%) | $101,440 |
| 5-Person Families | 146 (6.8%) | $167,500 |
| 6-Person Families | 46 (2.1%) | $0 |
| 7+ Person Families | 4 (0.2%) | $0 |
| Total | 2,156 (100.0%) | $63,958 |
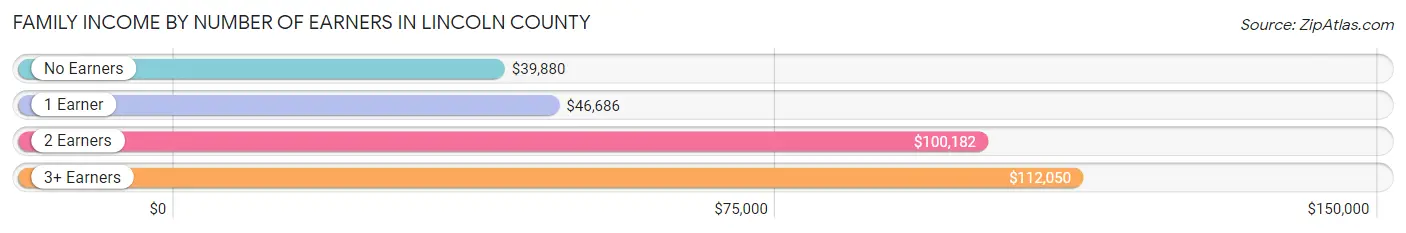
Family Income by Number of Earners in Lincoln County
The median family income in Lincoln County is $63,958, with families comprising 3+ earners (221) having the highest median family income of $112,050, while families with no earners (575) have the lowest median family income of $39,880, accounting for 10.2% and 26.7% of families, respectively.
| Number of Earners | # Families | Median Income |
| No Earners | 575 (26.7%) | $39,880 |
| 1 Earner | 727 (33.7%) | $46,686 |
| 2 Earners | 633 (29.4%) | $100,182 |
| 3+ Earners | 221 (10.2%) | $112,050 |
| Total | 2,156 (100.0%) | $63,958 |
Household Income in Lincoln County
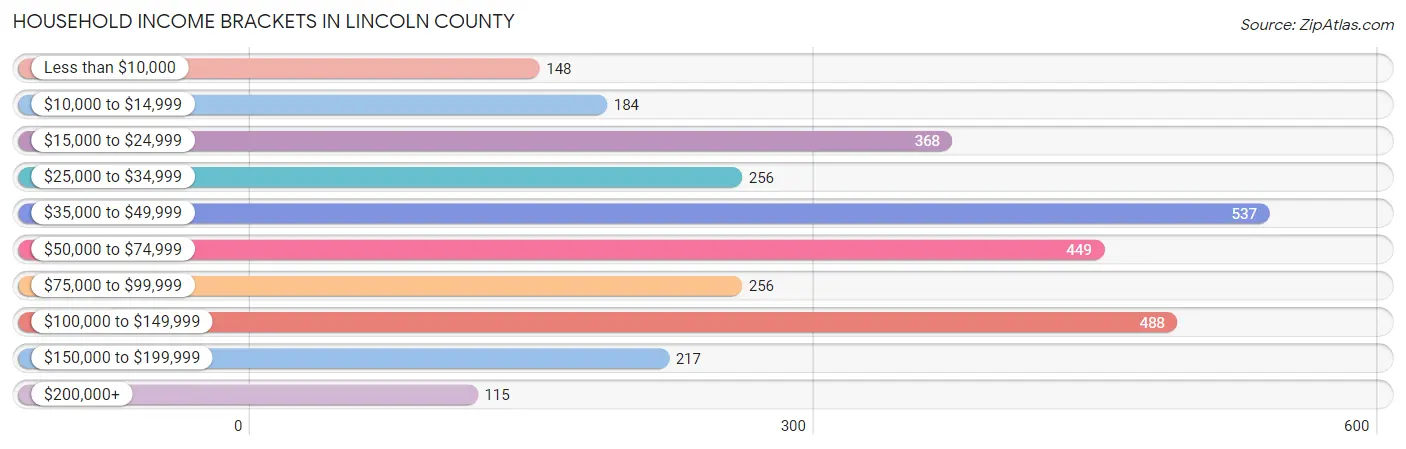
Household Income Brackets in Lincoln County
With 537 households falling in the category, the $35,000 to $49,999 income range is the most frequent in Lincoln County, accounting for 17.8% of all households. In contrast, only 115 households (3.8%) fall into the $200,000+ income bracket, making it the least populous group.
| Income Bracket | # Households | % Households |
| Less than $10,000 | 148 | 4.9% |
| $10,000 to $14,999 | 184 | 6.1% |
| $15,000 to $24,999 | 368 | 12.2% |
| $25,000 to $34,999 | 256 | 8.5% |
| $35,000 to $49,999 | 537 | 17.8% |
| $50,000 to $74,999 | 449 | 14.9% |
| $75,000 to $99,999 | 256 | 8.5% |
| $100,000 to $149,999 | 488 | 16.2% |
| $150,000 to $199,999 | 217 | 7.2% |
| $200,000+ | 115 | 3.8% |
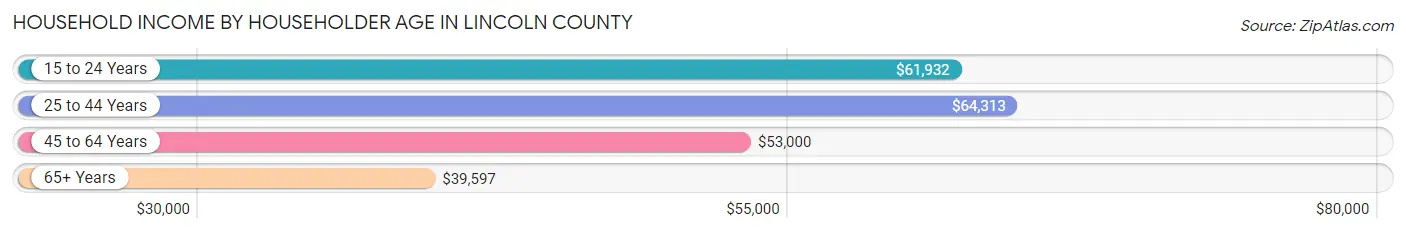
Household Income by Householder Age in Lincoln County
The median household income in Lincoln County is $50,754, with the highest median household income of $64,313 found in the 25 to 44 years age bracket for the primary householder. A total of 667 households (22.1%) fall into this category. Meanwhile, the 65+ years age bracket for the primary householder has the lowest median household income of $39,597, with 1,155 households (38.3%) in this group.
| Income Bracket | # Households | Median Income |
| 15 to 24 Years | 31 (1.0%) | $61,932 |
| 25 to 44 Years | 667 (22.1%) | $64,313 |
| 45 to 64 Years | 1,162 (38.5%) | $53,000 |
| 65+ Years | 1,155 (38.3%) | $39,597 |
| Total | 3,015 (100.0%) | $50,754 |
Poverty in Lincoln County
Income Below Poverty by Sex and Age in Lincoln County
With 19.9% poverty level for males and 16.4% for females among the residents of Lincoln County, 16 and 17 year old males and 5 year old females are the most vulnerable to poverty, with 67 males (62.6%) and 7 females (77.8%) in their respective age groups living below the poverty level.
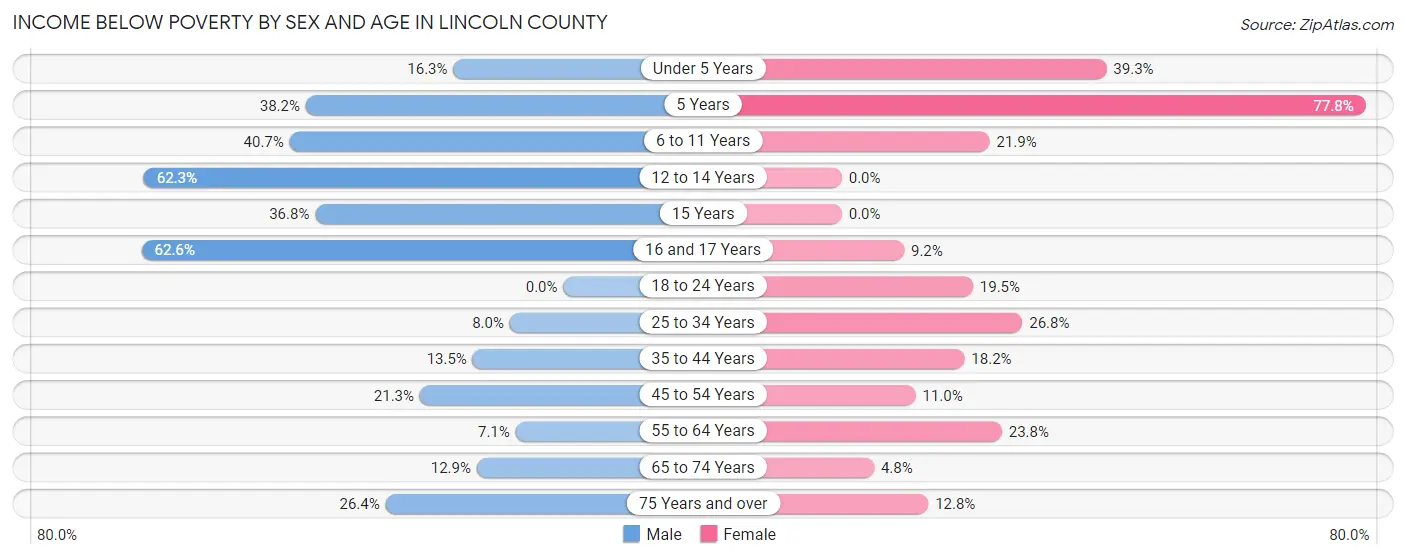
| Age Bracket | Male | Female |
| Under 5 Years | 24 (16.3%) | 66 (39.3%) |
| 5 Years | 26 (38.2%) | 7 (77.8%) |
| 6 to 11 Years | 63 (40.6%) | 43 (21.9%) |
| 12 to 14 Years | 185 (62.3%) | 0 (0.0%) |
| 15 Years | 7 (36.8%) | 0 (0.0%) |
| 16 and 17 Years | 67 (62.6%) | 11 (9.2%) |
| 18 to 24 Years | 0 (0.0%) | 43 (19.5%) |
| 25 to 34 Years | 26 (8.0%) | 82 (26.8%) |
| 35 to 44 Years | 51 (13.5%) | 102 (18.2%) |
| 45 to 54 Years | 91 (21.3%) | 52 (11.0%) |
| 55 to 64 Years | 44 (7.1%) | 153 (23.8%) |
| 65 to 74 Years | 68 (12.9%) | 29 (4.8%) |
| 75 Years and over | 94 (26.4%) | 54 (12.8%) |
| Total | 746 (19.9%) | 642 (16.4%) |
Income Above Poverty by Sex and Age in Lincoln County
According to the poverty statistics in Lincoln County, males aged 18 to 24 years and females aged 12 to 14 years are the age groups that are most secure financially, with 100.0% of males and 100.0% of females in these age groups living above the poverty line.
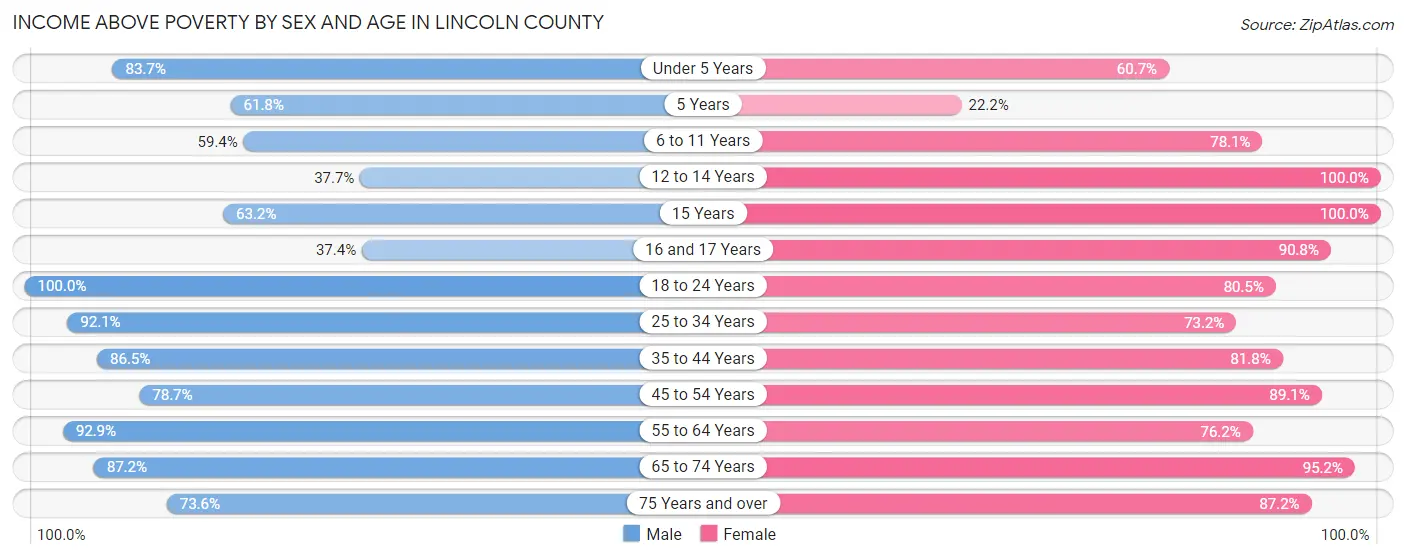
| Age Bracket | Male | Female |
| Under 5 Years | 123 (83.7%) | 102 (60.7%) |
| 5 Years | 42 (61.8%) | 2 (22.2%) |
| 6 to 11 Years | 92 (59.4%) | 153 (78.1%) |
| 12 to 14 Years | 112 (37.7%) | 109 (100.0%) |
| 15 Years | 12 (63.2%) | 86 (100.0%) |
| 16 and 17 Years | 40 (37.4%) | 108 (90.8%) |
| 18 to 24 Years | 312 (100.0%) | 178 (80.5%) |
| 25 to 34 Years | 301 (92.0%) | 224 (73.2%) |
| 35 to 44 Years | 328 (86.5%) | 458 (81.8%) |
| 45 to 54 Years | 336 (78.7%) | 423 (89.0%) |
| 55 to 64 Years | 577 (92.9%) | 491 (76.2%) |
| 65 to 74 Years | 461 (87.2%) | 578 (95.2%) |
| 75 Years and over | 262 (73.6%) | 367 (87.2%) |
| Total | 2,998 (80.1%) | 3,279 (83.6%) |
Income Below Poverty Among Married-Couple Families in Lincoln County
The poverty statistics for married-couple families in Lincoln County show that 4.9% or 73 of the total 1,492 families live below the poverty line. Families with 3 or 4 children have the highest poverty rate of 17.2%, comprising of 10 families. On the other hand, families with 5 or more children have the lowest poverty rate of 0.0%, which includes 0 families.
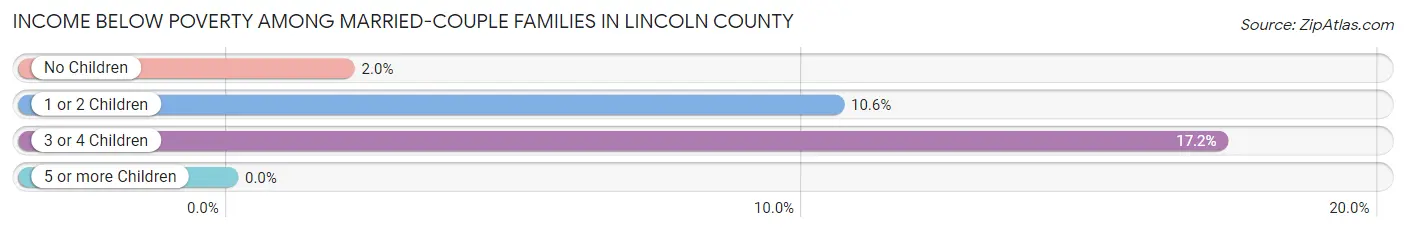
| Children | Above Poverty | Below Poverty |
| No Children | 1,011 (98.0%) | 21 (2.0%) |
| 1 or 2 Children | 356 (89.4%) | 42 (10.5%) |
| 3 or 4 Children | 48 (82.8%) | 10 (17.2%) |
| 5 or more Children | 4 (100.0%) | 0 (0.0%) |
| Total | 1,419 (95.1%) | 73 (4.9%) |
Income Below Poverty Among Single-Parent Households in Lincoln County
According to the poverty data in Lincoln County, 38.9% or 81 single-father households and 24.8% or 113 single-mother households are living below the poverty line. Among single-father households, those with 3 or 4 children have the highest poverty rate, with 20 households (100.0%) experiencing poverty. Likewise, among single-mother households, those with 1 or 2 children have the highest poverty rate, with 99 households (44.4%) falling below the poverty line.
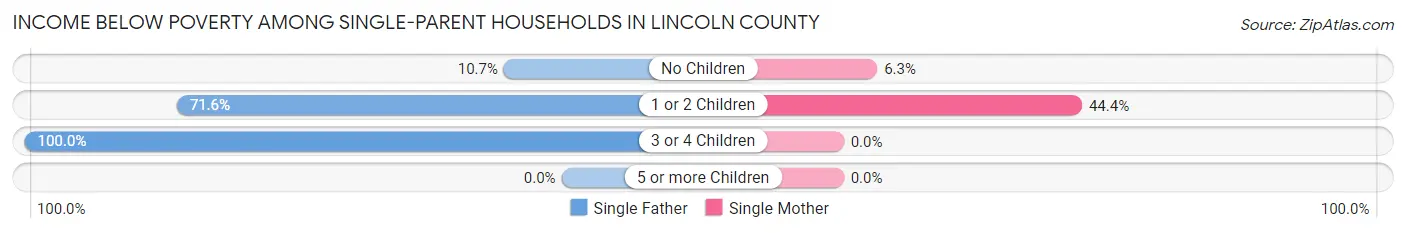
| Children | Single Father | Single Mother |
| No Children | 13 (10.7%) | 14 (6.2%) |
| 1 or 2 Children | 48 (71.6%) | 99 (44.4%) |
| 3 or 4 Children | 20 (100.0%) | 0 (0.0%) |
| 5 or more Children | 0 (0.0%) | 0 (0.0%) |
| Total | 81 (38.9%) | 113 (24.8%) |
Income Below Poverty Among Married-Couple vs Single-Parent Households in Lincoln County
The poverty data for Lincoln County shows that 73 of the married-couple family households (4.9%) and 194 of the single-parent households (29.2%) are living below the poverty level. Within the married-couple family households, those with 3 or 4 children have the highest poverty rate, with 10 households (17.2%) falling below the poverty line. Among the single-parent households, those with 3 or 4 children have the highest poverty rate, with 20 household (69.0%) living below poverty.
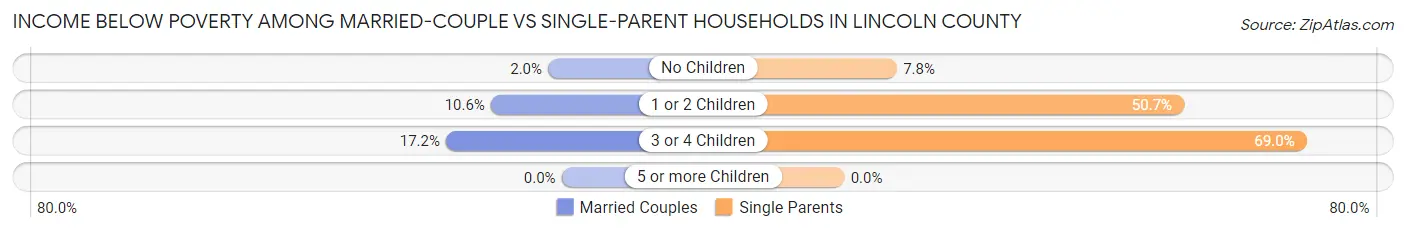
| Children | Married-Couple Families | Single-Parent Households |
| No Children | 21 (2.0%) | 27 (7.8%) |
| 1 or 2 Children | 42 (10.5%) | 147 (50.7%) |
| 3 or 4 Children | 10 (17.2%) | 20 (69.0%) |
| 5 or more Children | 0 (0.0%) | 0 (0.0%) |
| Total | 73 (4.9%) | 194 (29.2%) |
Race in Lincoln County
The most populous races in Lincoln County are White / Caucasian (5,302 | 68.6%), Black / African American (2,175 | 28.1%), and Hispanic or Latino (171 | 2.2%).
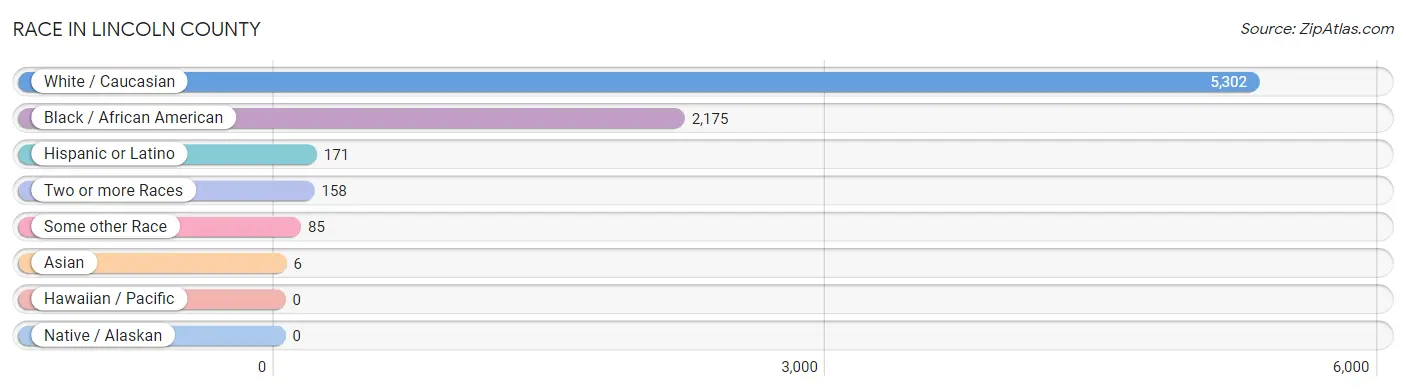
| Race | # Population | % Population |
| Asian | 6 | 0.1% |
| Black / African American | 2,175 | 28.1% |
| Hawaiian / Pacific | 0 | 0.0% |
| Hispanic or Latino | 171 | 2.2% |
| Native / Alaskan | 0 | 0.0% |
| White / Caucasian | 5,302 | 68.6% |
| Two or more Races | 158 | 2.1% |
| Some other Race | 85 | 1.1% |
| Total | 7,726 | 100.0% |
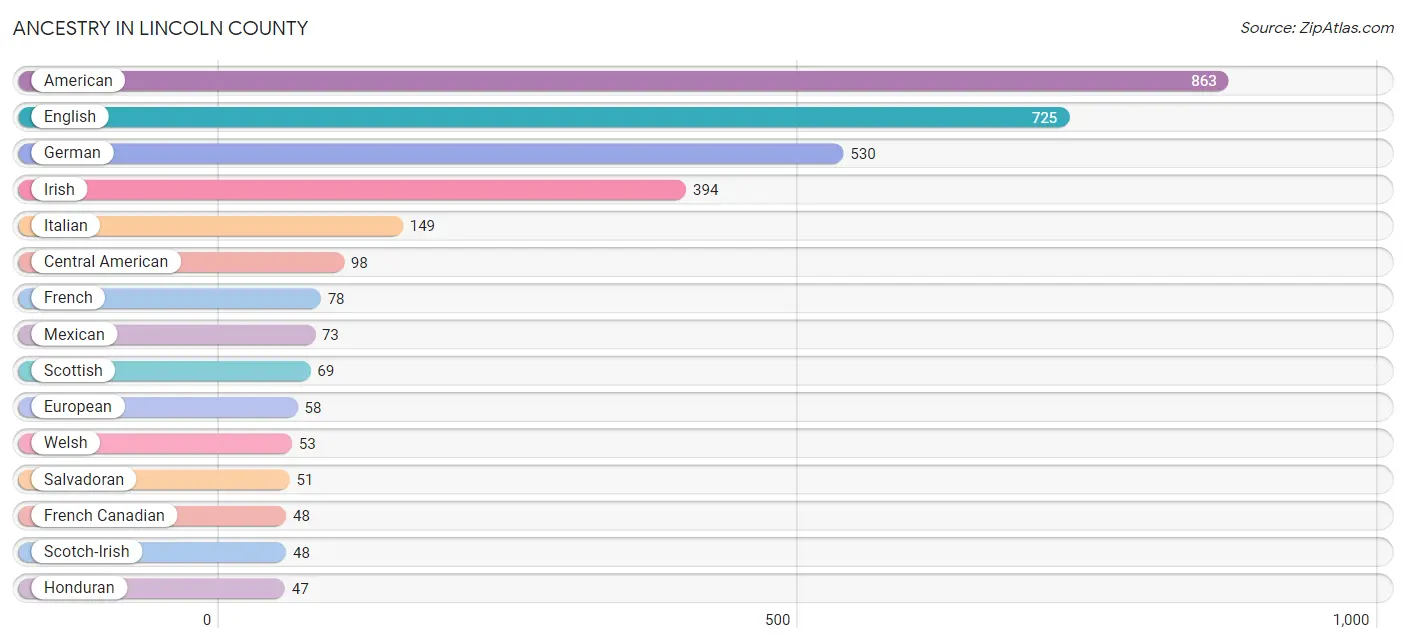
Ancestry in Lincoln County
The most populous ancestries reported in Lincoln County are American (863 | 11.2%), English (725 | 9.4%), German (530 | 6.9%), Irish (394 | 5.1%), and Italian (149 | 1.9%), together accounting for 34.4% of all Lincoln County residents.
| Ancestry | # Population | % Population |
| African | 14 | 0.2% |
| American | 863 | 11.2% |
| Belgian | 10 | 0.1% |
| British | 3 | 0.0% |
| Central American | 98 | 1.3% |
| Cherokee | 11 | 0.1% |
| Dutch | 20 | 0.3% |
| English | 725 | 9.4% |
| European | 58 | 0.7% |
| French | 78 | 1.0% |
| French Canadian | 48 | 0.6% |
| German | 530 | 6.9% |
| Honduran | 47 | 0.6% |
| Hungarian | 5 | 0.1% |
| Irish | 394 | 5.1% |
| Italian | 149 | 1.9% |
| Lithuanian | 8 | 0.1% |
| Mexican | 73 | 0.9% |
| Norwegian | 29 | 0.4% |
| Polish | 34 | 0.4% |
| Portuguese | 28 | 0.4% |
| Russian | 12 | 0.2% |
| Salvadoran | 51 | 0.7% |
| Scotch-Irish | 48 | 0.6% |
| Scottish | 69 | 0.9% |
| Slovene | 10 | 0.1% |
| Sri Lankan | 6 | 0.1% |
| Subsaharan African | 14 | 0.2% |
| Swedish | 34 | 0.4% |
| Turkish | 28 | 0.4% |
| U.S. Virgin Islander | 7 | 0.1% |
| Welsh | 53 | 0.7% | View All 32 Rows |
Immigrants in Lincoln County
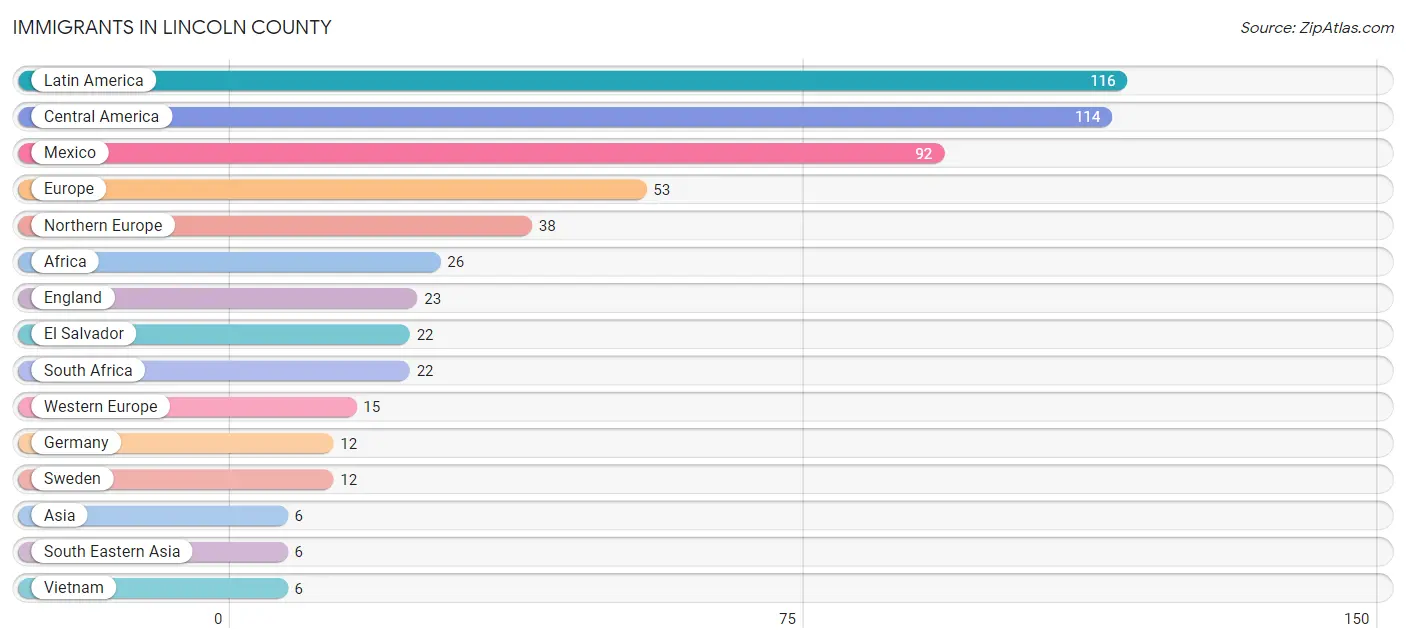
The most numerous immigrant groups reported in Lincoln County came from Latin America (116 | 1.5%), Central America (114 | 1.5%), Mexico (92 | 1.2%), Europe (53 | 0.7%), and Northern Europe (38 | 0.5%), together accounting for 5.4% of all Lincoln County residents.
| Immigration Origin | # Population | % Population |
| Africa | 26 | 0.3% |
| Asia | 6 | 0.1% |
| Brazil | 2 | 0.0% |
| Central America | 114 | 1.5% |
| Eastern Africa | 4 | 0.1% |
| El Salvador | 22 | 0.3% |
| England | 23 | 0.3% |
| Europe | 53 | 0.7% |
| Germany | 12 | 0.2% |
| Latin America | 116 | 1.5% |
| Mexico | 92 | 1.2% |
| Netherlands | 3 | 0.0% |
| Northern Europe | 38 | 0.5% |
| South Africa | 22 | 0.3% |
| South America | 2 | 0.0% |
| South Eastern Asia | 6 | 0.1% |
| Sweden | 12 | 0.2% |
| Vietnam | 6 | 0.1% |
| Western Europe | 15 | 0.2% | View All 19 Rows |
Sex and Age in Lincoln County
Sex and Age in Lincoln County
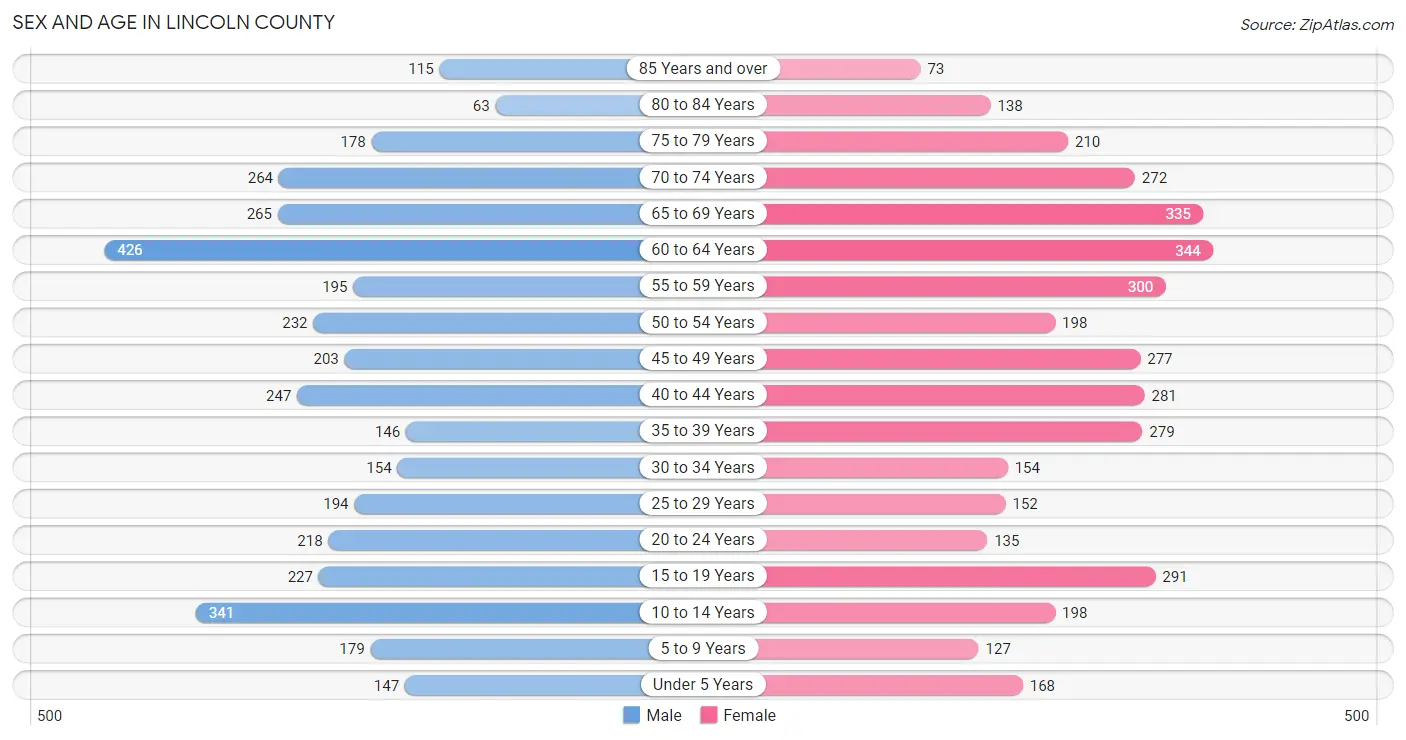
The most populous age groups in Lincoln County are 60 to 64 Years (426 | 11.2%) for men and 60 to 64 Years (344 | 8.7%) for women.
| Age Bracket | Male | Female |
| Under 5 Years | 147 (3.9%) | 168 (4.3%) |
| 5 to 9 Years | 179 (4.7%) | 127 (3.2%) |
| 10 to 14 Years | 341 (9.0%) | 198 (5.0%) |
| 15 to 19 Years | 227 (6.0%) | 291 (7.4%) |
| 20 to 24 Years | 218 (5.8%) | 135 (3.4%) |
| 25 to 29 Years | 194 (5.1%) | 152 (3.9%) |
| 30 to 34 Years | 154 (4.1%) | 154 (3.9%) |
| 35 to 39 Years | 146 (3.8%) | 279 (7.1%) |
| 40 to 44 Years | 247 (6.5%) | 281 (7.1%) |
| 45 to 49 Years | 203 (5.3%) | 277 (7.0%) |
| 50 to 54 Years | 232 (6.1%) | 198 (5.0%) |
| 55 to 59 Years | 195 (5.1%) | 300 (7.6%) |
| 60 to 64 Years | 426 (11.2%) | 344 (8.7%) |
| 65 to 69 Years | 265 (7.0%) | 335 (8.5%) |
| 70 to 74 Years | 264 (7.0%) | 272 (6.9%) |
| 75 to 79 Years | 178 (4.7%) | 210 (5.3%) |
| 80 to 84 Years | 63 (1.7%) | 138 (3.5%) |
| 85 Years and over | 115 (3.0%) | 73 (1.9%) |
| Total | 3,794 (100.0%) | 3,932 (100.0%) |
Families and Households in Lincoln County
Median Family Size in Lincoln County
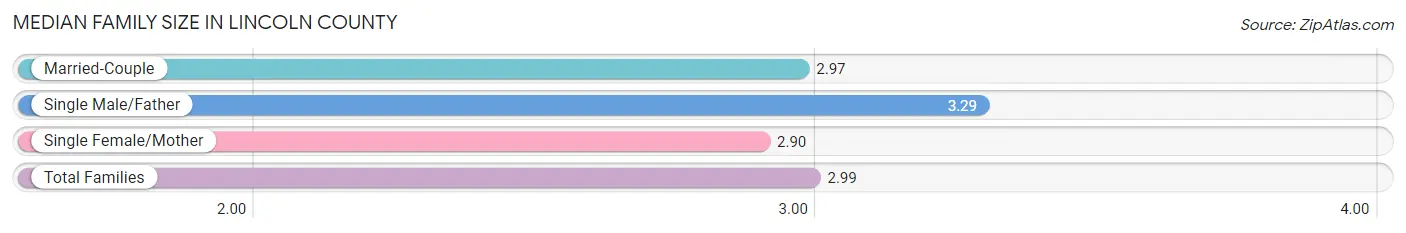
The median family size in Lincoln County is 2.99 persons per family, with single male/father families (208 | 9.7%) accounting for the largest median family size of 3.29 persons per family. On the other hand, single female/mother families (456 | 21.1%) represent the smallest median family size with 2.90 persons per family.
| Family Type | # Families | Family Size |
| Married-Couple | 1,492 (69.2%) | 2.97 |
| Single Male/Father | 208 (9.7%) | 3.29 |
| Single Female/Mother | 456 (21.1%) | 2.90 |
| Total Families | 2,156 (100.0%) | 2.99 |
Median Household Size in Lincoln County
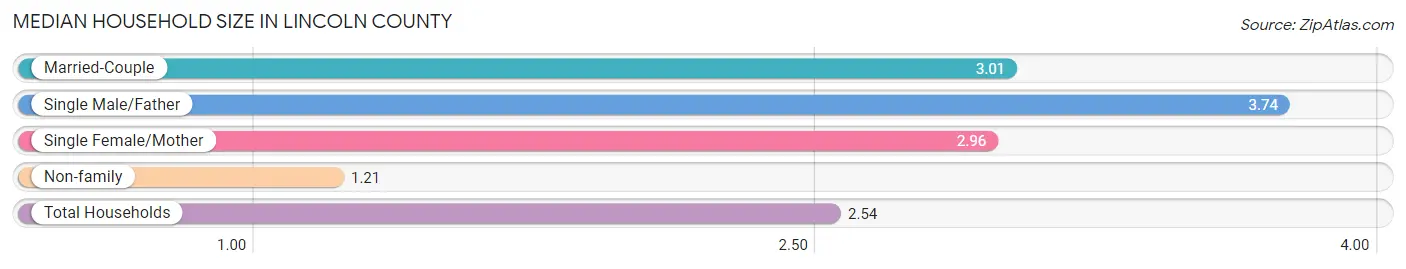
The median household size in Lincoln County is 2.54 persons per household, with single male/father households (208 | 6.9%) accounting for the largest median household size of 3.74 persons per household. non-family households (859 | 28.5%) represent the smallest median household size with 1.21 persons per household.
| Household Type | # Households | Household Size |
| Married-Couple | 1,492 (49.5%) | 3.01 |
| Single Male/Father | 208 (6.9%) | 3.74 |
| Single Female/Mother | 456 (15.1%) | 2.96 |
| Non-family | 859 (28.5%) | 1.21 |
| Total Households | 3,015 (100.0%) | 2.54 |
Household Size by Marriage Status in Lincoln County
Out of a total of 3,015 households in Lincoln County, 2,156 (71.5%) are family households, while 859 (28.5%) are nonfamily households. The most numerous type of family households are 2-person households, comprising 1,243, and the most common type of nonfamily households are 1-person households, comprising 749.
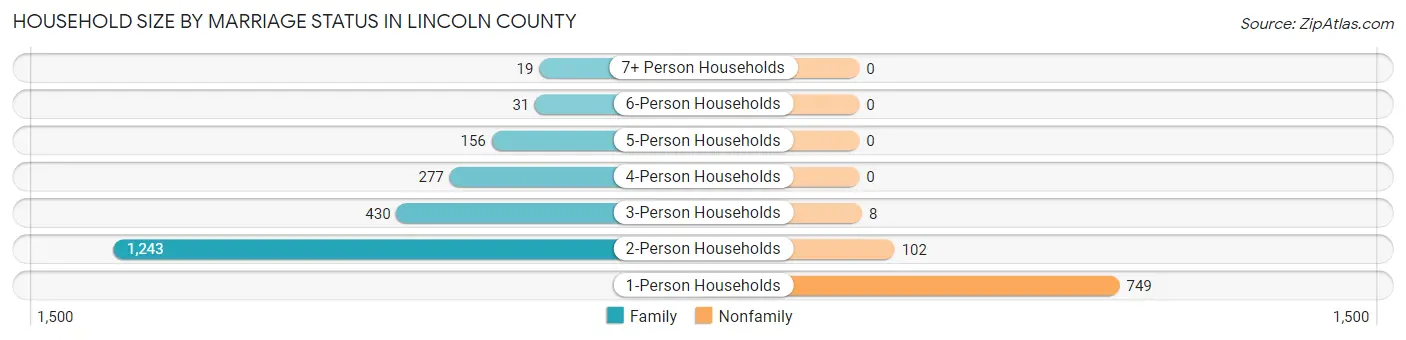
| Household Size | Family Households | Nonfamily Households |
| 1-Person Households | - | 749 (24.8%) |
| 2-Person Households | 1,243 (41.2%) | 102 (3.4%) |
| 3-Person Households | 430 (14.3%) | 8 (0.3%) |
| 4-Person Households | 277 (9.2%) | 0 (0.0%) |
| 5-Person Households | 156 (5.2%) | 0 (0.0%) |
| 6-Person Households | 31 (1.0%) | 0 (0.0%) |
| 7+ Person Households | 19 (0.6%) | 0 (0.0%) |
| Total | 2,156 (71.5%) | 859 (28.5%) |
Female Fertility in Lincoln County
Fertility by Age in Lincoln County
Average fertility rate in Lincoln County is 10.0 births per 1,000 women. Women in the age bracket of 20 to 34 years have the highest fertility rate with 29.0 births per 1,000 women. Women in the age bracket of 20 to 34 years acount for 81.2% of all women with births.
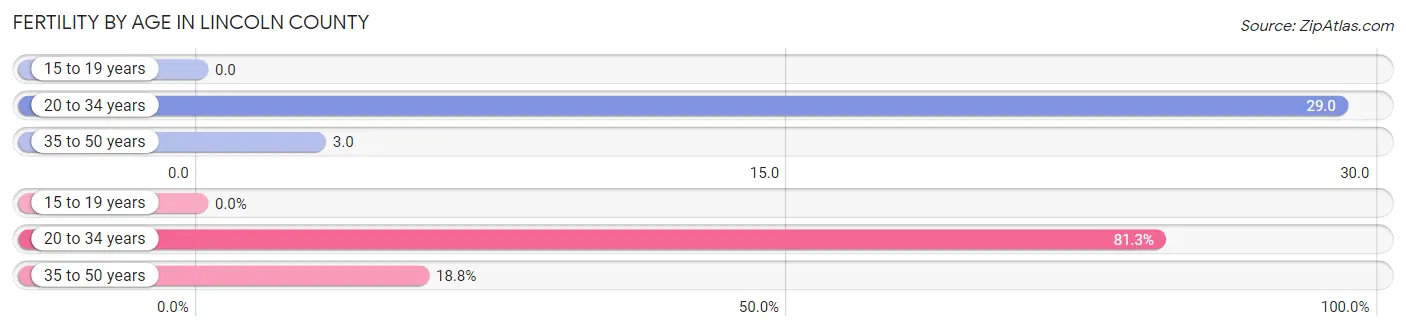
| Age Bracket | Women with Births | Births / 1,000 Women |
| 15 to 19 years | 0 (0.0%) | 0.0 |
| 20 to 34 years | 13 (81.2%) | 29.0 |
| 35 to 50 years | 3 (18.8%) | 3.0 |
| Total | 16 (100.0%) | 10.0 |
Fertility by Age by Marriage Status in Lincoln County
50.0% of women with births (16) in Lincoln County are married. The highest percentage of unmarried women with births falls into 35 to 50 years age bracket with 100.0% of them unmarried at the time of birth, while the lowest percentage of unmarried women with births belong to 20 to 34 years age bracket with 38.5% of them unmarried.
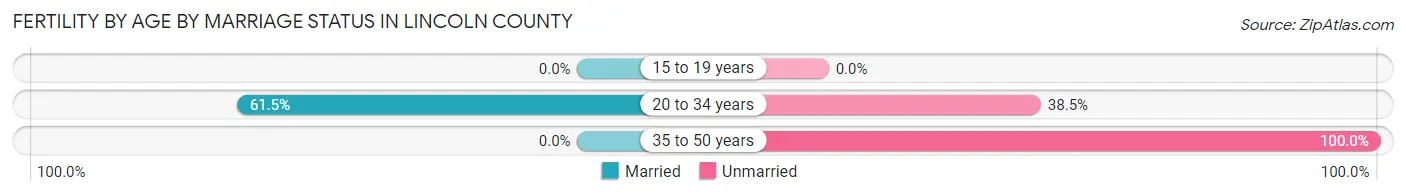
| Age Bracket | Married | Unmarried |
| 15 to 19 years | 0 (0.0%) | 0 (0.0%) |
| 20 to 34 years | 8 (61.5%) | 5 (38.5%) |
| 35 to 50 years | 0 (0.0%) | 3 (100.0%) |
| Total | 8 (50.0%) | 8 (50.0%) |
Fertility by Education in Lincoln County
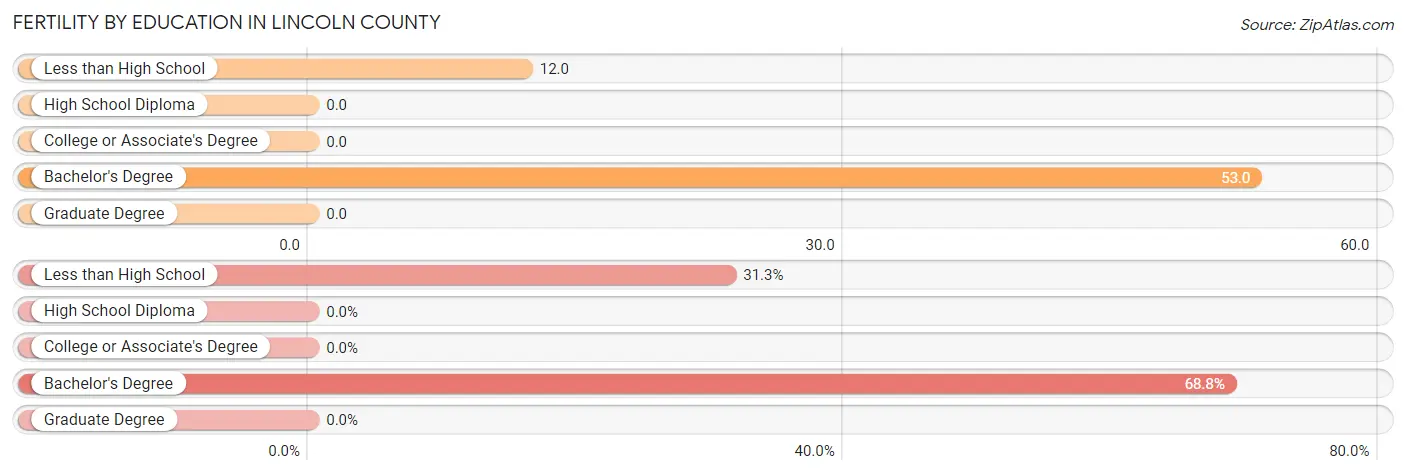
| Educational Attainment | Women with Births | Births / 1,000 Women |
| Less than High School | 5 (31.2%) | 12.0 |
| High School Diploma | 0 (0.0%) | 0.0 |
| College or Associate's Degree | 0 (0.0%) | 0.0 |
| Bachelor's Degree | 11 (68.8%) | 53.0 |
| Graduate Degree | 0 (0.0%) | 0.0 |
| Total | 16 (100.0%) | 10.0 |
Fertility by Education by Marriage Status in Lincoln County
50.0% of women with births in Lincoln County are unmarried. Women with the educational attainment of bachelor's degree are most likely to be married with 72.7% of them married at childbirth, while women with the educational attainment of less than high school are least likely to be married with 100.0% of them unmarried at childbirth.
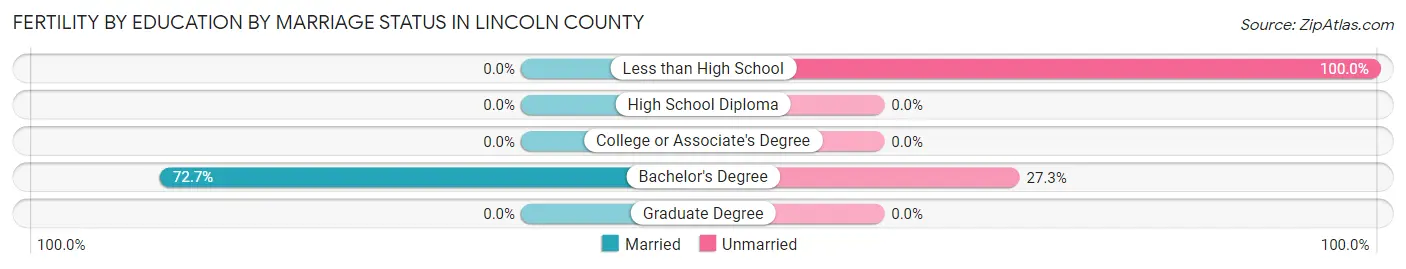
| Educational Attainment | Married | Unmarried |
| Less than High School | 0 (0.0%) | 5 (100.0%) |
| High School Diploma | 0 (0.0%) | 0 (0.0%) |
| College or Associate's Degree | 0 (0.0%) | 0 (0.0%) |
| Bachelor's Degree | 8 (72.7%) | 3 (27.3%) |
| Graduate Degree | 0 (0.0%) | 0 (0.0%) |
| Total | 8 (50.0%) | 8 (50.0%) |
Employment Characteristics in Lincoln County
Employment by Class of Employer in Lincoln County
Among the 3,162 employed individuals in Lincoln County, private company employees (1,883 | 59.6%), state government employees (370 | 11.7%), and self-employed (not incorporated) (354 | 11.2%) make up the most common classes of employment.
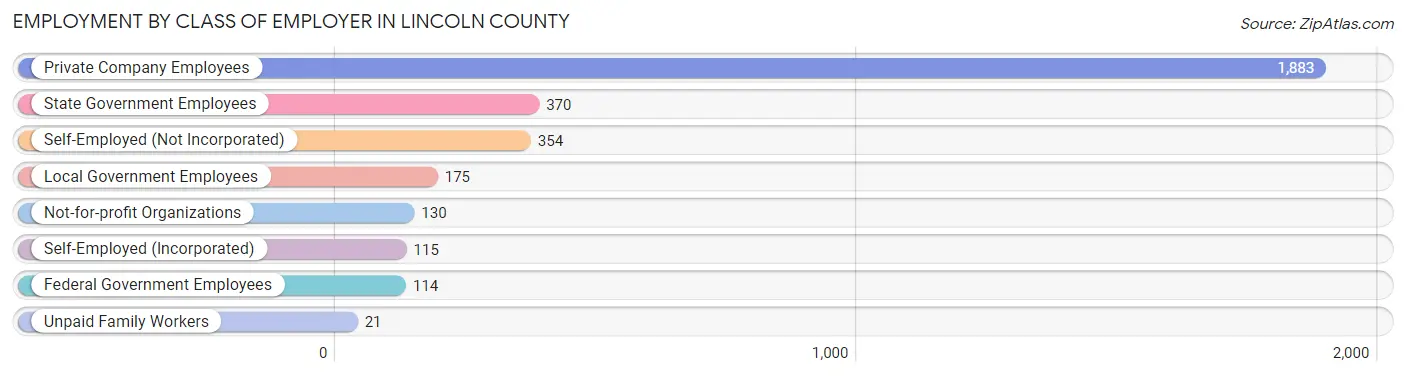
| Employer Class | # Employees | % Employees |
| Private Company Employees | 1,883 | 59.6% |
| Self-Employed (Incorporated) | 115 | 3.6% |
| Self-Employed (Not Incorporated) | 354 | 11.2% |
| Not-for-profit Organizations | 130 | 4.1% |
| Local Government Employees | 175 | 5.5% |
| State Government Employees | 370 | 11.7% |
| Federal Government Employees | 114 | 3.6% |
| Unpaid Family Workers | 21 | 0.7% |
| Total | 3,162 | 100.0% |
Employment Status by Age in Lincoln County
According to the labor force statistics for Lincoln County, out of the total population over 16 years of age (6,461), 52.0% or 3,360 individuals are in the labor force, with 3.6% or 121 of them unemployed. The age group with the highest labor force participation rate is 25 to 29 years, with 97.4% or 337 individuals in the labor force. Within the labor force, the 20 to 24 years age range has the highest percentage of unemployed individuals, with 11.7% or 28 of them being unemployed.
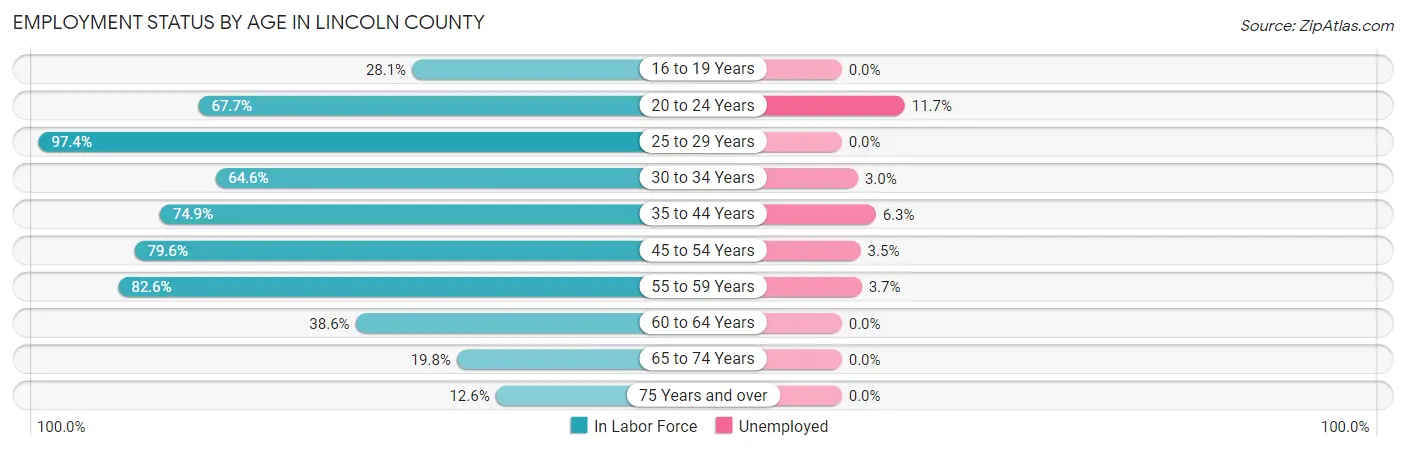
| Age Bracket | In Labor Force | Unemployed |
| 16 to 19 Years | 116 (28.1%) | 0 (0.0%) |
| 20 to 24 Years | 239 (67.7%) | 28 (11.7%) |
| 25 to 29 Years | 337 (97.4%) | 0 (0.0%) |
| 30 to 34 Years | 199 (64.6%) | 6 (3.0%) |
| 35 to 44 Years | 714 (74.9%) | 45 (6.3%) |
| 45 to 54 Years | 724 (79.6%) | 25 (3.5%) |
| 55 to 59 Years | 409 (82.6%) | 15 (3.7%) |
| 60 to 64 Years | 297 (38.6%) | 0 (0.0%) |
| 65 to 74 Years | 225 (19.8%) | 0 (0.0%) |
| 75 Years and over | 98 (12.6%) | 0 (0.0%) |
| Total | 3,360 (52.0%) | 121 (3.6%) |
Employment Status by Educational Attainment in Lincoln County
According to labor force statistics for Lincoln County, 70.9% of individuals (2,681) out of the total population between 25 and 64 years of age (3,782) are in the labor force, with 3.4% or 91 of them being unemployed. The group with the highest labor force participation rate are those with the educational attainment of bachelor's degree or higher, with 88.0% or 499 individuals in the labor force. Within the labor force, individuals with high school diploma education have the highest percentage of unemployment, with 7.3% or 67 of them being unemployed.
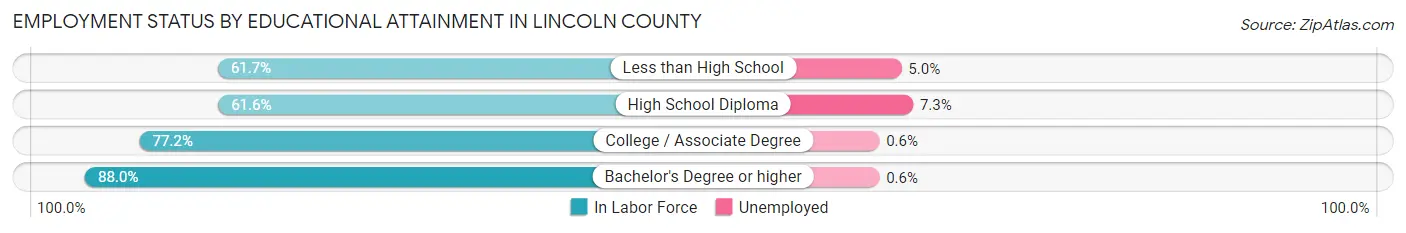
| Educational Attainment | In Labor Force | Unemployed |
| Less than High School | 279 (61.7%) | 23 (5.0%) |
| High School Diploma | 914 (61.6%) | 108 (7.3%) |
| College / Associate Degree | 988 (77.2%) | 8 (0.6%) |
| Bachelor's Degree or higher | 499 (88.0%) | 3 (0.6%) |
| Total | 2,681 (70.9%) | 129 (3.4%) |
Employment Occupations by Sex in Lincoln County
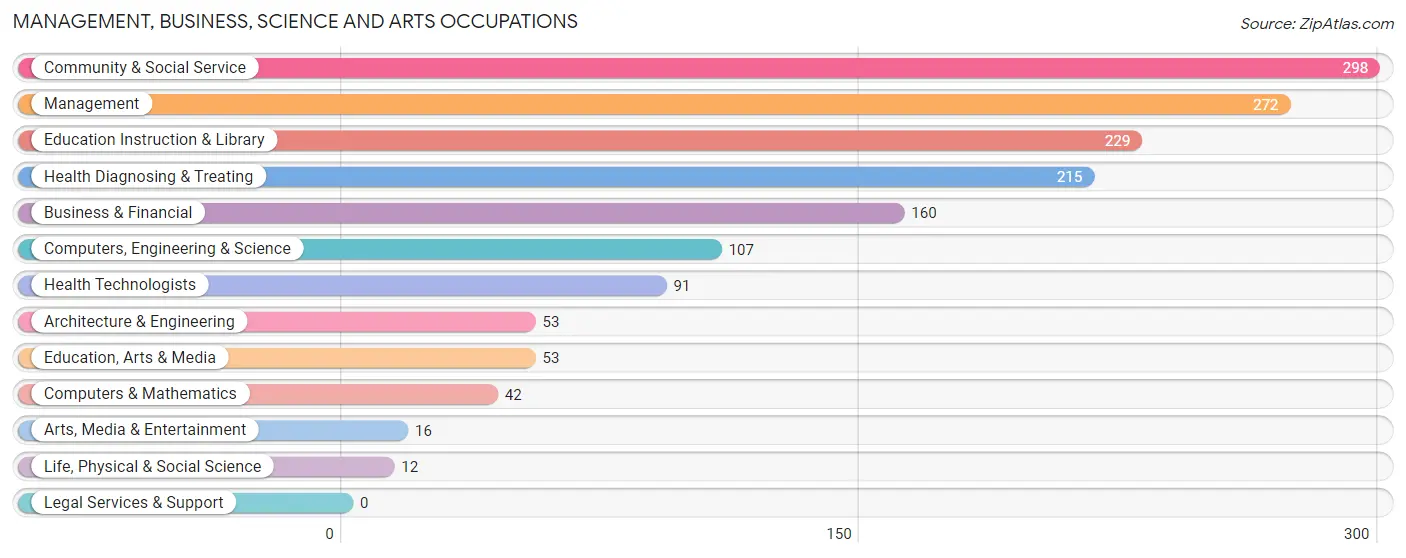
Management, Business, Science and Arts Occupations
The most common Management, Business, Science and Arts occupations in Lincoln County are Community & Social Service (298 | 9.3%), Management (272 | 8.5%), Education Instruction & Library (229 | 7.1%), Health Diagnosing & Treating (215 | 6.7%), and Business & Financial (160 | 5.0%).
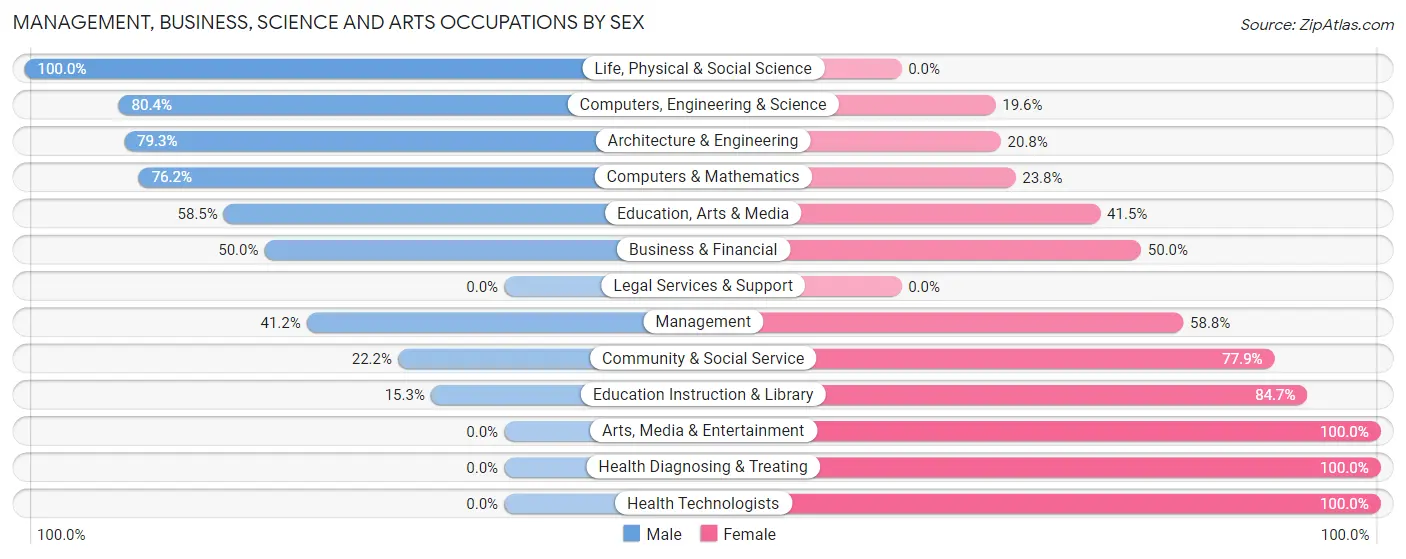
Management, Business, Science and Arts Occupations by Sex
Within the Management, Business, Science and Arts occupations in Lincoln County, the most male-oriented occupations are Life, Physical & Social Science (100.0%), Computers, Engineering & Science (80.4%), and Architecture & Engineering (79.2%), while the most female-oriented occupations are Arts, Media & Entertainment (100.0%), Health Diagnosing & Treating (100.0%), and Health Technologists (100.0%).
| Occupation | Male | Female |
| Management | 112 (41.2%) | 160 (58.8%) |
| Business & Financial | 80 (50.0%) | 80 (50.0%) |
| Computers, Engineering & Science | 86 (80.4%) | 21 (19.6%) |
| Computers & Mathematics | 32 (76.2%) | 10 (23.8%) |
| Architecture & Engineering | 42 (79.2%) | 11 (20.7%) |
| Life, Physical & Social Science | 12 (100.0%) | 0 (0.0%) |
| Community & Social Service | 66 (22.2%) | 232 (77.8%) |
| Education, Arts & Media | 31 (58.5%) | 22 (41.5%) |
| Legal Services & Support | 0 (0.0%) | 0 (0.0%) |
| Education Instruction & Library | 35 (15.3%) | 194 (84.7%) |
| Arts, Media & Entertainment | 0 (0.0%) | 16 (100.0%) |
| Health Diagnosing & Treating | 0 (0.0%) | 215 (100.0%) |
| Health Technologists | 0 (0.0%) | 91 (100.0%) |
| Total (Category) | 344 (32.7%) | 708 (67.3%) |
| Total (Overall) | 1,583 (49.4%) | 1,620 (50.6%) |
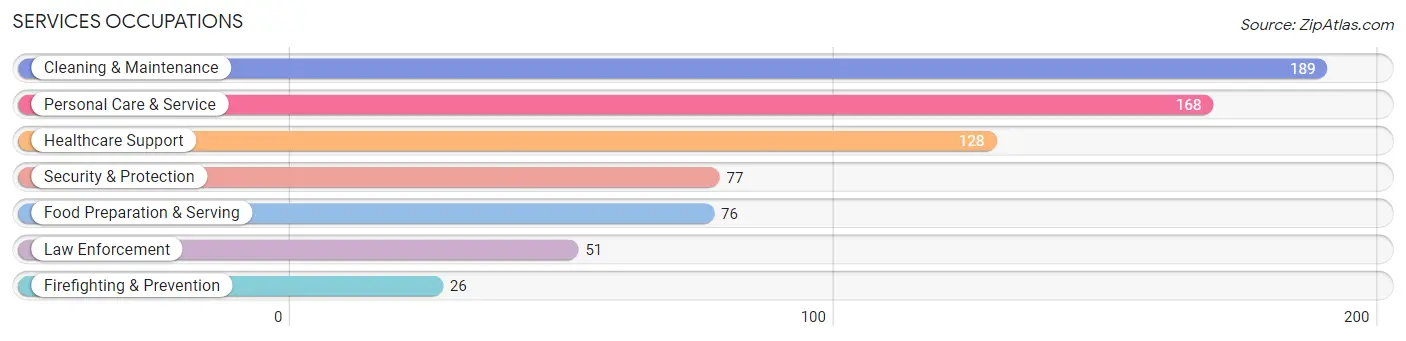
Services Occupations
The most common Services occupations in Lincoln County are Cleaning & Maintenance (189 | 5.9%), Personal Care & Service (168 | 5.2%), Healthcare Support (128 | 4.0%), Security & Protection (77 | 2.4%), and Food Preparation & Serving (76 | 2.4%).
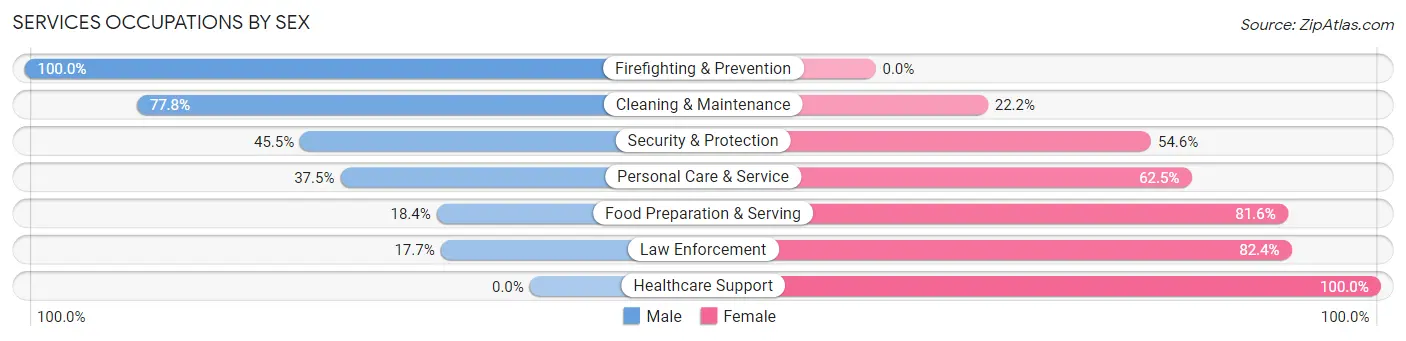
Services Occupations by Sex
Within the Services occupations in Lincoln County, the most male-oriented occupations are Firefighting & Prevention (100.0%), Cleaning & Maintenance (77.8%), and Security & Protection (45.5%), while the most female-oriented occupations are Healthcare Support (100.0%), Law Enforcement (82.4%), and Food Preparation & Serving (81.6%).
| Occupation | Male | Female |
| Healthcare Support | 0 (0.0%) | 128 (100.0%) |
| Security & Protection | 35 (45.5%) | 42 (54.5%) |
| Firefighting & Prevention | 26 (100.0%) | 0 (0.0%) |
| Law Enforcement | 9 (17.6%) | 42 (82.4%) |
| Food Preparation & Serving | 14 (18.4%) | 62 (81.6%) |
| Cleaning & Maintenance | 147 (77.8%) | 42 (22.2%) |
| Personal Care & Service | 63 (37.5%) | 105 (62.5%) |
| Total (Category) | 259 (40.6%) | 379 (59.4%) |
| Total (Overall) | 1,583 (49.4%) | 1,620 (50.6%) |
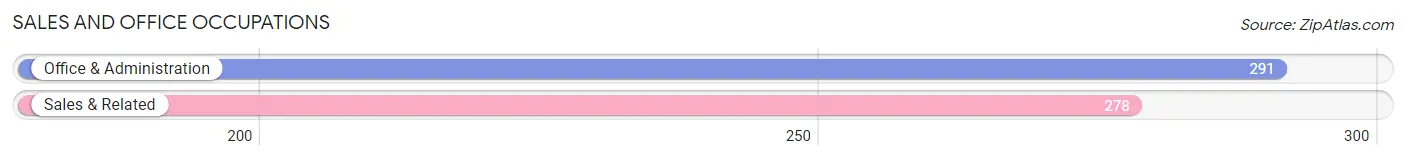
Sales and Office Occupations
The most common Sales and Office occupations in Lincoln County are Office & Administration (291 | 9.1%), and Sales & Related (278 | 8.7%).
Sales and Office Occupations by Sex
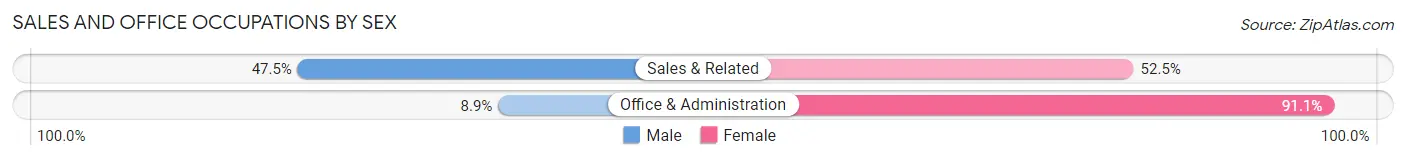
| Occupation | Male | Female |
| Sales & Related | 132 (47.5%) | 146 (52.5%) |
| Office & Administration | 26 (8.9%) | 265 (91.1%) |
| Total (Category) | 158 (27.8%) | 411 (72.2%) |
| Total (Overall) | 1,583 (49.4%) | 1,620 (50.6%) |
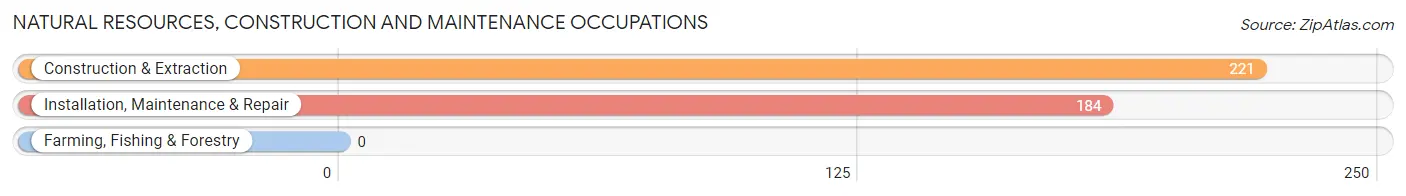
Natural Resources, Construction and Maintenance Occupations
The most common Natural Resources, Construction and Maintenance occupations in Lincoln County are Construction & Extraction (221 | 6.9%), and Installation, Maintenance & Repair (184 | 5.7%).
Natural Resources, Construction and Maintenance Occupations by Sex
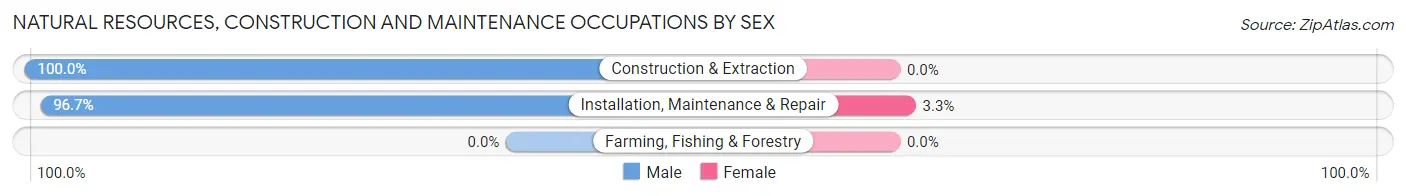
| Occupation | Male | Female |
| Farming, Fishing & Forestry | 0 (0.0%) | 0 (0.0%) |
| Construction & Extraction | 221 (100.0%) | 0 (0.0%) |
| Installation, Maintenance & Repair | 178 (96.7%) | 6 (3.3%) |
| Total (Category) | 399 (98.5%) | 6 (1.5%) |
| Total (Overall) | 1,583 (49.4%) | 1,620 (50.6%) |
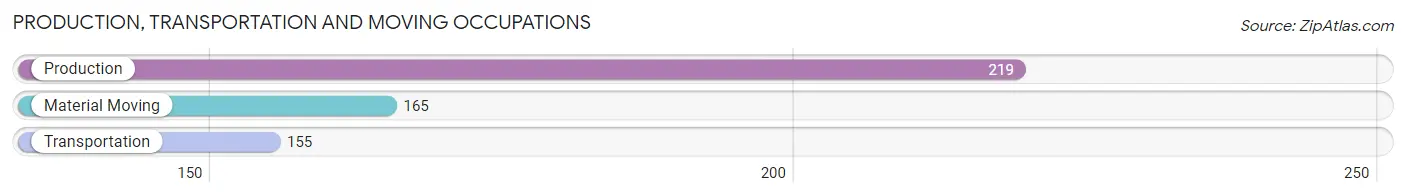
Production, Transportation and Moving Occupations
The most common Production, Transportation and Moving occupations in Lincoln County are Production (219 | 6.8%), Material Moving (165 | 5.1%), and Transportation (155 | 4.8%).
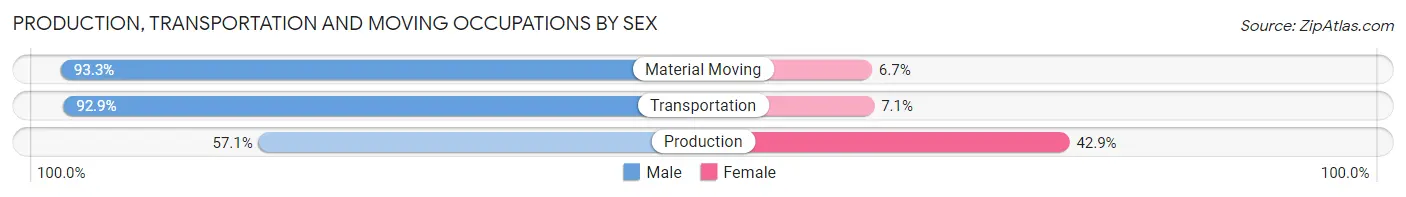
Production, Transportation and Moving Occupations by Sex
| Occupation | Male | Female |
| Production | 125 (57.1%) | 94 (42.9%) |
| Transportation | 144 (92.9%) | 11 (7.1%) |
| Material Moving | 154 (93.3%) | 11 (6.7%) |
| Total (Category) | 423 (78.5%) | 116 (21.5%) |
| Total (Overall) | 1,583 (49.4%) | 1,620 (50.6%) |
Employment Industries by Sex in Lincoln County
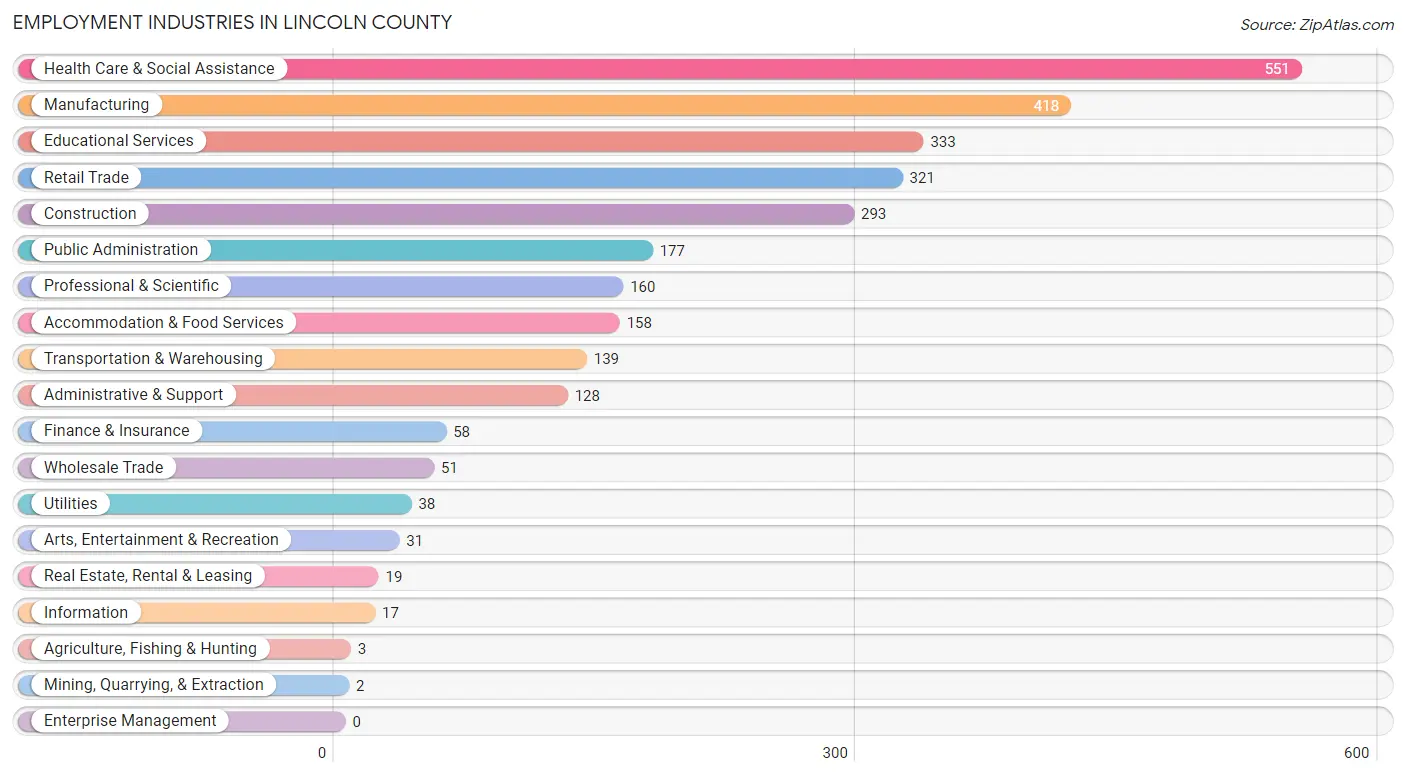
Employment Industries in Lincoln County
The major employment industries in Lincoln County include Health Care & Social Assistance (551 | 17.2%), Manufacturing (418 | 13.1%), Educational Services (333 | 10.4%), Retail Trade (321 | 10.0%), and Construction (293 | 9.1%).
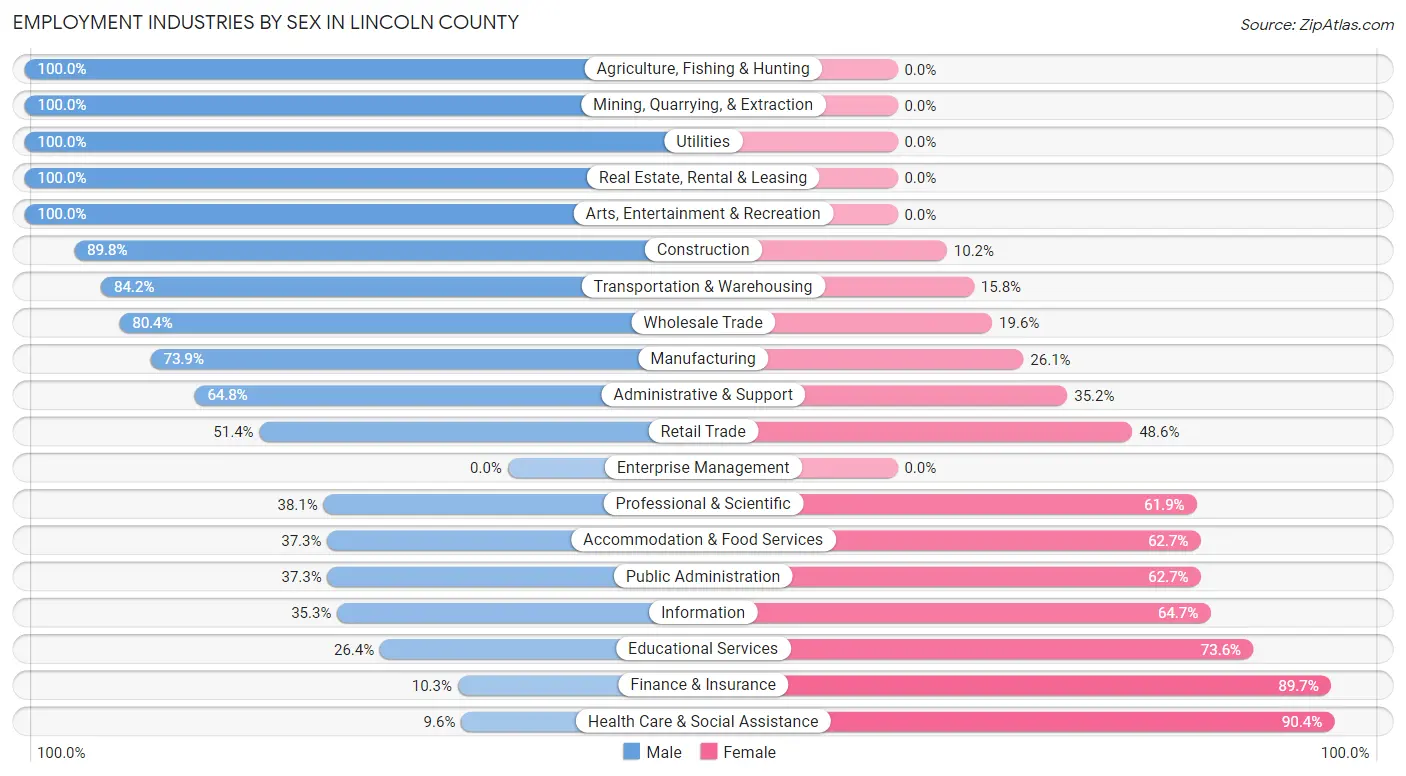
Employment Industries by Sex in Lincoln County
The Lincoln County industries that see more men than women are Agriculture, Fishing & Hunting (100.0%), Mining, Quarrying, & Extraction (100.0%), and Utilities (100.0%), whereas the industries that tend to have a higher number of women are Health Care & Social Assistance (90.4%), Finance & Insurance (89.7%), and Educational Services (73.6%).
| Industry | Male | Female |
| Agriculture, Fishing & Hunting | 3 (100.0%) | 0 (0.0%) |
| Mining, Quarrying, & Extraction | 2 (100.0%) | 0 (0.0%) |
| Construction | 263 (89.8%) | 30 (10.2%) |
| Manufacturing | 309 (73.9%) | 109 (26.1%) |
| Wholesale Trade | 41 (80.4%) | 10 (19.6%) |
| Retail Trade | 165 (51.4%) | 156 (48.6%) |
| Transportation & Warehousing | 117 (84.2%) | 22 (15.8%) |
| Utilities | 38 (100.0%) | 0 (0.0%) |
| Information | 6 (35.3%) | 11 (64.7%) |
| Finance & Insurance | 6 (10.3%) | 52 (89.7%) |
| Real Estate, Rental & Leasing | 19 (100.0%) | 0 (0.0%) |
| Professional & Scientific | 61 (38.1%) | 99 (61.9%) |
| Enterprise Management | 0 (0.0%) | 0 (0.0%) |
| Administrative & Support | 83 (64.8%) | 45 (35.2%) |
| Educational Services | 88 (26.4%) | 245 (73.6%) |
| Health Care & Social Assistance | 53 (9.6%) | 498 (90.4%) |
| Arts, Entertainment & Recreation | 31 (100.0%) | 0 (0.0%) |
| Accommodation & Food Services | 59 (37.3%) | 99 (62.7%) |
| Public Administration | 66 (37.3%) | 111 (62.7%) |
| Total | 1,583 (49.4%) | 1,620 (50.6%) |
Education in Lincoln County
School Enrollment in Lincoln County
The most common levels of schooling among the 1,621 students in Lincoln County are high school (509 | 31.4%), middle school (439 | 27.1%), and college / undergraduate (278 | 17.2%).
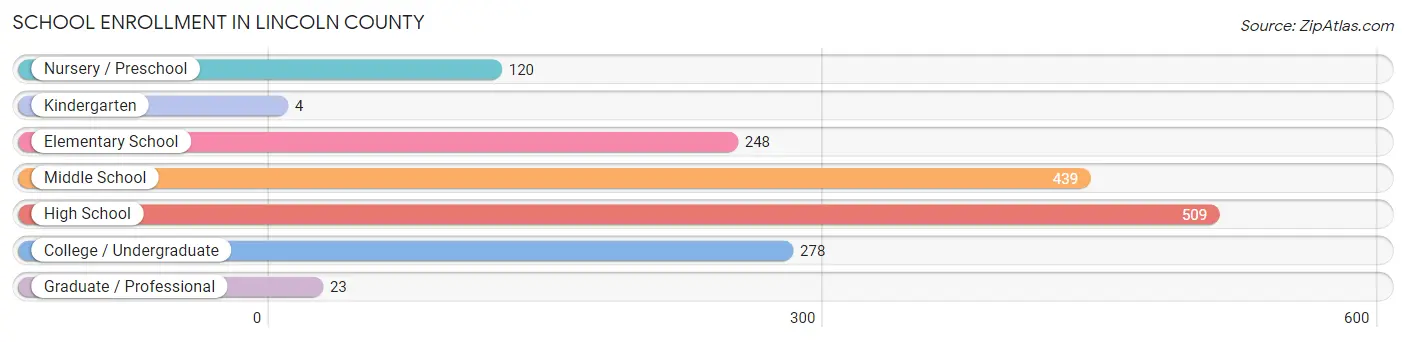
| School Level | # Students | % Students |
| Nursery / Preschool | 120 | 7.4% |
| Kindergarten | 4 | 0.3% |
| Elementary School | 248 | 15.3% |
| Middle School | 439 | 27.1% |
| High School | 509 | 31.4% |
| College / Undergraduate | 278 | 17.2% |
| Graduate / Professional | 23 | 1.4% |
| Total | 1,621 | 100.0% |
School Enrollment by Age by Funding Source in Lincoln County
Out of a total of 1,621 students who are enrolled in schools in Lincoln County, 135 (8.3%) attend a private institution, while the remaining 1,486 (91.7%) are enrolled in public schools. The age group of 20 to 24 year olds has the highest likelihood of being enrolled in private schools, with 44 (29.9% in the age bracket) enrolled. Conversely, the age group of 3 to 4 year olds has the lowest likelihood of being enrolled in a private school, with 47 (100.0% in the age bracket) attending a public institution.
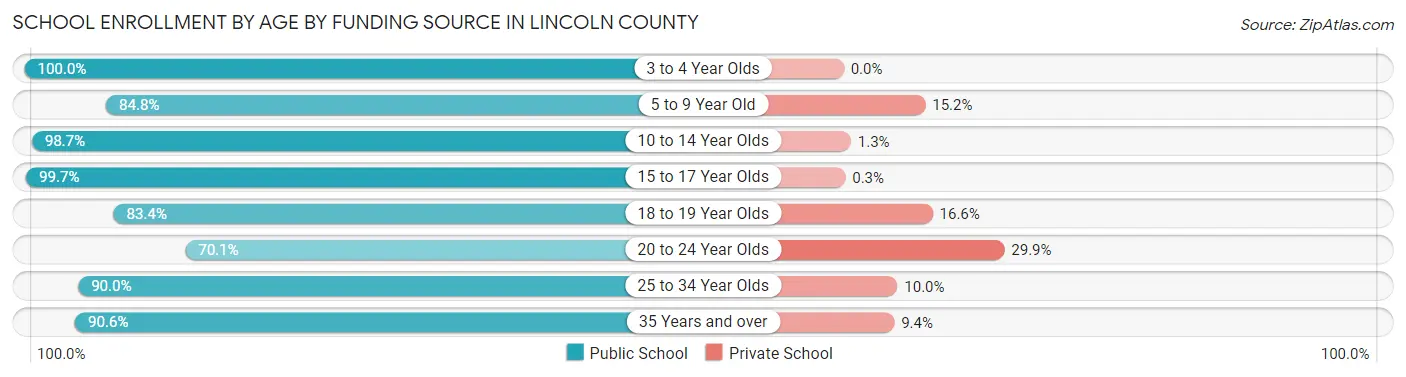
| Age Bracket | Public School | Private School |
| 3 to 4 Year Olds | 47 (100.0%) | 0 (0.0%) |
| 5 to 9 Year Old | 251 (84.8%) | 45 (15.2%) |
| 10 to 14 Year Olds | 517 (98.7%) | 7 (1.3%) |
| 15 to 17 Year Olds | 330 (99.7%) | 1 (0.3%) |
| 18 to 19 Year Olds | 126 (83.4%) | 25 (16.6%) |
| 20 to 24 Year Olds | 103 (70.1%) | 44 (29.9%) |
| 25 to 34 Year Olds | 36 (90.0%) | 4 (10.0%) |
| 35 Years and over | 77 (90.6%) | 8 (9.4%) |
| Total | 1,486 (91.7%) | 135 (8.3%) |
Educational Attainment by Field of Study in Lincoln County
Education (245 | 25.5%), business (194 | 20.2%), science & technology (107 | 11.2%), psychology (70 | 7.3%), and liberal arts & history (67 | 7.0%) are the most common fields of study among 960 individuals in Lincoln County who have obtained a bachelor's degree or higher.
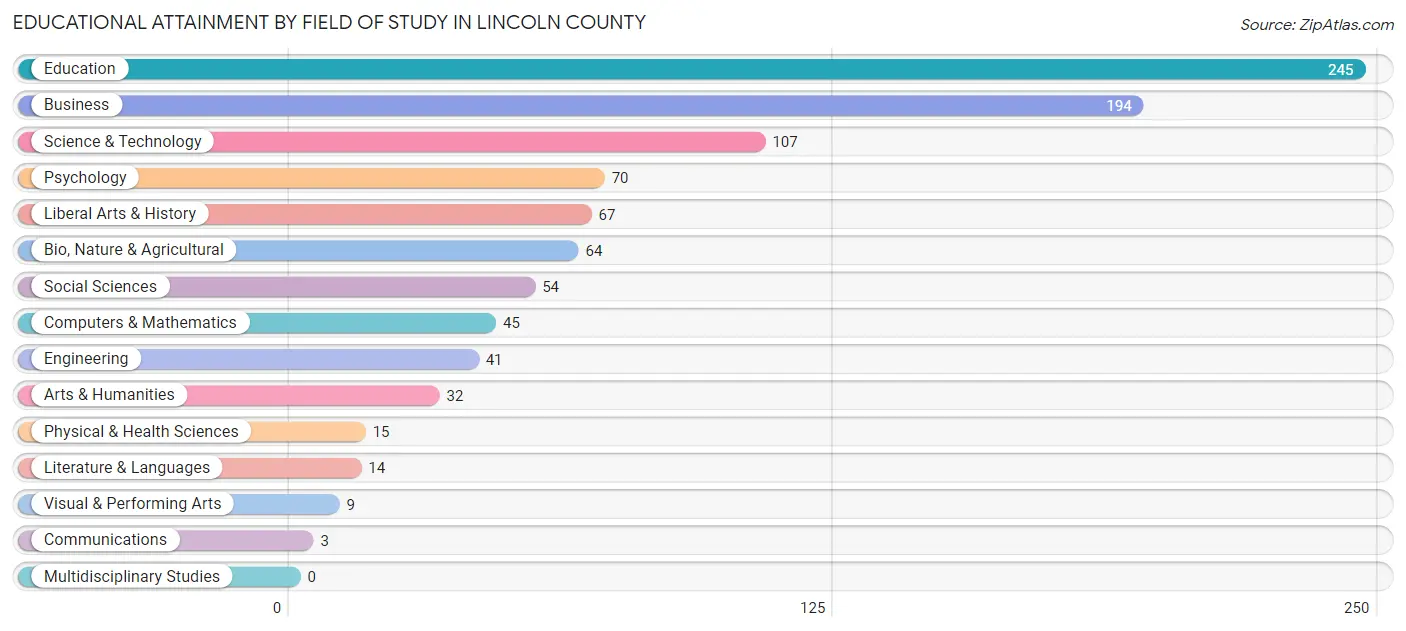
| Field of Study | # Graduates | % Graduates |
| Computers & Mathematics | 45 | 4.7% |
| Bio, Nature & Agricultural | 64 | 6.7% |
| Physical & Health Sciences | 15 | 1.6% |
| Psychology | 70 | 7.3% |
| Social Sciences | 54 | 5.6% |
| Engineering | 41 | 4.3% |
| Multidisciplinary Studies | 0 | 0.0% |
| Science & Technology | 107 | 11.2% |
| Business | 194 | 20.2% |
| Education | 245 | 25.5% |
| Literature & Languages | 14 | 1.5% |
| Liberal Arts & History | 67 | 7.0% |
| Visual & Performing Arts | 9 | 0.9% |
| Communications | 3 | 0.3% |
| Arts & Humanities | 32 | 3.3% |
| Total | 960 | 100.0% |
Transportation & Commute in Lincoln County
Vehicle Availability by Sex in Lincoln County
The most prevalent vehicle ownership categories in Lincoln County are males with 2 vehicles (525, accounting for 32.8%) and females with 2 vehicles (558, making up 33.9%).
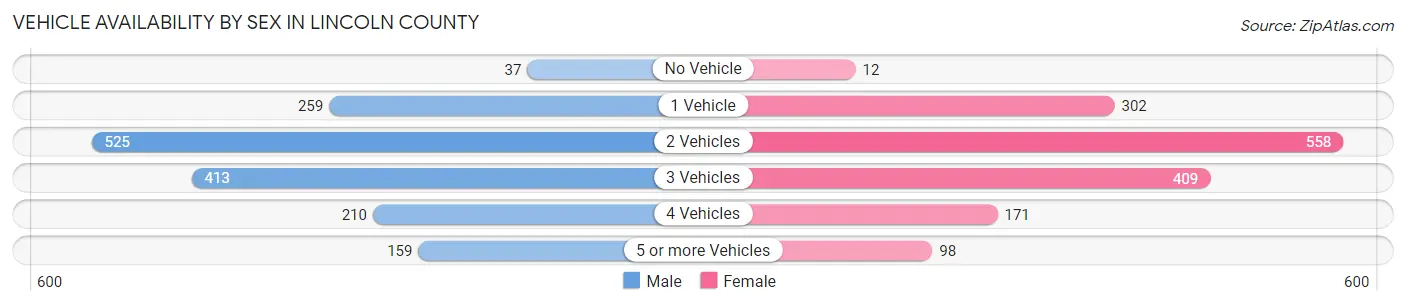
| Vehicles Available | Male | Female |
| No Vehicle | 37 (2.3%) | 12 (0.8%) |
| 1 Vehicle | 259 (16.2%) | 302 (19.5%) |
| 2 Vehicles | 525 (32.8%) | 558 (36.0%) |
| 3 Vehicles | 413 (25.8%) | 409 (26.4%) |
| 4 Vehicles | 210 (13.1%) | 171 (11.0%) |
| 5 or more Vehicles | 159 (9.9%) | 98 (6.3%) |
| Total | 1,603 (100.0%) | 1,550 (100.0%) |
Commute Time in Lincoln County
The most frequently occuring commute durations in Lincoln County are 45 to 59 minutes (518 commuters, 17.1%), 20 to 24 minutes (343 commuters, 11.3%), and 30 to 34 minutes (337 commuters, 11.1%).
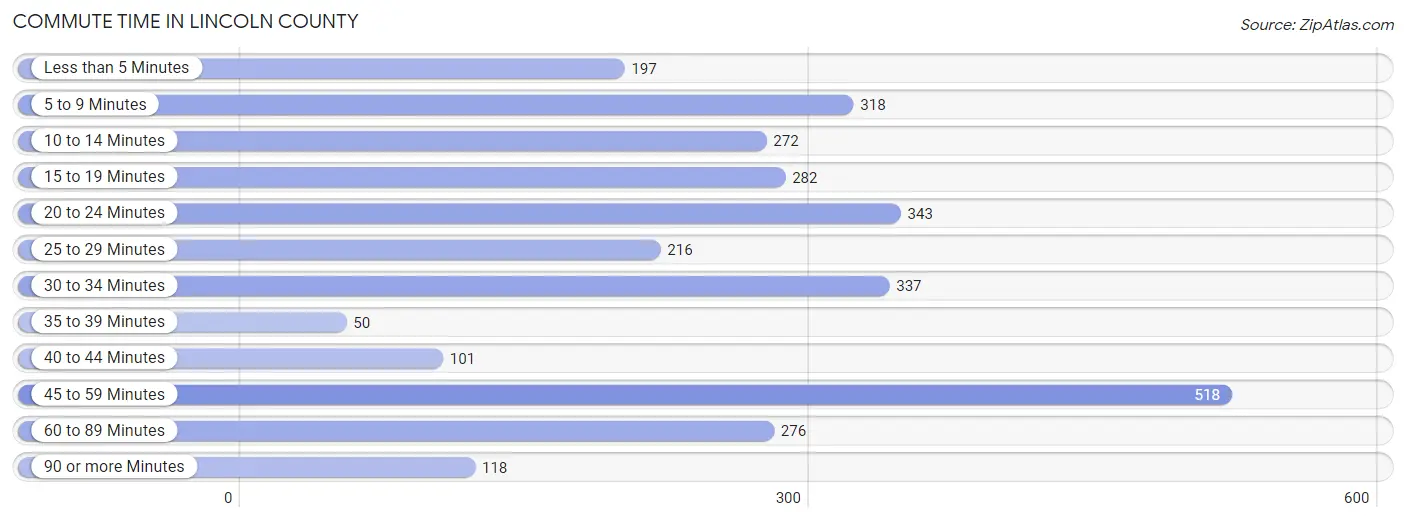
| Commute Time | # Commuters | % Commuters |
| Less than 5 Minutes | 197 | 6.5% |
| 5 to 9 Minutes | 318 | 10.5% |
| 10 to 14 Minutes | 272 | 9.0% |
| 15 to 19 Minutes | 282 | 9.3% |
| 20 to 24 Minutes | 343 | 11.3% |
| 25 to 29 Minutes | 216 | 7.1% |
| 30 to 34 Minutes | 337 | 11.1% |
| 35 to 39 Minutes | 50 | 1.7% |
| 40 to 44 Minutes | 101 | 3.3% |
| 45 to 59 Minutes | 518 | 17.1% |
| 60 to 89 Minutes | 276 | 9.1% |
| 90 or more Minutes | 118 | 3.9% |
Commute Time by Sex in Lincoln County
The most common commute times in Lincoln County are 45 to 59 minutes (271 commuters, 17.5%) for males and 45 to 59 minutes (247 commuters, 16.7%) for females.
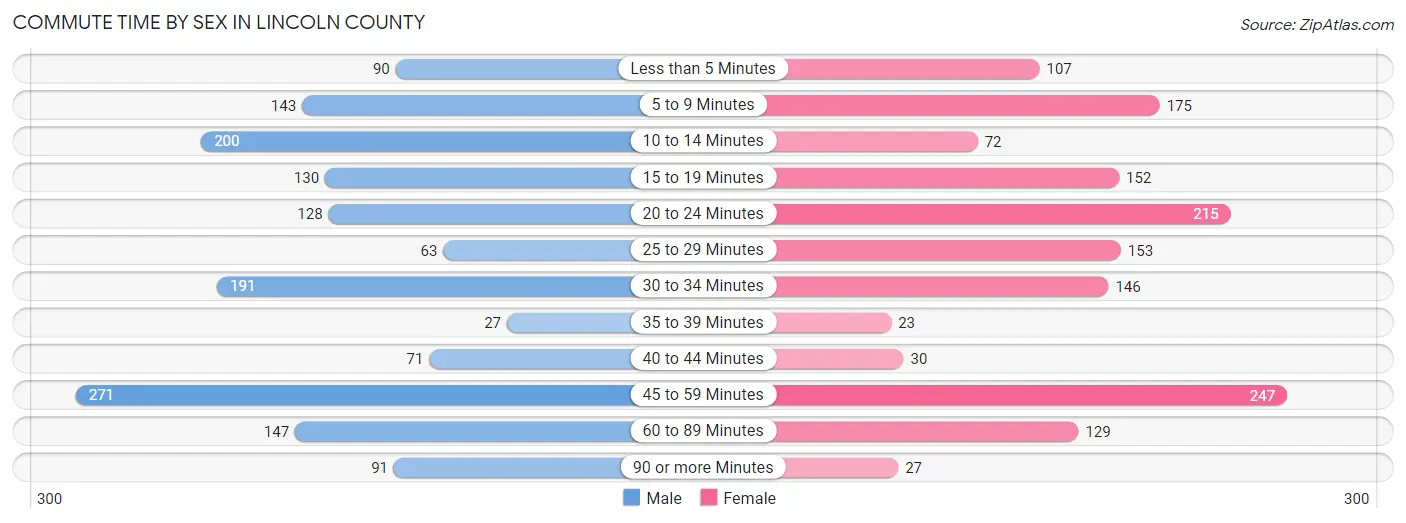
| Commute Time | Male | Female |
| Less than 5 Minutes | 90 (5.8%) | 107 (7.2%) |
| 5 to 9 Minutes | 143 (9.2%) | 175 (11.9%) |
| 10 to 14 Minutes | 200 (12.9%) | 72 (4.9%) |
| 15 to 19 Minutes | 130 (8.4%) | 152 (10.3%) |
| 20 to 24 Minutes | 128 (8.3%) | 215 (14.6%) |
| 25 to 29 Minutes | 63 (4.1%) | 153 (10.4%) |
| 30 to 34 Minutes | 191 (12.3%) | 146 (9.9%) |
| 35 to 39 Minutes | 27 (1.7%) | 23 (1.6%) |
| 40 to 44 Minutes | 71 (4.6%) | 30 (2.0%) |
| 45 to 59 Minutes | 271 (17.5%) | 247 (16.7%) |
| 60 to 89 Minutes | 147 (9.5%) | 129 (8.7%) |
| 90 or more Minutes | 91 (5.9%) | 27 (1.8%) |
Time of Departure to Work by Sex in Lincoln County
The most frequent times of departure to work in Lincoln County are 7:00 AM to 7:29 AM (396, 25.5%) for males and 8:00 AM to 8:29 AM (344, 23.3%) for females.
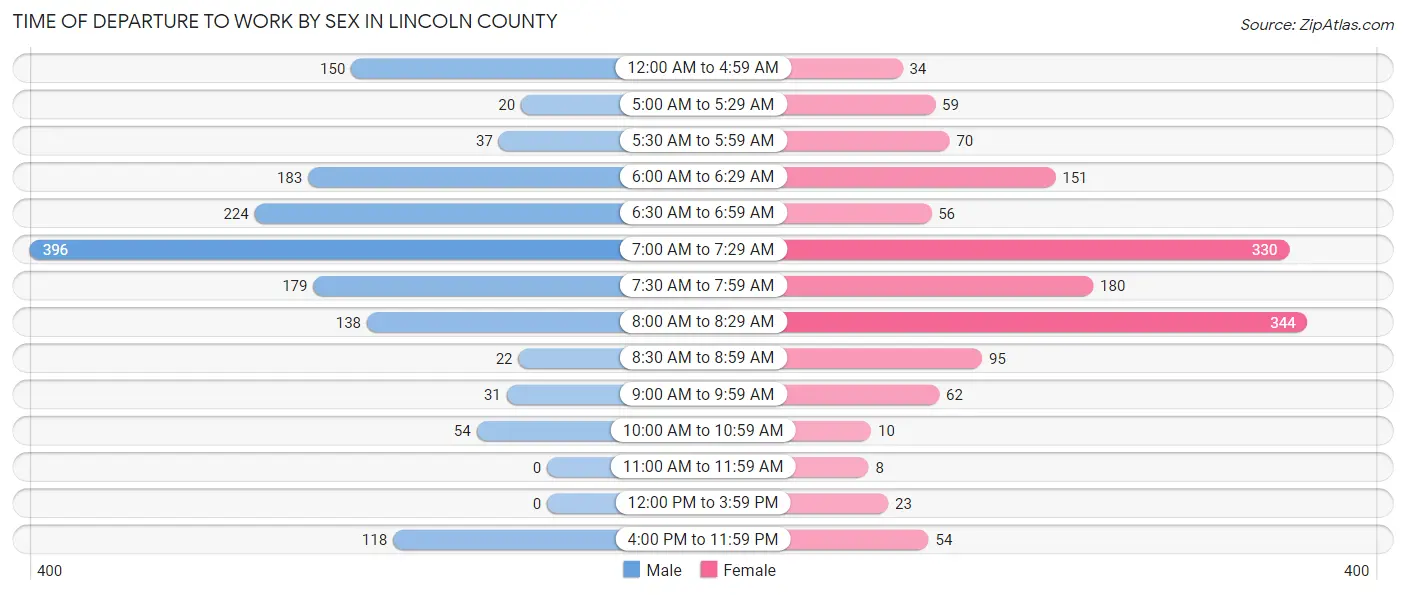
| Time of Departure | Male | Female |
| 12:00 AM to 4:59 AM | 150 (9.7%) | 34 (2.3%) |
| 5:00 AM to 5:29 AM | 20 (1.3%) | 59 (4.0%) |
| 5:30 AM to 5:59 AM | 37 (2.4%) | 70 (4.7%) |
| 6:00 AM to 6:29 AM | 183 (11.8%) | 151 (10.2%) |
| 6:30 AM to 6:59 AM | 224 (14.4%) | 56 (3.8%) |
| 7:00 AM to 7:29 AM | 396 (25.5%) | 330 (22.4%) |
| 7:30 AM to 7:59 AM | 179 (11.5%) | 180 (12.2%) |
| 8:00 AM to 8:29 AM | 138 (8.9%) | 344 (23.3%) |
| 8:30 AM to 8:59 AM | 22 (1.4%) | 95 (6.4%) |
| 9:00 AM to 9:59 AM | 31 (2.0%) | 62 (4.2%) |
| 10:00 AM to 10:59 AM | 54 (3.5%) | 10 (0.7%) |
| 11:00 AM to 11:59 AM | 0 (0.0%) | 8 (0.5%) |
| 12:00 PM to 3:59 PM | 0 (0.0%) | 23 (1.6%) |
| 4:00 PM to 11:59 PM | 118 (7.6%) | 54 (3.7%) |
| Total | 1,552 (100.0%) | 1,476 (100.0%) |
Housing Occupancy in Lincoln County
Occupancy by Ownership in Lincoln County
Of the total 3,015 dwellings in Lincoln County, owner-occupied units account for 2,289 (75.9%), while renter-occupied units make up 726 (24.1%).
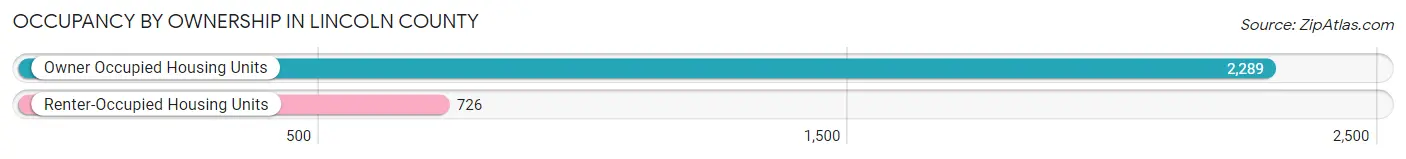
| Occupancy | # Housing Units | % Housing Units |
| Owner Occupied Housing Units | 2,289 | 75.9% |
| Renter-Occupied Housing Units | 726 | 24.1% |
| Total Occupied Housing Units | 3,015 | 100.0% |
Occupancy by Household Size in Lincoln County
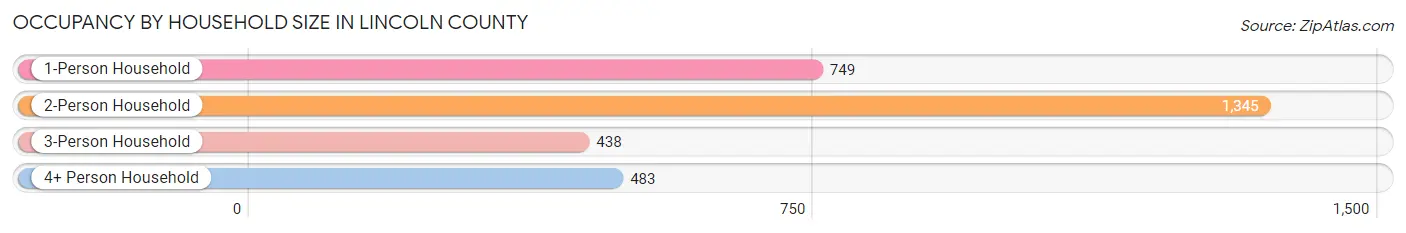
| Household Size | # Housing Units | % Housing Units |
| 1-Person Household | 749 | 24.8% |
| 2-Person Household | 1,345 | 44.6% |
| 3-Person Household | 438 | 14.5% |
| 4+ Person Household | 483 | 16.0% |
| Total Housing Units | 3,015 | 100.0% |
Occupancy by Ownership by Household Size in Lincoln County
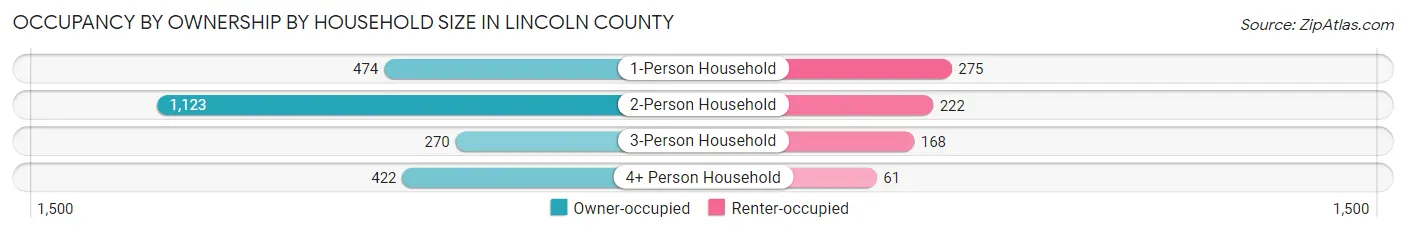
| Household Size | Owner-occupied | Renter-occupied |
| 1-Person Household | 474 (63.3%) | 275 (36.7%) |
| 2-Person Household | 1,123 (83.5%) | 222 (16.5%) |
| 3-Person Household | 270 (61.6%) | 168 (38.4%) |
| 4+ Person Household | 422 (87.4%) | 61 (12.6%) |
| Total Housing Units | 2,289 (75.9%) | 726 (24.1%) |
Occupancy by Educational Attainment in Lincoln County
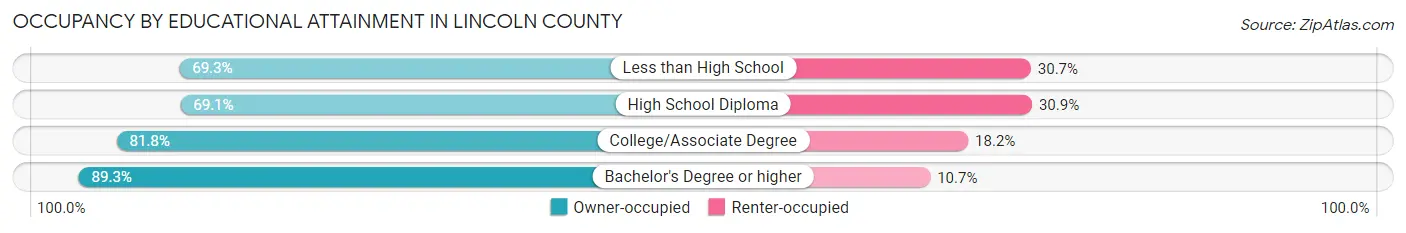
| Household Size | Owner-occupied | Renter-occupied |
| Less than High School | 278 (69.3%) | 123 (30.7%) |
| High School Diploma | 866 (69.1%) | 387 (30.9%) |
| College/Associate Degree | 762 (81.8%) | 170 (18.2%) |
| Bachelor's Degree or higher | 383 (89.3%) | 46 (10.7%) |
Occupancy by Age of Householder in Lincoln County
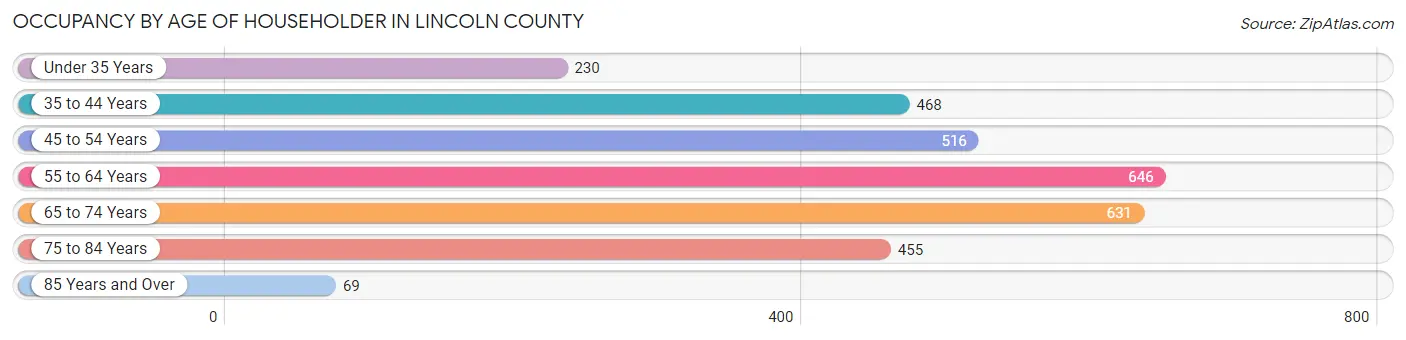
| Age Bracket | # Households | % Households |
| Under 35 Years | 230 | 7.6% |
| 35 to 44 Years | 468 | 15.5% |
| 45 to 54 Years | 516 | 17.1% |
| 55 to 64 Years | 646 | 21.4% |
| 65 to 74 Years | 631 | 20.9% |
| 75 to 84 Years | 455 | 15.1% |
| 85 Years and Over | 69 | 2.3% |
| Total | 3,015 | 100.0% |
Housing Finances in Lincoln County
Median Income by Occupancy in Lincoln County
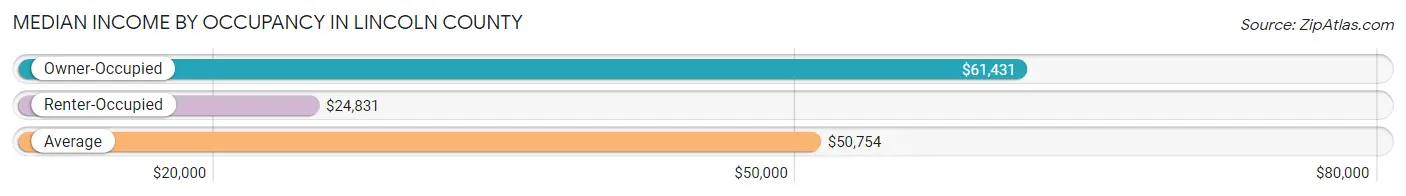
| Occupancy Type | # Households | Median Income |
| Owner-Occupied | 2,289 (75.9%) | $61,431 |
| Renter-Occupied | 726 (24.1%) | $24,831 |
| Average | 3,015 (100.0%) | $50,754 |
Occupancy by Householder Income Bracket in Lincoln County
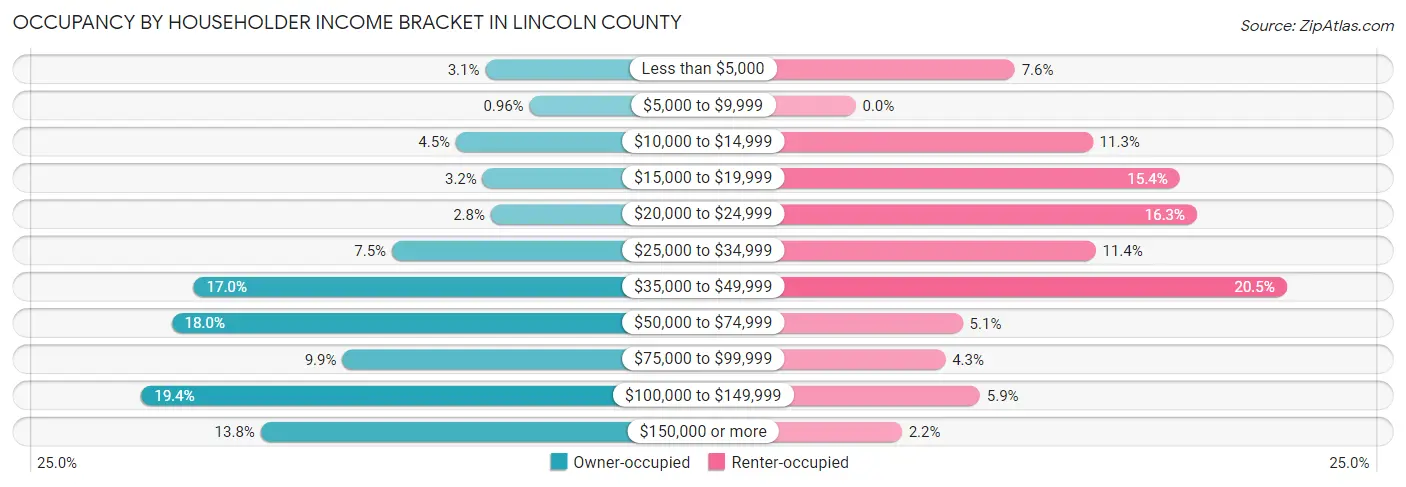
| Income Bracket | Owner-occupied | Renter-occupied |
| Less than $5,000 | 70 (3.1%) | 55 (7.6%) |
| $5,000 to $9,999 | 22 (1.0%) | 0 (0.0%) |
| $10,000 to $14,999 | 102 (4.5%) | 82 (11.3%) |
| $15,000 to $19,999 | 73 (3.2%) | 112 (15.4%) |
| $20,000 to $24,999 | 64 (2.8%) | 118 (16.3%) |
| $25,000 to $34,999 | 172 (7.5%) | 83 (11.4%) |
| $35,000 to $49,999 | 388 (17.0%) | 149 (20.5%) |
| $50,000 to $74,999 | 412 (18.0%) | 37 (5.1%) |
| $75,000 to $99,999 | 226 (9.9%) | 31 (4.3%) |
| $100,000 to $149,999 | 445 (19.4%) | 43 (5.9%) |
| $150,000 or more | 315 (13.8%) | 16 (2.2%) |
| Total | 2,289 (100.0%) | 726 (100.0%) |
Monthly Housing Cost Tiers in Lincoln County
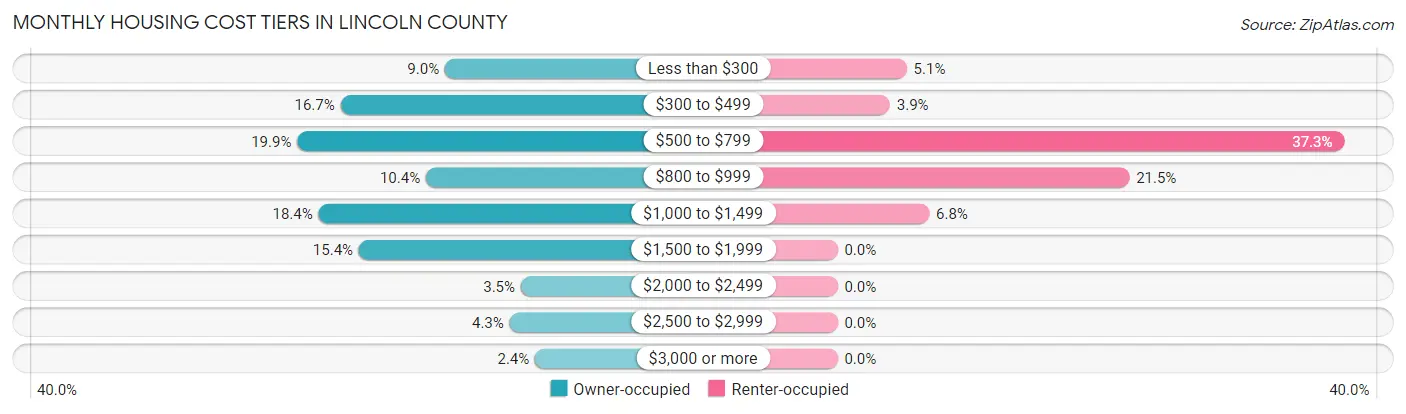
| Monthly Cost | Owner-occupied | Renter-occupied |
| Less than $300 | 207 (9.0%) | 37 (5.1%) |
| $300 to $499 | 383 (16.7%) | 28 (3.9%) |
| $500 to $799 | 456 (19.9%) | 271 (37.3%) |
| $800 to $999 | 239 (10.4%) | 156 (21.5%) |
| $1,000 to $1,499 | 420 (18.3%) | 49 (6.8%) |
| $1,500 to $1,999 | 352 (15.4%) | 0 (0.0%) |
| $2,000 to $2,499 | 79 (3.5%) | 0 (0.0%) |
| $2,500 to $2,999 | 98 (4.3%) | 0 (0.0%) |
| $3,000 or more | 55 (2.4%) | 0 (0.0%) |
| Total | 2,289 (100.0%) | 726 (100.0%) |
Physical Housing Characteristics in Lincoln County
Housing Structures in Lincoln County
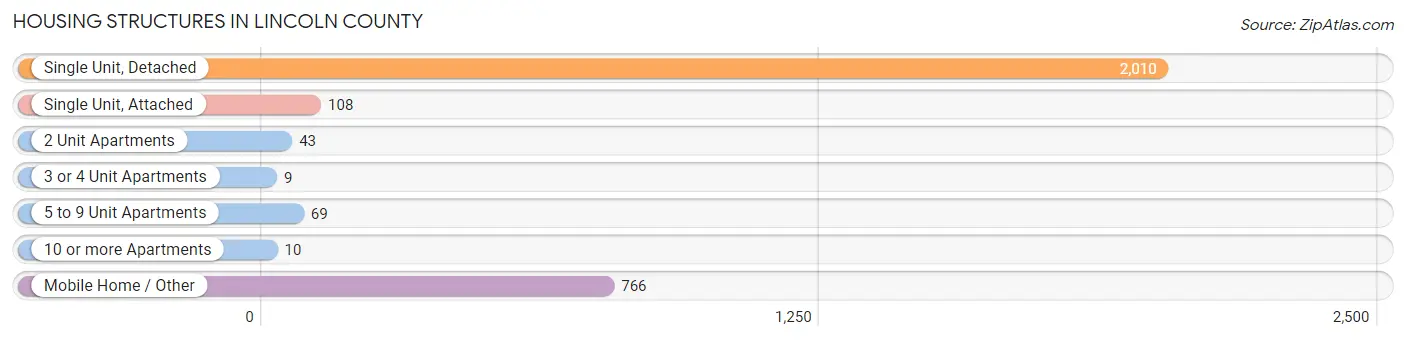
| Structure Type | # Housing Units | % Housing Units |
| Single Unit, Detached | 2,010 | 66.7% |
| Single Unit, Attached | 108 | 3.6% |
| 2 Unit Apartments | 43 | 1.4% |
| 3 or 4 Unit Apartments | 9 | 0.3% |
| 5 to 9 Unit Apartments | 69 | 2.3% |
| 10 or more Apartments | 10 | 0.3% |
| Mobile Home / Other | 766 | 25.4% |
| Total | 3,015 | 100.0% |
Housing Structures by Occupancy in Lincoln County
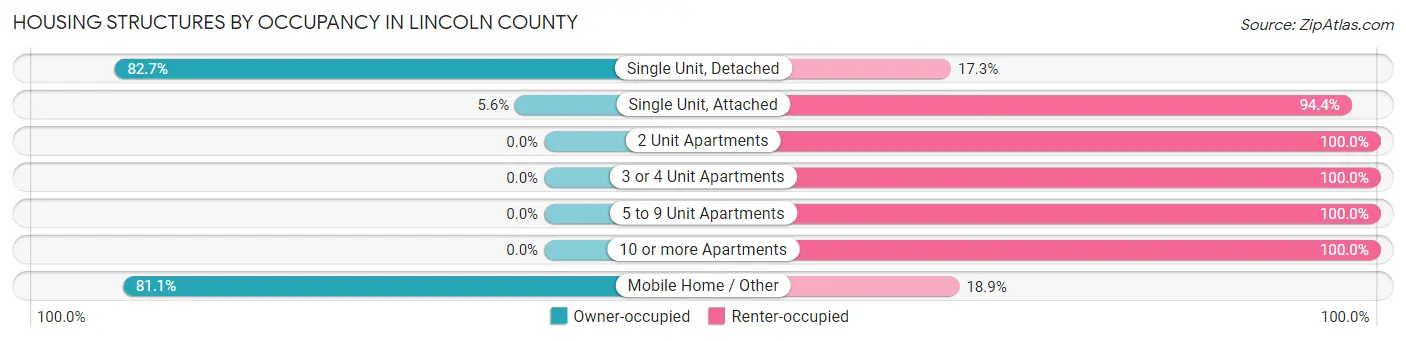
| Structure Type | Owner-occupied | Renter-occupied |
| Single Unit, Detached | 1,662 (82.7%) | 348 (17.3%) |
| Single Unit, Attached | 6 (5.6%) | 102 (94.4%) |
| 2 Unit Apartments | 0 (0.0%) | 43 (100.0%) |
| 3 or 4 Unit Apartments | 0 (0.0%) | 9 (100.0%) |
| 5 to 9 Unit Apartments | 0 (0.0%) | 69 (100.0%) |
| 10 or more Apartments | 0 (0.0%) | 10 (100.0%) |
| Mobile Home / Other | 621 (81.1%) | 145 (18.9%) |
| Total | 2,289 (75.9%) | 726 (24.1%) |
Housing Structures by Number of Rooms in Lincoln County
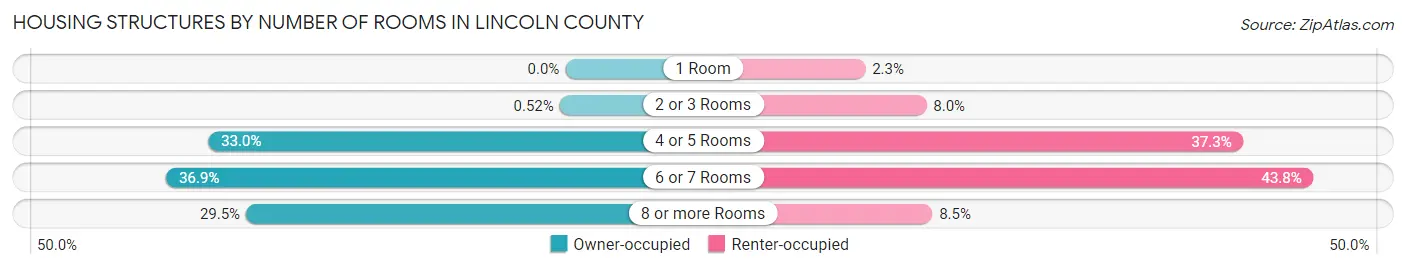
| Number of Rooms | Owner-occupied | Renter-occupied |
| 1 Room | 0 (0.0%) | 17 (2.3%) |
| 2 or 3 Rooms | 12 (0.5%) | 58 (8.0%) |
| 4 or 5 Rooms | 756 (33.0%) | 271 (37.3%) |
| 6 or 7 Rooms | 845 (36.9%) | 318 (43.8%) |
| 8 or more Rooms | 676 (29.5%) | 62 (8.5%) |
| Total | 2,289 (100.0%) | 726 (100.0%) |
Housing Structure by Heating Type in Lincoln County
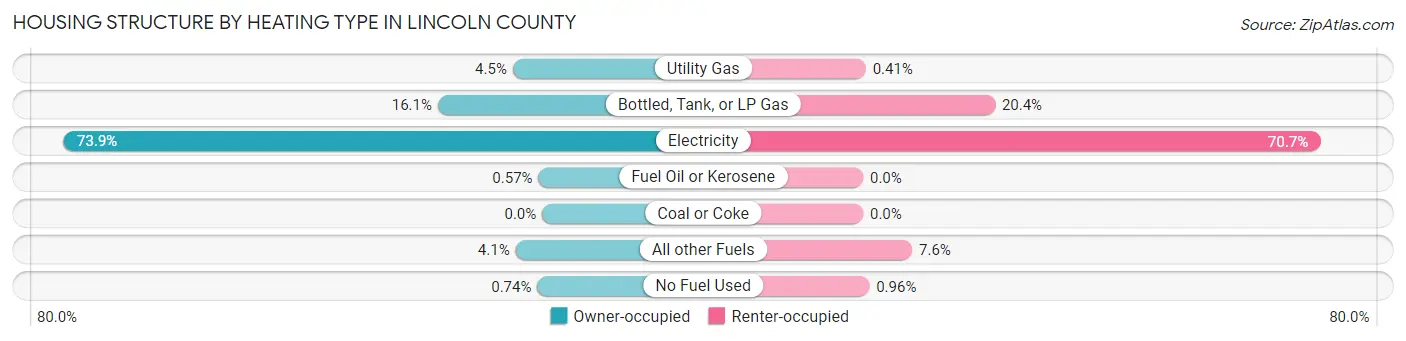
| Heating Type | Owner-occupied | Renter-occupied |
| Utility Gas | 104 (4.5%) | 3 (0.4%) |
| Bottled, Tank, or LP Gas | 369 (16.1%) | 148 (20.4%) |
| Electricity | 1,692 (73.9%) | 513 (70.7%) |
| Fuel Oil or Kerosene | 13 (0.6%) | 0 (0.0%) |
| Coal or Coke | 0 (0.0%) | 0 (0.0%) |
| All other Fuels | 94 (4.1%) | 55 (7.6%) |
| No Fuel Used | 17 (0.7%) | 7 (1.0%) |
| Total | 2,289 (100.0%) | 726 (100.0%) |
Household Vehicle Usage in Lincoln County
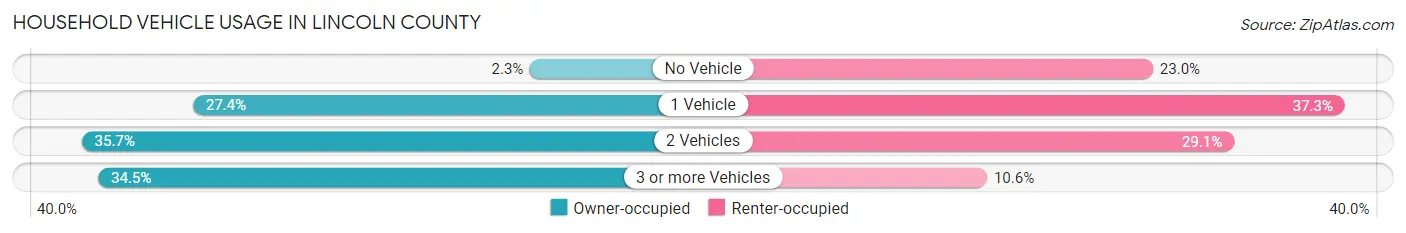
| Vehicles per Household | Owner-occupied | Renter-occupied |
| No Vehicle | 53 (2.3%) | 167 (23.0%) |
| 1 Vehicle | 628 (27.4%) | 271 (37.3%) |
| 2 Vehicles | 818 (35.7%) | 211 (29.1%) |
| 3 or more Vehicles | 790 (34.5%) | 77 (10.6%) |
| Total | 2,289 (100.0%) | 726 (100.0%) |
Real Estate & Mortgages in Lincoln County
Real Estate and Mortgage Overview in Lincoln County
| Characteristic | Without Mortgage | With Mortgage |
| Housing Units | 1,161 | 1,128 |
| Median Property Value | $129,000 | $190,800 |
| Median Household Income | $46,560 | $183 |
| Monthly Housing Costs | $495 | $55 |
| Real Estate Taxes | $1,135 | $27 |
Property Value by Mortgage Status in Lincoln County
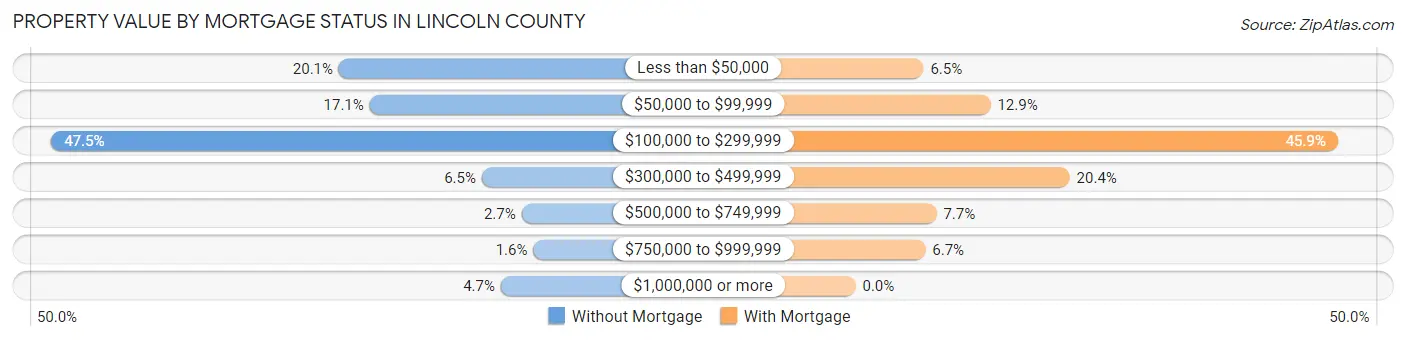
| Property Value | Without Mortgage | With Mortgage |
| Less than $50,000 | 233 (20.1%) | 73 (6.5%) |
| $50,000 to $99,999 | 199 (17.1%) | 145 (12.9%) |
| $100,000 to $299,999 | 551 (47.5%) | 518 (45.9%) |
| $300,000 to $499,999 | 75 (6.5%) | 230 (20.4%) |
| $500,000 to $749,999 | 31 (2.7%) | 87 (7.7%) |
| $750,000 to $999,999 | 18 (1.5%) | 75 (6.7%) |
| $1,000,000 or more | 54 (4.6%) | 0 (0.0%) |
| Total | 1,161 (100.0%) | 1,128 (100.0%) |
Household Income by Mortgage Status in Lincoln County
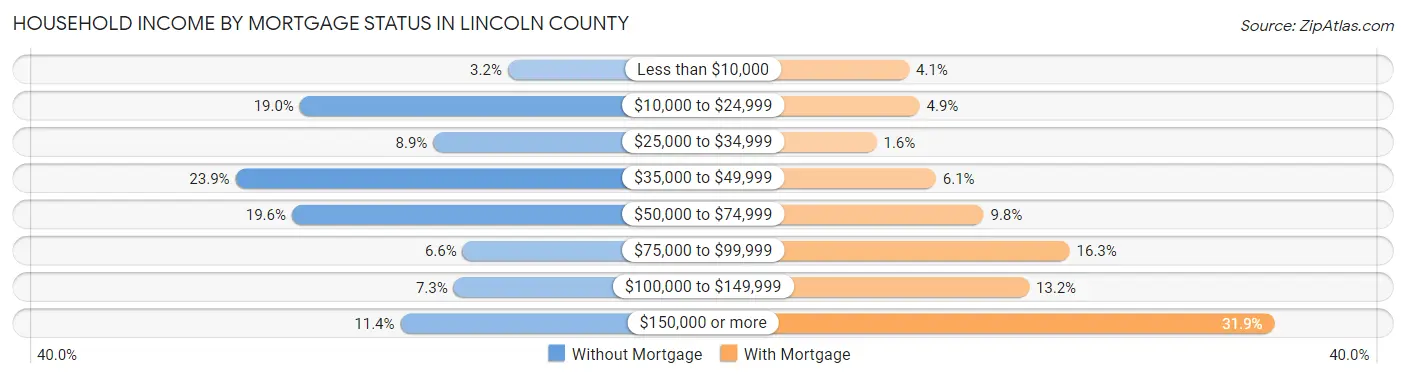
| Household Income | Without Mortgage | With Mortgage |
| Less than $10,000 | 37 (3.2%) | 46 (4.1%) |
| $10,000 to $24,999 | 221 (19.0%) | 55 (4.9%) |
| $25,000 to $34,999 | 103 (8.9%) | 18 (1.6%) |
| $35,000 to $49,999 | 278 (23.9%) | 69 (6.1%) |
| $50,000 to $74,999 | 228 (19.6%) | 110 (9.8%) |
| $75,000 to $99,999 | 77 (6.6%) | 184 (16.3%) |
| $100,000 to $149,999 | 85 (7.3%) | 149 (13.2%) |
| $150,000 or more | 132 (11.4%) | 360 (31.9%) |
| Total | 1,161 (100.0%) | 1,128 (100.0%) |
Property Value to Household Income Ratio in Lincoln County
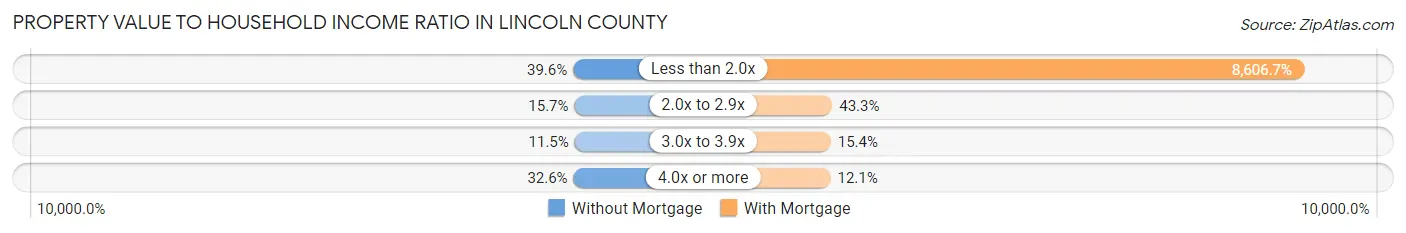
| Value-to-Income Ratio | Without Mortgage | With Mortgage |
| Less than 2.0x | 460 (39.6%) | 97,083 (8,606.7%) |
| 2.0x to 2.9x | 182 (15.7%) | 488 (43.3%) |
| 3.0x to 3.9x | 134 (11.5%) | 174 (15.4%) |
| 4.0x or more | 378 (32.6%) | 136 (12.1%) |
| Total | 1,161 (100.0%) | 1,128 (100.0%) |
Real Estate Taxes by Mortgage Status in Lincoln County
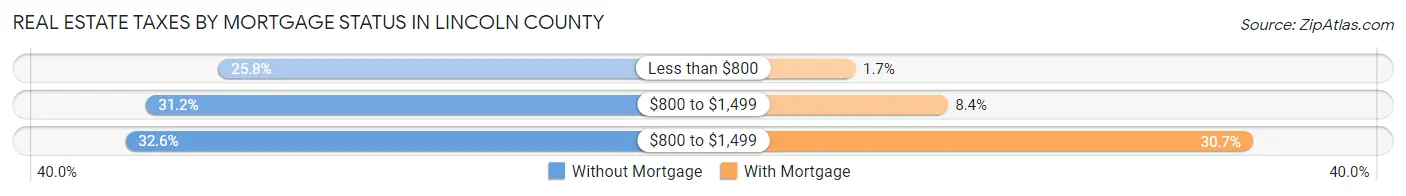
| Property Taxes | Without Mortgage | With Mortgage |
| Less than $800 | 300 (25.8%) | 19 (1.7%) |
| $800 to $1,499 | 362 (31.2%) | 95 (8.4%) |
| $800 to $1,499 | 379 (32.6%) | 346 (30.7%) |
| Total | 1,161 (100.0%) | 1,128 (100.0%) |
Health & Disability in Lincoln County
Health Insurance Coverage by Age in Lincoln County
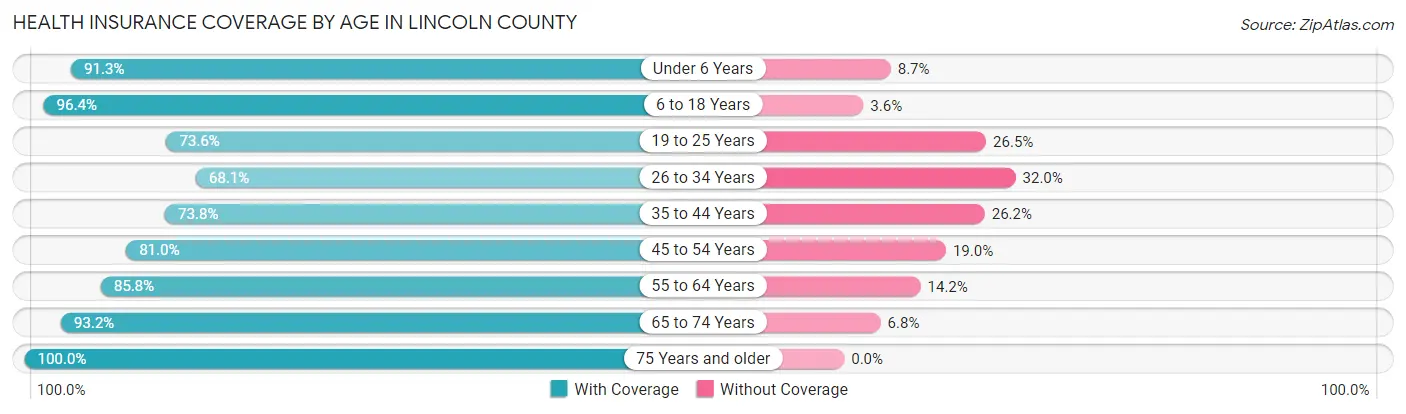
| Age Bracket | With Coverage | Without Coverage |
| Under 6 Years | 358 (91.3%) | 34 (8.7%) |
| 6 to 18 Years | 1,193 (96.4%) | 44 (3.6%) |
| 19 to 25 Years | 367 (73.6%) | 132 (26.5%) |
| 26 to 34 Years | 360 (68.0%) | 169 (32.0%) |
| 35 to 44 Years | 693 (73.8%) | 246 (26.2%) |
| 45 to 54 Years | 701 (81.0%) | 164 (19.0%) |
| 55 to 64 Years | 1,085 (85.8%) | 180 (14.2%) |
| 65 to 74 Years | 1,059 (93.2%) | 77 (6.8%) |
| 75 Years and older | 777 (100.0%) | 0 (0.0%) |
| Total | 6,593 (86.3%) | 1,046 (13.7%) |
Health Insurance Coverage by Citizenship Status in Lincoln County
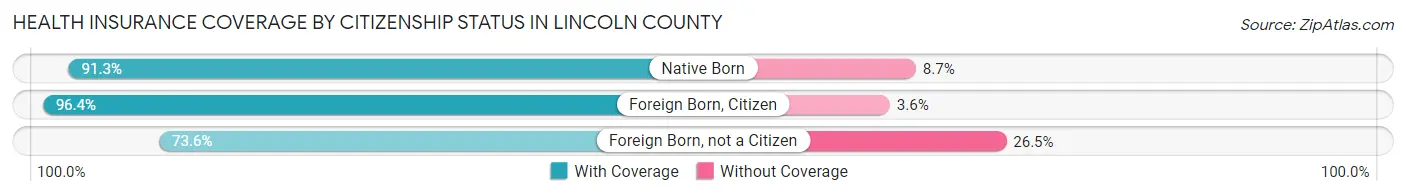
| Citizenship Status | With Coverage | Without Coverage |
| Native Born | 358 (91.3%) | 34 (8.7%) |
| Foreign Born, Citizen | 1,193 (96.4%) | 44 (3.6%) |
| Foreign Born, not a Citizen | 367 (73.6%) | 132 (26.5%) |
Health Insurance Coverage by Household Income in Lincoln County
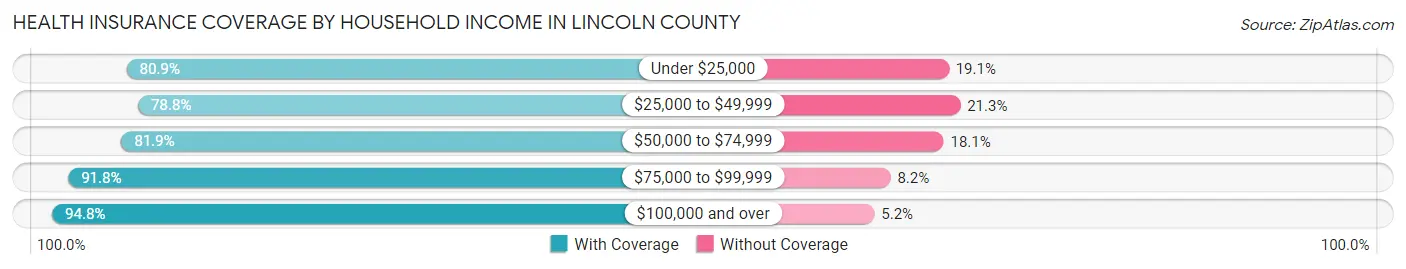
| Household Income | With Coverage | Without Coverage |
| Under $25,000 | 919 (80.9%) | 217 (19.1%) |
| $25,000 to $49,999 | 1,545 (78.7%) | 417 (21.2%) |
| $50,000 to $74,999 | 930 (81.9%) | 206 (18.1%) |
| $75,000 to $99,999 | 617 (91.8%) | 55 (8.2%) |
| $100,000 and over | 2,569 (94.8%) | 140 (5.2%) |
Public vs Private Health Insurance Coverage by Age in Lincoln County
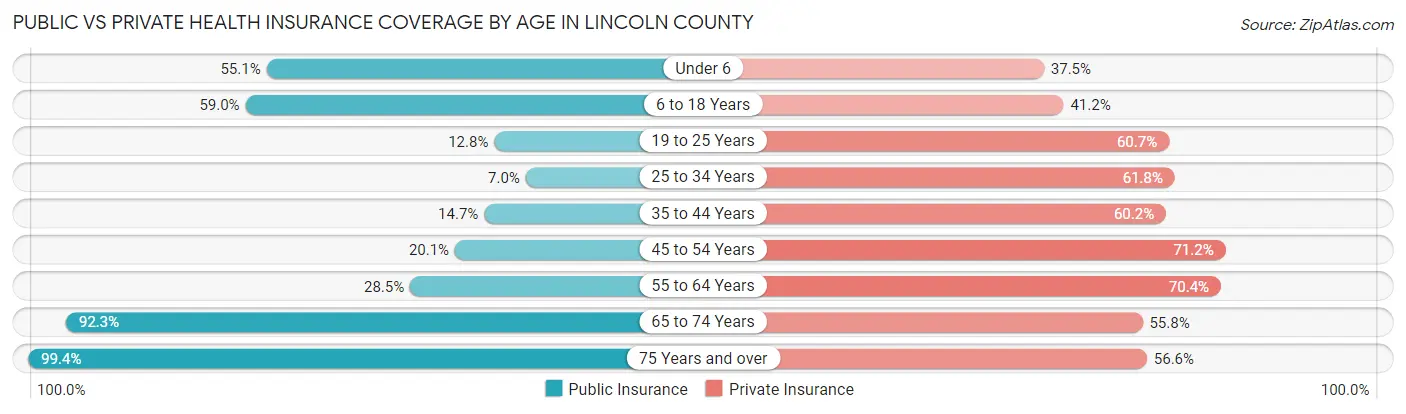
| Age Bracket | Public Insurance | Private Insurance |
| Under 6 | 216 (55.1%) | 147 (37.5%) |
| 6 to 18 Years | 730 (59.0%) | 509 (41.1%) |
| 19 to 25 Years | 64 (12.8%) | 303 (60.7%) |
| 25 to 34 Years | 37 (7.0%) | 327 (61.8%) |
| 35 to 44 Years | 138 (14.7%) | 565 (60.2%) |
| 45 to 54 Years | 174 (20.1%) | 616 (71.2%) |
| 55 to 64 Years | 360 (28.5%) | 890 (70.4%) |
| 65 to 74 Years | 1,049 (92.3%) | 634 (55.8%) |
| 75 Years and over | 772 (99.4%) | 440 (56.6%) |
| Total | 3,540 (46.3%) | 4,431 (58.0%) |
Disability Status by Sex by Age in Lincoln County
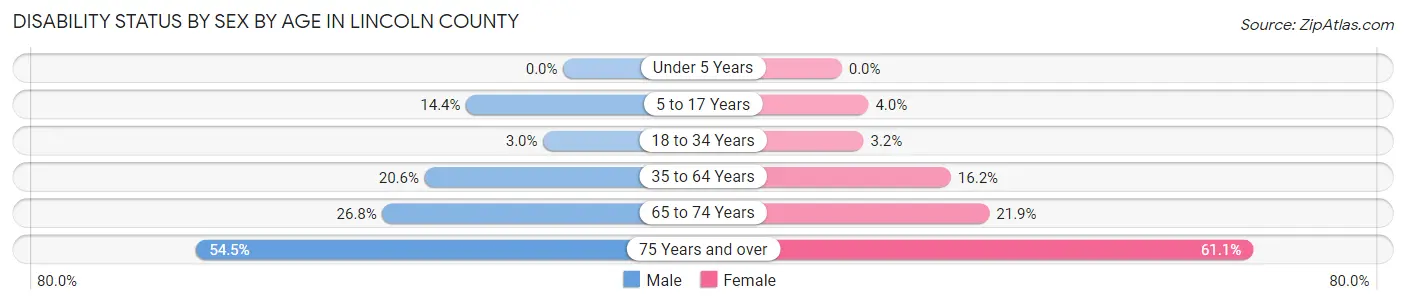
| Age Bracket | Male | Female |
| Under 5 Years | 0 (0.0%) | 0 (0.0%) |
| 5 to 17 Years | 93 (14.4%) | 21 (4.0%) |
| 18 to 34 Years | 19 (3.0%) | 17 (3.2%) |
| 35 to 64 Years | 286 (20.6%) | 272 (16.2%) |
| 65 to 74 Years | 142 (26.8%) | 133 (21.9%) |
| 75 Years and over | 194 (54.5%) | 257 (61.1%) |
Disability Class by Sex by Age in Lincoln County
Disability Class: Hearing Difficulty
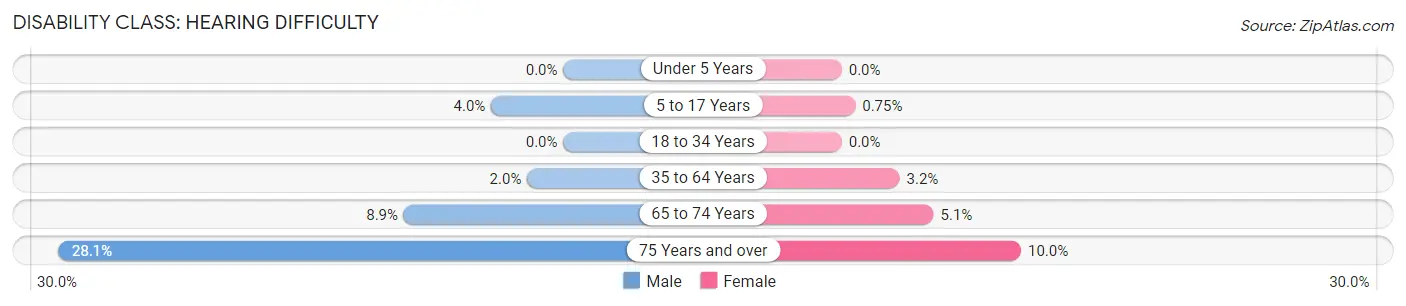
| Age Bracket | Male | Female |
| Under 5 Years | 0 (0.0%) | 0 (0.0%) |
| 5 to 17 Years | 26 (4.0%) | 4 (0.7%) |
| 18 to 34 Years | 0 (0.0%) | 0 (0.0%) |
| 35 to 64 Years | 28 (2.0%) | 54 (3.2%) |
| 65 to 74 Years | 47 (8.9%) | 31 (5.1%) |
| 75 Years and over | 100 (28.1%) | 42 (10.0%) |
Disability Class: Vision Difficulty
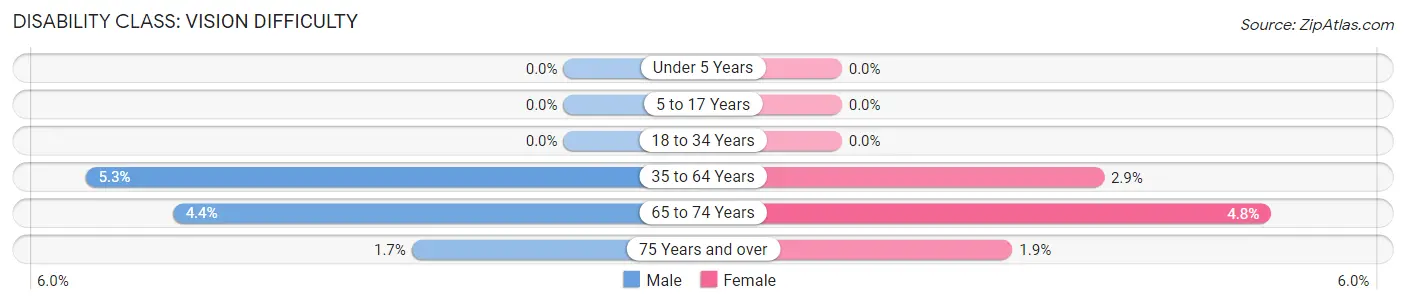
| Age Bracket | Male | Female |
| Under 5 Years | 0 (0.0%) | 0 (0.0%) |
| 5 to 17 Years | 0 (0.0%) | 0 (0.0%) |
| 18 to 34 Years | 0 (0.0%) | 0 (0.0%) |
| 35 to 64 Years | 74 (5.3%) | 49 (2.9%) |
| 65 to 74 Years | 23 (4.3%) | 29 (4.8%) |
| 75 Years and over | 6 (1.7%) | 8 (1.9%) |
Disability Class: Cognitive Difficulty
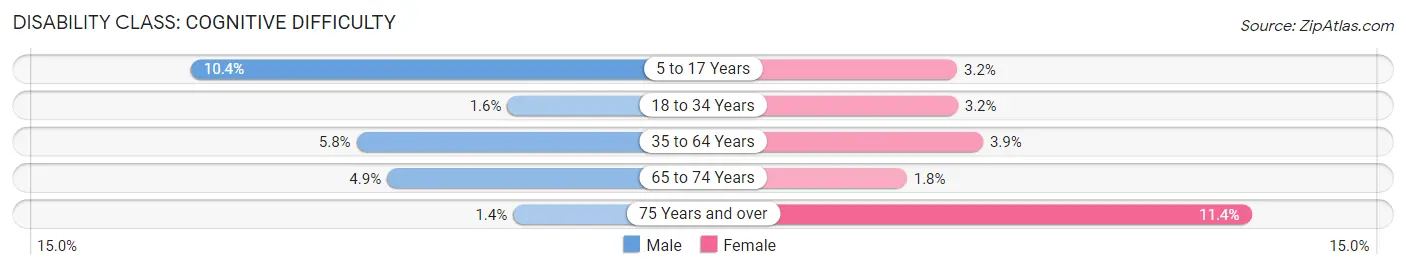
| Age Bracket | Male | Female |
| 5 to 17 Years | 67 (10.4%) | 17 (3.2%) |
| 18 to 34 Years | 10 (1.6%) | 17 (3.2%) |
| 35 to 64 Years | 80 (5.8%) | 66 (3.9%) |
| 65 to 74 Years | 26 (4.9%) | 11 (1.8%) |
| 75 Years and over | 5 (1.4%) | 48 (11.4%) |
Disability Class: Ambulatory Difficulty
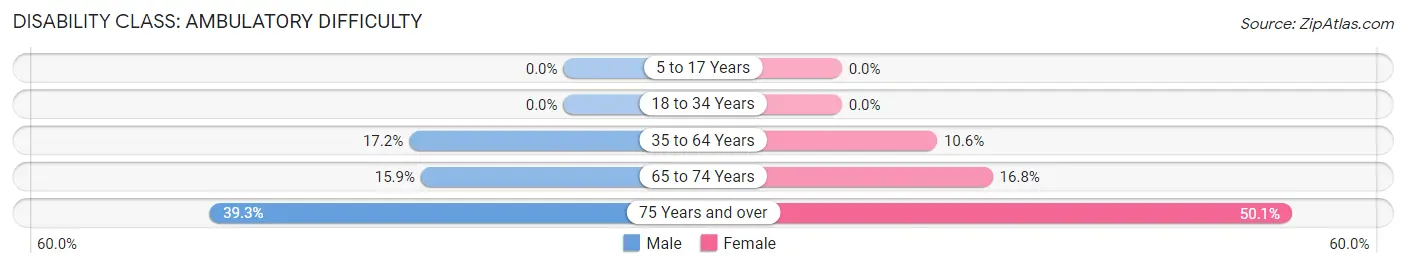
| Age Bracket | Male | Female |
| 5 to 17 Years | 0 (0.0%) | 0 (0.0%) |
| 18 to 34 Years | 0 (0.0%) | 0 (0.0%) |
| 35 to 64 Years | 239 (17.2%) | 178 (10.6%) |
| 65 to 74 Years | 84 (15.9%) | 102 (16.8%) |
| 75 Years and over | 140 (39.3%) | 211 (50.1%) |
Disability Class: Self-Care Difficulty
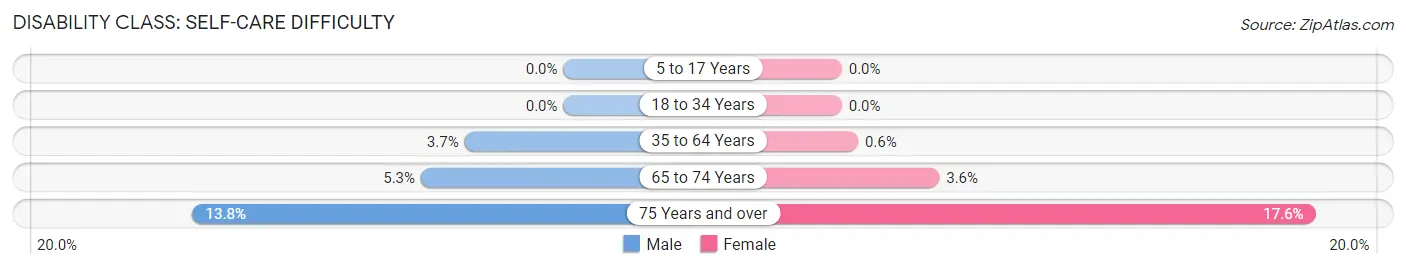
| Age Bracket | Male | Female |
| 5 to 17 Years | 0 (0.0%) | 0 (0.0%) |
| 18 to 34 Years | 0 (0.0%) | 0 (0.0%) |
| 35 to 64 Years | 51 (3.7%) | 10 (0.6%) |
| 65 to 74 Years | 28 (5.3%) | 22 (3.6%) |
| 75 Years and over | 49 (13.8%) | 74 (17.6%) |
Technology Access in Lincoln County
Computing Device Access in Lincoln County
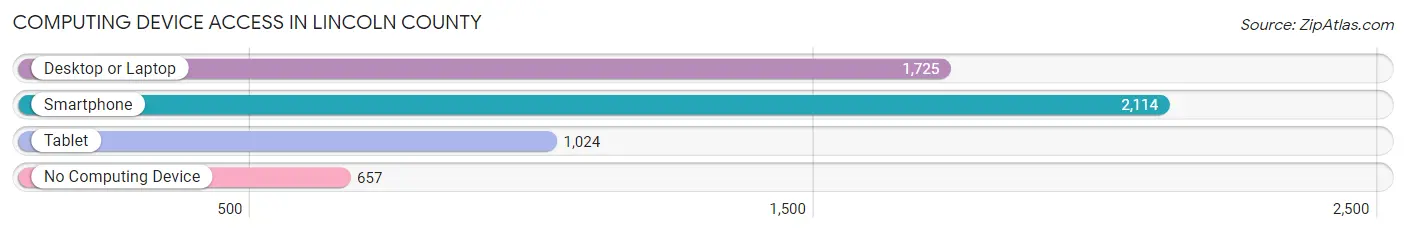
| Device Type | # Households | % Households |
| Desktop or Laptop | 1,725 | 57.2% |
| Smartphone | 2,114 | 70.1% |
| Tablet | 1,024 | 34.0% |
| No Computing Device | 657 | 21.8% |
| Total | 3,015 | 100.0% |
Internet Access in Lincoln County
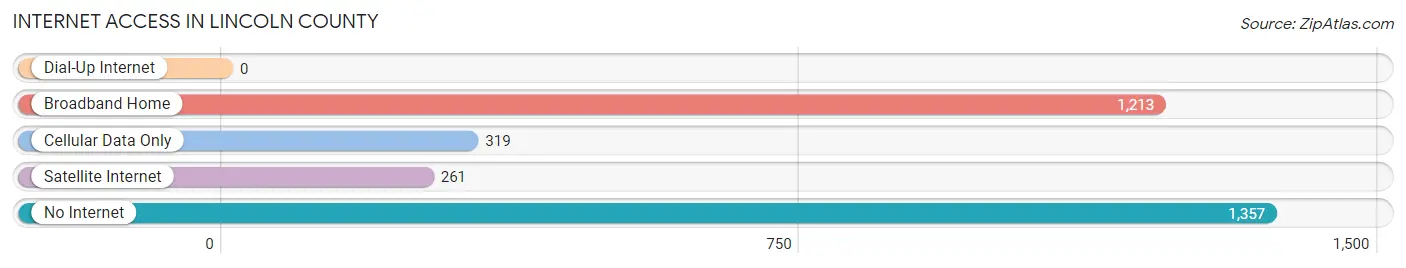
| Internet Type | # Households | % Households |
| Dial-Up Internet | 0 | 0.0% |
| Broadband Home | 1,213 | 40.2% |
| Cellular Data Only | 319 | 10.6% |
| Satellite Internet | 261 | 8.7% |
| No Internet | 1,357 | 45.0% |
| Total | 3,015 | 100.0% |
Lincoln County Summary
Lincoln County is a county located in the state of Georgia, United States. As of the 2010 census, the population was 7,996. The county seat is Lincolnton. The county was created on February 20, 1796 and named for Major General Benjamin Lincoln, an officer in the American Revolutionary War.
Geography
Lincoln County is located in the east-central part of Georgia, in the Piedmont region. It is bordered by Wilkes County to the north, Columbia County to the east, McDuffie County to the south, and Warren and Taliaferro counties to the west. The county has a total area of 441 square miles, of which 437 square miles is land and 4.2 square miles (1.0%) is water.
The county is located in the Savannah River basin and is drained by the Little River, which flows through the county from north to south. The county is located in the Piedmont region of Georgia, which is characterized by rolling hills and valleys. The highest point in the county is located at an elevation of 890 feet above sea level.
Economy
Lincoln County has a diversified economy, with agriculture, manufacturing, and tourism being the main industries. Agriculture is the largest sector of the economy, with the county being home to several large farms. The main crops grown in the county are cotton, corn, soybeans, and peanuts.
Manufacturing is also an important part of the economy, with several large factories located in the county. The largest employers in the county are the Lincoln County Industrial Park, which employs over 1,000 people, and the Lincoln County Textile Mill, which employs over 500 people.
Tourism is also an important part of the economy, with the county being home to several popular attractions, such as the Lincoln County Historical Museum, the Lincoln County Courthouse, and the Lincoln County Fairgrounds.
Demographics
As of the 2010 census, there were 7,996 people, 2,945 households, and 2,072 families residing in the county. The population density was 18.2 people per square mile. The racial makeup of the county was 68.3% White, 28.2% Black or African American, 0.3% Native American, 0.3% Asian, 0.1% Pacific Islander, 1.2% from other races, and 1.6% from two or more races.
The median income for a household in the county was $35,945, and the median income for a family was $43,945. The per capita income for the county was $17,845. About 17.2% of families and 21.2% of the population were below the poverty line, including 28.2% of those under age 18 and 16.2% of those age 65 or over.
Conclusion
Lincoln County is a county located in the state of Georgia, United States. As of the 2010 census, the population was 7,996. The county has a diversified economy, with agriculture, manufacturing, and tourism being the main industries. The population is predominantly White, with 28.2% of the population being Black or African American. The median income for a household in the county was $35,945, and the median income for a family was $43,945. The per capita income for the county was $17,845. Lincoln County is a great place to live, work, and visit, with its diverse economy, beautiful scenery, and friendly people.
Common Questions
What is Per Capita Income in Lincoln County?
Per Capita income in Lincoln County is $28,414.
What is the Median Family Income in Lincoln County?
Median Family Income in Lincoln County is $63,958.
What is the Median Household income in Lincoln County?
Median Household Income in Lincoln County is $50,754.
What is Income or Wage Gap in Lincoln County?
Income or Wage Gap in Lincoln County is 31.1%.
Women in Lincoln County earn 68.9 cents for every dollar earned by a man.
What is Family Income Deficit in Lincoln County?
Family Income Deficit in Lincoln County is $7,244.
Families that are below poverty line in Lincoln County earn $7,244 less on average than the poverty threshold level.
What is Inequality or Gini Index in Lincoln County?
Inequality or Gini Index in Lincoln County is 0.44.
What is the Total Population of Lincoln County?
Total Population of Lincoln County is 7,726.
What is the Total Male Population of Lincoln County?
Total Male Population of Lincoln County is 3,794.
What is the Total Female Population of Lincoln County?
Total Female Population of Lincoln County is 3,932.
What is the Ratio of Males per 100 Females in Lincoln County?
There are 96.49 Males per 100 Females in Lincoln County.
What is the Ratio of Females per 100 Males in Lincoln County?
There are 103.64 Females per 100 Males in Lincoln County.
What is the Median Population Age in Lincoln County?
Median Population Age in Lincoln County is 47.1 Years.
What is the Average Family Size in Lincoln County
Average Family Size in Lincoln County is 3.0 People.
What is the Average Household Size in Lincoln County
Average Household Size in Lincoln County is 2.5 People.
How Large is the Labor Force in Lincoln County?
There are 3,360 People in the Labor Forcein in Lincoln County.
What is the Percentage of People in the Labor Force in Lincoln County?
52.0% of People are in the Labor Force in Lincoln County.
What is the Unemployment Rate in Lincoln County?
Unemployment Rate in Lincoln County is 3.6%.