Liberty County, GA Map & Demographics
Liberty County Map
Liberty County Overview
$26,121
PER CAPITA INCOME
$61,242
AVG FAMILY INCOME
$55,149
AVG HOUSEHOLD INCOME
34.0%
WAGE / INCOME GAP [ % ]
66.0¢/ $1
WAGE / INCOME GAP [ $ ]
$11,650
FAMILY INCOME DEFICIT
0.41
INEQUALITY / GINI INDEX
65,550
TOTAL POPULATION
33,739
MALE POPULATION
31,811
FEMALE POPULATION
106.06
MALES / 100 FEMALES
94.29
FEMALES / 100 MALES
28.6
MEDIAN AGE
3.4
AVG FAMILY SIZE
2.8
AVG HOUSEHOLD SIZE
32,651
LABOR FORCE [ PEOPLE ]
66.6%
PERCENT IN LABOR FORCE
8.7%
UNEMPLOYMENT RATE
Liberty County Area Codes
Income in Liberty County
Income Overview in Liberty County
Per Capita Income in Liberty County is $26,121, while median incomes of families and households are $61,242 and $55,149 respectively.
| Characteristic | Number | Measure |
| Per Capita Income | 65,550 | $26,121 |
| Median Family Income | 15,862 | $61,242 |
| Mean Family Income | 15,862 | $74,552 |
| Median Household Income | 22,975 | $55,149 |
| Mean Household Income | 22,975 | $68,445 |
| Income Deficit | 15,862 | $11,650 |
| Wage / Income Gap (%) | 65,550 | 33.96% |
| Wage / Income Gap ($) | 65,550 | 66.04¢ per $1 |
| Gini / Inequality Index | 65,550 | 0.41 |
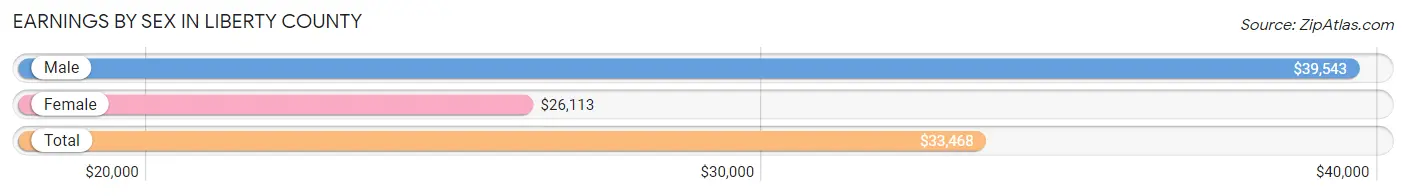
Earnings by Sex in Liberty County
Average Earnings in Liberty County are $33,468, $39,543 for men and $26,113 for women, a difference of 34.0%.
| Sex | Number | Average Earnings |
| Male | 18,717 (56.2%) | $39,543 |
| Female | 14,567 (43.8%) | $26,113 |
| Total | 33,284 (100.0%) | $33,468 |
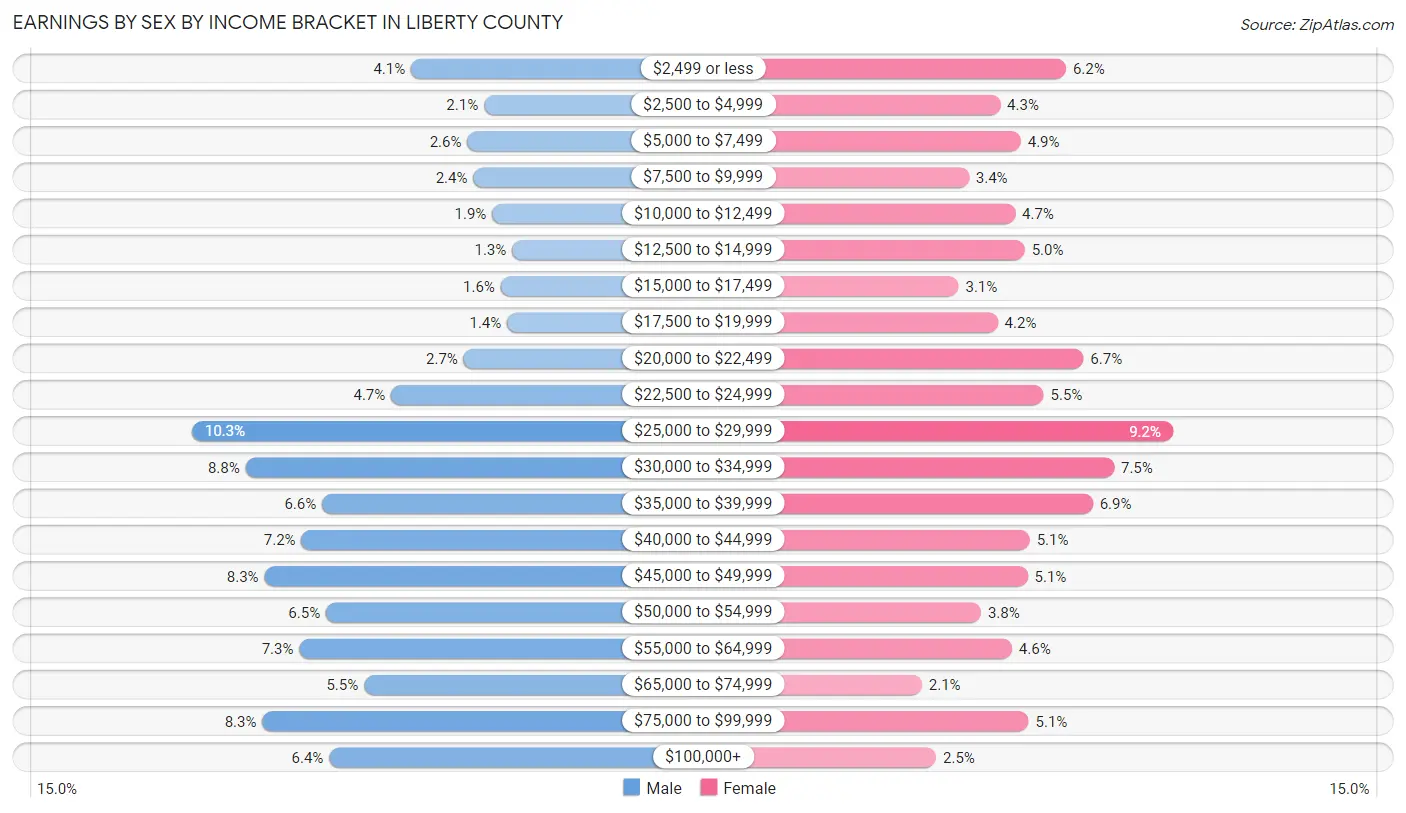
Earnings by Sex by Income Bracket in Liberty County
The most common earnings brackets in Liberty County are $25,000 to $29,999 for men (1,927 | 10.3%) and $25,000 to $29,999 for women (1,334 | 9.2%).
| Income | Male | Female |
| $2,499 or less | 774 (4.1%) | 897 (6.2%) |
| $2,500 to $4,999 | 392 (2.1%) | 628 (4.3%) |
| $5,000 to $7,499 | 479 (2.6%) | 712 (4.9%) |
| $7,500 to $9,999 | 447 (2.4%) | 499 (3.4%) |
| $10,000 to $12,499 | 348 (1.9%) | 689 (4.7%) |
| $12,500 to $14,999 | 244 (1.3%) | 729 (5.0%) |
| $15,000 to $17,499 | 304 (1.6%) | 457 (3.1%) |
| $17,500 to $19,999 | 270 (1.4%) | 618 (4.2%) |
| $20,000 to $22,499 | 497 (2.7%) | 969 (6.7%) |
| $22,500 to $24,999 | 879 (4.7%) | 805 (5.5%) |
| $25,000 to $29,999 | 1,927 (10.3%) | 1,334 (9.2%) |
| $30,000 to $34,999 | 1,646 (8.8%) | 1,094 (7.5%) |
| $35,000 to $39,999 | 1,243 (6.6%) | 1,006 (6.9%) |
| $40,000 to $44,999 | 1,351 (7.2%) | 749 (5.1%) |
| $45,000 to $49,999 | 1,546 (8.3%) | 740 (5.1%) |
| $50,000 to $54,999 | 1,223 (6.5%) | 549 (3.8%) |
| $55,000 to $64,999 | 1,363 (7.3%) | 676 (4.6%) |
| $65,000 to $74,999 | 1,022 (5.5%) | 307 (2.1%) |
| $75,000 to $99,999 | 1,557 (8.3%) | 744 (5.1%) |
| $100,000+ | 1,205 (6.4%) | 365 (2.5%) |
| Total | 18,717 (100.0%) | 14,567 (100.0%) |
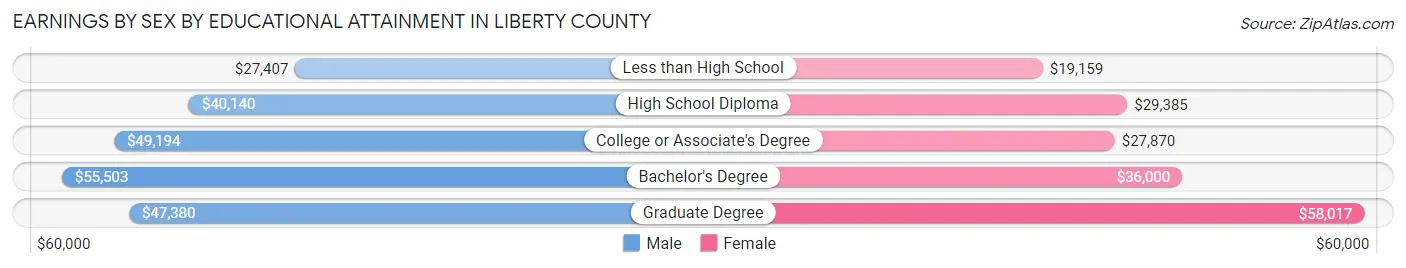
Earnings by Sex by Educational Attainment in Liberty County
Average earnings in Liberty County are $45,992 for men and $30,469 for women, a difference of 33.8%. Men with an educational attainment of bachelor's degree enjoy the highest average annual earnings of $55,503, while those with less than high school education earn the least with $27,407. Women with an educational attainment of graduate degree earn the most with the average annual earnings of $58,017, while those with less than high school education have the smallest earnings of $19,159.
| Educational Attainment | Male Income | Female Income |
| Less than High School | $27,407 | $19,159 |
| High School Diploma | $40,140 | $29,385 |
| College or Associate's Degree | $49,194 | $27,870 |
| Bachelor's Degree | $55,503 | $36,000 |
| Graduate Degree | $47,380 | $58,017 |
| Total | $45,992 | $30,469 |
Family Income in Liberty County
Family Income Brackets in Liberty County
According to the Liberty County family income data, there are 3,632 families falling into the $50,000 to $74,999 income range, which is the most common income bracket and makes up 22.9% of all families. Conversely, the $10,000 to $14,999 income bracket is the least frequent group with only 301 families (1.9%) belonging to this category.
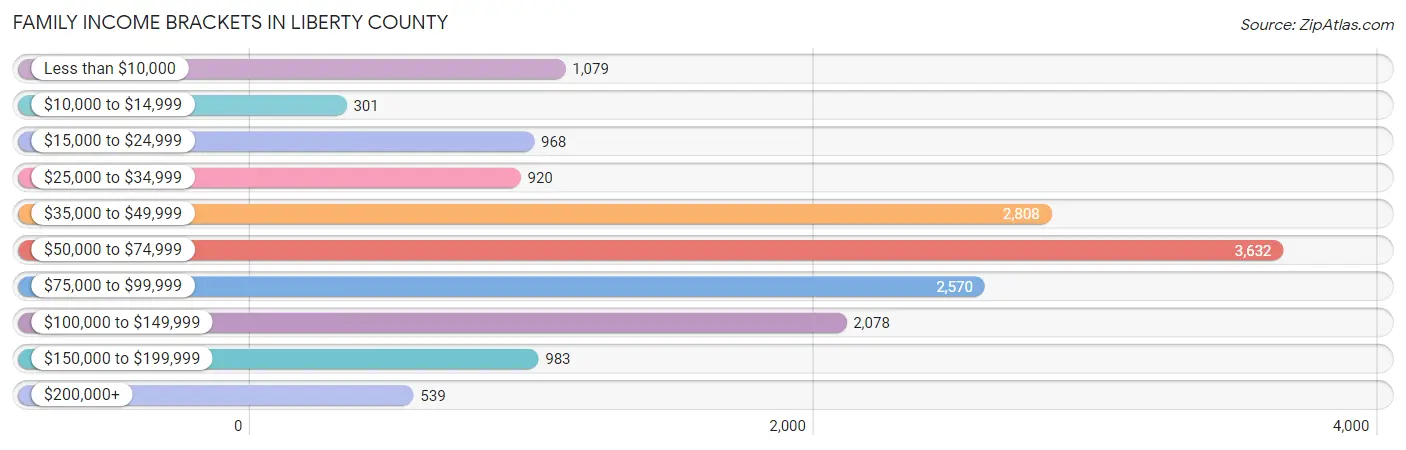
| Income Bracket | # Families | % Families |
| Less than $10,000 | 1,079 | 6.8% |
| $10,000 to $14,999 | 301 | 1.9% |
| $15,000 to $24,999 | 968 | 6.1% |
| $25,000 to $34,999 | 920 | 5.8% |
| $35,000 to $49,999 | 2,808 | 17.7% |
| $50,000 to $74,999 | 3,632 | 22.9% |
| $75,000 to $99,999 | 2,570 | 16.2% |
| $100,000 to $149,999 | 2,078 | 13.1% |
| $150,000 to $199,999 | 983 | 6.2% |
| $200,000+ | 539 | 3.4% |
Family Income by Famaliy Size in Liberty County
7+ person families (173 | 1.1%) account for the highest median family income in Liberty County with $97,404 per family, while 2-person families (7,452 | 47.0%) have the highest median income of $28,630 per family member.
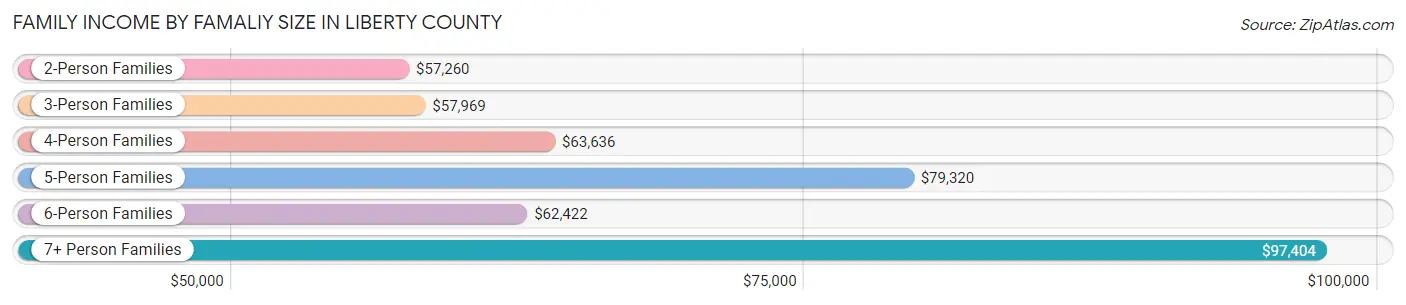
| Income Bracket | # Families | Median Income |
| 2-Person Families | 7,452 (47.0%) | $57,260 |
| 3-Person Families | 3,677 (23.2%) | $57,969 |
| 4-Person Families | 2,580 (16.3%) | $63,636 |
| 5-Person Families | 1,485 (9.4%) | $79,320 |
| 6-Person Families | 495 (3.1%) | $62,422 |
| 7+ Person Families | 173 (1.1%) | $97,404 |
| Total | 15,862 (100.0%) | $61,242 |
Family Income by Number of Earners in Liberty County
The median family income in Liberty County is $61,242, with families comprising 3+ earners (874) having the highest median family income of $129,188, while families with no earners (2,418) have the lowest median family income of $30,500, accounting for 5.5% and 15.2% of families, respectively.
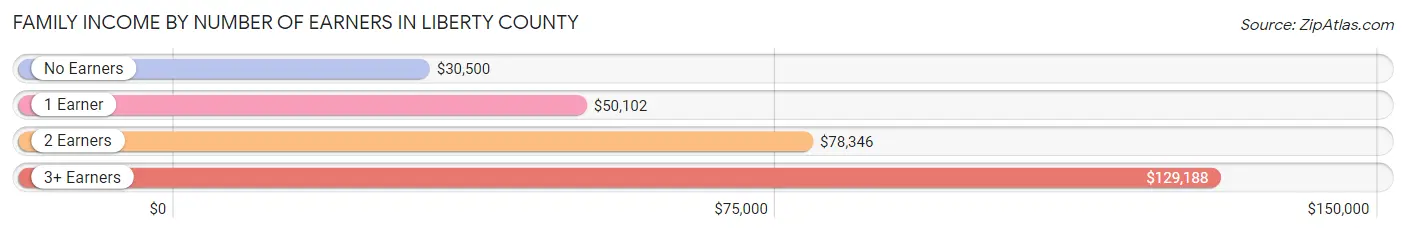
| Number of Earners | # Families | Median Income |
| No Earners | 2,418 (15.2%) | $30,500 |
| 1 Earner | 6,033 (38.0%) | $50,102 |
| 2 Earners | 6,537 (41.2%) | $78,346 |
| 3+ Earners | 874 (5.5%) | $129,188 |
| Total | 15,862 (100.0%) | $61,242 |
Household Income in Liberty County
Household Income Brackets in Liberty County
With 4,710 households falling in the category, the $50,000 to $74,999 income range is the most frequent in Liberty County, accounting for 20.5% of all households. In contrast, only 574 households (2.5%) fall into the $200,000+ income bracket, making it the least populous group.
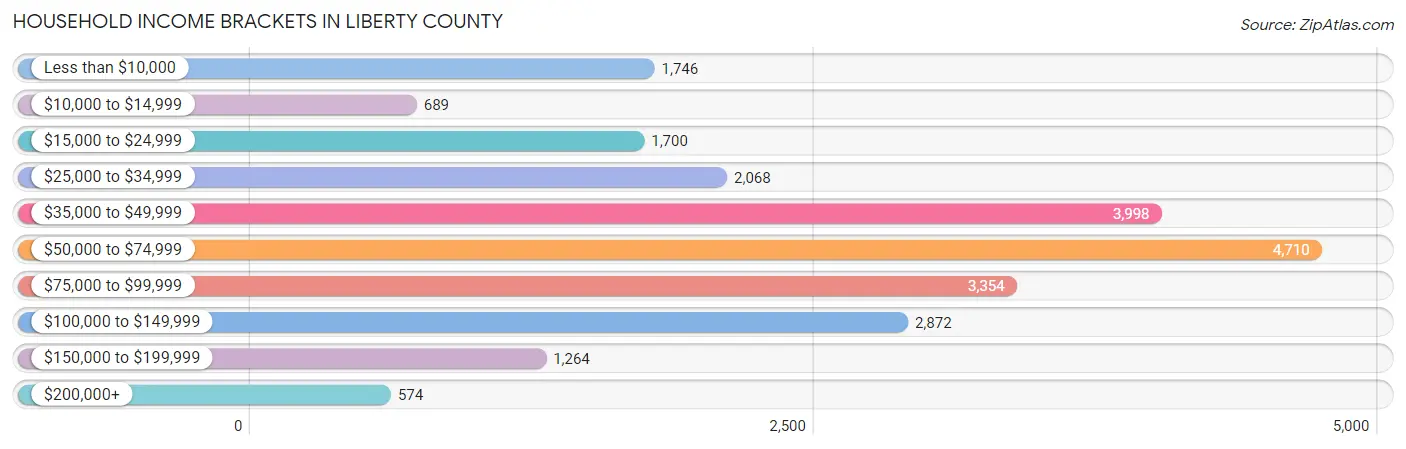
| Income Bracket | # Households | % Households |
| Less than $10,000 | 1,746 | 7.6% |
| $10,000 to $14,999 | 689 | 3.0% |
| $15,000 to $24,999 | 1,700 | 7.4% |
| $25,000 to $34,999 | 2,068 | 9.0% |
| $35,000 to $49,999 | 3,998 | 17.4% |
| $50,000 to $74,999 | 4,710 | 20.5% |
| $75,000 to $99,999 | 3,354 | 14.6% |
| $100,000 to $149,999 | 2,872 | 12.5% |
| $150,000 to $199,999 | 1,264 | 5.5% |
| $200,000+ | 574 | 2.5% |
Household Income by Householder Age in Liberty County
The median household income in Liberty County is $55,149, with the highest median household income of $70,033 found in the 45 to 64 years age bracket for the primary householder. A total of 6,471 households (28.2%) fall into this category. Meanwhile, the 15 to 24 years age bracket for the primary householder has the lowest median household income of $46,038, with 2,401 households (10.4%) in this group.
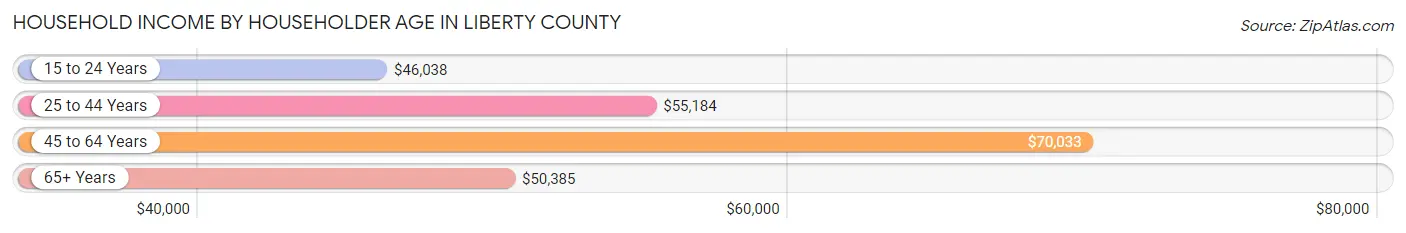
| Income Bracket | # Households | Median Income |
| 15 to 24 Years | 2,401 (10.4%) | $46,038 |
| 25 to 44 Years | 10,161 (44.2%) | $55,184 |
| 45 to 64 Years | 6,471 (28.2%) | $70,033 |
| 65+ Years | 3,942 (17.2%) | $50,385 |
| Total | 22,975 (100.0%) | $55,149 |
Poverty in Liberty County
Income Below Poverty by Sex and Age in Liberty County
With 12.1% poverty level for males and 18.7% for females among the residents of Liberty County, 5 year old males and 16 and 17 year old females are the most vulnerable to poverty, with 219 males (41.8%) and 199 females (30.6%) in their respective age groups living below the poverty level.
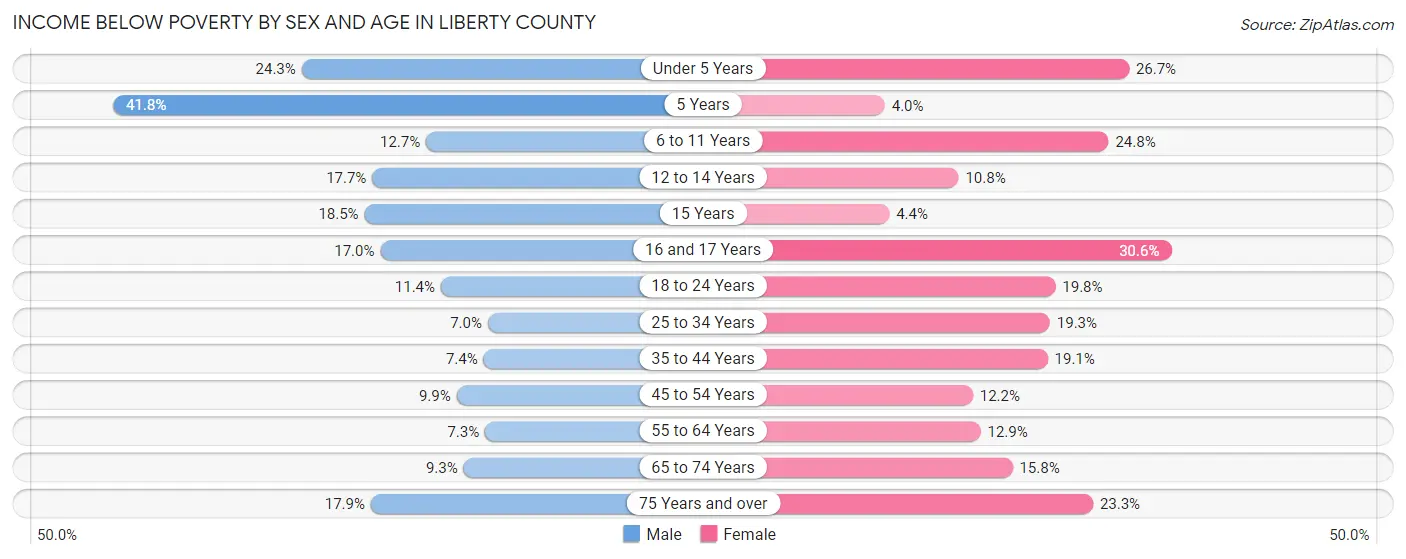
| Age Bracket | Male | Female |
| Under 5 Years | 792 (24.3%) | 812 (26.7%) |
| 5 Years | 219 (41.8%) | 15 (4.0%) |
| 6 to 11 Years | 365 (12.7%) | 756 (24.7%) |
| 12 to 14 Years | 240 (17.7%) | 123 (10.8%) |
| 15 Years | 36 (18.5%) | 21 (4.4%) |
| 16 and 17 Years | 148 (17.0%) | 199 (30.6%) |
| 18 to 24 Years | 539 (11.4%) | 713 (19.8%) |
| 25 to 34 Years | 443 (7.0%) | 1,119 (19.3%) |
| 35 to 44 Years | 274 (7.4%) | 684 (19.1%) |
| 45 to 54 Years | 260 (9.9%) | 350 (12.2%) |
| 55 to 64 Years | 191 (7.3%) | 407 (12.9%) |
| 65 to 74 Years | 173 (9.3%) | 339 (15.8%) |
| 75 Years and over | 161 (17.9%) | 297 (23.3%) |
| Total | 3,841 (12.1%) | 5,835 (18.7%) |
Income Above Poverty by Sex and Age in Liberty County
According to the poverty statistics in Liberty County, males aged 25 to 34 years and females aged 5 years are the age groups that are most secure financially, with 93.0% of males and 96.0% of females in these age groups living above the poverty line.
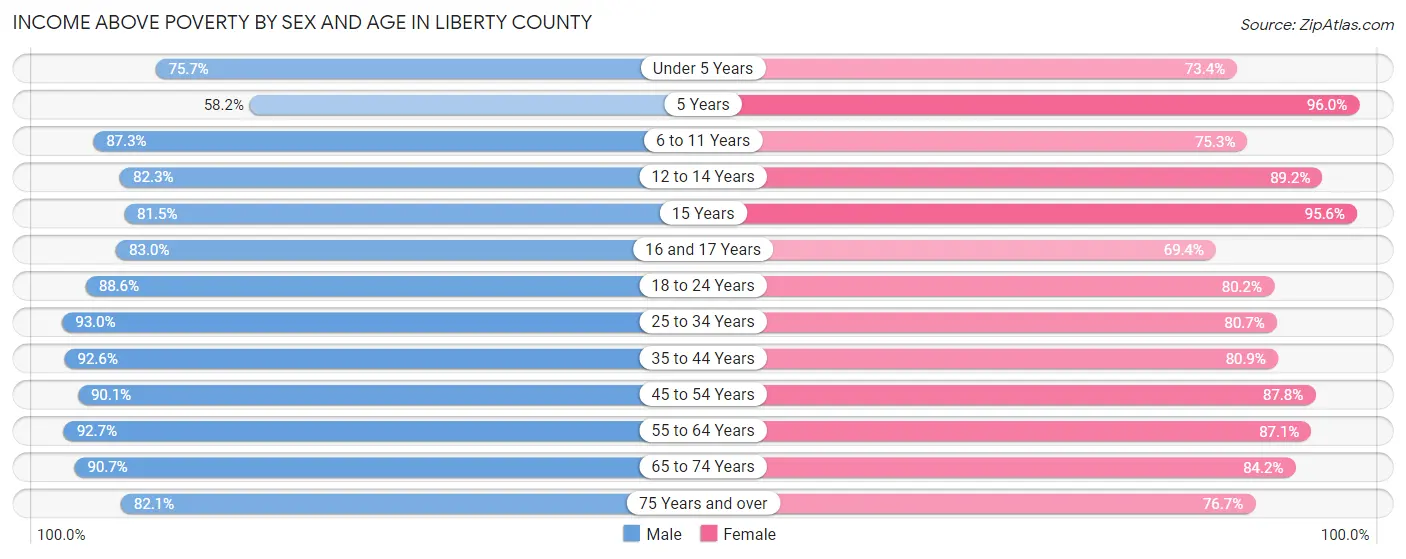
| Age Bracket | Male | Female |
| Under 5 Years | 2,469 (75.7%) | 2,235 (73.4%) |
| 5 Years | 305 (58.2%) | 361 (96.0%) |
| 6 to 11 Years | 2,501 (87.3%) | 2,299 (75.2%) |
| 12 to 14 Years | 1,113 (82.3%) | 1,013 (89.2%) |
| 15 Years | 159 (81.5%) | 456 (95.6%) |
| 16 and 17 Years | 723 (83.0%) | 452 (69.4%) |
| 18 to 24 Years | 4,201 (88.6%) | 2,884 (80.2%) |
| 25 to 34 Years | 5,875 (93.0%) | 4,675 (80.7%) |
| 35 to 44 Years | 3,424 (92.6%) | 2,898 (80.9%) |
| 45 to 54 Years | 2,364 (90.1%) | 2,528 (87.8%) |
| 55 to 64 Years | 2,436 (92.7%) | 2,752 (87.1%) |
| 65 to 74 Years | 1,695 (90.7%) | 1,801 (84.2%) |
| 75 Years and over | 740 (82.1%) | 977 (76.7%) |
| Total | 28,005 (87.9%) | 25,331 (81.3%) |
Income Below Poverty Among Married-Couple Families in Liberty County
The poverty statistics for married-couple families in Liberty County show that 6.0% or 614 of the total 10,268 families live below the poverty line. Families with 3 or 4 children have the highest poverty rate of 7.3%, comprising of 84 families. On the other hand, families with 5 or more children have the lowest poverty rate of 0.0%, which includes 0 families.
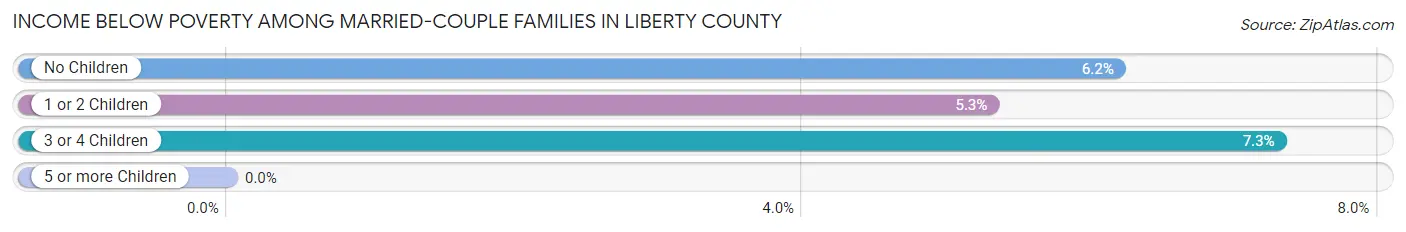
| Children | Above Poverty | Below Poverty |
| No Children | 5,494 (93.8%) | 362 (6.2%) |
| 1 or 2 Children | 3,001 (94.7%) | 168 (5.3%) |
| 3 or 4 Children | 1,066 (92.7%) | 84 (7.3%) |
| 5 or more Children | 93 (100.0%) | 0 (0.0%) |
| Total | 9,654 (94.0%) | 614 (6.0%) |
Income Below Poverty Among Single-Parent Households in Liberty County
According to the poverty data in Liberty County, 5.1% or 58 single-father households and 38.1% or 1,693 single-mother households are living below the poverty line. Among single-father households, those with 1 or 2 children have the highest poverty rate, with 39 households (6.6%) experiencing poverty. Likewise, among single-mother households, those with 5 or more children have the highest poverty rate, with 13 households (100.0%) falling below the poverty line.
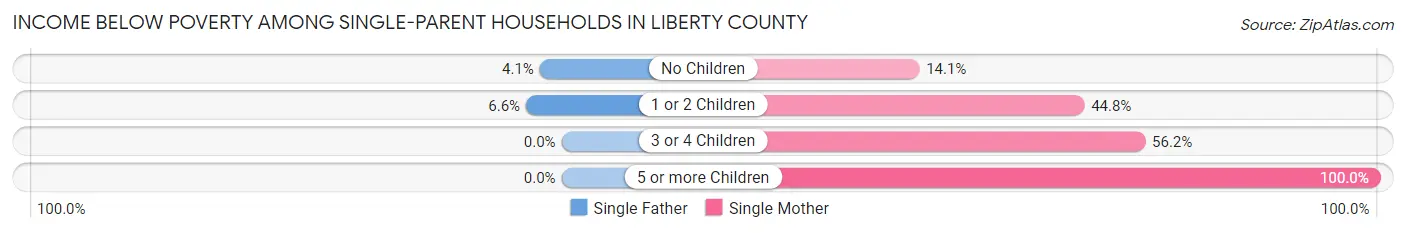
| Children | Single Father | Single Mother |
| No Children | 19 (4.1%) | 161 (14.1%) |
| 1 or 2 Children | 39 (6.6%) | 1,300 (44.8%) |
| 3 or 4 Children | 0 (0.0%) | 219 (56.1%) |
| 5 or more Children | 0 (0.0%) | 13 (100.0%) |
| Total | 58 (5.1%) | 1,693 (38.1%) |
Income Below Poverty Among Married-Couple vs Single-Parent Households in Liberty County
The poverty data for Liberty County shows that 614 of the married-couple family households (6.0%) and 1,751 of the single-parent households (31.3%) are living below the poverty level. Within the married-couple family households, those with 3 or 4 children have the highest poverty rate, with 84 households (7.3%) falling below the poverty line. Among the single-parent households, those with 3 or 4 children have the highest poverty rate, with 219 household (52.4%) living below poverty.
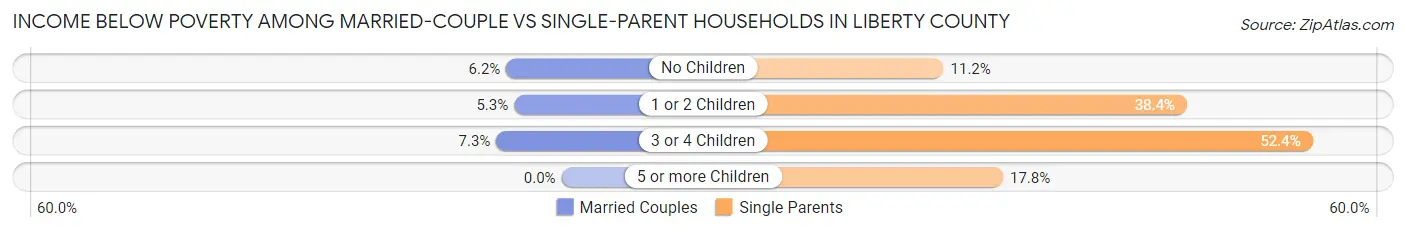
| Children | Married-Couple Families | Single-Parent Households |
| No Children | 362 (6.2%) | 180 (11.2%) |
| 1 or 2 Children | 168 (5.3%) | 1,339 (38.4%) |
| 3 or 4 Children | 84 (7.3%) | 219 (52.4%) |
| 5 or more Children | 0 (0.0%) | 13 (17.8%) |
| Total | 614 (6.0%) | 1,751 (31.3%) |
Race in Liberty County
The most populous races in Liberty County are White / Caucasian (26,965 | 41.1%), Black / African American (26,952 | 41.1%), and Hispanic or Latino (8,300 | 12.7%).
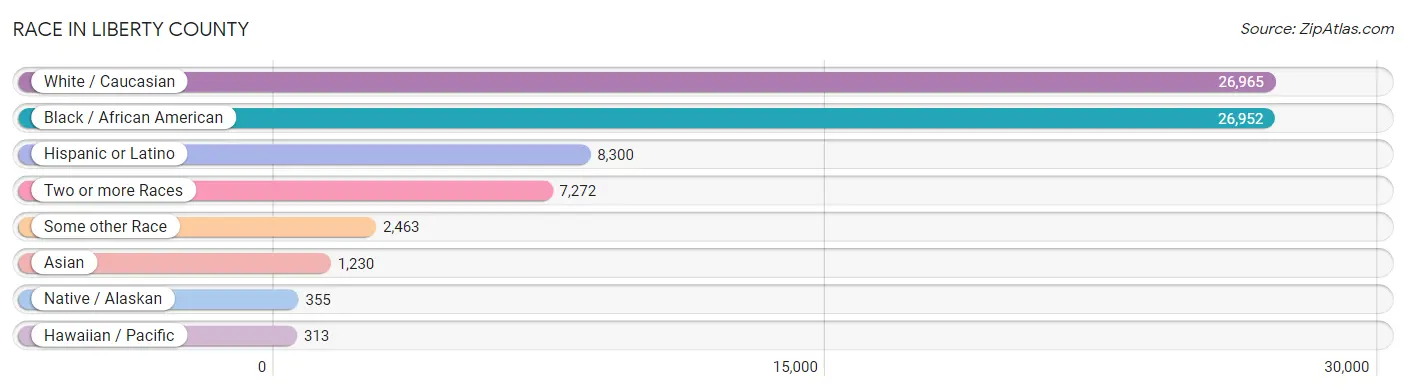
| Race | # Population | % Population |
| Asian | 1,230 | 1.9% |
| Black / African American | 26,952 | 41.1% |
| Hawaiian / Pacific | 313 | 0.5% |
| Hispanic or Latino | 8,300 | 12.7% |
| Native / Alaskan | 355 | 0.5% |
| White / Caucasian | 26,965 | 41.1% |
| Two or more Races | 7,272 | 11.1% |
| Some other Race | 2,463 | 3.8% |
| Total | 65,550 | 100.0% |
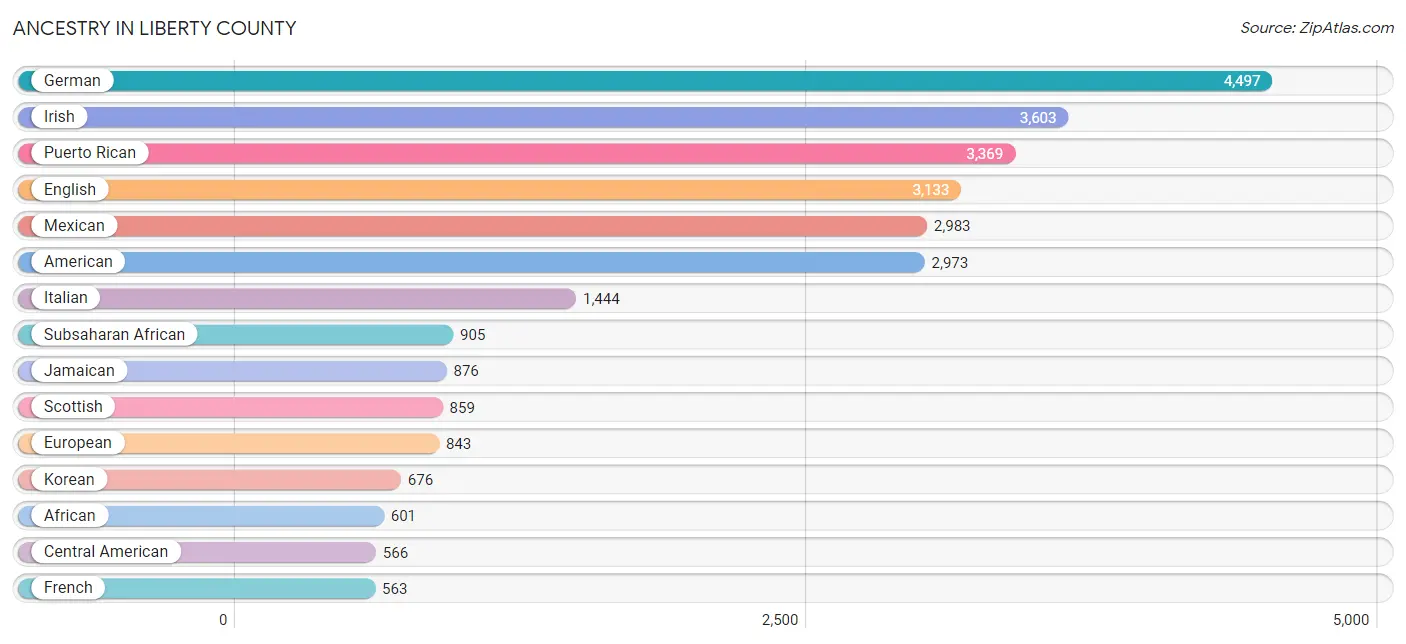
Ancestry in Liberty County
The most populous ancestries reported in Liberty County are German (4,497 | 6.9%), Irish (3,603 | 5.5%), Puerto Rican (3,369 | 5.1%), English (3,133 | 4.8%), and Mexican (2,983 | 4.5%), together accounting for 26.8% of all Liberty County residents.
| Ancestry | # Population | % Population |
| African | 601 | 0.9% |
| American | 2,973 | 4.5% |
| Apache | 3 | 0.0% |
| Arab | 105 | 0.2% |
| Argentinean | 7 | 0.0% |
| Armenian | 3 | 0.0% |
| Austrian | 36 | 0.1% |
| Bahamian | 88 | 0.1% |
| Barbadian | 21 | 0.0% |
| Bhutanese | 193 | 0.3% |
| Blackfeet | 18 | 0.0% |
| British | 301 | 0.5% |
| Burmese | 412 | 0.6% |
| Canadian | 27 | 0.0% |
| Celtic | 4 | 0.0% |
| Central American | 566 | 0.9% |
| Central American Indian | 308 | 0.5% |
| Cherokee | 365 | 0.6% |
| Chickasaw | 29 | 0.0% |
| Choctaw | 21 | 0.0% |
| Colombian | 110 | 0.2% |
| Cuban | 440 | 0.7% |
| Czech | 123 | 0.2% |
| Czechoslovakian | 6 | 0.0% |
| Danish | 56 | 0.1% |
| Dominican | 480 | 0.7% |
| Dutch | 146 | 0.2% |
| Eastern European | 79 | 0.1% |
| Ecuadorian | 36 | 0.1% |
| Egyptian | 10 | 0.0% |
| English | 3,133 | 4.8% |
| European | 843 | 1.3% |
| Finnish | 109 | 0.2% |
| French | 563 | 0.9% |
| French American Indian | 6 | 0.0% |
| French Canadian | 178 | 0.3% |
| German | 4,497 | 6.9% |
| German Russian | 85 | 0.1% |
| Ghanaian | 137 | 0.2% |
| Greek | 161 | 0.3% |
| Guamanian / Chamorro | 140 | 0.2% |
| Guatemalan | 131 | 0.2% |
| Guyanese | 19 | 0.0% |
| Haitian | 154 | 0.2% |
| Honduran | 142 | 0.2% |
| Hungarian | 83 | 0.1% |
| Indian (Asian) | 97 | 0.2% |
| Iranian | 24 | 0.0% |
| Irish | 3,603 | 5.5% |
| Iroquois | 45 | 0.1% |
| Israeli | 73 | 0.1% |
| Italian | 1,444 | 2.2% |
| Jamaican | 876 | 1.3% |
| Korean | 676 | 1.0% |
| Laotian | 1 | 0.0% |
| Lebanese | 10 | 0.0% |
| Lithuanian | 32 | 0.1% |
| Mexican | 2,983 | 4.5% |
| Moroccan | 10 | 0.0% |
| Native Hawaiian | 253 | 0.4% |
| Navajo | 140 | 0.2% |
| Nicaraguan | 50 | 0.1% |
| Nigerian | 127 | 0.2% |
| Northern European | 11 | 0.0% |
| Norwegian | 157 | 0.2% |
| Panamanian | 131 | 0.2% |
| Peruvian | 33 | 0.1% |
| Polish | 530 | 0.8% |
| Portuguese | 82 | 0.1% |
| Potawatomi | 35 | 0.1% |
| Puerto Rican | 3,369 | 5.1% |
| Romanian | 8 | 0.0% |
| Russian | 35 | 0.1% |
| Salvadoran | 112 | 0.2% |
| Samoan | 48 | 0.1% |
| Scandinavian | 120 | 0.2% |
| Scotch-Irish | 231 | 0.4% |
| Scottish | 859 | 1.3% |
| Seminole | 13 | 0.0% |
| Sioux | 4 | 0.0% |
| Slavic | 9 | 0.0% |
| South American | 221 | 0.3% |
| South American Indian | 26 | 0.0% |
| Spaniard | 103 | 0.2% |
| Spanish | 23 | 0.0% |
| Sri Lankan | 247 | 0.4% |
| Subsaharan African | 905 | 1.4% |
| Sudanese | 5 | 0.0% |
| Swedish | 228 | 0.4% |
| Swiss | 88 | 0.1% |
| Syrian | 69 | 0.1% |
| Thai | 332 | 0.5% |
| Trinidadian and Tobagonian | 9 | 0.0% |
| Turkish | 33 | 0.1% |
| U.S. Virgin Islander | 14 | 0.0% |
| Vietnamese | 11 | 0.0% |
| Welsh | 30 | 0.1% |
| West Indian | 279 | 0.4% |
| Yugoslavian | 65 | 0.1% | View All 99 Rows |
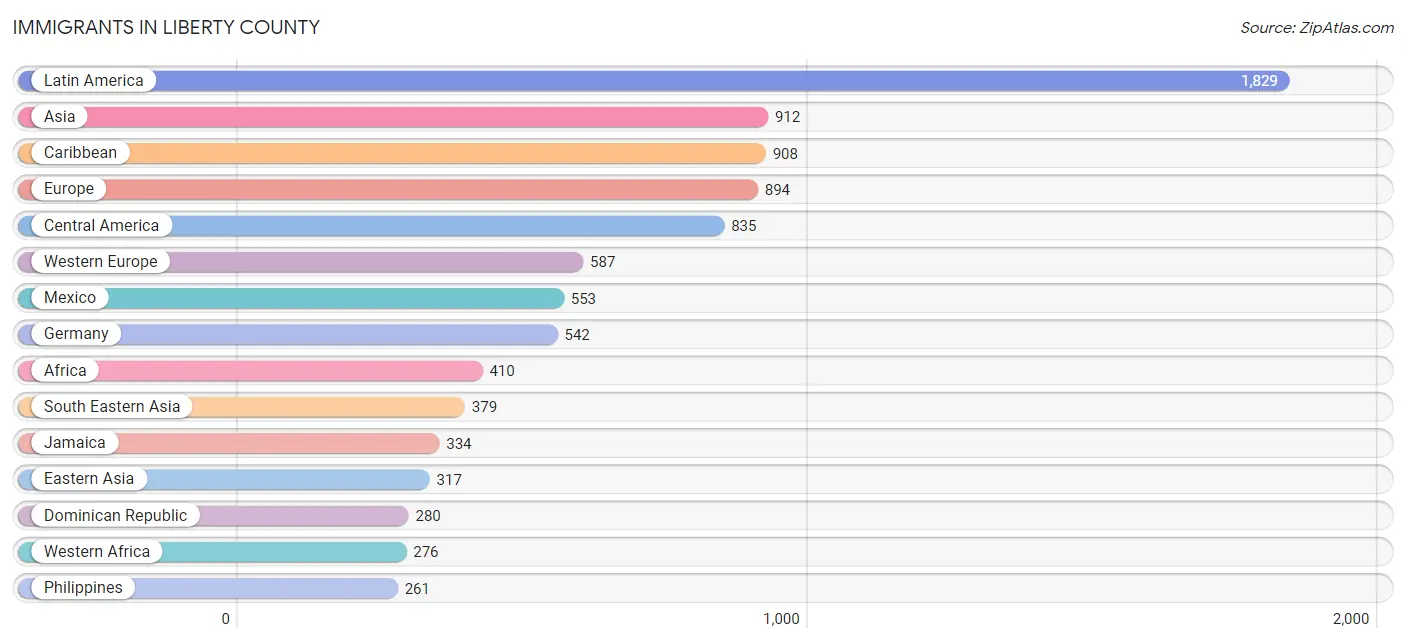
Immigrants in Liberty County
The most numerous immigrant groups reported in Liberty County came from Latin America (1,829 | 2.8%), Asia (912 | 1.4%), Caribbean (908 | 1.4%), Europe (894 | 1.4%), and Central America (835 | 1.3%), together accounting for 8.2% of all Liberty County residents.
| Immigration Origin | # Population | % Population |
| Africa | 410 | 0.6% |
| Asia | 912 | 1.4% |
| Bahamas | 129 | 0.2% |
| Barbados | 35 | 0.1% |
| Canada | 69 | 0.1% |
| Caribbean | 908 | 1.4% |
| Central America | 835 | 1.3% |
| China | 42 | 0.1% |
| Colombia | 17 | 0.0% |
| Costa Rica | 3 | 0.0% |
| Cuba | 29 | 0.0% |
| Czechoslovakia | 11 | 0.0% |
| Dominica | 22 | 0.0% |
| Dominican Republic | 280 | 0.4% |
| Eastern Africa | 50 | 0.1% |
| Eastern Asia | 317 | 0.5% |
| Eastern Europe | 14 | 0.0% |
| Ecuador | 32 | 0.1% |
| Egypt | 10 | 0.0% |
| El Salvador | 29 | 0.0% |
| England | 121 | 0.2% |
| Europe | 894 | 1.4% |
| France | 26 | 0.0% |
| Germany | 542 | 0.8% |
| Ghana | 249 | 0.4% |
| Guatemala | 91 | 0.1% |
| Guyana | 7 | 0.0% |
| Haiti | 45 | 0.1% |
| Honduras | 40 | 0.1% |
| India | 158 | 0.2% |
| Indonesia | 1 | 0.0% |
| Iran | 12 | 0.0% |
| Italy | 113 | 0.2% |
| Jamaica | 334 | 0.5% |
| Japan | 41 | 0.1% |
| Kenya | 42 | 0.1% |
| Korea | 234 | 0.4% |
| Latin America | 1,829 | 2.8% |
| Mexico | 553 | 0.8% |
| Micronesia | 194 | 0.3% |
| Netherlands | 19 | 0.0% |
| Nicaragua | 22 | 0.0% |
| Nigeria | 17 | 0.0% |
| Northern Africa | 15 | 0.0% |
| Northern Europe | 180 | 0.3% |
| Oceania | 218 | 0.3% |
| Pakistan | 37 | 0.1% |
| Panama | 97 | 0.2% |
| Peru | 30 | 0.1% |
| Philippines | 261 | 0.4% |
| Russia | 3 | 0.0% |
| South America | 86 | 0.1% |
| South Central Asia | 216 | 0.3% |
| South Eastern Asia | 379 | 0.6% |
| Southern Europe | 113 | 0.2% |
| Sudan | 5 | 0.0% |
| Taiwan | 11 | 0.0% |
| Thailand | 2 | 0.0% |
| Trinidad and Tobago | 9 | 0.0% |
| Uzbekistan | 9 | 0.0% |
| Vietnam | 115 | 0.2% |
| Western Africa | 276 | 0.4% |
| Western Europe | 587 | 0.9% | View All 63 Rows |
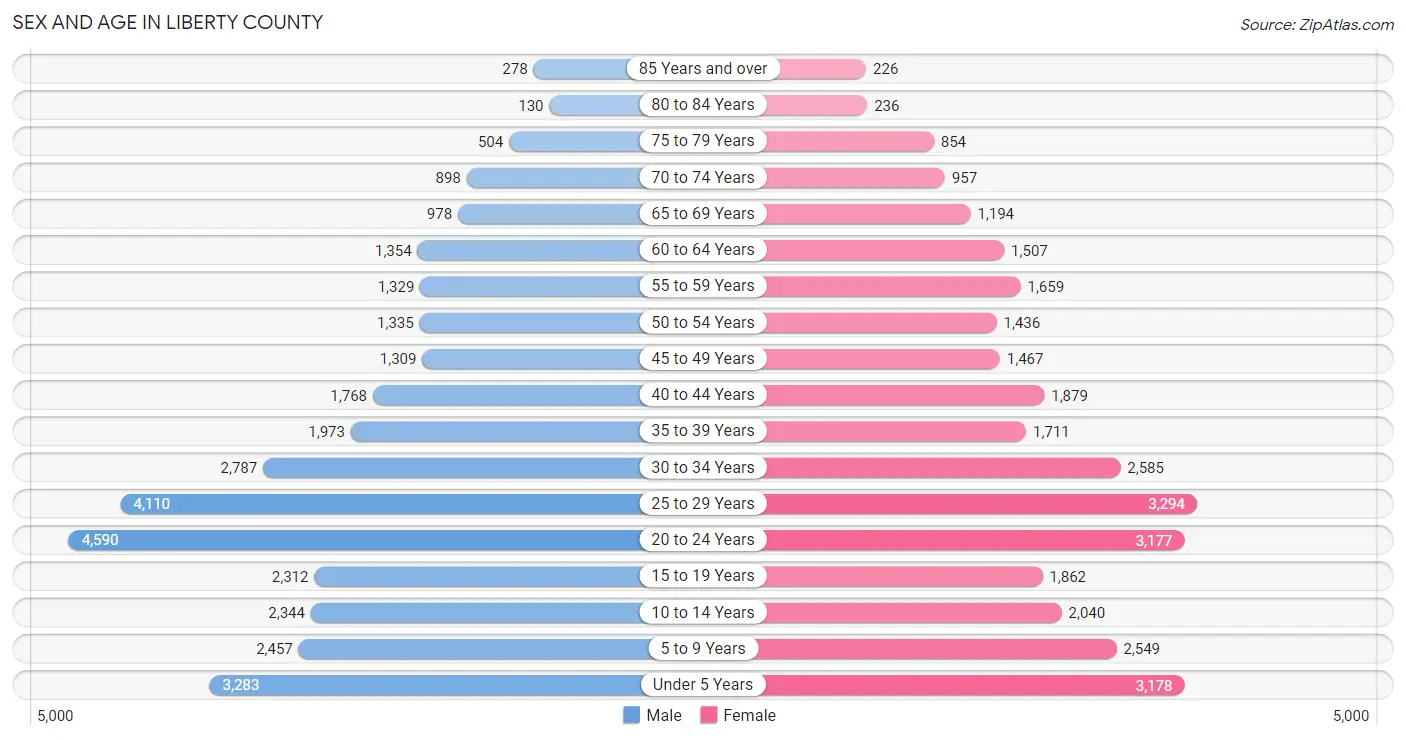
Sex and Age in Liberty County
Sex and Age in Liberty County
The most populous age groups in Liberty County are 20 to 24 Years (4,590 | 13.6%) for men and 25 to 29 Years (3,294 | 10.3%) for women.
| Age Bracket | Male | Female |
| Under 5 Years | 3,283 (9.7%) | 3,178 (10.0%) |
| 5 to 9 Years | 2,457 (7.3%) | 2,549 (8.0%) |
| 10 to 14 Years | 2,344 (7.0%) | 2,040 (6.4%) |
| 15 to 19 Years | 2,312 (6.9%) | 1,862 (5.9%) |
| 20 to 24 Years | 4,590 (13.6%) | 3,177 (10.0%) |
| 25 to 29 Years | 4,110 (12.2%) | 3,294 (10.3%) |
| 30 to 34 Years | 2,787 (8.3%) | 2,585 (8.1%) |
| 35 to 39 Years | 1,973 (5.9%) | 1,711 (5.4%) |
| 40 to 44 Years | 1,768 (5.2%) | 1,879 (5.9%) |
| 45 to 49 Years | 1,309 (3.9%) | 1,467 (4.6%) |
| 50 to 54 Years | 1,335 (4.0%) | 1,436 (4.5%) |
| 55 to 59 Years | 1,329 (3.9%) | 1,659 (5.2%) |
| 60 to 64 Years | 1,354 (4.0%) | 1,507 (4.7%) |
| 65 to 69 Years | 978 (2.9%) | 1,194 (3.7%) |
| 70 to 74 Years | 898 (2.7%) | 957 (3.0%) |
| 75 to 79 Years | 504 (1.5%) | 854 (2.7%) |
| 80 to 84 Years | 130 (0.4%) | 236 (0.7%) |
| 85 Years and over | 278 (0.8%) | 226 (0.7%) |
| Total | 33,739 (100.0%) | 31,811 (100.0%) |
Families and Households in Liberty County
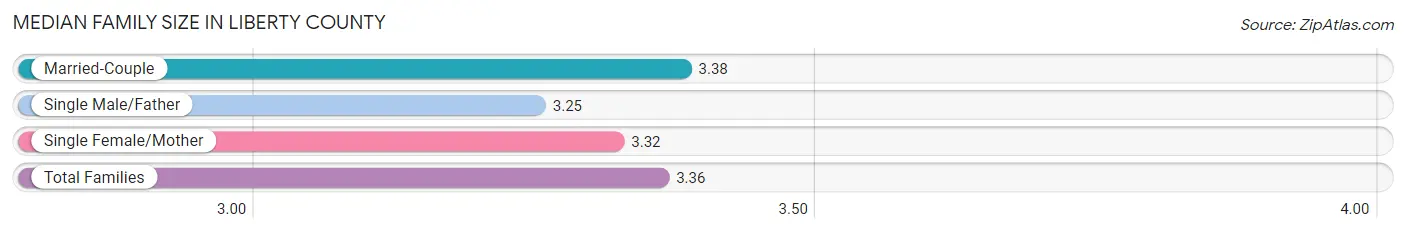
Median Family Size in Liberty County
The median family size in Liberty County is 3.36 persons per family, with married-couple families (10,268 | 64.7%) accounting for the largest median family size of 3.38 persons per family. On the other hand, single male/father families (1,145 | 7.2%) represent the smallest median family size with 3.25 persons per family.
| Family Type | # Families | Family Size |
| Married-Couple | 10,268 (64.7%) | 3.38 |
| Single Male/Father | 1,145 (7.2%) | 3.25 |
| Single Female/Mother | 4,449 (28.1%) | 3.32 |
| Total Families | 15,862 (100.0%) | 3.36 |
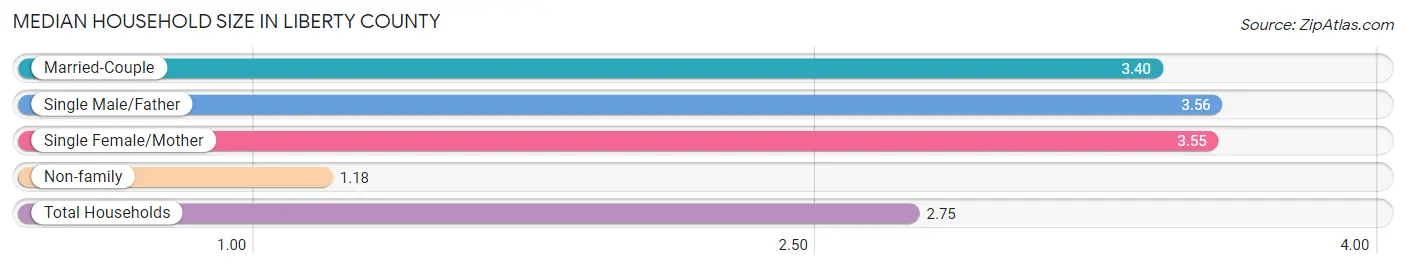
Median Household Size in Liberty County
The median household size in Liberty County is 2.75 persons per household, with single male/father households (1,145 | 5.0%) accounting for the largest median household size of 3.56 persons per household. non-family households (7,113 | 31.0%) represent the smallest median household size with 1.18 persons per household.
| Household Type | # Households | Household Size |
| Married-Couple | 10,268 (44.7%) | 3.40 |
| Single Male/Father | 1,145 (5.0%) | 3.56 |
| Single Female/Mother | 4,449 (19.4%) | 3.55 |
| Non-family | 7,113 (31.0%) | 1.18 |
| Total Households | 22,975 (100.0%) | 2.75 |
Household Size by Marriage Status in Liberty County
Out of a total of 22,975 households in Liberty County, 15,862 (69.0%) are family households, while 7,113 (31.0%) are nonfamily households. The most numerous type of family households are 2-person households, comprising 6,890, and the most common type of nonfamily households are 1-person households, comprising 6,074.
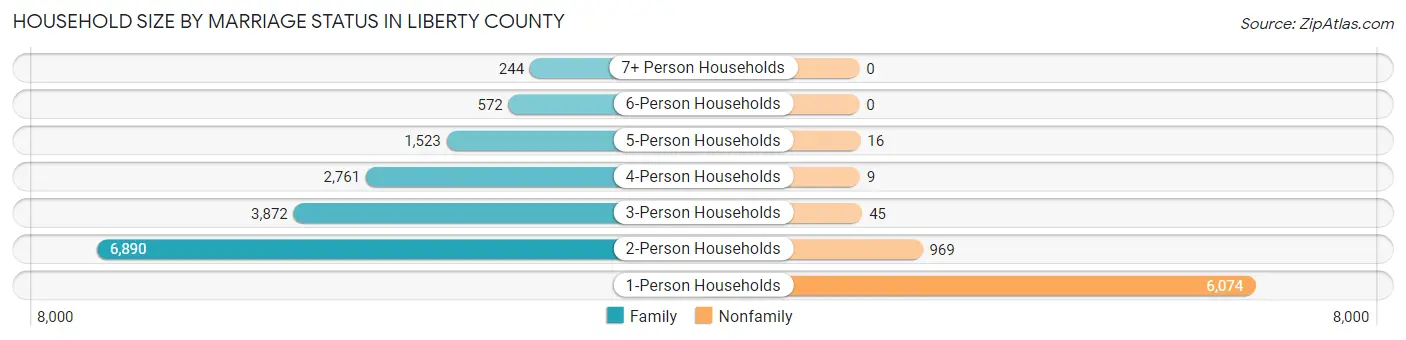
| Household Size | Family Households | Nonfamily Households |
| 1-Person Households | - | 6,074 (26.4%) |
| 2-Person Households | 6,890 (30.0%) | 969 (4.2%) |
| 3-Person Households | 3,872 (16.9%) | 45 (0.2%) |
| 4-Person Households | 2,761 (12.0%) | 9 (0.0%) |
| 5-Person Households | 1,523 (6.6%) | 16 (0.1%) |
| 6-Person Households | 572 (2.5%) | 0 (0.0%) |
| 7+ Person Households | 244 (1.1%) | 0 (0.0%) |
| Total | 15,862 (69.0%) | 7,113 (31.0%) |
Female Fertility in Liberty County
Fertility by Age in Liberty County
Average fertility rate in Liberty County is 103.0 births per 1,000 women. Women in the age bracket of 20 to 34 years have the highest fertility rate with 166.0 births per 1,000 women. Women in the age bracket of 20 to 34 years acount for 90.5% of all women with births.
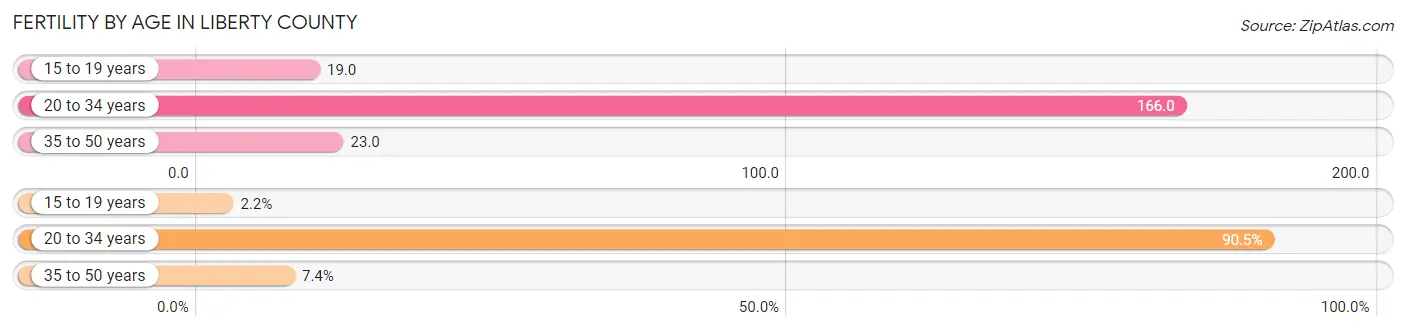
| Age Bracket | Women with Births | Births / 1,000 Women |
| 15 to 19 years | 36 (2.2%) | 19.0 |
| 20 to 34 years | 1,507 (90.5%) | 166.0 |
| 35 to 50 years | 123 (7.4%) | 23.0 |
| Total | 1,666 (100.0%) | 103.0 |
Fertility by Age by Marriage Status in Liberty County
56.2% of women with births (1,666) in Liberty County are married. The highest percentage of unmarried women with births falls into 15 to 19 years age bracket with 91.7% of them unmarried at the time of birth, while the lowest percentage of unmarried women with births belong to 35 to 50 years age bracket with 36.6% of them unmarried.
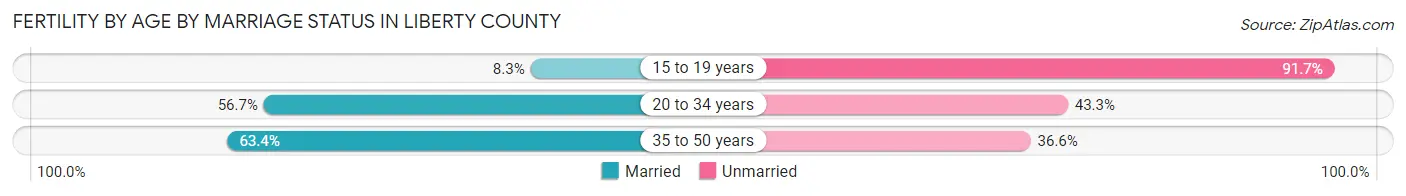
| Age Bracket | Married | Unmarried |
| 15 to 19 years | 3 (8.3%) | 33 (91.7%) |
| 20 to 34 years | 854 (56.7%) | 653 (43.3%) |
| 35 to 50 years | 78 (63.4%) | 45 (36.6%) |
| Total | 936 (56.2%) | 730 (43.8%) |
Fertility by Education in Liberty County
Average fertility rate in Liberty County is 103.0 births per 1,000 women. Women with the education attainment of high school diploma have the highest fertility rate of 141.0 births per 1,000 women, while women with the education attainment of less than high school have the lowest fertility at 29.0 births per 1,000 women. Women with the education attainment of college or associate's degree represent 40.9% of all women with births.
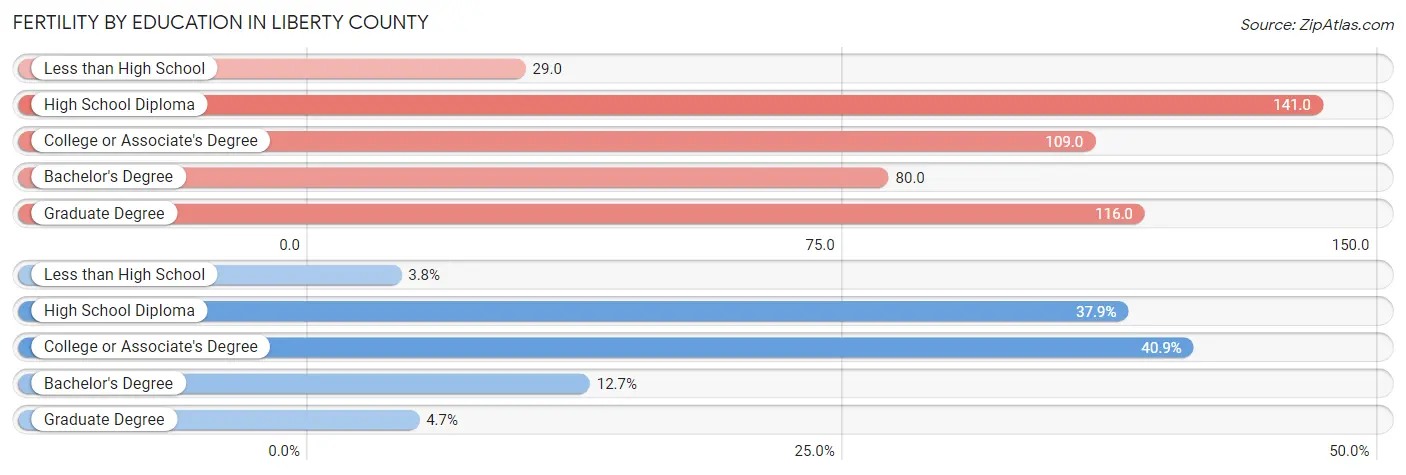
| Educational Attainment | Women with Births | Births / 1,000 Women |
| Less than High School | 64 (3.8%) | 29.0 |
| High School Diploma | 631 (37.9%) | 141.0 |
| College or Associate's Degree | 682 (40.9%) | 109.0 |
| Bachelor's Degree | 211 (12.7%) | 80.0 |
| Graduate Degree | 78 (4.7%) | 116.0 |
| Total | 1,666 (100.0%) | 103.0 |
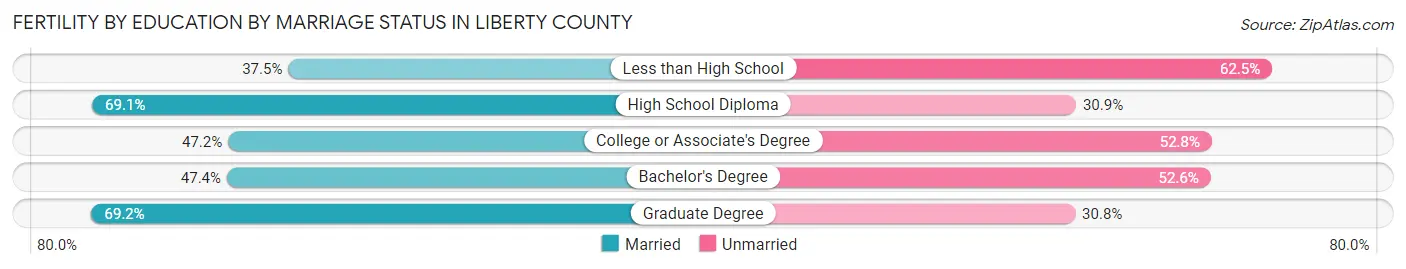
Fertility by Education by Marriage Status in Liberty County
43.8% of women with births in Liberty County are unmarried. Women with the educational attainment of graduate degree are most likely to be married with 69.2% of them married at childbirth, while women with the educational attainment of less than high school are least likely to be married with 62.5% of them unmarried at childbirth.
| Educational Attainment | Married | Unmarried |
| Less than High School | 24 (37.5%) | 40 (62.5%) |
| High School Diploma | 436 (69.1%) | 195 (30.9%) |
| College or Associate's Degree | 322 (47.2%) | 360 (52.8%) |
| Bachelor's Degree | 100 (47.4%) | 111 (52.6%) |
| Graduate Degree | 54 (69.2%) | 24 (30.8%) |
| Total | 936 (56.2%) | 730 (43.8%) |
Employment Characteristics in Liberty County
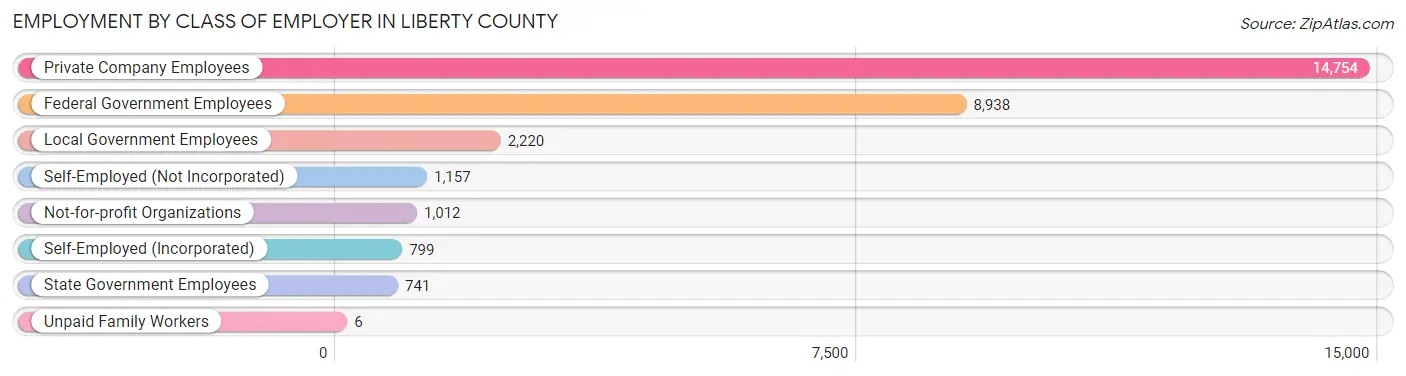
Employment by Class of Employer in Liberty County
Among the 29,627 employed individuals in Liberty County, private company employees (14,754 | 49.8%), federal government employees (8,938 | 30.2%), and local government employees (2,220 | 7.5%) make up the most common classes of employment.
| Employer Class | # Employees | % Employees |
| Private Company Employees | 14,754 | 49.8% |
| Self-Employed (Incorporated) | 799 | 2.7% |
| Self-Employed (Not Incorporated) | 1,157 | 3.9% |
| Not-for-profit Organizations | 1,012 | 3.4% |
| Local Government Employees | 2,220 | 7.5% |
| State Government Employees | 741 | 2.5% |
| Federal Government Employees | 8,938 | 30.2% |
| Unpaid Family Workers | 6 | 0.0% |
| Total | 29,627 | 100.0% |
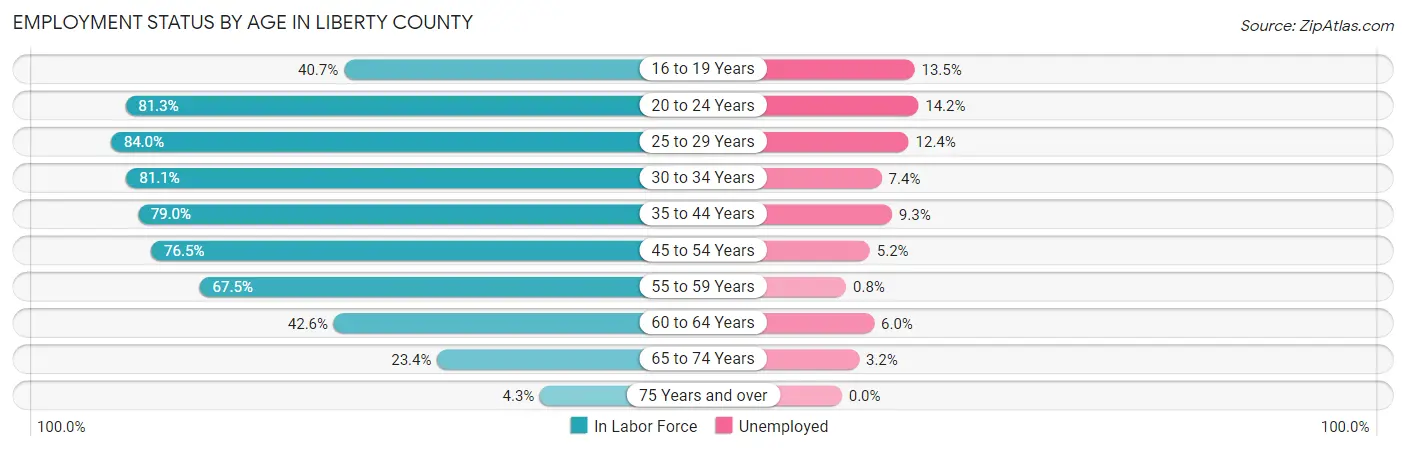
Employment Status by Age in Liberty County
According to the labor force statistics for Liberty County, out of the total population over 16 years of age (49,026), 66.6% or 32,651 individuals are in the labor force, with 8.7% or 2,841 of them unemployed. The age group with the highest labor force participation rate is 25 to 29 years, with 84.0% or 6,219 individuals in the labor force. Within the labor force, the 20 to 24 years age range has the highest percentage of unemployed individuals, with 14.2% or 897 of them being unemployed.
| Age Bracket | In Labor Force | Unemployed |
| 16 to 19 Years | 1,425 (40.7%) | 192 (13.5%) |
| 20 to 24 Years | 6,315 (81.3%) | 897 (14.2%) |
| 25 to 29 Years | 6,219 (84.0%) | 771 (12.4%) |
| 30 to 34 Years | 4,357 (81.1%) | 322 (7.4%) |
| 35 to 44 Years | 5,791 (79.0%) | 539 (9.3%) |
| 45 to 54 Years | 4,243 (76.5%) | 221 (5.2%) |
| 55 to 59 Years | 2,017 (67.5%) | 16 (0.8%) |
| 60 to 64 Years | 1,219 (42.6%) | 73 (6.0%) |
| 65 to 74 Years | 942 (23.4%) | 30 (3.2%) |
| 75 Years and over | 96 (4.3%) | 0 (0.0%) |
| Total | 32,651 (66.6%) | 2,841 (8.7%) |
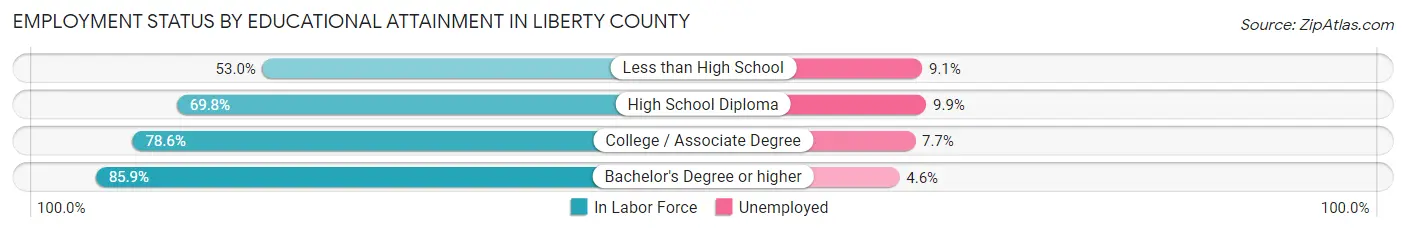
Employment Status by Educational Attainment in Liberty County
According to labor force statistics for Liberty County, 75.7% of individuals (23,848) out of the total population between 25 and 64 years of age (31,503) are in the labor force, with 7.7% or 1,836 of them being unemployed. The group with the highest labor force participation rate are those with the educational attainment of bachelor's degree or higher, with 85.9% or 5,575 individuals in the labor force. Within the labor force, individuals with high school diploma education have the highest percentage of unemployment, with 9.9% or 672 of them being unemployed.
| Educational Attainment | In Labor Force | Unemployed |
| Less than High School | 1,081 (53.0%) | 186 (9.1%) |
| High School Diploma | 6,787 (69.8%) | 963 (9.9%) |
| College / Associate Degree | 10,415 (78.6%) | 1,020 (7.7%) |
| Bachelor's Degree or higher | 5,575 (85.9%) | 299 (4.6%) |
| Total | 23,848 (75.7%) | 2,426 (7.7%) |
Employment Occupations by Sex in Liberty County
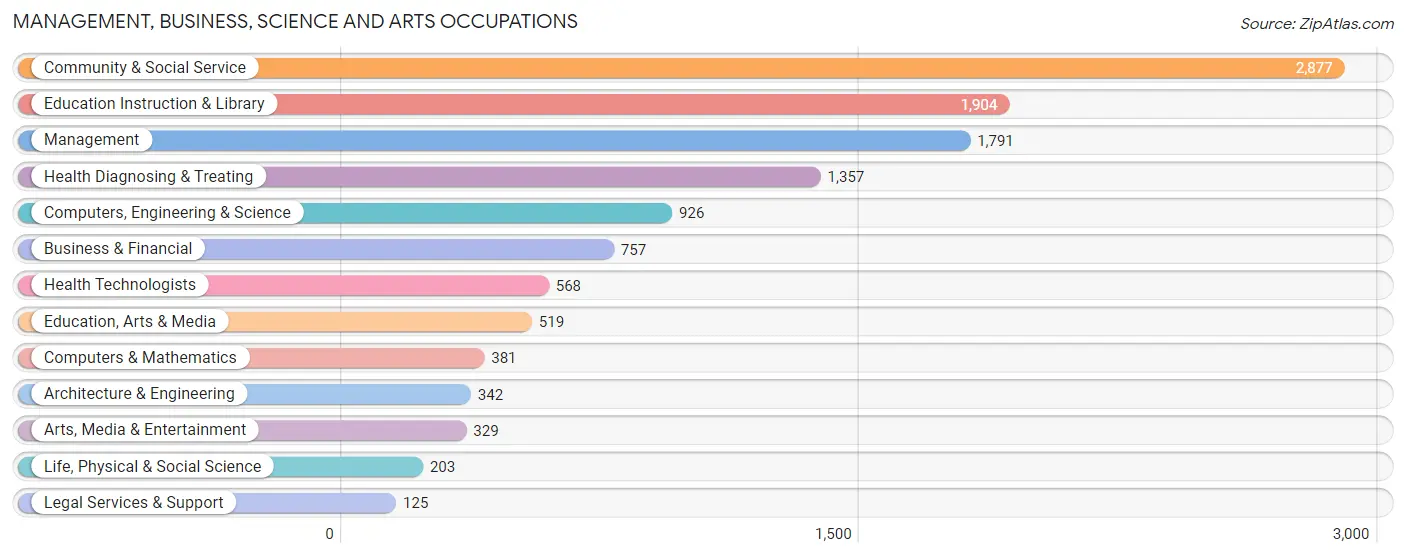
Management, Business, Science and Arts Occupations
The most common Management, Business, Science and Arts occupations in Liberty County are Community & Social Service (2,877 | 12.1%), Education Instruction & Library (1,904 | 8.0%), Management (1,791 | 7.6%), Health Diagnosing & Treating (1,357 | 5.7%), and Computers, Engineering & Science (926 | 3.9%).
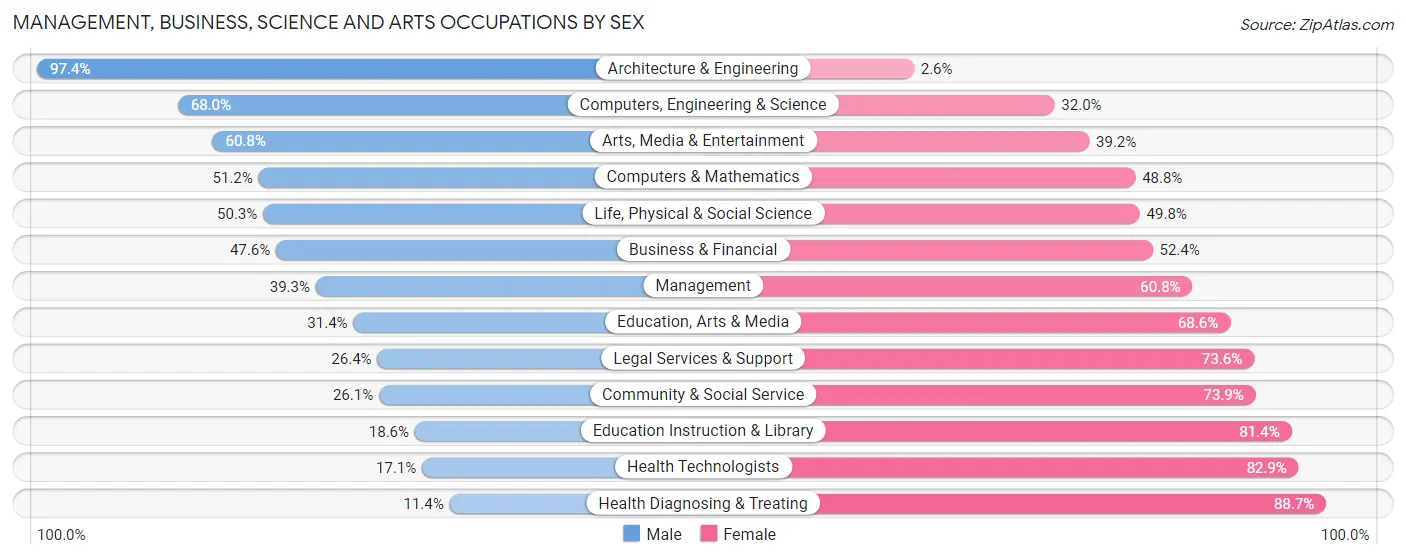
Management, Business, Science and Arts Occupations by Sex
Within the Management, Business, Science and Arts occupations in Liberty County, the most male-oriented occupations are Architecture & Engineering (97.4%), Computers, Engineering & Science (68.0%), and Arts, Media & Entertainment (60.8%), while the most female-oriented occupations are Health Diagnosing & Treating (88.6%), Health Technologists (82.9%), and Education Instruction & Library (81.4%).
| Occupation | Male | Female |
| Management | 703 (39.3%) | 1,088 (60.8%) |
| Business & Financial | 360 (47.6%) | 397 (52.4%) |
| Computers, Engineering & Science | 630 (68.0%) | 296 (32.0%) |
| Computers & Mathematics | 195 (51.2%) | 186 (48.8%) |
| Architecture & Engineering | 333 (97.4%) | 9 (2.6%) |
| Life, Physical & Social Science | 102 (50.2%) | 101 (49.7%) |
| Community & Social Service | 750 (26.1%) | 2,127 (73.9%) |
| Education, Arts & Media | 163 (31.4%) | 356 (68.6%) |
| Legal Services & Support | 33 (26.4%) | 92 (73.6%) |
| Education Instruction & Library | 354 (18.6%) | 1,550 (81.4%) |
| Arts, Media & Entertainment | 200 (60.8%) | 129 (39.2%) |
| Health Diagnosing & Treating | 154 (11.4%) | 1,203 (88.6%) |
| Health Technologists | 97 (17.1%) | 471 (82.9%) |
| Total (Category) | 2,597 (33.7%) | 5,111 (66.3%) |
| Total (Overall) | 12,024 (50.8%) | 11,661 (49.2%) |
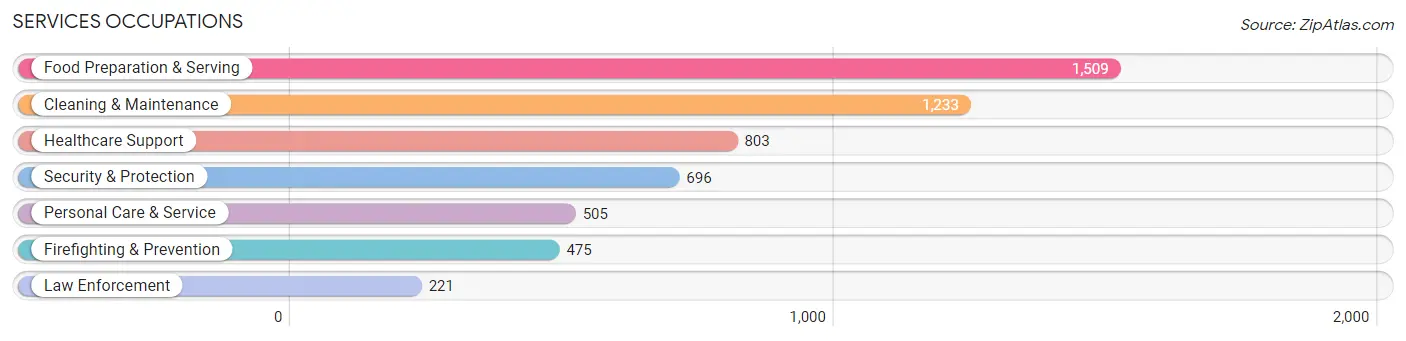
Services Occupations
The most common Services occupations in Liberty County are Food Preparation & Serving (1,509 | 6.4%), Cleaning & Maintenance (1,233 | 5.2%), Healthcare Support (803 | 3.4%), Security & Protection (696 | 2.9%), and Personal Care & Service (505 | 2.1%).
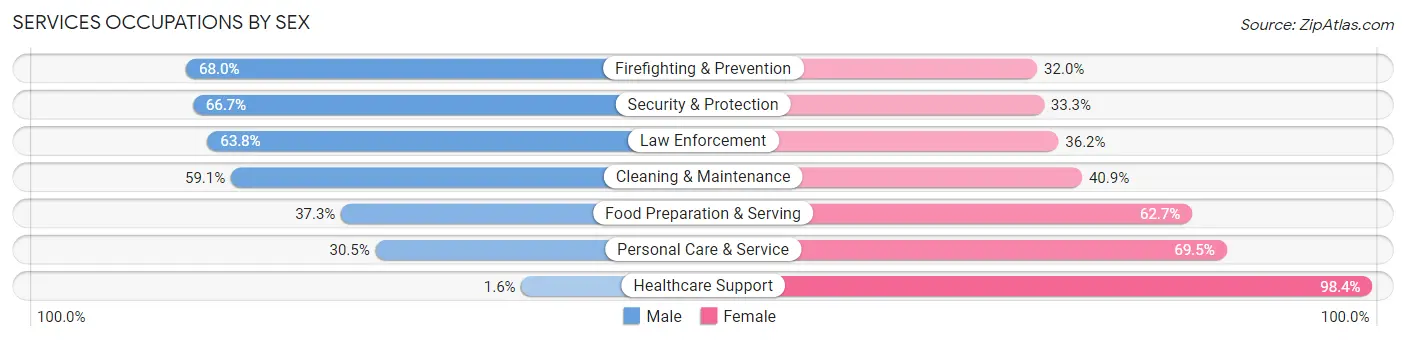
Services Occupations by Sex
Within the Services occupations in Liberty County, the most male-oriented occupations are Firefighting & Prevention (68.0%), Security & Protection (66.7%), and Law Enforcement (63.8%), while the most female-oriented occupations are Healthcare Support (98.4%), Personal Care & Service (69.5%), and Food Preparation & Serving (62.7%).
| Occupation | Male | Female |
| Healthcare Support | 13 (1.6%) | 790 (98.4%) |
| Security & Protection | 464 (66.7%) | 232 (33.3%) |
| Firefighting & Prevention | 323 (68.0%) | 152 (32.0%) |
| Law Enforcement | 141 (63.8%) | 80 (36.2%) |
| Food Preparation & Serving | 563 (37.3%) | 946 (62.7%) |
| Cleaning & Maintenance | 729 (59.1%) | 504 (40.9%) |
| Personal Care & Service | 154 (30.5%) | 351 (69.5%) |
| Total (Category) | 1,923 (40.5%) | 2,823 (59.5%) |
| Total (Overall) | 12,024 (50.8%) | 11,661 (49.2%) |
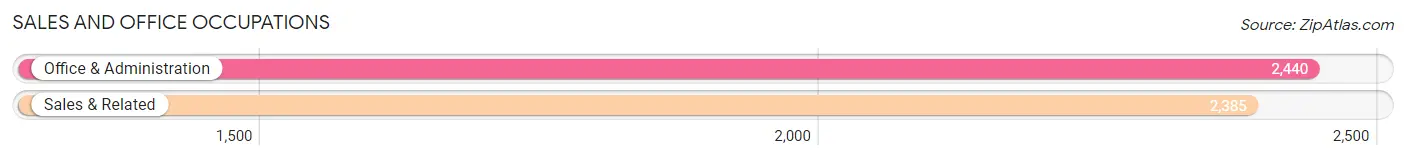
Sales and Office Occupations
The most common Sales and Office occupations in Liberty County are Office & Administration (2,440 | 10.3%), and Sales & Related (2,385 | 10.1%).
Sales and Office Occupations by Sex
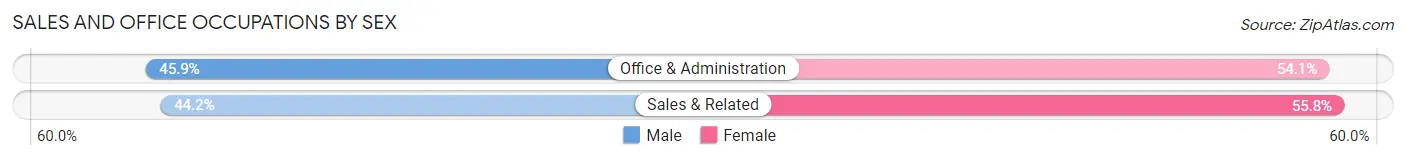
| Occupation | Male | Female |
| Sales & Related | 1,055 (44.2%) | 1,330 (55.8%) |
| Office & Administration | 1,121 (45.9%) | 1,319 (54.1%) |
| Total (Category) | 2,176 (45.1%) | 2,649 (54.9%) |
| Total (Overall) | 12,024 (50.8%) | 11,661 (49.2%) |
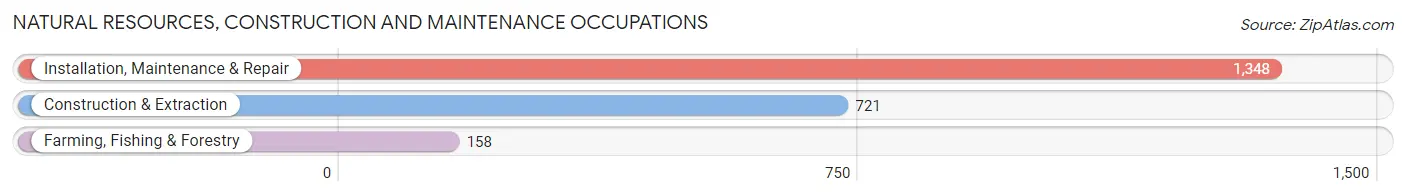
Natural Resources, Construction and Maintenance Occupations
The most common Natural Resources, Construction and Maintenance occupations in Liberty County are Installation, Maintenance & Repair (1,348 | 5.7%), Construction & Extraction (721 | 3.0%), and Farming, Fishing & Forestry (158 | 0.7%).
Natural Resources, Construction and Maintenance Occupations by Sex
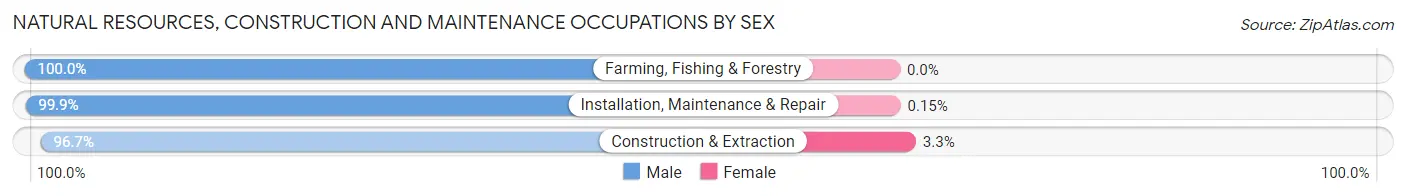
| Occupation | Male | Female |
| Farming, Fishing & Forestry | 158 (100.0%) | 0 (0.0%) |
| Construction & Extraction | 697 (96.7%) | 24 (3.3%) |
| Installation, Maintenance & Repair | 1,346 (99.9%) | 2 (0.2%) |
| Total (Category) | 2,201 (98.8%) | 26 (1.2%) |
| Total (Overall) | 12,024 (50.8%) | 11,661 (49.2%) |
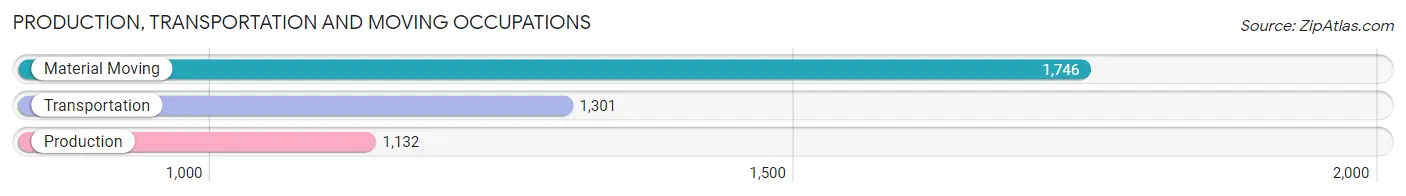
Production, Transportation and Moving Occupations
The most common Production, Transportation and Moving occupations in Liberty County are Material Moving (1,746 | 7.4%), Transportation (1,301 | 5.5%), and Production (1,132 | 4.8%).
Production, Transportation and Moving Occupations by Sex
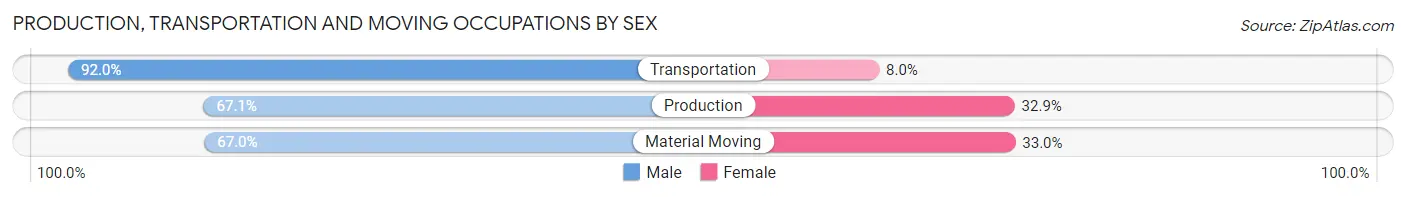
| Occupation | Male | Female |
| Production | 760 (67.1%) | 372 (32.9%) |
| Transportation | 1,197 (92.0%) | 104 (8.0%) |
| Material Moving | 1,170 (67.0%) | 576 (33.0%) |
| Total (Category) | 3,127 (74.8%) | 1,052 (25.2%) |
| Total (Overall) | 12,024 (50.8%) | 11,661 (49.2%) |
Employment Industries by Sex in Liberty County
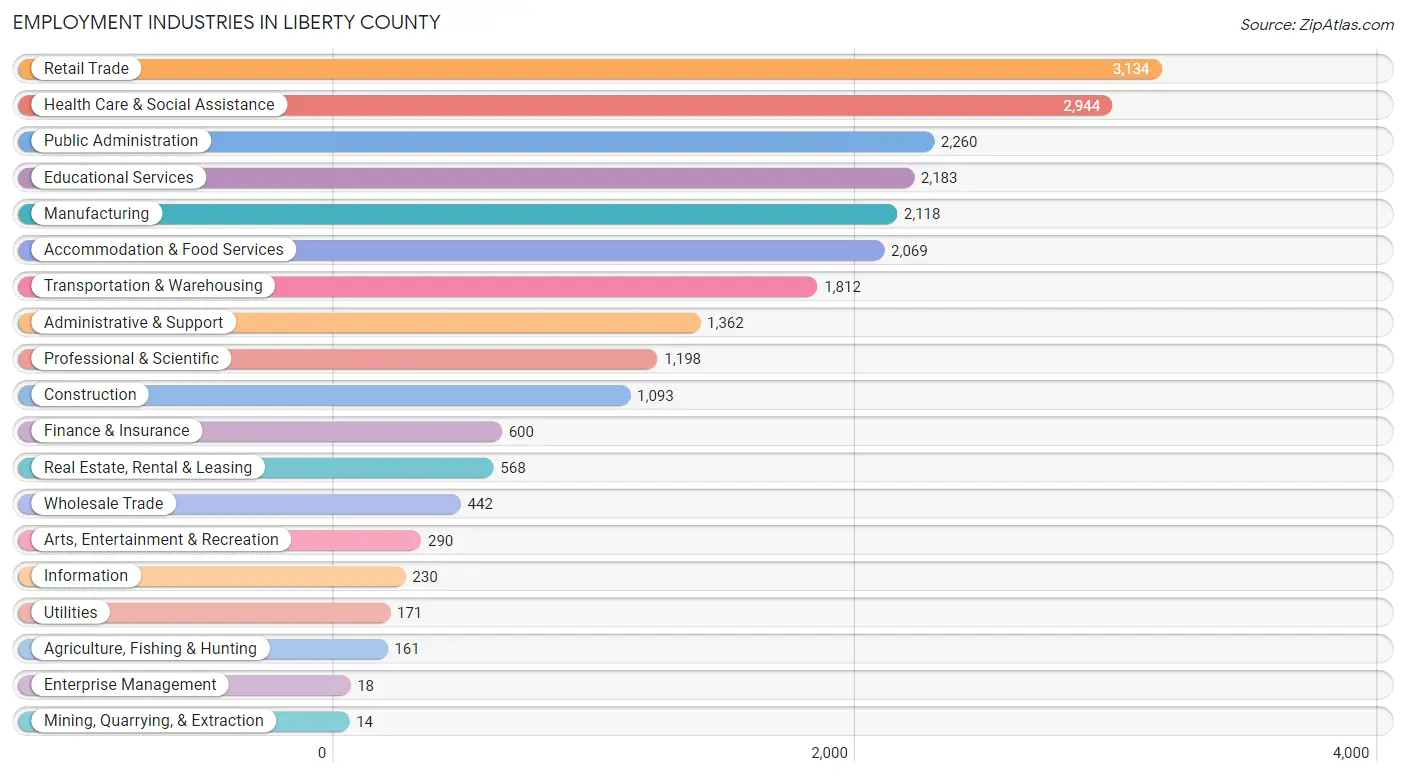
Employment Industries in Liberty County
The major employment industries in Liberty County include Retail Trade (3,134 | 13.2%), Health Care & Social Assistance (2,944 | 12.4%), Public Administration (2,260 | 9.5%), Educational Services (2,183 | 9.2%), and Manufacturing (2,118 | 8.9%).
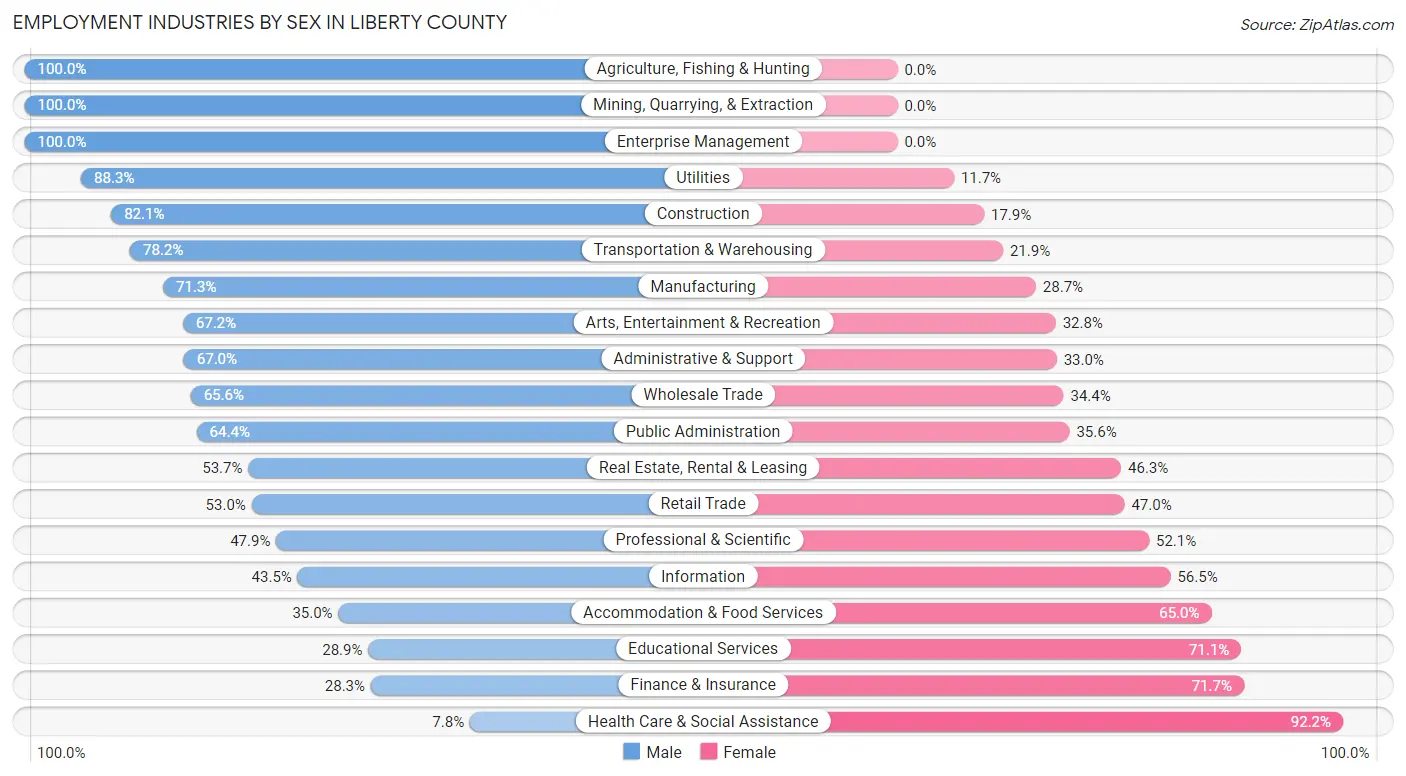
Employment Industries by Sex in Liberty County
The Liberty County industries that see more men than women are Agriculture, Fishing & Hunting (100.0%), Mining, Quarrying, & Extraction (100.0%), and Enterprise Management (100.0%), whereas the industries that tend to have a higher number of women are Health Care & Social Assistance (92.2%), Finance & Insurance (71.7%), and Educational Services (71.1%).
| Industry | Male | Female |
| Agriculture, Fishing & Hunting | 161 (100.0%) | 0 (0.0%) |
| Mining, Quarrying, & Extraction | 14 (100.0%) | 0 (0.0%) |
| Construction | 897 (82.1%) | 196 (17.9%) |
| Manufacturing | 1,511 (71.3%) | 607 (28.7%) |
| Wholesale Trade | 290 (65.6%) | 152 (34.4%) |
| Retail Trade | 1,661 (53.0%) | 1,473 (47.0%) |
| Transportation & Warehousing | 1,416 (78.1%) | 396 (21.8%) |
| Utilities | 151 (88.3%) | 20 (11.7%) |
| Information | 100 (43.5%) | 130 (56.5%) |
| Finance & Insurance | 170 (28.3%) | 430 (71.7%) |
| Real Estate, Rental & Leasing | 305 (53.7%) | 263 (46.3%) |
| Professional & Scientific | 574 (47.9%) | 624 (52.1%) |
| Enterprise Management | 18 (100.0%) | 0 (0.0%) |
| Administrative & Support | 913 (67.0%) | 449 (33.0%) |
| Educational Services | 630 (28.9%) | 1,553 (71.1%) |
| Health Care & Social Assistance | 230 (7.8%) | 2,714 (92.2%) |
| Arts, Entertainment & Recreation | 195 (67.2%) | 95 (32.8%) |
| Accommodation & Food Services | 725 (35.0%) | 1,344 (65.0%) |
| Public Administration | 1,455 (64.4%) | 805 (35.6%) |
| Total | 12,024 (50.8%) | 11,661 (49.2%) |
Education in Liberty County
School Enrollment in Liberty County
The most common levels of schooling among the 16,735 students in Liberty County are elementary school (3,949 | 23.6%), middle school (3,530 | 21.1%), and college / undergraduate (3,226 | 19.3%).
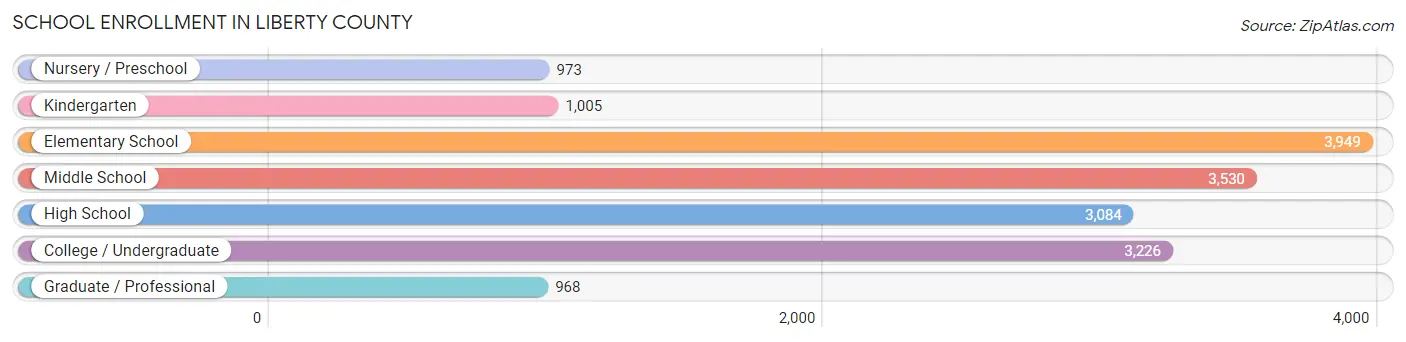
| School Level | # Students | % Students |
| Nursery / Preschool | 973 | 5.8% |
| Kindergarten | 1,005 | 6.0% |
| Elementary School | 3,949 | 23.6% |
| Middle School | 3,530 | 21.1% |
| High School | 3,084 | 18.4% |
| College / Undergraduate | 3,226 | 19.3% |
| Graduate / Professional | 968 | 5.8% |
| Total | 16,735 | 100.0% |
School Enrollment by Age by Funding Source in Liberty County
Out of a total of 16,735 students who are enrolled in schools in Liberty County, 1,891 (11.3%) attend a private institution, while the remaining 14,844 (88.7%) are enrolled in public schools. The age group of 35 years and over has the highest likelihood of being enrolled in private schools, with 259 (33.6% in the age bracket) enrolled. Conversely, the age group of 18 to 19 year olds has the lowest likelihood of being enrolled in a private school, with 920 (98.3% in the age bracket) attending a public institution.
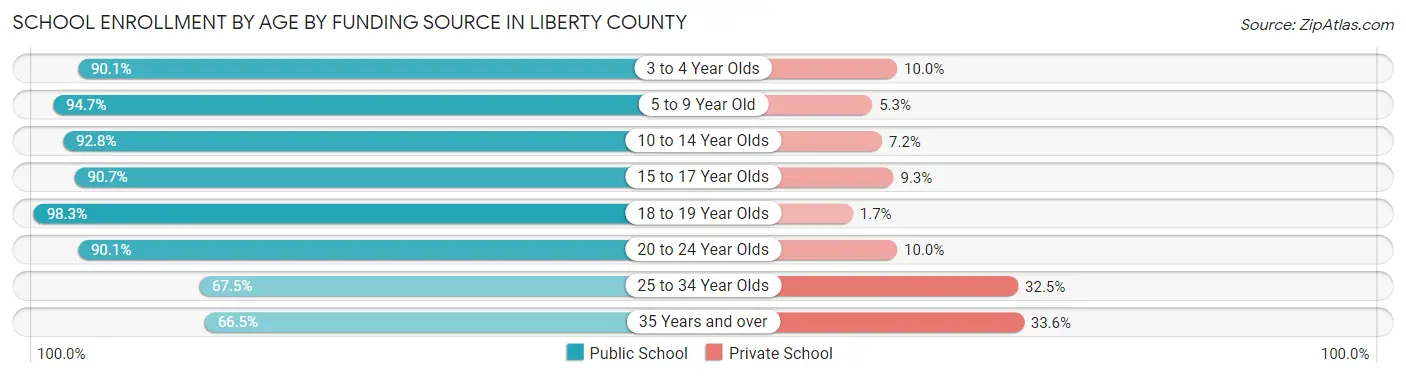
| Age Bracket | Public School | Private School |
| 3 to 4 Year Olds | 833 (90.0%) | 92 (10.0%) |
| 5 to 9 Year Old | 4,291 (94.7%) | 241 (5.3%) |
| 10 to 14 Year Olds | 3,888 (92.8%) | 300 (7.2%) |
| 15 to 17 Year Olds | 1,962 (90.7%) | 201 (9.3%) |
| 18 to 19 Year Olds | 920 (98.3%) | 16 (1.7%) |
| 20 to 24 Year Olds | 1,050 (90.0%) | 116 (10.0%) |
| 25 to 34 Year Olds | 1,386 (67.5%) | 667 (32.5%) |
| 35 Years and over | 513 (66.4%) | 259 (33.6%) |
| Total | 14,844 (88.7%) | 1,891 (11.3%) |
Educational Attainment by Field of Study in Liberty County
Business (2,173 | 26.7%), education (1,187 | 14.6%), science & technology (785 | 9.7%), arts & humanities (685 | 8.4%), and liberal arts & history (549 | 6.8%) are the most common fields of study among 8,127 individuals in Liberty County who have obtained a bachelor's degree or higher.
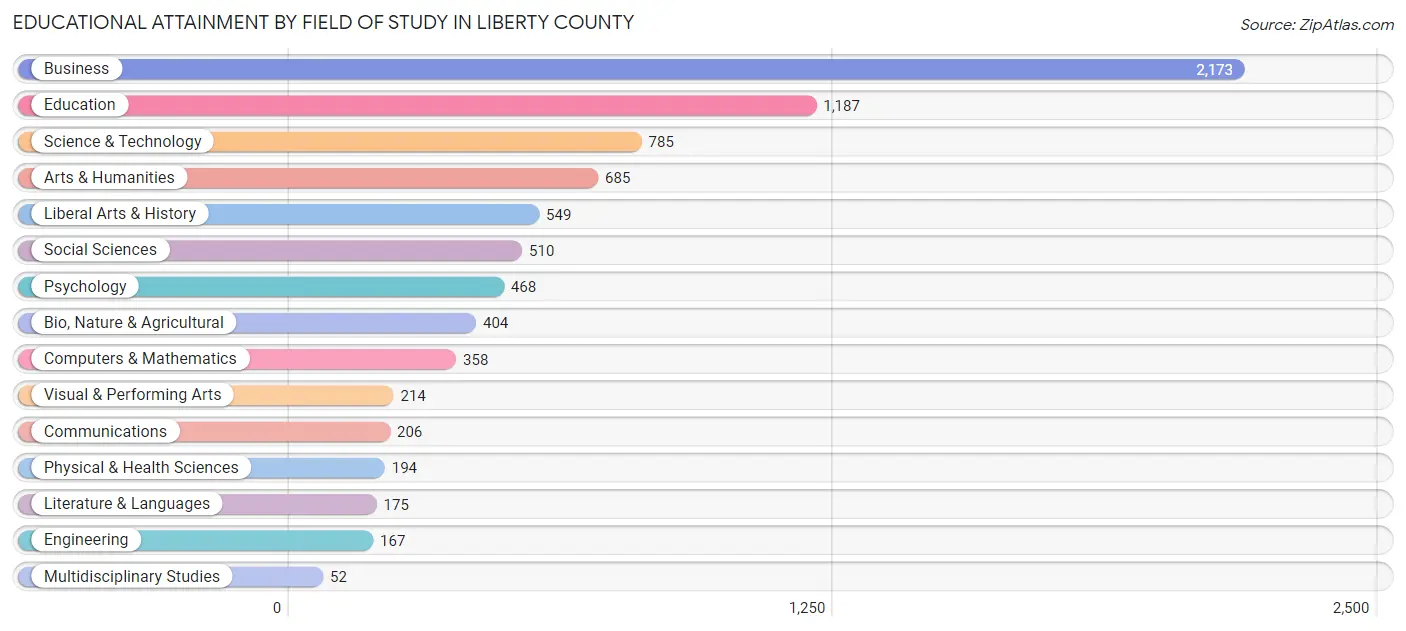
| Field of Study | # Graduates | % Graduates |
| Computers & Mathematics | 358 | 4.4% |
| Bio, Nature & Agricultural | 404 | 5.0% |
| Physical & Health Sciences | 194 | 2.4% |
| Psychology | 468 | 5.8% |
| Social Sciences | 510 | 6.3% |
| Engineering | 167 | 2.1% |
| Multidisciplinary Studies | 52 | 0.6% |
| Science & Technology | 785 | 9.7% |
| Business | 2,173 | 26.7% |
| Education | 1,187 | 14.6% |
| Literature & Languages | 175 | 2.1% |
| Liberal Arts & History | 549 | 6.8% |
| Visual & Performing Arts | 214 | 2.6% |
| Communications | 206 | 2.5% |
| Arts & Humanities | 685 | 8.4% |
| Total | 8,127 | 100.0% |
Transportation & Commute in Liberty County
Vehicle Availability by Sex in Liberty County
The most prevalent vehicle ownership categories in Liberty County are males with 2 vehicles (6,512, accounting for 41.7%) and females with 2 vehicles (4,595, making up 53.4%).
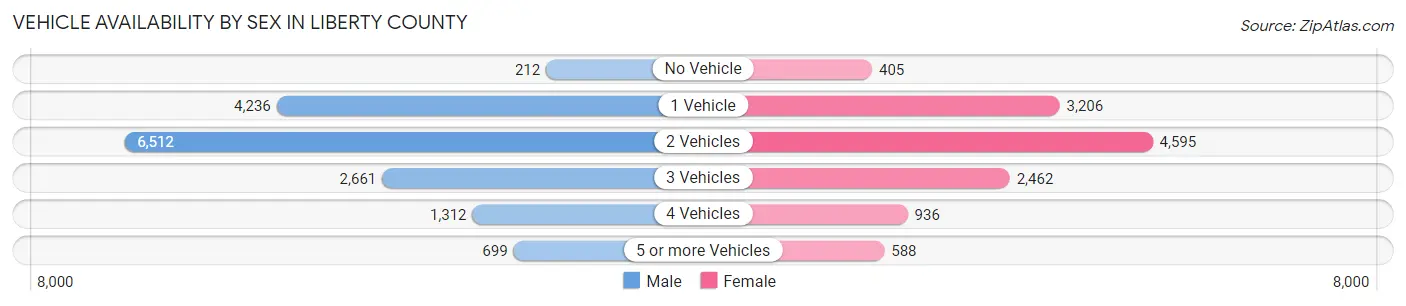
| Vehicles Available | Male | Female |
| No Vehicle | 212 (1.4%) | 405 (3.3%) |
| 1 Vehicle | 4,236 (27.1%) | 3,206 (26.3%) |
| 2 Vehicles | 6,512 (41.7%) | 4,595 (37.7%) |
| 3 Vehicles | 2,661 (17.0%) | 2,462 (20.2%) |
| 4 Vehicles | 1,312 (8.4%) | 936 (7.7%) |
| 5 or more Vehicles | 699 (4.5%) | 588 (4.8%) |
| Total | 15,632 (100.0%) | 12,192 (100.0%) |
Commute Time in Liberty County
The most frequently occuring commute durations in Liberty County are 15 to 19 minutes (4,807 commuters, 17.2%), 10 to 14 minutes (4,762 commuters, 17.0%), and 5 to 9 minutes (4,351 commuters, 15.5%).
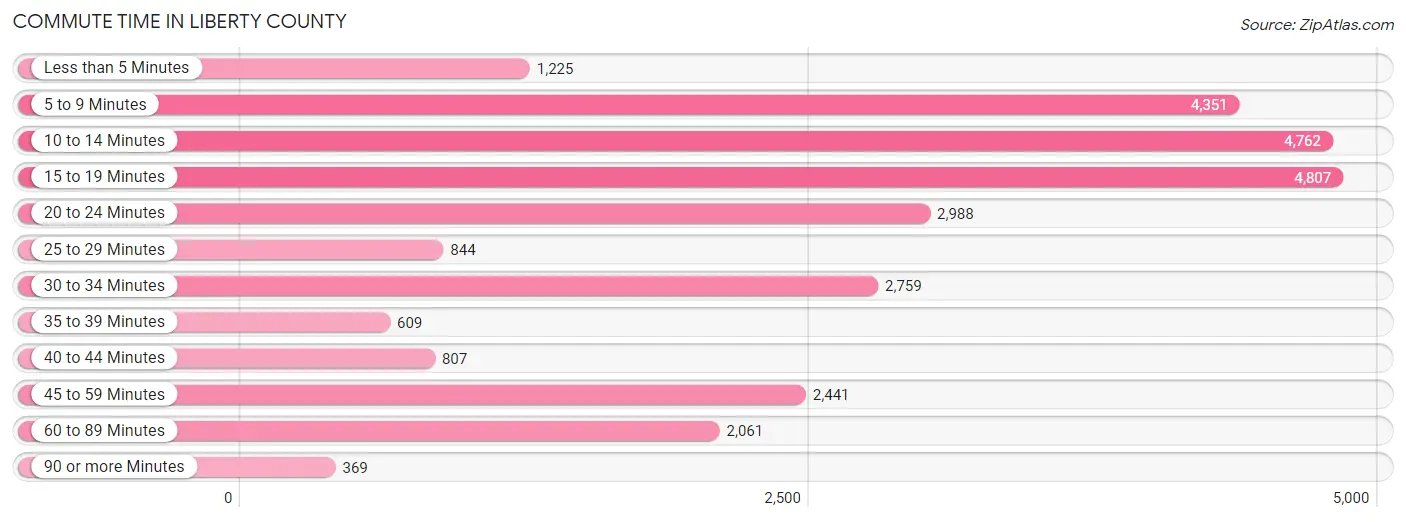
| Commute Time | # Commuters | % Commuters |
| Less than 5 Minutes | 1,225 | 4.4% |
| 5 to 9 Minutes | 4,351 | 15.5% |
| 10 to 14 Minutes | 4,762 | 17.0% |
| 15 to 19 Minutes | 4,807 | 17.2% |
| 20 to 24 Minutes | 2,988 | 10.7% |
| 25 to 29 Minutes | 844 | 3.0% |
| 30 to 34 Minutes | 2,759 | 9.9% |
| 35 to 39 Minutes | 609 | 2.2% |
| 40 to 44 Minutes | 807 | 2.9% |
| 45 to 59 Minutes | 2,441 | 8.7% |
| 60 to 89 Minutes | 2,061 | 7.3% |
| 90 or more Minutes | 369 | 1.3% |
Commute Time by Sex in Liberty County
The most common commute times in Liberty County are 5 to 9 minutes (2,561 commuters, 15.5%) for males and 15 to 19 minutes (2,339 commuters, 20.2%) for females.
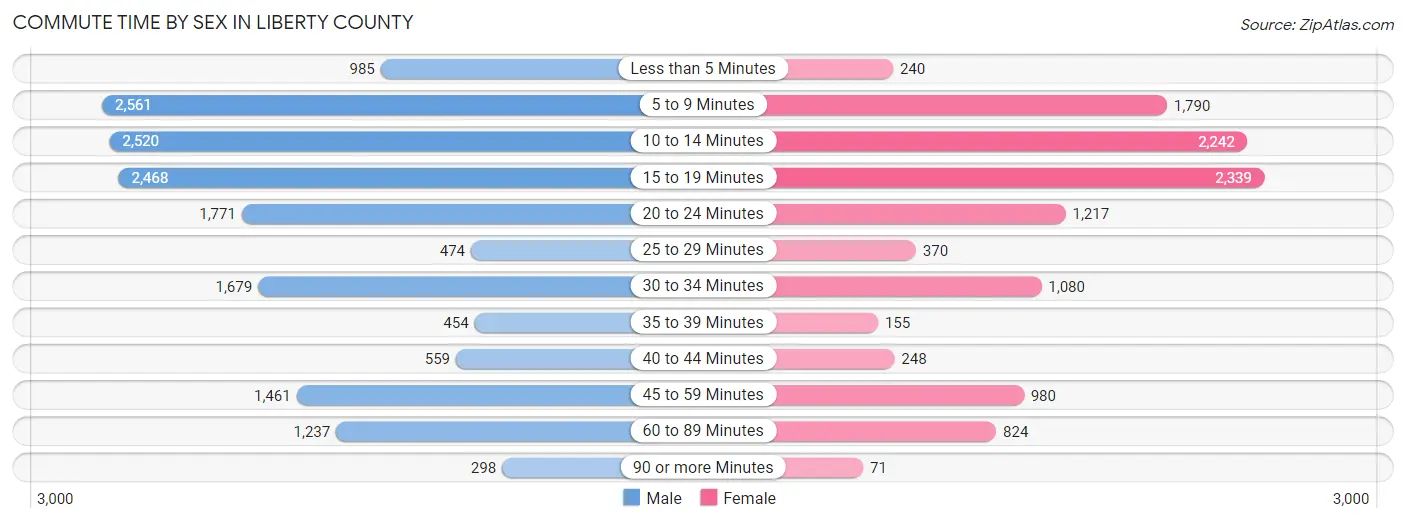
| Commute Time | Male | Female |
| Less than 5 Minutes | 985 (6.0%) | 240 (2.1%) |
| 5 to 9 Minutes | 2,561 (15.5%) | 1,790 (15.5%) |
| 10 to 14 Minutes | 2,520 (15.3%) | 2,242 (19.4%) |
| 15 to 19 Minutes | 2,468 (15.0%) | 2,339 (20.2%) |
| 20 to 24 Minutes | 1,771 (10.7%) | 1,217 (10.5%) |
| 25 to 29 Minutes | 474 (2.9%) | 370 (3.2%) |
| 30 to 34 Minutes | 1,679 (10.2%) | 1,080 (9.3%) |
| 35 to 39 Minutes | 454 (2.8%) | 155 (1.3%) |
| 40 to 44 Minutes | 559 (3.4%) | 248 (2.1%) |
| 45 to 59 Minutes | 1,461 (8.9%) | 980 (8.5%) |
| 60 to 89 Minutes | 1,237 (7.5%) | 824 (7.1%) |
| 90 or more Minutes | 298 (1.8%) | 71 (0.6%) |
Time of Departure to Work by Sex in Liberty County
The most frequent times of departure to work in Liberty County are 6:00 AM to 6:29 AM (2,596, 15.8%) for males and 7:00 AM to 7:29 AM (1,418, 12.3%) for females.
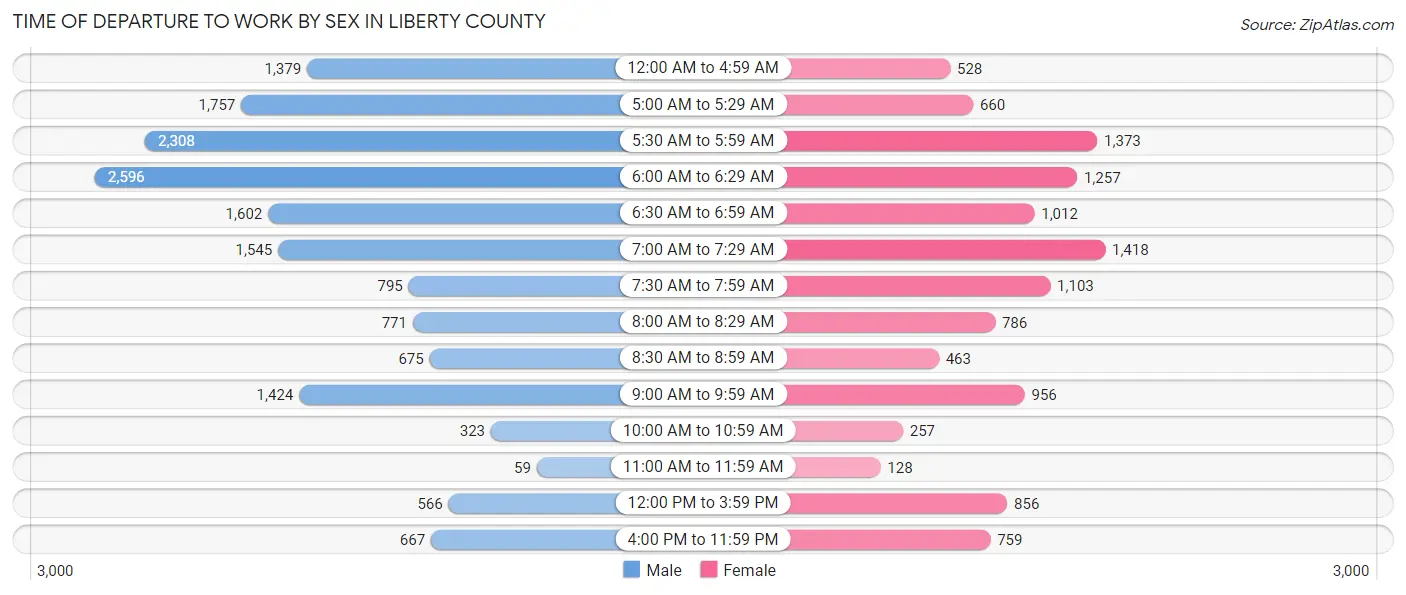
| Time of Departure | Male | Female |
| 12:00 AM to 4:59 AM | 1,379 (8.4%) | 528 (4.6%) |
| 5:00 AM to 5:29 AM | 1,757 (10.7%) | 660 (5.7%) |
| 5:30 AM to 5:59 AM | 2,308 (14.0%) | 1,373 (11.9%) |
| 6:00 AM to 6:29 AM | 2,596 (15.8%) | 1,257 (10.9%) |
| 6:30 AM to 6:59 AM | 1,602 (9.7%) | 1,012 (8.8%) |
| 7:00 AM to 7:29 AM | 1,545 (9.4%) | 1,418 (12.3%) |
| 7:30 AM to 7:59 AM | 795 (4.8%) | 1,103 (9.5%) |
| 8:00 AM to 8:29 AM | 771 (4.7%) | 786 (6.8%) |
| 8:30 AM to 8:59 AM | 675 (4.1%) | 463 (4.0%) |
| 9:00 AM to 9:59 AM | 1,424 (8.6%) | 956 (8.3%) |
| 10:00 AM to 10:59 AM | 323 (2.0%) | 257 (2.2%) |
| 11:00 AM to 11:59 AM | 59 (0.4%) | 128 (1.1%) |
| 12:00 PM to 3:59 PM | 566 (3.4%) | 856 (7.4%) |
| 4:00 PM to 11:59 PM | 667 (4.1%) | 759 (6.6%) |
| Total | 16,467 (100.0%) | 11,556 (100.0%) |
Housing Occupancy in Liberty County
Occupancy by Ownership in Liberty County
Of the total 22,975 dwellings in Liberty County, owner-occupied units account for 11,057 (48.1%), while renter-occupied units make up 11,918 (51.9%).
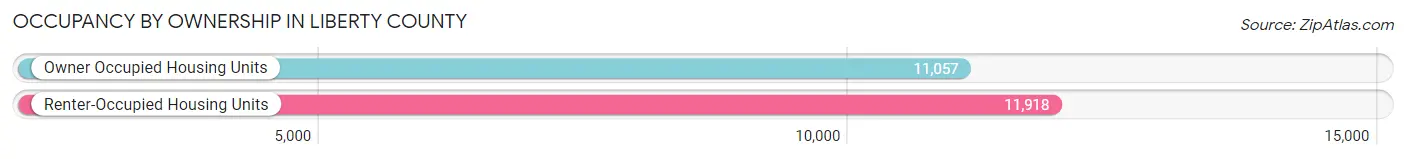
| Occupancy | # Housing Units | % Housing Units |
| Owner Occupied Housing Units | 11,057 | 48.1% |
| Renter-Occupied Housing Units | 11,918 | 51.9% |
| Total Occupied Housing Units | 22,975 | 100.0% |
Occupancy by Household Size in Liberty County
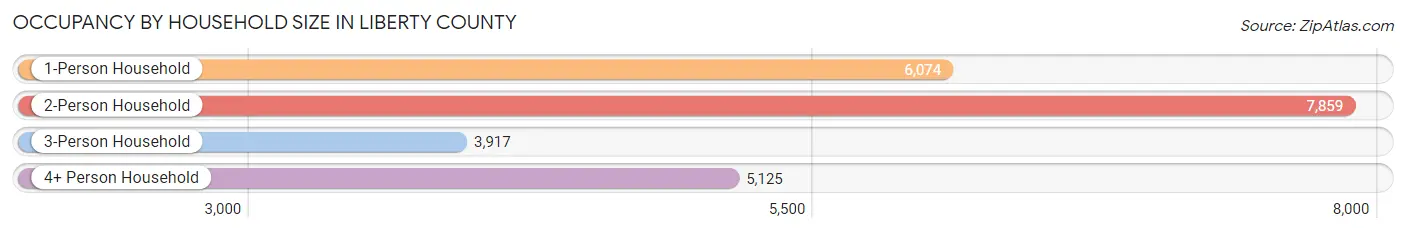
| Household Size | # Housing Units | % Housing Units |
| 1-Person Household | 6,074 | 26.4% |
| 2-Person Household | 7,859 | 34.2% |
| 3-Person Household | 3,917 | 17.1% |
| 4+ Person Household | 5,125 | 22.3% |
| Total Housing Units | 22,975 | 100.0% |
Occupancy by Ownership by Household Size in Liberty County
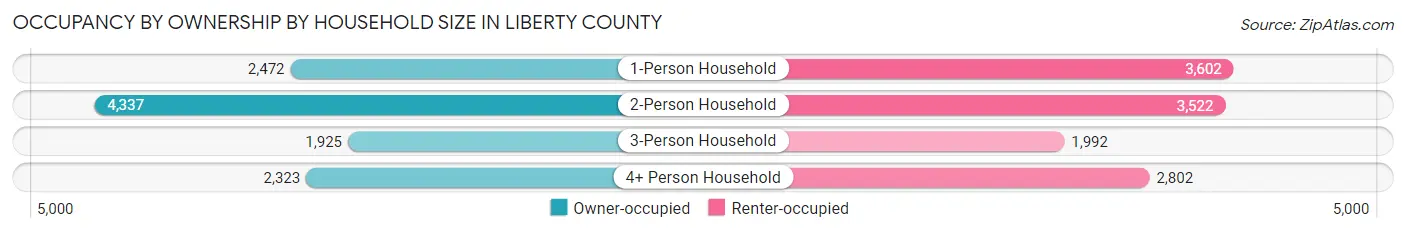
| Household Size | Owner-occupied | Renter-occupied |
| 1-Person Household | 2,472 (40.7%) | 3,602 (59.3%) |
| 2-Person Household | 4,337 (55.2%) | 3,522 (44.8%) |
| 3-Person Household | 1,925 (49.1%) | 1,992 (50.9%) |
| 4+ Person Household | 2,323 (45.3%) | 2,802 (54.7%) |
| Total Housing Units | 11,057 (48.1%) | 11,918 (51.9%) |
Occupancy by Educational Attainment in Liberty County
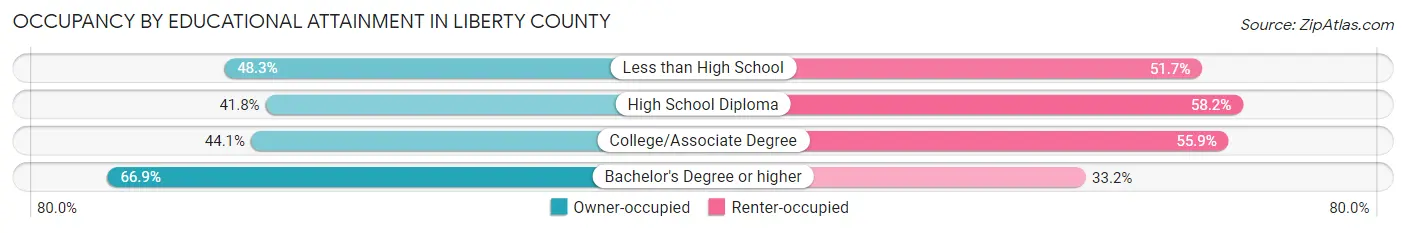
| Household Size | Owner-occupied | Renter-occupied |
| Less than High School | 667 (48.3%) | 713 (51.7%) |
| High School Diploma | 2,993 (41.8%) | 4,168 (58.2%) |
| College/Associate Degree | 4,368 (44.1%) | 5,535 (55.9%) |
| Bachelor's Degree or higher | 3,029 (66.8%) | 1,502 (33.2%) |
Occupancy by Age of Householder in Liberty County
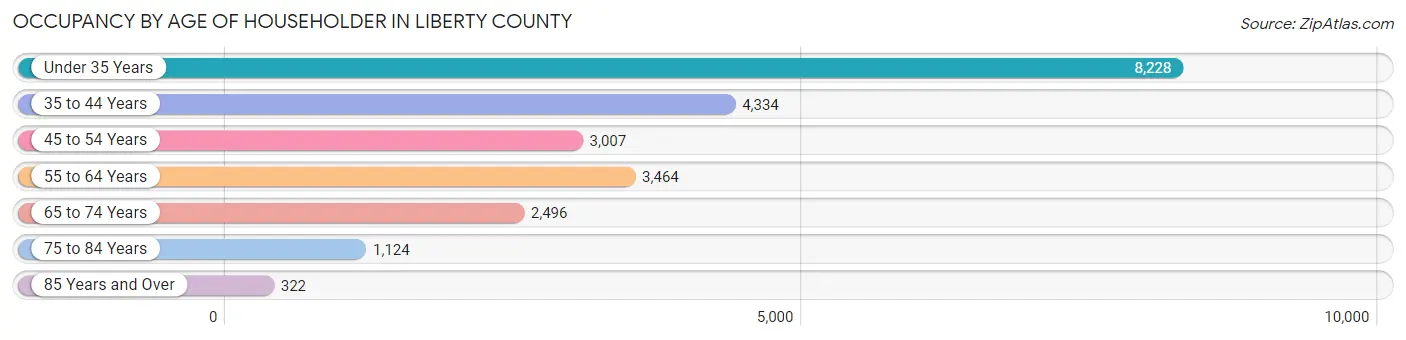
| Age Bracket | # Households | % Households |
| Under 35 Years | 8,228 | 35.8% |
| 35 to 44 Years | 4,334 | 18.9% |
| 45 to 54 Years | 3,007 | 13.1% |
| 55 to 64 Years | 3,464 | 15.1% |
| 65 to 74 Years | 2,496 | 10.9% |
| 75 to 84 Years | 1,124 | 4.9% |
| 85 Years and Over | 322 | 1.4% |
| Total | 22,975 | 100.0% |
Housing Finances in Liberty County
Median Income by Occupancy in Liberty County
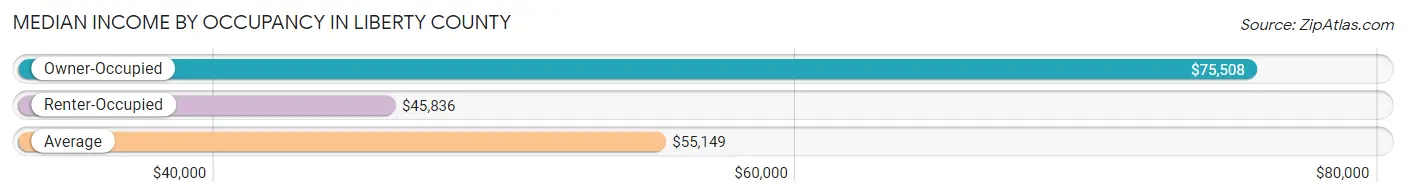
| Occupancy Type | # Households | Median Income |
| Owner-Occupied | 11,057 (48.1%) | $75,508 |
| Renter-Occupied | 11,918 (51.9%) | $45,836 |
| Average | 22,975 (100.0%) | $55,149 |
Occupancy by Householder Income Bracket in Liberty County
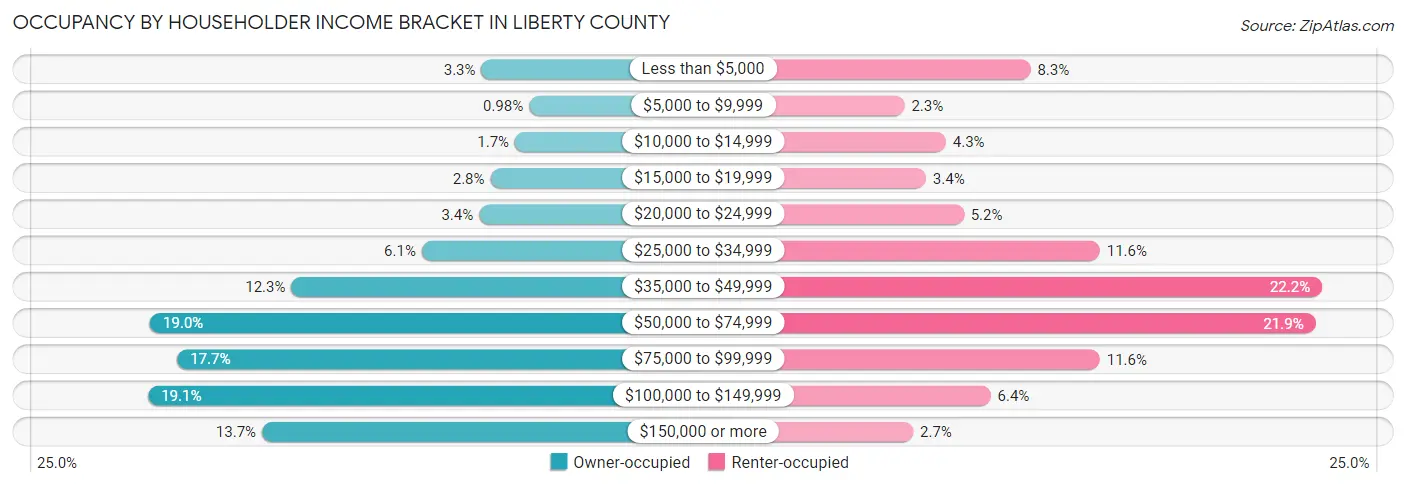
| Income Bracket | Owner-occupied | Renter-occupied |
| Less than $5,000 | 359 (3.3%) | 993 (8.3%) |
| $5,000 to $9,999 | 108 (1.0%) | 278 (2.3%) |
| $10,000 to $14,999 | 182 (1.7%) | 513 (4.3%) |
| $15,000 to $19,999 | 312 (2.8%) | 399 (3.4%) |
| $20,000 to $24,999 | 371 (3.4%) | 614 (5.1%) |
| $25,000 to $34,999 | 673 (6.1%) | 1,386 (11.6%) |
| $35,000 to $49,999 | 1,360 (12.3%) | 2,647 (22.2%) |
| $50,000 to $74,999 | 2,104 (19.0%) | 2,610 (21.9%) |
| $75,000 to $99,999 | 1,960 (17.7%) | 1,386 (11.6%) |
| $100,000 to $149,999 | 2,113 (19.1%) | 766 (6.4%) |
| $150,000 or more | 1,515 (13.7%) | 326 (2.7%) |
| Total | 11,057 (100.0%) | 11,918 (100.0%) |
Monthly Housing Cost Tiers in Liberty County
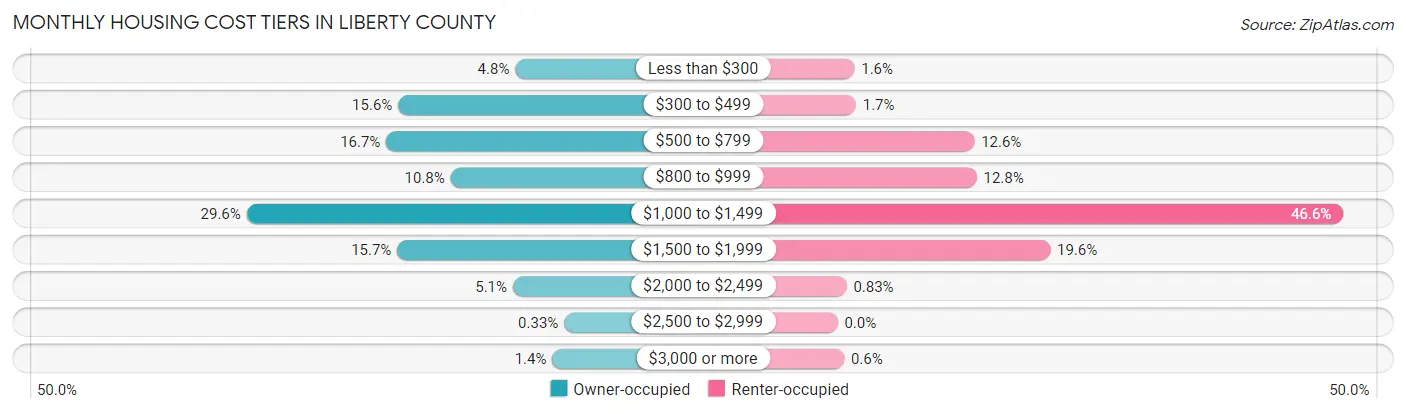
| Monthly Cost | Owner-occupied | Renter-occupied |
| Less than $300 | 534 (4.8%) | 185 (1.5%) |
| $300 to $499 | 1,726 (15.6%) | 202 (1.7%) |
| $500 to $799 | 1,848 (16.7%) | 1,501 (12.6%) |
| $800 to $999 | 1,192 (10.8%) | 1,527 (12.8%) |
| $1,000 to $1,499 | 3,270 (29.6%) | 5,549 (46.6%) |
| $1,500 to $1,999 | 1,736 (15.7%) | 2,334 (19.6%) |
| $2,000 to $2,499 | 558 (5.1%) | 99 (0.8%) |
| $2,500 to $2,999 | 36 (0.3%) | 0 (0.0%) |
| $3,000 or more | 157 (1.4%) | 71 (0.6%) |
| Total | 11,057 (100.0%) | 11,918 (100.0%) |
Physical Housing Characteristics in Liberty County
Housing Structures in Liberty County
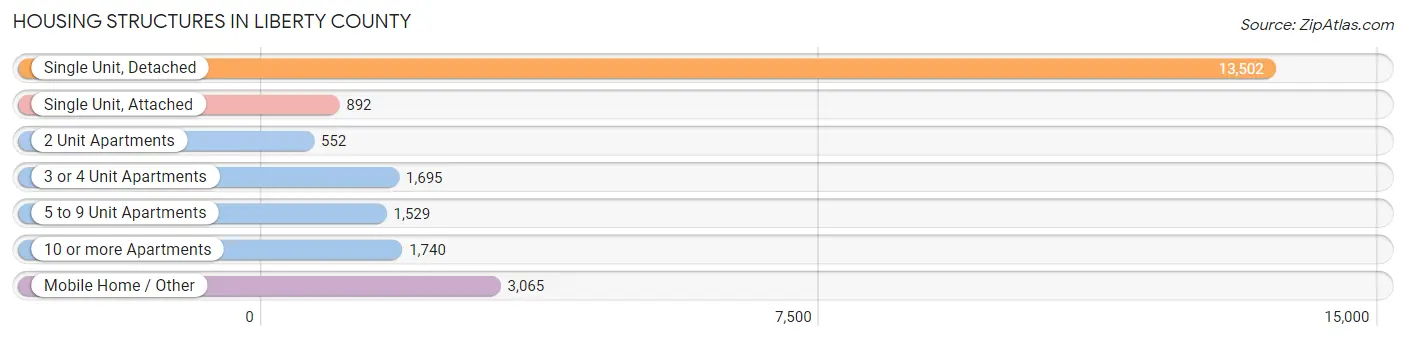
| Structure Type | # Housing Units | % Housing Units |
| Single Unit, Detached | 13,502 | 58.8% |
| Single Unit, Attached | 892 | 3.9% |
| 2 Unit Apartments | 552 | 2.4% |
| 3 or 4 Unit Apartments | 1,695 | 7.4% |
| 5 to 9 Unit Apartments | 1,529 | 6.7% |
| 10 or more Apartments | 1,740 | 7.6% |
| Mobile Home / Other | 3,065 | 13.3% |
| Total | 22,975 | 100.0% |
Housing Structures by Occupancy in Liberty County
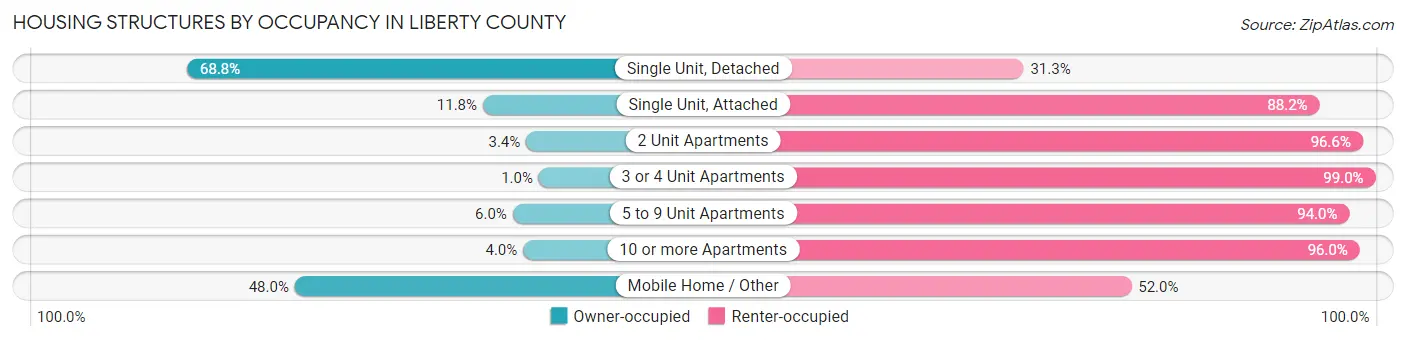
| Structure Type | Owner-occupied | Renter-occupied |
| Single Unit, Detached | 9,283 (68.8%) | 4,219 (31.2%) |
| Single Unit, Attached | 105 (11.8%) | 787 (88.2%) |
| 2 Unit Apartments | 19 (3.4%) | 533 (96.6%) |
| 3 or 4 Unit Apartments | 17 (1.0%) | 1,678 (99.0%) |
| 5 to 9 Unit Apartments | 92 (6.0%) | 1,437 (94.0%) |
| 10 or more Apartments | 70 (4.0%) | 1,670 (96.0%) |
| Mobile Home / Other | 1,471 (48.0%) | 1,594 (52.0%) |
| Total | 11,057 (48.1%) | 11,918 (51.9%) |
Housing Structures by Number of Rooms in Liberty County
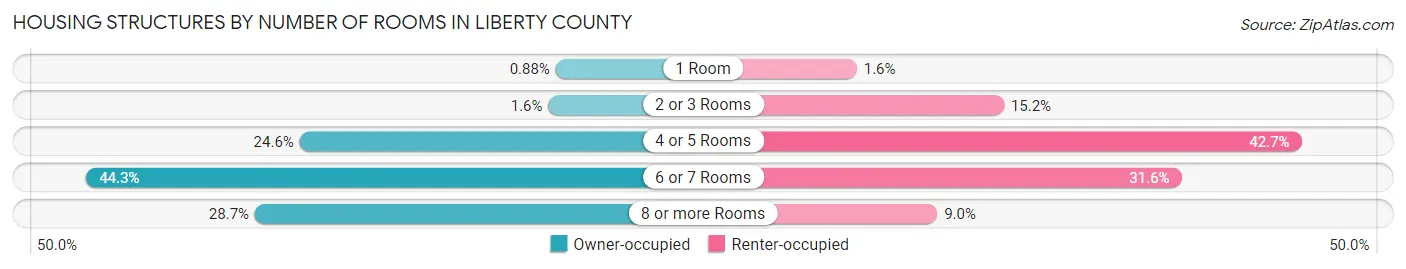
| Number of Rooms | Owner-occupied | Renter-occupied |
| 1 Room | 97 (0.9%) | 186 (1.6%) |
| 2 or 3 Rooms | 173 (1.6%) | 1,808 (15.2%) |
| 4 or 5 Rooms | 2,716 (24.6%) | 5,087 (42.7%) |
| 6 or 7 Rooms | 4,898 (44.3%) | 3,764 (31.6%) |
| 8 or more Rooms | 3,173 (28.7%) | 1,073 (9.0%) |
| Total | 11,057 (100.0%) | 11,918 (100.0%) |
Housing Structure by Heating Type in Liberty County
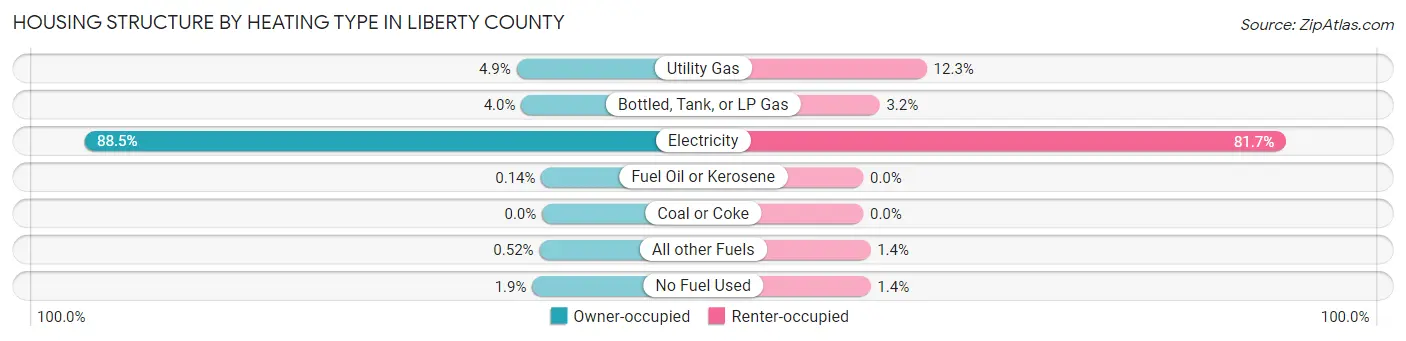
| Heating Type | Owner-occupied | Renter-occupied |
| Utility Gas | 544 (4.9%) | 1,465 (12.3%) |
| Bottled, Tank, or LP Gas | 445 (4.0%) | 378 (3.2%) |
| Electricity | 9,785 (88.5%) | 9,740 (81.7%) |
| Fuel Oil or Kerosene | 15 (0.1%) | 0 (0.0%) |
| Coal or Coke | 0 (0.0%) | 0 (0.0%) |
| All other Fuels | 58 (0.5%) | 166 (1.4%) |
| No Fuel Used | 210 (1.9%) | 169 (1.4%) |
| Total | 11,057 (100.0%) | 11,918 (100.0%) |
Household Vehicle Usage in Liberty County
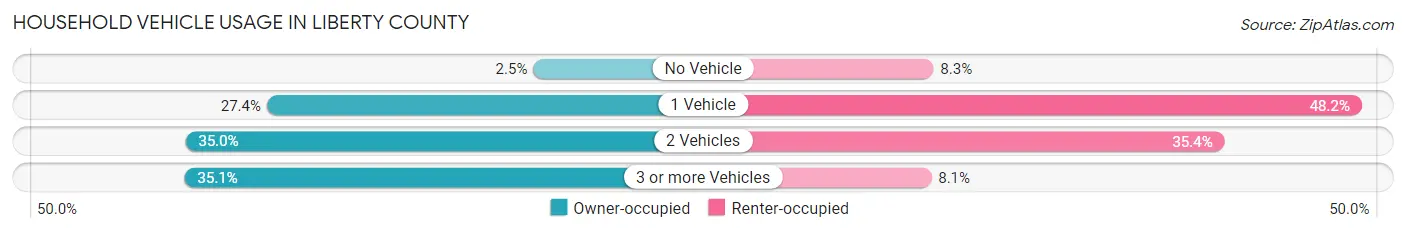
| Vehicles per Household | Owner-occupied | Renter-occupied |
| No Vehicle | 279 (2.5%) | 985 (8.3%) |
| 1 Vehicle | 3,029 (27.4%) | 5,749 (48.2%) |
| 2 Vehicles | 3,870 (35.0%) | 4,223 (35.4%) |
| 3 or more Vehicles | 3,879 (35.1%) | 961 (8.1%) |
| Total | 11,057 (100.0%) | 11,918 (100.0%) |
Real Estate & Mortgages in Liberty County
Real Estate and Mortgage Overview in Liberty County
| Characteristic | Without Mortgage | With Mortgage |
| Housing Units | 3,926 | 7,131 |
| Median Property Value | $140,400 | $169,500 |
| Median Household Income | $57,350 | $1,206 |
| Monthly Housing Costs | $473 | $141 |
| Real Estate Taxes | $1,415 | $375 |
Property Value by Mortgage Status in Liberty County
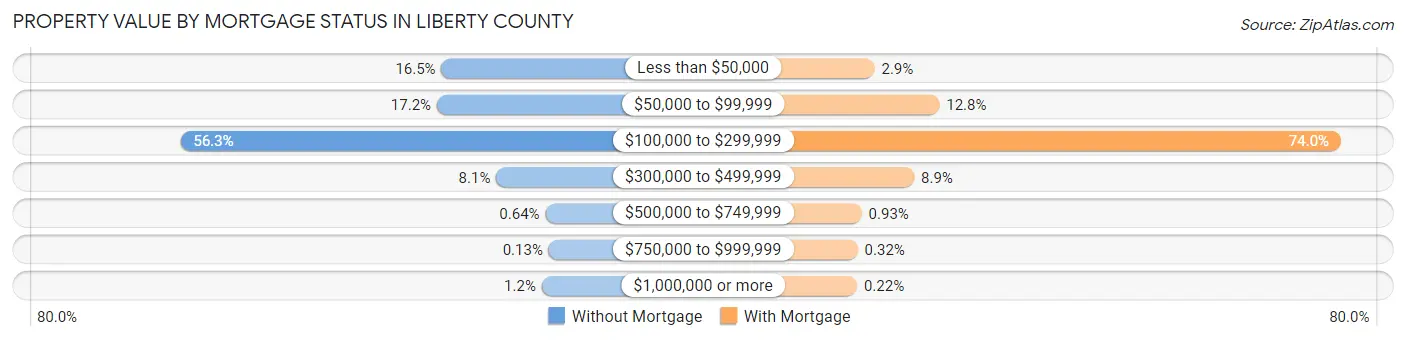
| Property Value | Without Mortgage | With Mortgage |
| Less than $50,000 | 647 (16.5%) | 206 (2.9%) |
| $50,000 to $99,999 | 674 (17.2%) | 910 (12.8%) |
| $100,000 to $299,999 | 2,209 (56.3%) | 5,274 (74.0%) |
| $300,000 to $499,999 | 319 (8.1%) | 636 (8.9%) |
| $500,000 to $749,999 | 25 (0.6%) | 66 (0.9%) |
| $750,000 to $999,999 | 5 (0.1%) | 23 (0.3%) |
| $1,000,000 or more | 47 (1.2%) | 16 (0.2%) |
| Total | 3,926 (100.0%) | 7,131 (100.0%) |
Household Income by Mortgage Status in Liberty County
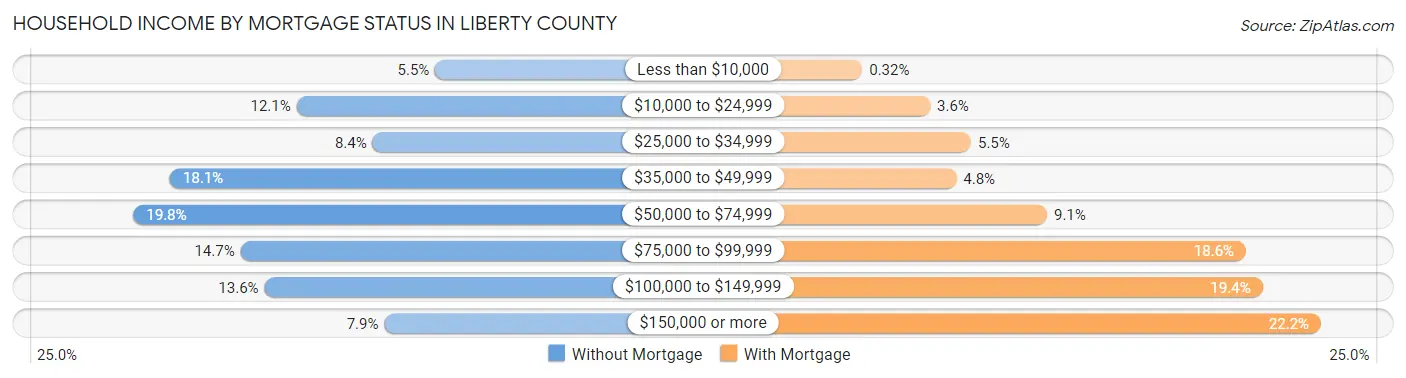
| Household Income | Without Mortgage | With Mortgage |
| Less than $10,000 | 214 (5.4%) | 23 (0.3%) |
| $10,000 to $24,999 | 473 (12.0%) | 253 (3.5%) |
| $25,000 to $34,999 | 331 (8.4%) | 392 (5.5%) |
| $35,000 to $49,999 | 710 (18.1%) | 342 (4.8%) |
| $50,000 to $74,999 | 778 (19.8%) | 650 (9.1%) |
| $75,000 to $99,999 | 578 (14.7%) | 1,326 (18.6%) |
| $100,000 to $149,999 | 533 (13.6%) | 1,382 (19.4%) |
| $150,000 or more | 309 (7.9%) | 1,580 (22.2%) |
| Total | 3,926 (100.0%) | 7,131 (100.0%) |
Property Value to Household Income Ratio in Liberty County
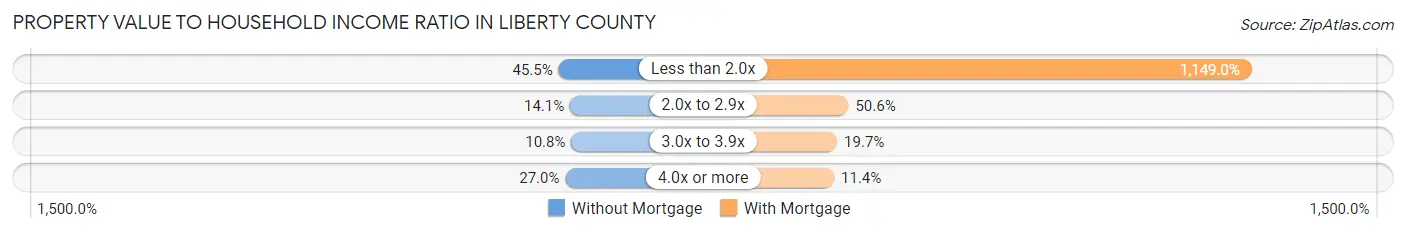
| Value-to-Income Ratio | Without Mortgage | With Mortgage |
| Less than 2.0x | 1,788 (45.5%) | 81,938 (1,149.0%) |
| 2.0x to 2.9x | 554 (14.1%) | 3,611 (50.6%) |
| 3.0x to 3.9x | 424 (10.8%) | 1,407 (19.7%) |
| 4.0x or more | 1,058 (27.0%) | 815 (11.4%) |
| Total | 3,926 (100.0%) | 7,131 (100.0%) |
Real Estate Taxes by Mortgage Status in Liberty County
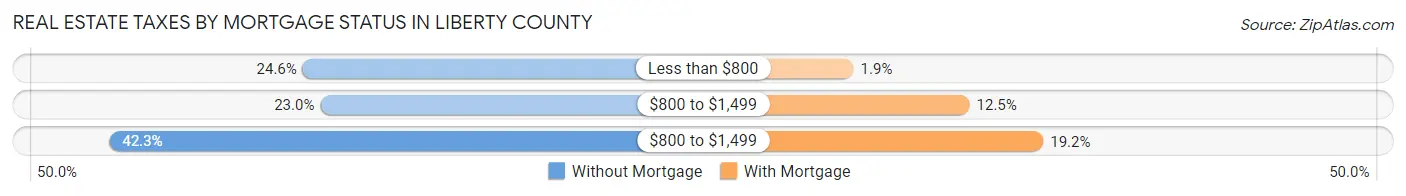
| Property Taxes | Without Mortgage | With Mortgage |
| Less than $800 | 966 (24.6%) | 134 (1.9%) |
| $800 to $1,499 | 903 (23.0%) | 889 (12.5%) |
| $800 to $1,499 | 1,659 (42.3%) | 1,369 (19.2%) |
| Total | 3,926 (100.0%) | 7,131 (100.0%) |
Health & Disability in Liberty County
Health Insurance Coverage by Age in Liberty County
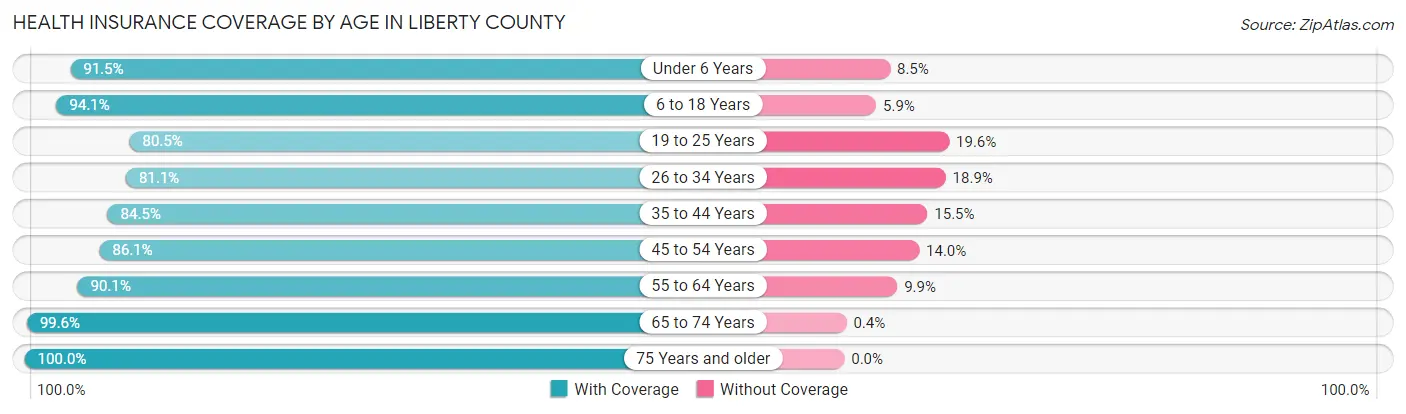
| Age Bracket | With Coverage | Without Coverage |
| Under 6 Years | 6,763 (91.5%) | 631 (8.5%) |
| 6 to 18 Years | 10,786 (94.1%) | 680 (5.9%) |
| 19 to 25 Years | 5,543 (80.4%) | 1,347 (19.6%) |
| 26 to 34 Years | 7,045 (81.1%) | 1,642 (18.9%) |
| 35 to 44 Years | 5,615 (84.5%) | 1,029 (15.5%) |
| 45 to 54 Years | 4,640 (86.1%) | 752 (14.0%) |
| 55 to 64 Years | 5,215 (90.1%) | 571 (9.9%) |
| 65 to 74 Years | 3,992 (99.6%) | 16 (0.4%) |
| 75 Years and older | 2,175 (100.0%) | 0 (0.0%) |
| Total | 51,774 (88.6%) | 6,668 (11.4%) |
Health Insurance Coverage by Citizenship Status in Liberty County
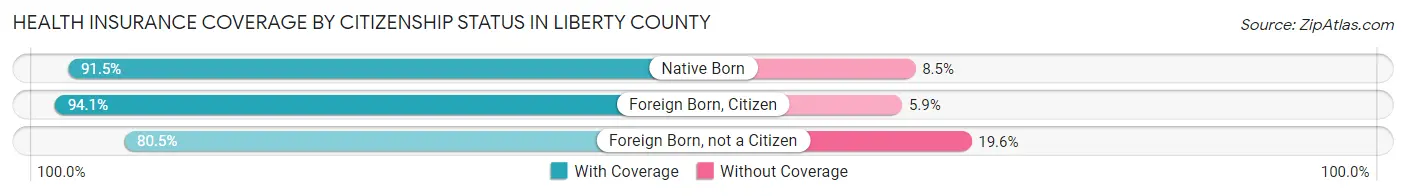
| Citizenship Status | With Coverage | Without Coverage |
| Native Born | 6,763 (91.5%) | 631 (8.5%) |
| Foreign Born, Citizen | 10,786 (94.1%) | 680 (5.9%) |
| Foreign Born, not a Citizen | 5,543 (80.4%) | 1,347 (19.6%) |
Health Insurance Coverage by Household Income in Liberty County
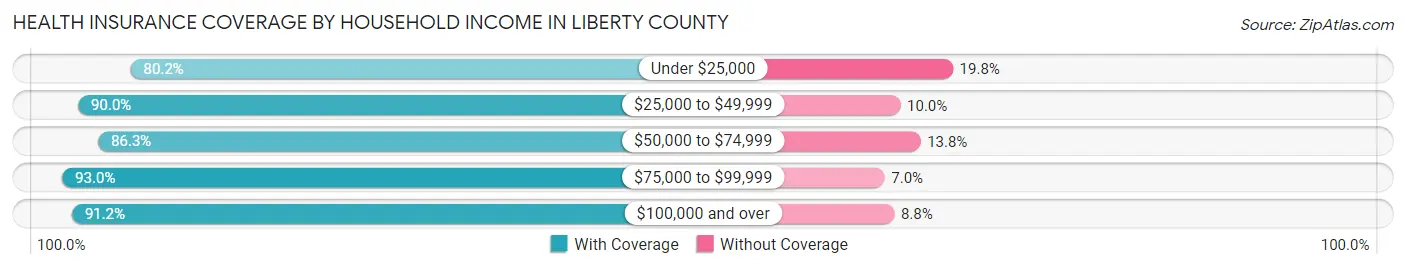
| Household Income | With Coverage | Without Coverage |
| Under $25,000 | 6,526 (80.2%) | 1,614 (19.8%) |
| $25,000 to $49,999 | 12,257 (90.0%) | 1,360 (10.0%) |
| $50,000 to $74,999 | 10,697 (86.3%) | 1,706 (13.8%) |
| $75,000 to $99,999 | 8,643 (93.0%) | 654 (7.0%) |
| $100,000 and over | 13,623 (91.2%) | 1,321 (8.8%) |
Public vs Private Health Insurance Coverage by Age in Liberty County
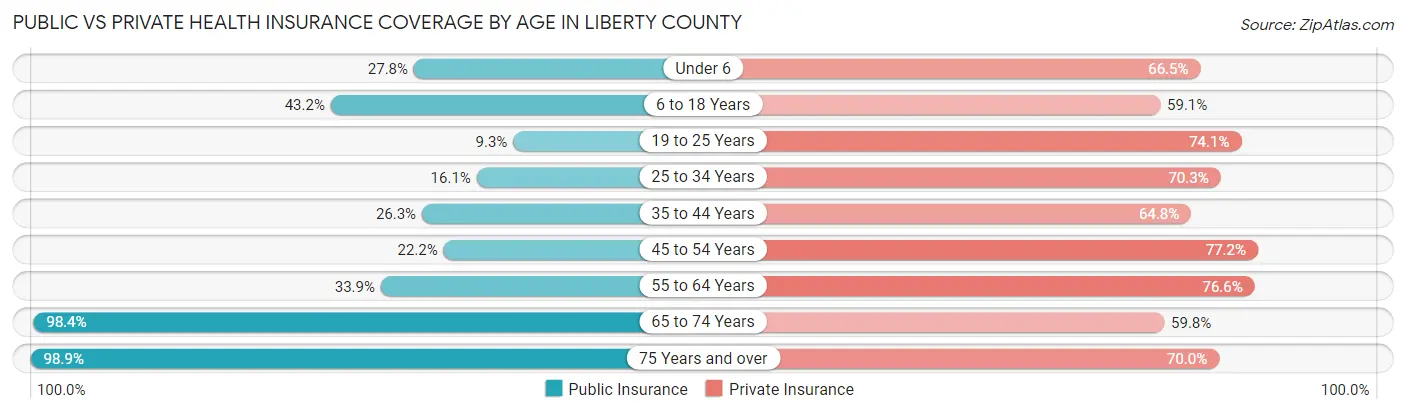
| Age Bracket | Public Insurance | Private Insurance |
| Under 6 | 2,052 (27.8%) | 4,919 (66.5%) |
| 6 to 18 Years | 4,951 (43.2%) | 6,774 (59.1%) |
| 19 to 25 Years | 642 (9.3%) | 5,108 (74.1%) |
| 25 to 34 Years | 1,398 (16.1%) | 6,105 (70.3%) |
| 35 to 44 Years | 1,744 (26.3%) | 4,307 (64.8%) |
| 45 to 54 Years | 1,199 (22.2%) | 4,163 (77.2%) |
| 55 to 64 Years | 1,961 (33.9%) | 4,432 (76.6%) |
| 65 to 74 Years | 3,943 (98.4%) | 2,398 (59.8%) |
| 75 Years and over | 2,151 (98.9%) | 1,523 (70.0%) |
| Total | 20,041 (34.3%) | 39,729 (68.0%) |
Disability Status by Sex by Age in Liberty County
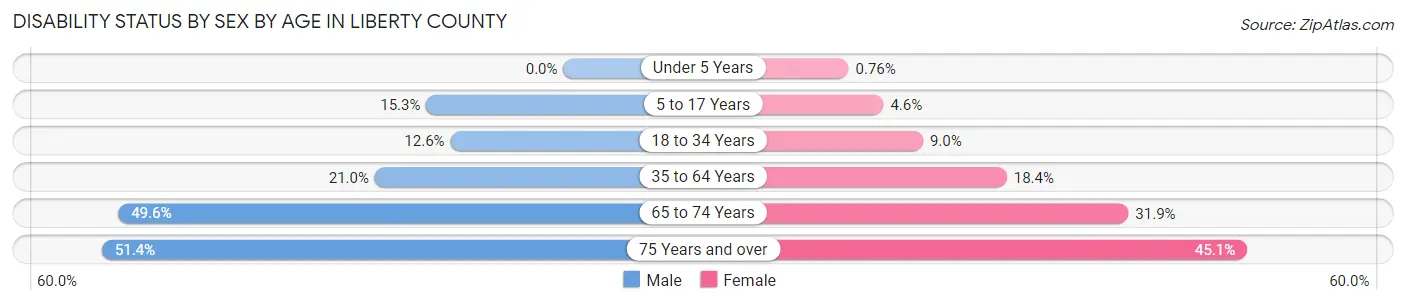
| Age Bracket | Male | Female |
| Under 5 Years | 0 (0.0%) | 24 (0.8%) |
| 5 to 17 Years | 895 (15.3%) | 265 (4.6%) |
| 18 to 34 Years | 975 (12.6%) | 781 (9.0%) |
| 35 to 64 Years | 1,740 (21.0%) | 1,753 (18.4%) |
| 65 to 74 Years | 926 (49.6%) | 683 (31.9%) |
| 75 Years and over | 463 (51.4%) | 575 (45.1%) |
Disability Class by Sex by Age in Liberty County
Disability Class: Hearing Difficulty
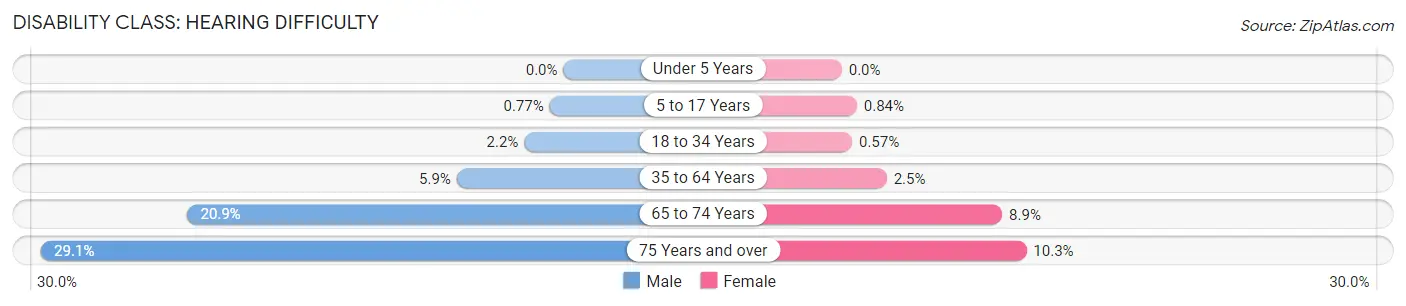
| Age Bracket | Male | Female |
| Under 5 Years | 0 (0.0%) | 0 (0.0%) |
| 5 to 17 Years | 45 (0.8%) | 48 (0.8%) |
| 18 to 34 Years | 169 (2.2%) | 49 (0.6%) |
| 35 to 64 Years | 492 (5.9%) | 238 (2.5%) |
| 65 to 74 Years | 391 (20.9%) | 191 (8.9%) |
| 75 Years and over | 262 (29.1%) | 131 (10.3%) |
Disability Class: Vision Difficulty
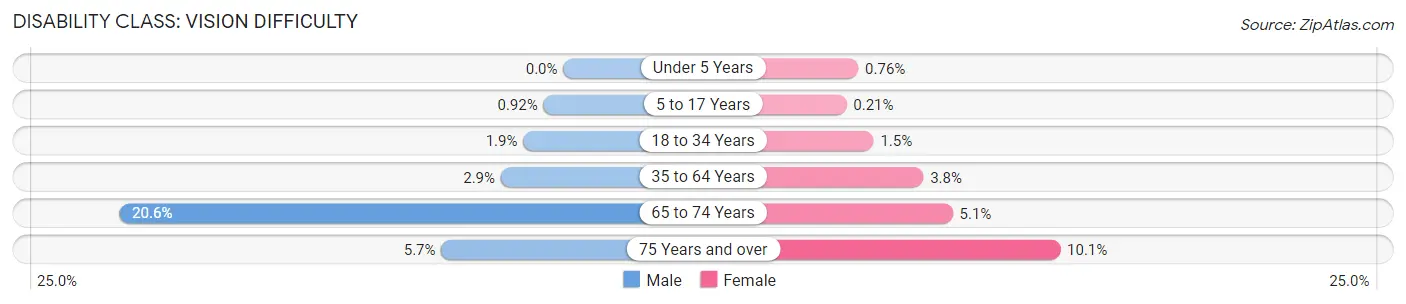
| Age Bracket | Male | Female |
| Under 5 Years | 0 (0.0%) | 24 (0.8%) |
| 5 to 17 Years | 54 (0.9%) | 12 (0.2%) |
| 18 to 34 Years | 144 (1.9%) | 127 (1.5%) |
| 35 to 64 Years | 240 (2.9%) | 360 (3.8%) |
| 65 to 74 Years | 385 (20.6%) | 110 (5.1%) |
| 75 Years and over | 51 (5.7%) | 129 (10.1%) |
Disability Class: Cognitive Difficulty
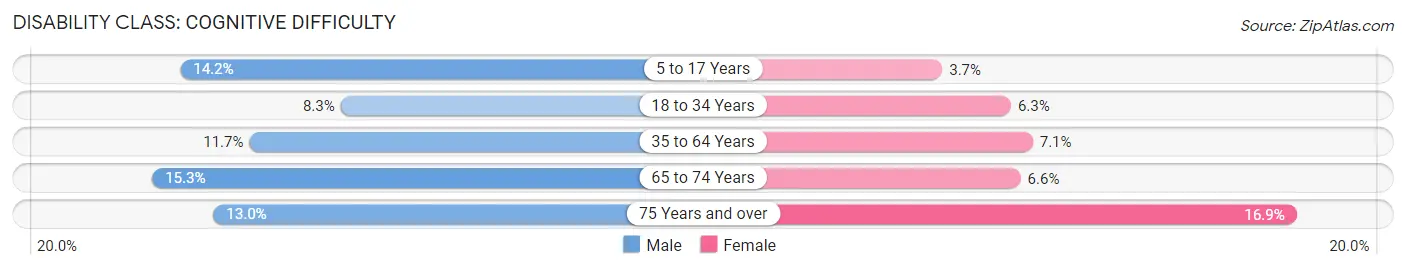
| Age Bracket | Male | Female |
| 5 to 17 Years | 834 (14.2%) | 213 (3.7%) |
| 18 to 34 Years | 641 (8.3%) | 543 (6.3%) |
| 35 to 64 Years | 966 (11.7%) | 676 (7.1%) |
| 65 to 74 Years | 285 (15.3%) | 142 (6.6%) |
| 75 Years and over | 117 (13.0%) | 215 (16.9%) |
Disability Class: Ambulatory Difficulty
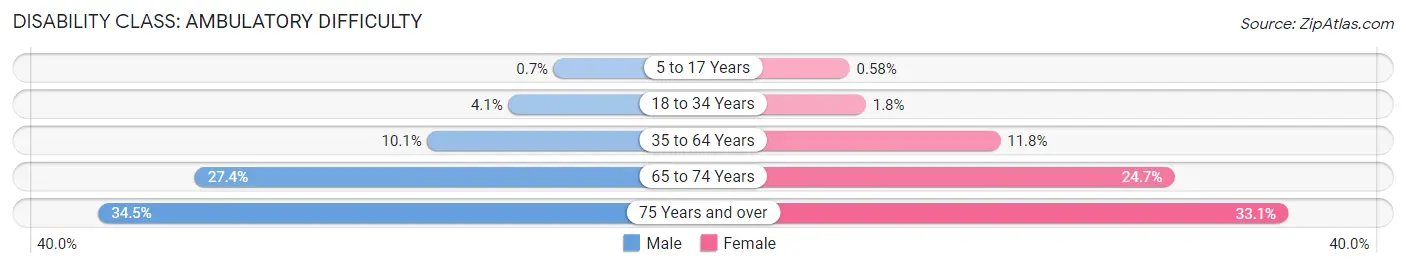
| Age Bracket | Male | Female |
| 5 to 17 Years | 41 (0.7%) | 33 (0.6%) |
| 18 to 34 Years | 315 (4.1%) | 154 (1.8%) |
| 35 to 64 Years | 835 (10.1%) | 1,122 (11.8%) |
| 65 to 74 Years | 511 (27.4%) | 528 (24.7%) |
| 75 Years and over | 311 (34.5%) | 422 (33.1%) |
Disability Class: Self-Care Difficulty
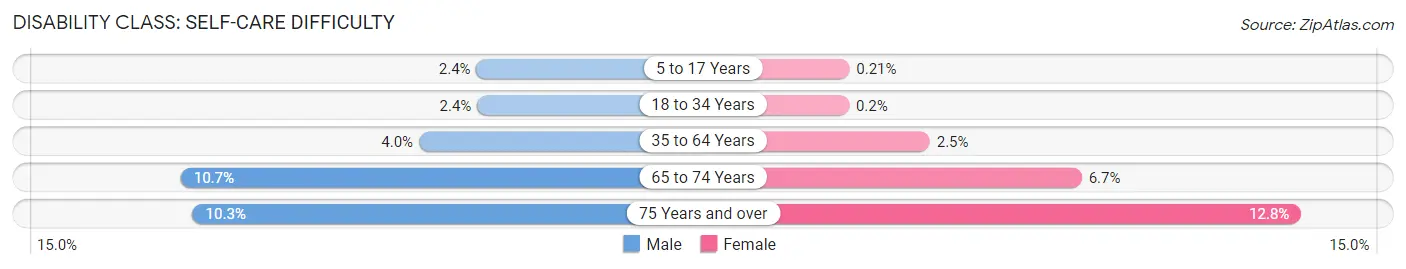
| Age Bracket | Male | Female |
| 5 to 17 Years | 142 (2.4%) | 12 (0.2%) |
| 18 to 34 Years | 186 (2.4%) | 17 (0.2%) |
| 35 to 64 Years | 333 (4.0%) | 234 (2.5%) |
| 65 to 74 Years | 199 (10.6%) | 143 (6.7%) |
| 75 Years and over | 93 (10.3%) | 163 (12.8%) |
Technology Access in Liberty County
Computing Device Access in Liberty County
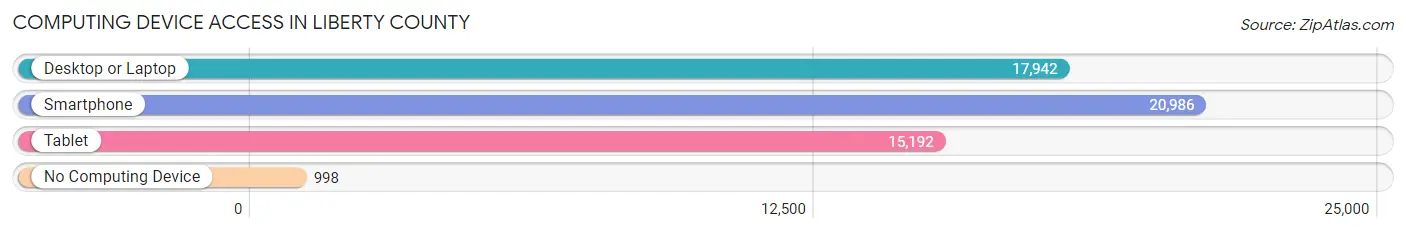
| Device Type | # Households | % Households |
| Desktop or Laptop | 17,942 | 78.1% |
| Smartphone | 20,986 | 91.3% |
| Tablet | 15,192 | 66.1% |
| No Computing Device | 998 | 4.3% |
| Total | 22,975 | 100.0% |
Internet Access in Liberty County
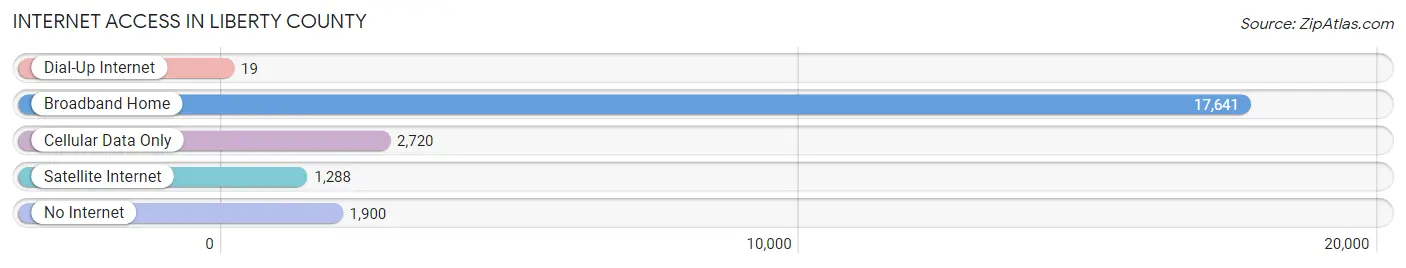
| Internet Type | # Households | % Households |
| Dial-Up Internet | 19 | 0.1% |
| Broadband Home | 17,641 | 76.8% |
| Cellular Data Only | 2,720 | 11.8% |
| Satellite Internet | 1,288 | 5.6% |
| No Internet | 1,900 | 8.3% |
| Total | 22,975 | 100.0% |
Liberty County Summary
Liberty County is a county located in the southeastern part of the U.S. state of Georgia. As of the 2010 census, the population was 63,453. The county seat is Hinesville. Liberty County is part of the Hinesville-Fort Stewart, GA Metropolitan Statistical Area.
History
Liberty County was created on December 15, 1777, from a portion of McIntosh County. It was named for the popular American ideal of liberty. The county was organized in 1784.
Geography
Liberty County is located in the southeastern part of Georgia, along the Atlantic Ocean. It is bordered by Long County to the north, McIntosh County to the east, Bryan County to the south, and Chatham County to the west. The county has a total area of 576 square miles, of which 545 square miles is land and 31 square miles (5.4%) is water.
Economy
The economy of Liberty County is largely based on the military presence in the area. Fort Stewart, located in the county, is the largest Army installation east of the Mississippi River. The military presence has led to a large number of businesses in the area, including retail stores, restaurants, and other services.
The county also has a large agricultural sector, with crops such as corn, soybeans, and cotton being grown in the area. The county also has a large timber industry, with pine and hardwood trees being harvested for lumber.
Demographics
As of the 2010 census, there were 63,453 people, 19,845 households, and 15,845 families residing in the county. The population density was 116 people per square mile. There were 22,845 housing units at an average density of 42 per square mile. The racial makeup of the county was 57.2% White, 33.3% Black or African American, 0.6% Native American, 1.7% Asian, 0.1% Pacific Islander, 4.7% from other races, and 2.4% from two or more races. 8.7% of the population were Hispanic or Latino of any race.
The median income for a household in the county was $41,945, and the median income for a family was $50,945. The per capita income for the county was $20,945. About 11.2% of families and 14.2% of the population were below the poverty line, including 19.2% of those under age 18 and 10.2% of those age 65 or over.
Conclusion
Liberty County is a county located in the southeastern part of the U.S. state of Georgia. It was created in 1777 and is named for the popular American ideal of liberty. The county has a total area of 576 square miles, of which 545 square miles is land and 31 square miles (5.4%) is water. The economy of Liberty County is largely based on the military presence in the area, as well as agriculture and timber. As of the 2010 census, the population was 63,453. The median income for a household in the county was $41,945, and the median income for a family was $50,945.
Common Questions
What is Per Capita Income in Liberty County?
Per Capita income in Liberty County is $26,121.
What is the Median Family Income in Liberty County?
Median Family Income in Liberty County is $61,242.
What is the Median Household income in Liberty County?
Median Household Income in Liberty County is $55,149.
What is Income or Wage Gap in Liberty County?
Income or Wage Gap in Liberty County is 34.0%.
Women in Liberty County earn 66.0 cents for every dollar earned by a man.
What is Family Income Deficit in Liberty County?
Family Income Deficit in Liberty County is $11,650.
Families that are below poverty line in Liberty County earn $11,650 less on average than the poverty threshold level.
What is Inequality or Gini Index in Liberty County?
Inequality or Gini Index in Liberty County is 0.41.
What is the Total Population of Liberty County?
Total Population of Liberty County is 65,550.
What is the Total Male Population of Liberty County?
Total Male Population of Liberty County is 33,739.
What is the Total Female Population of Liberty County?
Total Female Population of Liberty County is 31,811.
What is the Ratio of Males per 100 Females in Liberty County?
There are 106.06 Males per 100 Females in Liberty County.
What is the Ratio of Females per 100 Males in Liberty County?
There are 94.29 Females per 100 Males in Liberty County.
What is the Median Population Age in Liberty County?
Median Population Age in Liberty County is 28.6 Years.
What is the Average Family Size in Liberty County
Average Family Size in Liberty County is 3.4 People.
What is the Average Household Size in Liberty County
Average Household Size in Liberty County is 2.8 People.
How Large is the Labor Force in Liberty County?
There are 32,651 People in the Labor Forcein in Liberty County.
What is the Percentage of People in the Labor Force in Liberty County?
66.6% of People are in the Labor Force in Liberty County.
What is the Unemployment Rate in Liberty County?
Unemployment Rate in Liberty County is 8.7%.