Jones County, GA Map & Demographics
Jones County Map
Jones County Overview
$31,934
PER CAPITA INCOME
$80,876
AVG FAMILY INCOME
$66,288
AVG HOUSEHOLD INCOME
25.6%
WAGE / INCOME GAP [ % ]
74.4¢/ $1
WAGE / INCOME GAP [ $ ]
$12,475
FAMILY INCOME DEFICIT
0.45
INEQUALITY / GINI INDEX
28,382
TOTAL POPULATION
13,905
MALE POPULATION
14,477
FEMALE POPULATION
96.05
MALES / 100 FEMALES
104.11
FEMALES / 100 MALES
41.3
MEDIAN AGE
3.2
AVG FAMILY SIZE
2.7
AVG HOUSEHOLD SIZE
13,276
LABOR FORCE [ PEOPLE ]
58.4%
PERCENT IN LABOR FORCE
4.3%
UNEMPLOYMENT RATE
Jones County Area Codes
Income in Jones County
Income Overview in Jones County
Per Capita Income in Jones County is $31,934, while median incomes of families and households are $80,876 and $66,288 respectively.
| Characteristic | Number | Measure |
| Per Capita Income | 28,382 | $31,934 |
| Median Family Income | 7,435 | $80,876 |
| Mean Family Income | 7,435 | $98,061 |
| Median Household Income | 10,581 | $66,288 |
| Mean Household Income | 10,581 | $83,629 |
| Income Deficit | 7,435 | $12,475 |
| Wage / Income Gap (%) | 28,382 | 25.61% |
| Wage / Income Gap ($) | 28,382 | 74.39¢ per $1 |
| Gini / Inequality Index | 28,382 | 0.45 |
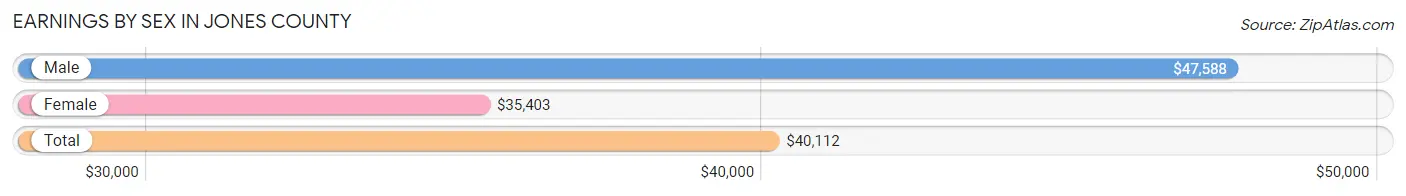
Earnings by Sex in Jones County
Average Earnings in Jones County are $40,112, $47,588 for men and $35,403 for women, a difference of 25.6%.
| Sex | Number | Average Earnings |
| Male | 6,816 (49.4%) | $47,588 |
| Female | 6,980 (50.6%) | $35,403 |
| Total | 13,796 (100.0%) | $40,112 |
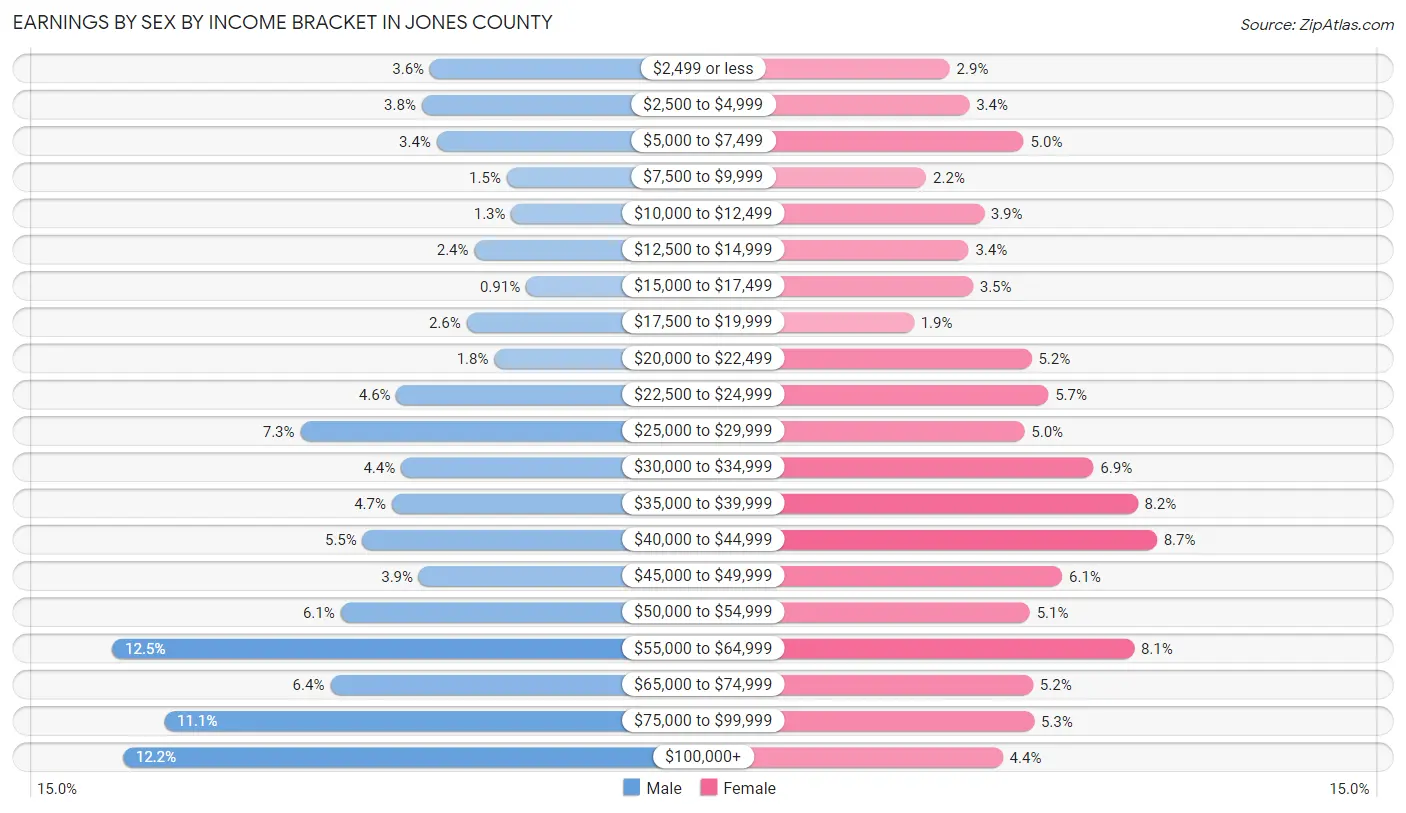
Earnings by Sex by Income Bracket in Jones County
The most common earnings brackets in Jones County are $55,000 to $64,999 for men (855 | 12.5%) and $40,000 to $44,999 for women (608 | 8.7%).
| Income | Male | Female |
| $2,499 or less | 246 (3.6%) | 202 (2.9%) |
| $2,500 to $4,999 | 262 (3.8%) | 240 (3.4%) |
| $5,000 to $7,499 | 233 (3.4%) | 347 (5.0%) |
| $7,500 to $9,999 | 99 (1.5%) | 156 (2.2%) |
| $10,000 to $12,499 | 90 (1.3%) | 269 (3.8%) |
| $12,500 to $14,999 | 161 (2.4%) | 239 (3.4%) |
| $15,000 to $17,499 | 62 (0.9%) | 247 (3.5%) |
| $17,500 to $19,999 | 176 (2.6%) | 131 (1.9%) |
| $20,000 to $22,499 | 123 (1.8%) | 362 (5.2%) |
| $22,500 to $24,999 | 310 (4.5%) | 395 (5.7%) |
| $25,000 to $29,999 | 494 (7.2%) | 348 (5.0%) |
| $30,000 to $34,999 | 301 (4.4%) | 484 (6.9%) |
| $35,000 to $39,999 | 319 (4.7%) | 570 (8.2%) |
| $40,000 to $44,999 | 375 (5.5%) | 608 (8.7%) |
| $45,000 to $49,999 | 267 (3.9%) | 422 (6.0%) |
| $50,000 to $54,999 | 417 (6.1%) | 359 (5.1%) |
| $55,000 to $64,999 | 855 (12.5%) | 563 (8.1%) |
| $65,000 to $74,999 | 437 (6.4%) | 365 (5.2%) |
| $75,000 to $99,999 | 755 (11.1%) | 367 (5.3%) |
| $100,000+ | 834 (12.2%) | 306 (4.4%) |
| Total | 6,816 (100.0%) | 6,980 (100.0%) |
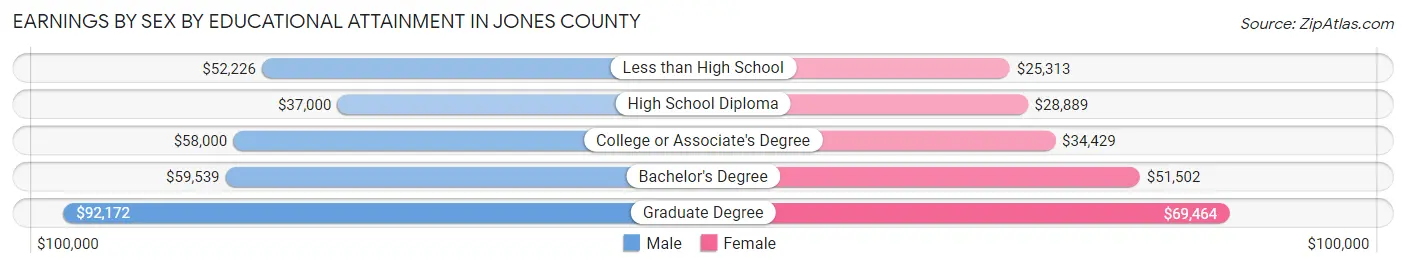
Earnings by Sex by Educational Attainment in Jones County
Average earnings in Jones County are $54,000 for men and $37,165 for women, a difference of 31.2%. Men with an educational attainment of graduate degree enjoy the highest average annual earnings of $92,172, while those with high school diploma education earn the least with $37,000. Women with an educational attainment of graduate degree earn the most with the average annual earnings of $69,464, while those with less than high school education have the smallest earnings of $25,313.
| Educational Attainment | Male Income | Female Income |
| Less than High School | $52,226 | $25,313 |
| High School Diploma | $37,000 | $28,889 |
| College or Associate's Degree | $58,000 | $34,429 |
| Bachelor's Degree | $59,539 | $51,502 |
| Graduate Degree | $92,172 | $69,464 |
| Total | $54,000 | $37,165 |
Family Income in Jones County
Family Income Brackets in Jones County
According to the Jones County family income data, there are 1,732 families falling into the $100,000 to $149,999 income range, which is the most common income bracket and makes up 23.3% of all families. Conversely, the $10,000 to $14,999 income bracket is the least frequent group with only 74 families (1.0%) belonging to this category.
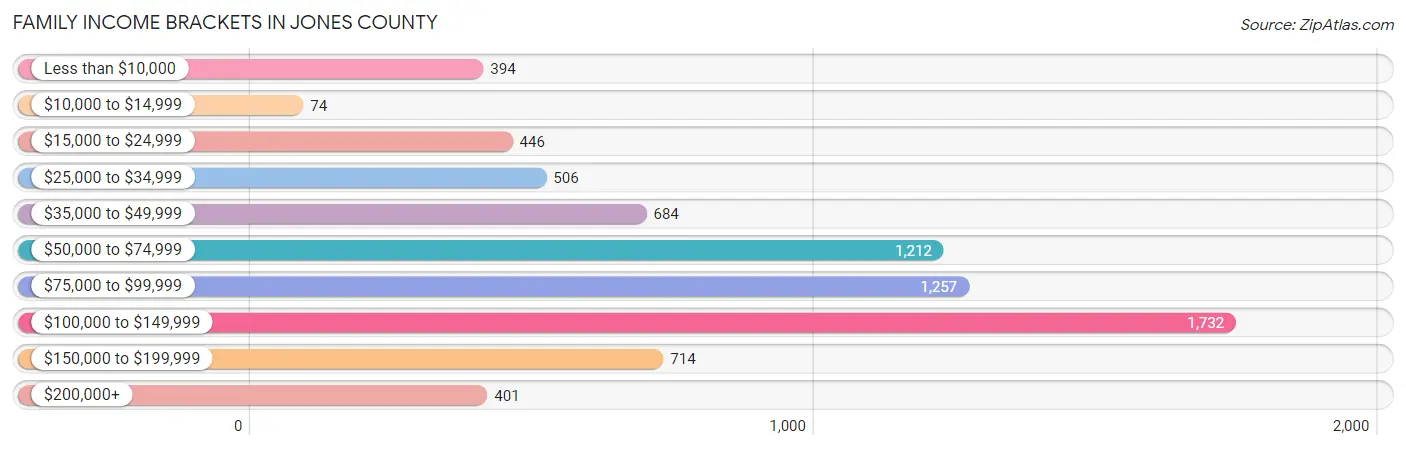
| Income Bracket | # Families | % Families |
| Less than $10,000 | 394 | 5.3% |
| $10,000 to $14,999 | 74 | 1.0% |
| $15,000 to $24,999 | 446 | 6.0% |
| $25,000 to $34,999 | 506 | 6.8% |
| $35,000 to $49,999 | 684 | 9.2% |
| $50,000 to $74,999 | 1,212 | 16.3% |
| $75,000 to $99,999 | 1,257 | 16.9% |
| $100,000 to $149,999 | 1,732 | 23.3% |
| $150,000 to $199,999 | 714 | 9.6% |
| $200,000+ | 401 | 5.4% |
Family Income by Famaliy Size in Jones County
6-person families (298 | 4.0%) account for the highest median family income in Jones County with $145,641 per family, while 2-person families (3,558 | 47.8%) have the highest median income of $36,035 per family member.
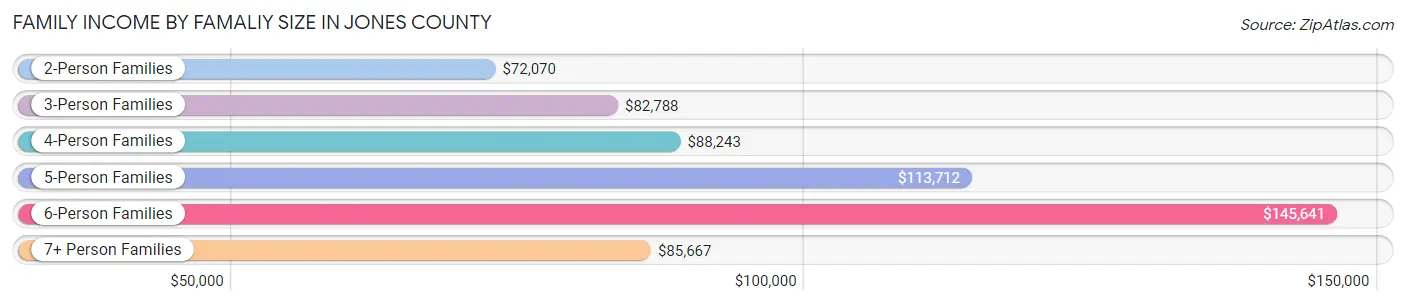
| Income Bracket | # Families | Median Income |
| 2-Person Families | 3,558 (47.8%) | $72,070 |
| 3-Person Families | 1,287 (17.3%) | $82,788 |
| 4-Person Families | 1,522 (20.5%) | $88,243 |
| 5-Person Families | 650 (8.7%) | $113,712 |
| 6-Person Families | 298 (4.0%) | $145,641 |
| 7+ Person Families | 120 (1.6%) | $85,667 |
| Total | 7,435 (100.0%) | $80,876 |
Family Income by Number of Earners in Jones County
The median family income in Jones County is $80,876, with families comprising 3+ earners (860) having the highest median family income of $118,750, while families with no earners (1,597) have the lowest median family income of $39,076, accounting for 11.6% and 21.5% of families, respectively.
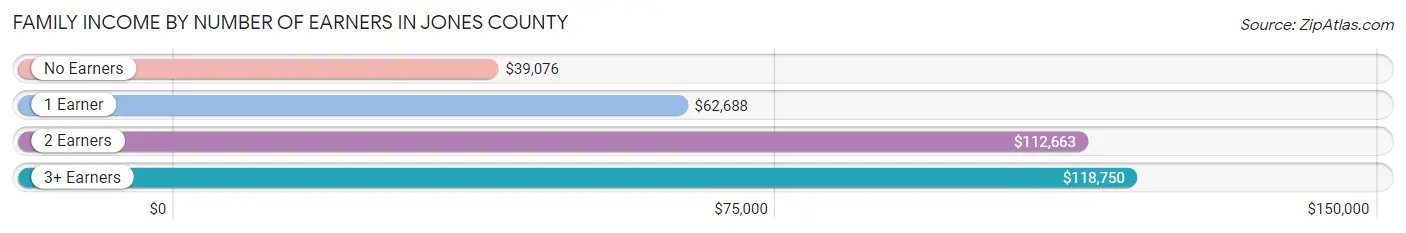
| Number of Earners | # Families | Median Income |
| No Earners | 1,597 (21.5%) | $39,076 |
| 1 Earner | 1,995 (26.8%) | $62,688 |
| 2 Earners | 2,983 (40.1%) | $112,663 |
| 3+ Earners | 860 (11.6%) | $118,750 |
| Total | 7,435 (100.0%) | $80,876 |
Household Income in Jones County
Household Income Brackets in Jones County
With 1,936 households falling in the category, the $100,000 to $149,999 income range is the most frequent in Jones County, accounting for 18.3% of all households. In contrast, only 349 households (3.3%) fall into the $10,000 to $14,999 income bracket, making it the least populous group.
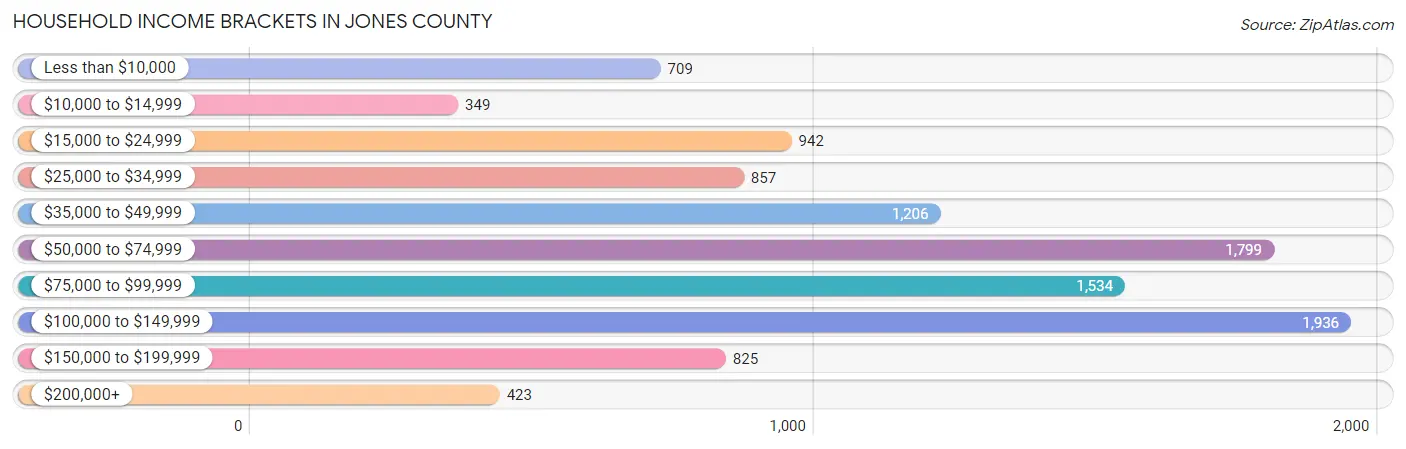
| Income Bracket | # Households | % Households |
| Less than $10,000 | 709 | 6.7% |
| $10,000 to $14,999 | 349 | 3.3% |
| $15,000 to $24,999 | 942 | 8.9% |
| $25,000 to $34,999 | 857 | 8.1% |
| $35,000 to $49,999 | 1,206 | 11.4% |
| $50,000 to $74,999 | 1,799 | 17.0% |
| $75,000 to $99,999 | 1,534 | 14.5% |
| $100,000 to $149,999 | 1,936 | 18.3% |
| $150,000 to $199,999 | 825 | 7.8% |
| $200,000+ | 423 | 4.0% |
Household Income by Householder Age in Jones County
The median household income in Jones County is $66,288, with the highest median household income of $81,181 found in the 45 to 64 years age bracket for the primary householder. A total of 4,028 households (38.1%) fall into this category. Meanwhile, the 15 to 24 years age bracket for the primary householder has the lowest median household income of $46,424, with 400 households (3.8%) in this group.
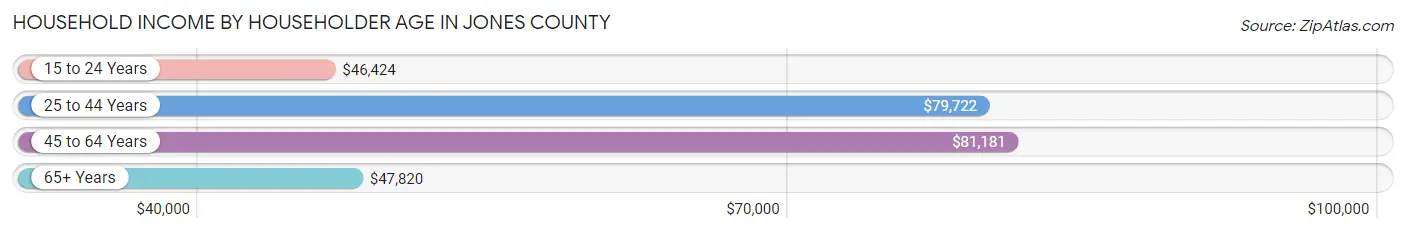
| Income Bracket | # Households | Median Income |
| 15 to 24 Years | 400 (3.8%) | $46,424 |
| 25 to 44 Years | 2,948 (27.9%) | $79,722 |
| 45 to 64 Years | 4,028 (38.1%) | $81,181 |
| 65+ Years | 3,205 (30.3%) | $47,820 |
| Total | 10,581 (100.0%) | $66,288 |
Poverty in Jones County
Income Below Poverty by Sex and Age in Jones County
With 14.7% poverty level for males and 13.9% for females among the residents of Jones County, 6 to 11 year old males and under 5 year old females are the most vulnerable to poverty, with 267 males (25.6%) and 244 females (37.2%) in their respective age groups living below the poverty level.
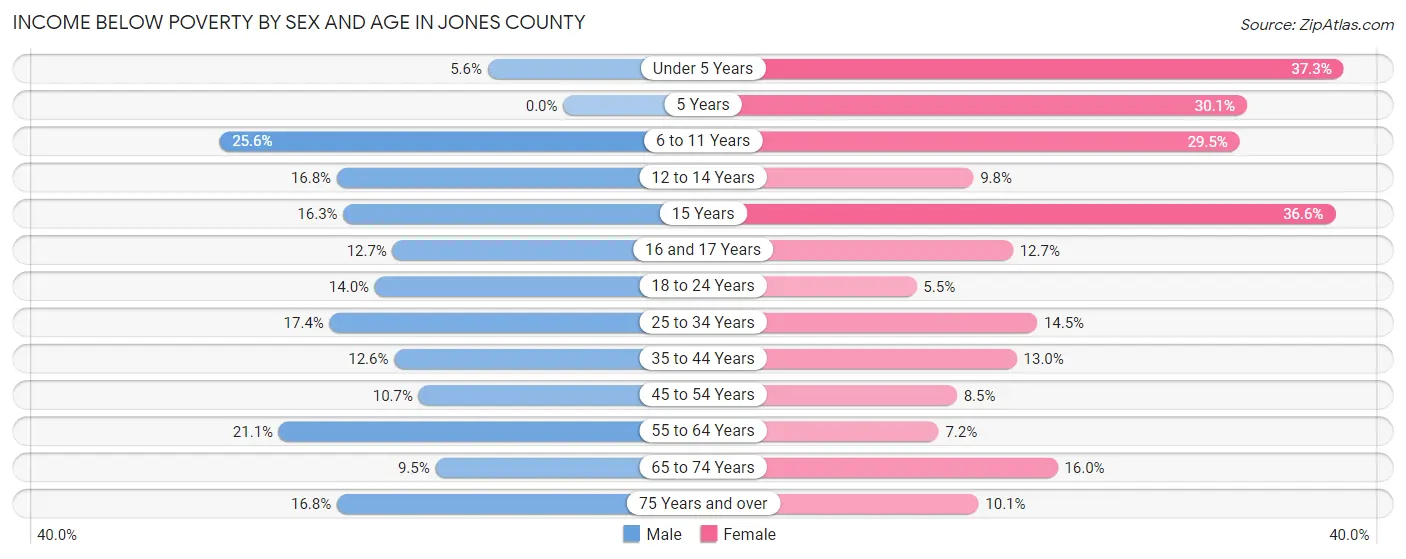
| Age Bracket | Male | Female |
| Under 5 Years | 45 (5.6%) | 244 (37.2%) |
| 5 Years | 0 (0.0%) | 46 (30.1%) |
| 6 to 11 Years | 267 (25.6%) | 280 (29.5%) |
| 12 to 14 Years | 95 (16.8%) | 68 (9.8%) |
| 15 Years | 57 (16.3%) | 74 (36.6%) |
| 16 and 17 Years | 37 (12.7%) | 58 (12.7%) |
| 18 to 24 Years | 174 (14.0%) | 58 (5.5%) |
| 25 to 34 Years | 276 (17.3%) | 228 (14.5%) |
| 35 to 44 Years | 214 (12.6%) | 265 (13.0%) |
| 45 to 54 Years | 201 (10.7%) | 159 (8.5%) |
| 55 to 64 Years | 388 (21.1%) | 140 (7.2%) |
| 65 to 74 Years | 136 (9.5%) | 260 (16.0%) |
| 75 Years and over | 127 (16.8%) | 119 (10.1%) |
| Total | 2,017 (14.7%) | 1,999 (13.9%) |
Income Above Poverty by Sex and Age in Jones County
According to the poverty statistics in Jones County, males aged 5 years and females aged 18 to 24 years are the age groups that are most secure financially, with 100.0% of males and 94.5% of females in these age groups living above the poverty line.
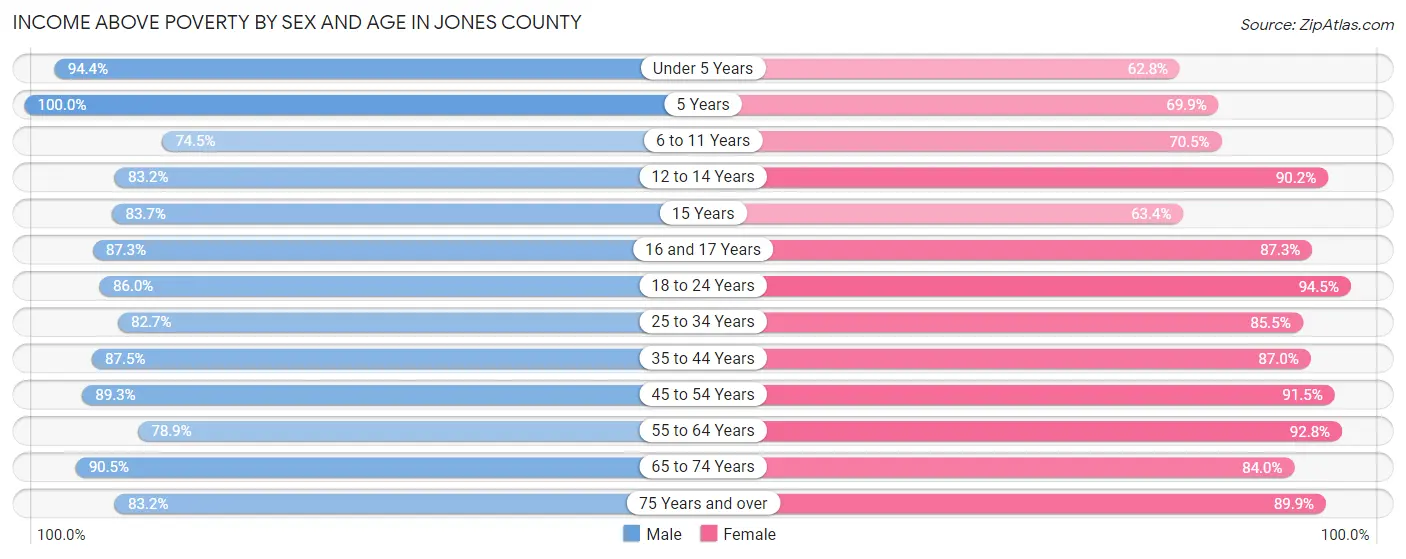
| Age Bracket | Male | Female |
| Under 5 Years | 757 (94.4%) | 411 (62.7%) |
| 5 Years | 222 (100.0%) | 107 (69.9%) |
| 6 to 11 Years | 778 (74.5%) | 668 (70.5%) |
| 12 to 14 Years | 470 (83.2%) | 629 (90.2%) |
| 15 Years | 292 (83.7%) | 128 (63.4%) |
| 16 and 17 Years | 255 (87.3%) | 399 (87.3%) |
| 18 to 24 Years | 1,070 (86.0%) | 988 (94.5%) |
| 25 to 34 Years | 1,315 (82.7%) | 1,346 (85.5%) |
| 35 to 44 Years | 1,491 (87.5%) | 1,776 (87.0%) |
| 45 to 54 Years | 1,673 (89.3%) | 1,704 (91.5%) |
| 55 to 64 Years | 1,449 (78.9%) | 1,811 (92.8%) |
| 65 to 74 Years | 1,297 (90.5%) | 1,364 (84.0%) |
| 75 Years and over | 629 (83.2%) | 1,055 (89.9%) |
| Total | 11,698 (85.3%) | 12,386 (86.1%) |
Income Below Poverty Among Married-Couple Families in Jones County
The poverty statistics for married-couple families in Jones County show that 6.4% or 369 of the total 5,795 families live below the poverty line. Families with 5 or more children have the highest poverty rate of 47.5%, comprising of 29 families. On the other hand, families with 1 or 2 children have the lowest poverty rate of 4.5%, which includes 77 families.
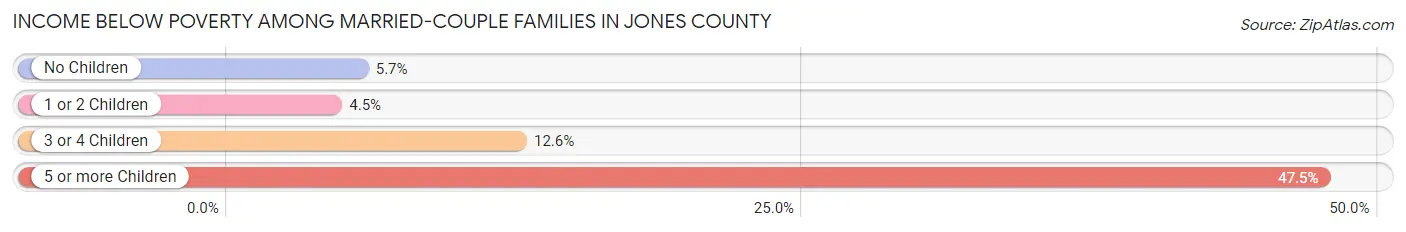
| Children | Above Poverty | Below Poverty |
| No Children | 3,350 (94.3%) | 202 (5.7%) |
| 1 or 2 Children | 1,620 (95.5%) | 77 (4.5%) |
| 3 or 4 Children | 424 (87.4%) | 61 (12.6%) |
| 5 or more Children | 32 (52.5%) | 29 (47.5%) |
| Total | 5,426 (93.6%) | 369 (6.4%) |
Income Below Poverty Among Single-Parent Households in Jones County
According to the poverty data in Jones County, 25.8% or 78 single-father households and 29.7% or 398 single-mother households are living below the poverty line. Among single-father households, those with 3 or 4 children have the highest poverty rate, with 30 households (44.1%) experiencing poverty. Likewise, among single-mother households, those with 3 or 4 children have the highest poverty rate, with 119 households (40.3%) falling below the poverty line.
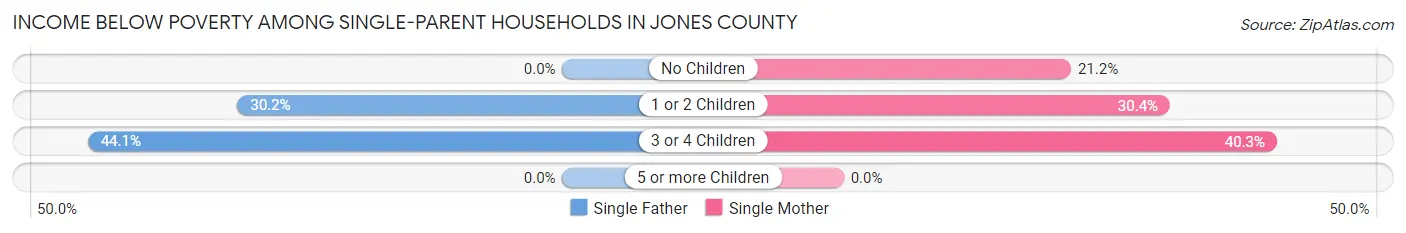
| Children | Single Father | Single Mother |
| No Children | 0 (0.0%) | 87 (21.2%) |
| 1 or 2 Children | 48 (30.2%) | 192 (30.4%) |
| 3 or 4 Children | 30 (44.1%) | 119 (40.3%) |
| 5 or more Children | 0 (0.0%) | 0 (0.0%) |
| Total | 78 (25.8%) | 398 (29.7%) |
Income Below Poverty Among Married-Couple vs Single-Parent Households in Jones County
The poverty data for Jones County shows that 369 of the married-couple family households (6.4%) and 476 of the single-parent households (29.0%) are living below the poverty level. Within the married-couple family households, those with 5 or more children have the highest poverty rate, with 29 households (47.5%) falling below the poverty line. Among the single-parent households, those with 3 or 4 children have the highest poverty rate, with 149 household (41.0%) living below poverty.
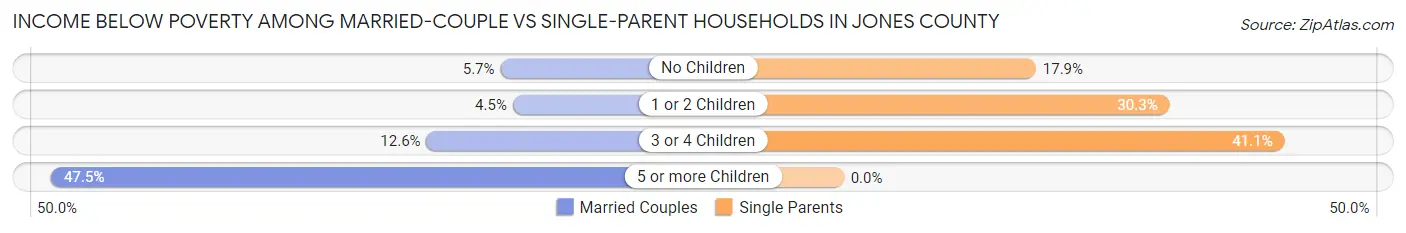
| Children | Married-Couple Families | Single-Parent Households |
| No Children | 202 (5.7%) | 87 (17.9%) |
| 1 or 2 Children | 77 (4.5%) | 240 (30.3%) |
| 3 or 4 Children | 61 (12.6%) | 149 (41.0%) |
| 5 or more Children | 29 (47.5%) | 0 (0.0%) |
| Total | 369 (6.4%) | 476 (29.0%) |
Race in Jones County
The most populous races in Jones County are White / Caucasian (20,237 | 71.3%), Black / African American (6,989 | 24.6%), and Two or more Races (842 | 3.0%).
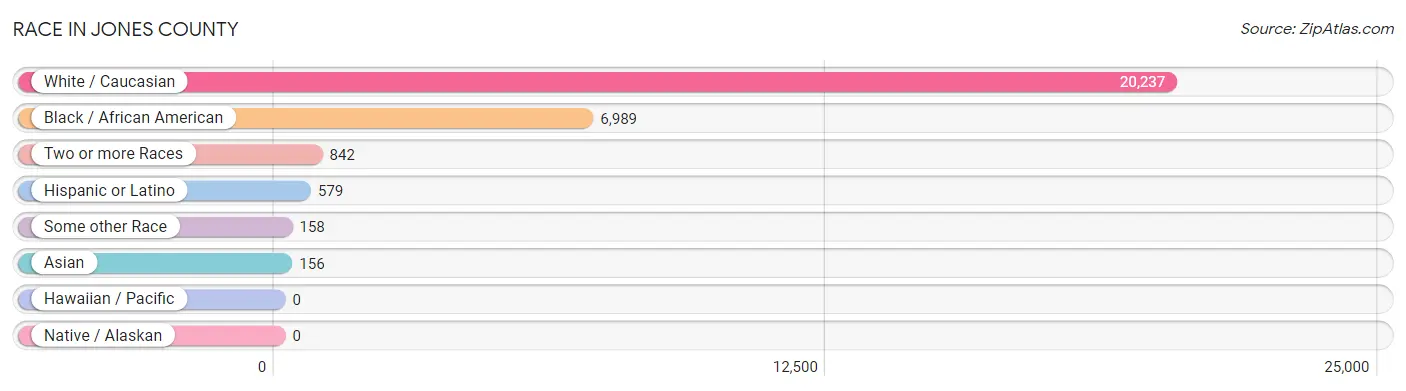
| Race | # Population | % Population |
| Asian | 156 | 0.5% |
| Black / African American | 6,989 | 24.6% |
| Hawaiian / Pacific | 0 | 0.0% |
| Hispanic or Latino | 579 | 2.0% |
| Native / Alaskan | 0 | 0.0% |
| White / Caucasian | 20,237 | 71.3% |
| Two or more Races | 842 | 3.0% |
| Some other Race | 158 | 0.6% |
| Total | 28,382 | 100.0% |
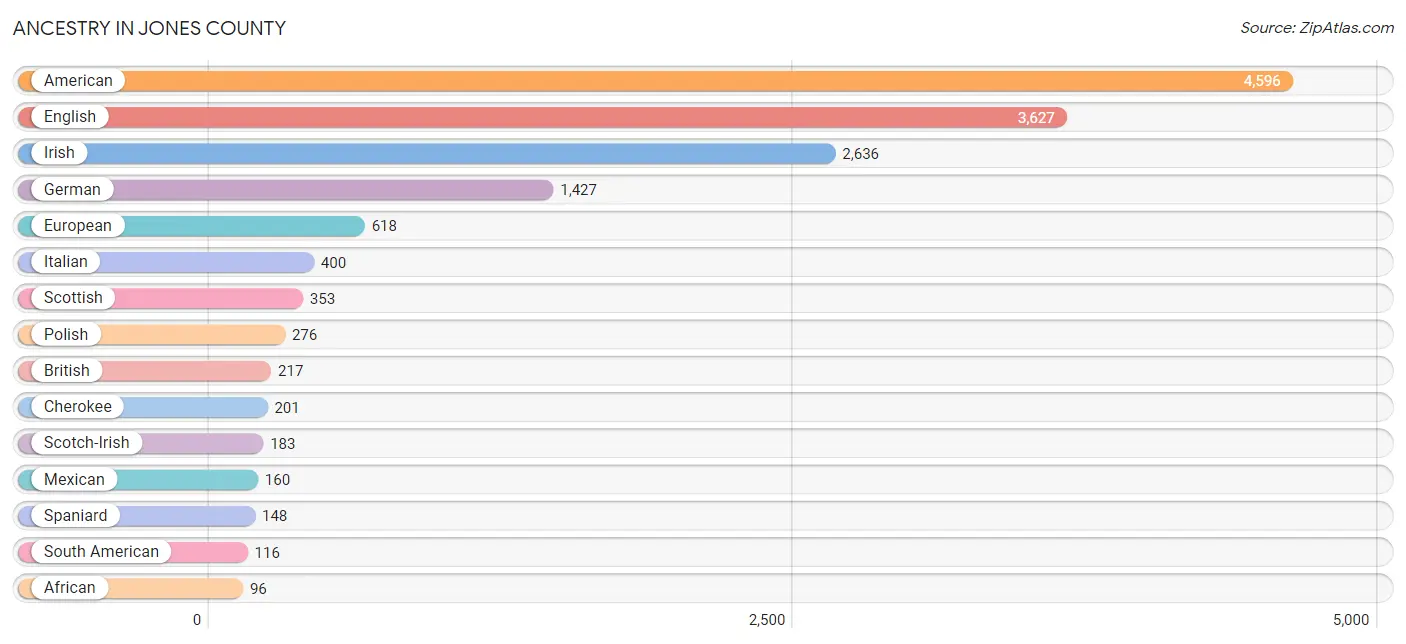
Ancestry in Jones County
The most populous ancestries reported in Jones County are American (4,596 | 16.2%), English (3,627 | 12.8%), Irish (2,636 | 9.3%), German (1,427 | 5.0%), and European (618 | 2.2%), together accounting for 45.5% of all Jones County residents.
| Ancestry | # Population | % Population |
| African | 96 | 0.3% |
| American | 4,596 | 16.2% |
| Arab | 71 | 0.3% |
| Blackfeet | 39 | 0.1% |
| Brazilian | 34 | 0.1% |
| British | 217 | 0.8% |
| Burmese | 4 | 0.0% |
| Canadian | 21 | 0.1% |
| Celtic | 22 | 0.1% |
| Central American | 62 | 0.2% |
| Cherokee | 201 | 0.7% |
| Choctaw | 14 | 0.1% |
| Colombian | 24 | 0.1% |
| Creek | 31 | 0.1% |
| Dutch | 76 | 0.3% |
| Eastern European | 16 | 0.1% |
| English | 3,627 | 12.8% |
| European | 618 | 2.2% |
| Finnish | 7 | 0.0% |
| French | 37 | 0.1% |
| French American Indian | 45 | 0.2% |
| French Canadian | 5 | 0.0% |
| German | 1,427 | 5.0% |
| Greek | 24 | 0.1% |
| Guyanese | 13 | 0.1% |
| Hungarian | 26 | 0.1% |
| Indian (Asian) | 23 | 0.1% |
| Irish | 2,636 | 9.3% |
| Italian | 400 | 1.4% |
| Jamaican | 8 | 0.0% |
| Korean | 36 | 0.1% |
| Lebanese | 18 | 0.1% |
| Lithuanian | 19 | 0.1% |
| Malaysian | 74 | 0.3% |
| Mexican | 160 | 0.6% |
| New Zealander | 42 | 0.2% |
| Norwegian | 45 | 0.2% |
| Palestinian | 53 | 0.2% |
| Peruvian | 92 | 0.3% |
| Polish | 276 | 1.0% |
| Portuguese | 41 | 0.1% |
| Puerto Rican | 93 | 0.3% |
| Salvadoran | 62 | 0.2% |
| Scandinavian | 33 | 0.1% |
| Scotch-Irish | 183 | 0.6% |
| Scottish | 353 | 1.2% |
| Sioux | 3 | 0.0% |
| Slovak | 14 | 0.1% |
| South American | 116 | 0.4% |
| Spaniard | 148 | 0.5% |
| Sri Lankan | 7 | 0.0% |
| Subsaharan African | 96 | 0.3% |
| Swedish | 15 | 0.1% |
| Thai | 24 | 0.1% |
| Welsh | 58 | 0.2% | View All 55 Rows |
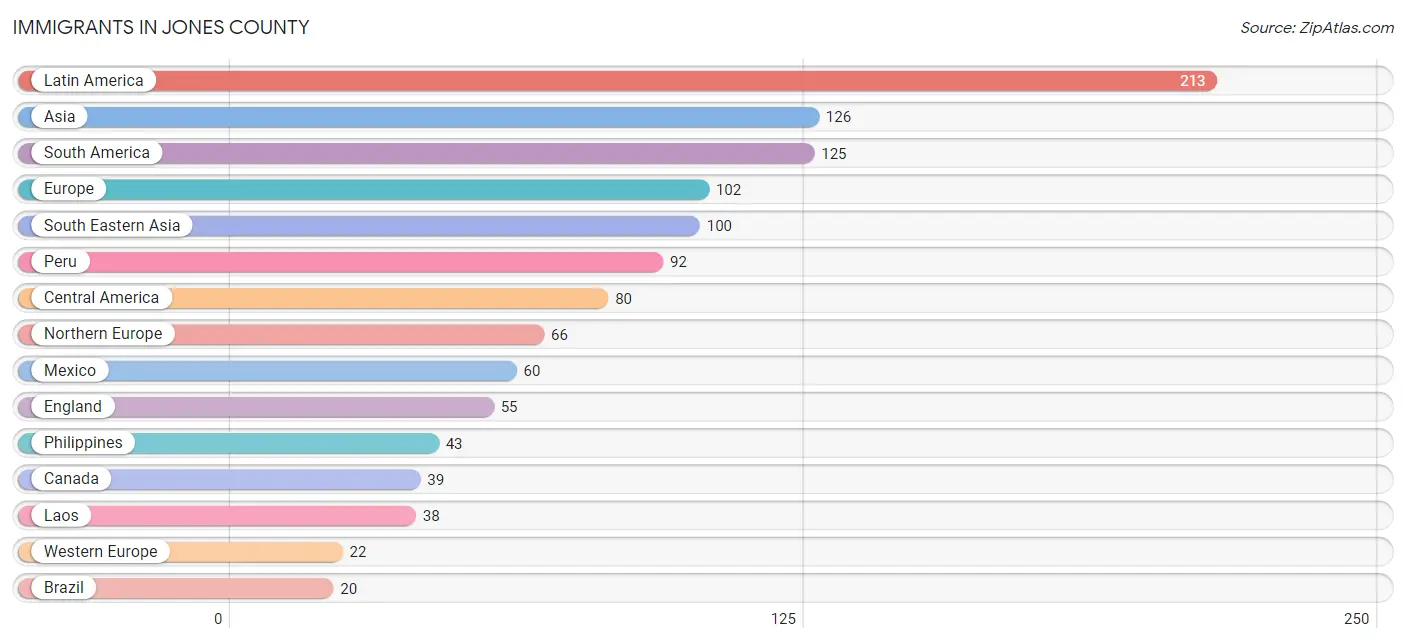
Immigrants in Jones County
The most numerous immigrant groups reported in Jones County came from Latin America (213 | 0.7%), Asia (126 | 0.4%), South America (125 | 0.4%), Europe (102 | 0.4%), and South Eastern Asia (100 | 0.4%), together accounting for 2.3% of all Jones County residents.
| Immigration Origin | # Population | % Population |
| Asia | 126 | 0.4% |
| Brazil | 20 | 0.1% |
| Canada | 39 | 0.1% |
| Caribbean | 8 | 0.0% |
| Central America | 80 | 0.3% |
| China | 17 | 0.1% |
| Eastern Asia | 17 | 0.1% |
| El Salvador | 20 | 0.1% |
| England | 55 | 0.2% |
| Europe | 102 | 0.4% |
| Germany | 12 | 0.0% |
| Guyana | 13 | 0.1% |
| India | 9 | 0.0% |
| Indonesia | 12 | 0.0% |
| Italy | 14 | 0.1% |
| Jamaica | 8 | 0.0% |
| Laos | 38 | 0.1% |
| Latin America | 213 | 0.7% |
| Mexico | 60 | 0.2% |
| Netherlands | 10 | 0.0% |
| Northern Europe | 66 | 0.2% |
| Oceania | 14 | 0.1% |
| Peru | 92 | 0.3% |
| Philippines | 43 | 0.2% |
| South America | 125 | 0.4% |
| South Central Asia | 9 | 0.0% |
| South Eastern Asia | 100 | 0.4% |
| Southern Europe | 14 | 0.1% |
| Vietnam | 7 | 0.0% |
| Western Europe | 22 | 0.1% | View All 30 Rows |
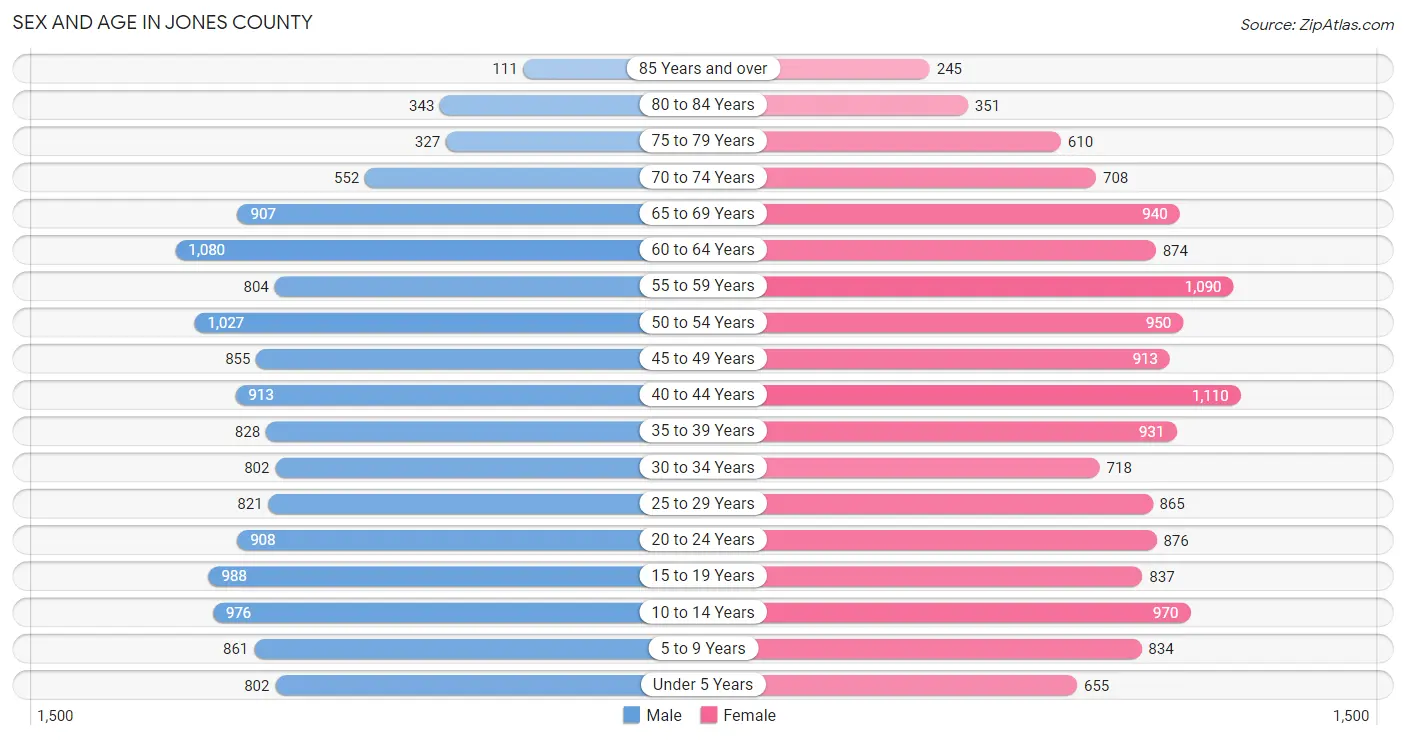
Sex and Age in Jones County
Sex and Age in Jones County
The most populous age groups in Jones County are 60 to 64 Years (1,080 | 7.8%) for men and 40 to 44 Years (1,110 | 7.7%) for women.
| Age Bracket | Male | Female |
| Under 5 Years | 802 (5.8%) | 655 (4.5%) |
| 5 to 9 Years | 861 (6.2%) | 834 (5.8%) |
| 10 to 14 Years | 976 (7.0%) | 970 (6.7%) |
| 15 to 19 Years | 988 (7.1%) | 837 (5.8%) |
| 20 to 24 Years | 908 (6.5%) | 876 (6.0%) |
| 25 to 29 Years | 821 (5.9%) | 865 (6.0%) |
| 30 to 34 Years | 802 (5.8%) | 718 (5.0%) |
| 35 to 39 Years | 828 (5.9%) | 931 (6.4%) |
| 40 to 44 Years | 913 (6.6%) | 1,110 (7.7%) |
| 45 to 49 Years | 855 (6.1%) | 913 (6.3%) |
| 50 to 54 Years | 1,027 (7.4%) | 950 (6.6%) |
| 55 to 59 Years | 804 (5.8%) | 1,090 (7.5%) |
| 60 to 64 Years | 1,080 (7.8%) | 874 (6.0%) |
| 65 to 69 Years | 907 (6.5%) | 940 (6.5%) |
| 70 to 74 Years | 552 (4.0%) | 708 (4.9%) |
| 75 to 79 Years | 327 (2.4%) | 610 (4.2%) |
| 80 to 84 Years | 343 (2.5%) | 351 (2.4%) |
| 85 Years and over | 111 (0.8%) | 245 (1.7%) |
| Total | 13,905 (100.0%) | 14,477 (100.0%) |
Families and Households in Jones County
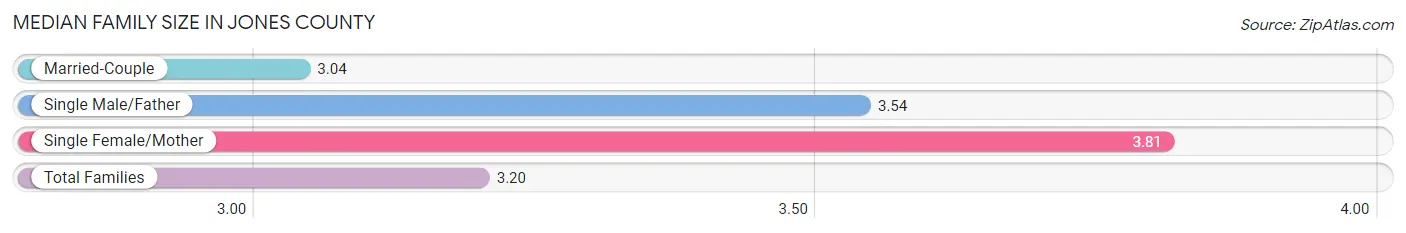
Median Family Size in Jones County
The median family size in Jones County is 3.20 persons per family, with single female/mother families (1,338 | 18.0%) accounting for the largest median family size of 3.81 persons per family. On the other hand, married-couple families (5,795 | 77.9%) represent the smallest median family size with 3.04 persons per family.
| Family Type | # Families | Family Size |
| Married-Couple | 5,795 (77.9%) | 3.04 |
| Single Male/Father | 302 (4.1%) | 3.54 |
| Single Female/Mother | 1,338 (18.0%) | 3.81 |
| Total Families | 7,435 (100.0%) | 3.20 |
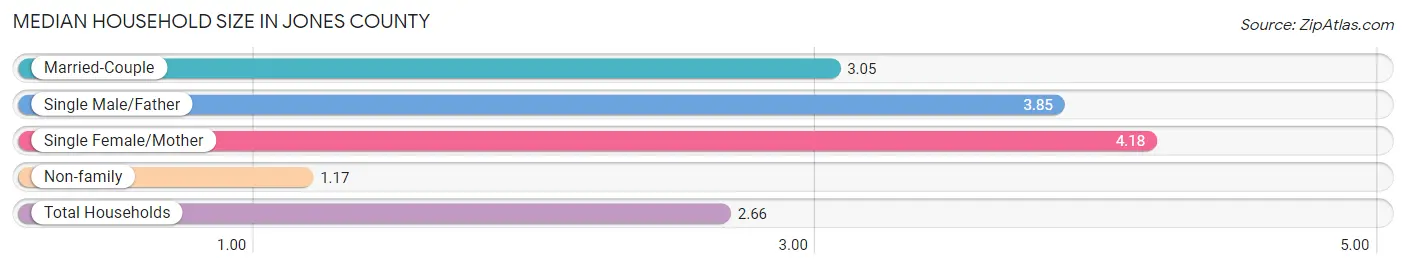
Median Household Size in Jones County
The median household size in Jones County is 2.66 persons per household, with single female/mother households (1,338 | 12.7%) accounting for the largest median household size of 4.18 persons per household. non-family households (3,146 | 29.7%) represent the smallest median household size with 1.17 persons per household.
| Household Type | # Households | Household Size |
| Married-Couple | 5,795 (54.8%) | 3.05 |
| Single Male/Father | 302 (2.9%) | 3.85 |
| Single Female/Mother | 1,338 (12.7%) | 4.18 |
| Non-family | 3,146 (29.7%) | 1.17 |
| Total Households | 10,581 (100.0%) | 2.66 |
Household Size by Marriage Status in Jones County
Out of a total of 10,581 households in Jones County, 7,435 (70.3%) are family households, while 3,146 (29.7%) are nonfamily households. The most numerous type of family households are 2-person households, comprising 3,419, and the most common type of nonfamily households are 1-person households, comprising 2,673.
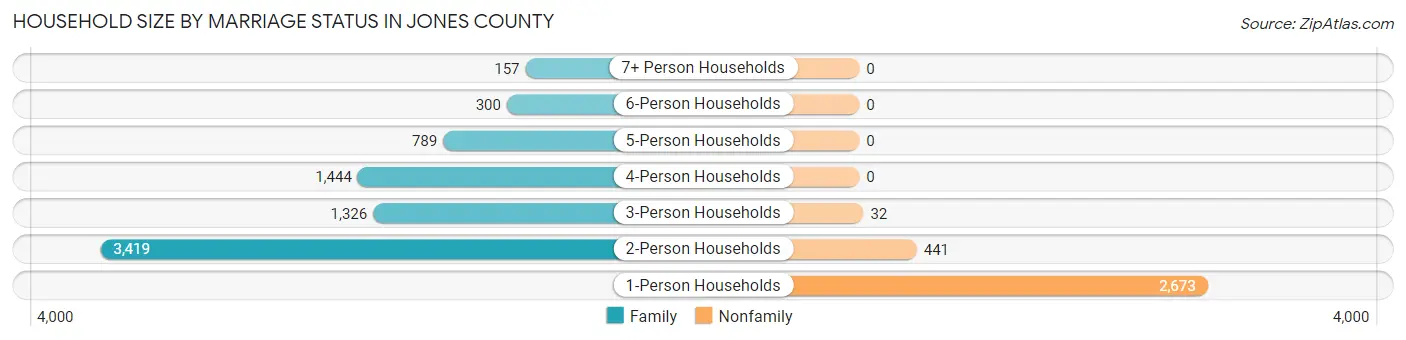
| Household Size | Family Households | Nonfamily Households |
| 1-Person Households | - | 2,673 (25.3%) |
| 2-Person Households | 3,419 (32.3%) | 441 (4.2%) |
| 3-Person Households | 1,326 (12.5%) | 32 (0.3%) |
| 4-Person Households | 1,444 (13.7%) | 0 (0.0%) |
| 5-Person Households | 789 (7.5%) | 0 (0.0%) |
| 6-Person Households | 300 (2.8%) | 0 (0.0%) |
| 7+ Person Households | 157 (1.5%) | 0 (0.0%) |
| Total | 7,435 (70.3%) | 3,146 (29.7%) |
Female Fertility in Jones County
Fertility by Age in Jones County
Average fertility rate in Jones County is 69.0 births per 1,000 women. Women in the age bracket of 20 to 34 years have the highest fertility rate with 122.0 births per 1,000 women. Women in the age bracket of 20 to 34 years acount for 68.3% of all women with births.
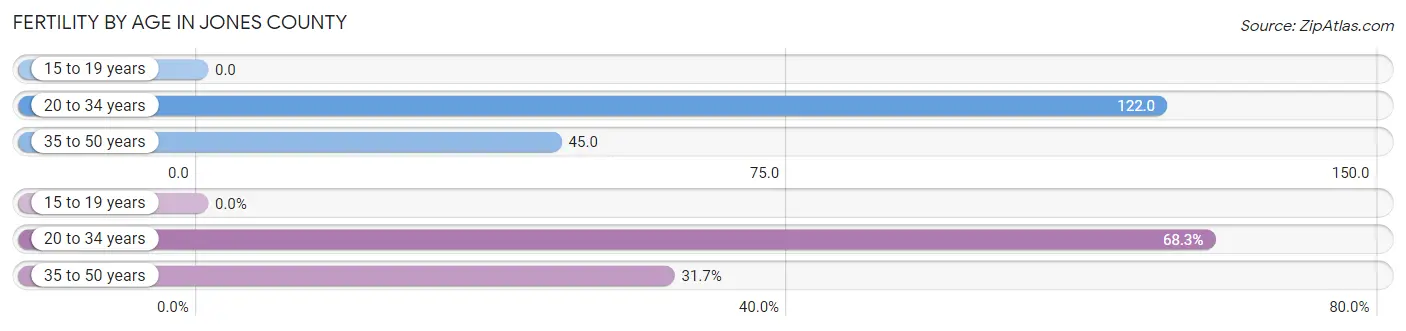
| Age Bracket | Women with Births | Births / 1,000 Women |
| 15 to 19 years | 0 (0.0%) | 0.0 |
| 20 to 34 years | 300 (68.3%) | 122.0 |
| 35 to 50 years | 139 (31.7%) | 45.0 |
| Total | 439 (100.0%) | 69.0 |
Fertility by Age by Marriage Status in Jones County
64.5% of women with births (439) in Jones County are married. The highest percentage of unmarried women with births falls into 35 to 50 years age bracket with 51.8% of them unmarried at the time of birth, while the lowest percentage of unmarried women with births belong to 20 to 34 years age bracket with 28.0% of them unmarried.
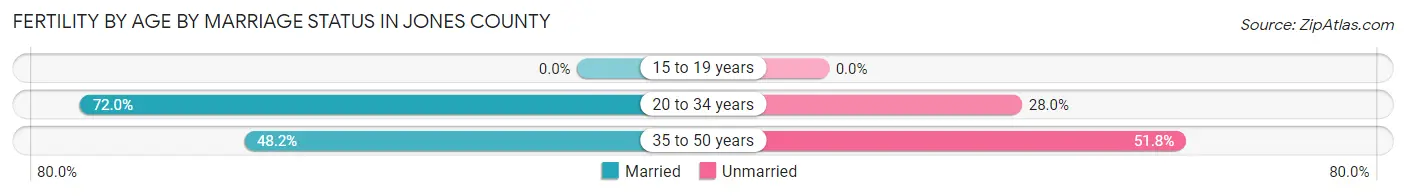
| Age Bracket | Married | Unmarried |
| 15 to 19 years | 0 (0.0%) | 0 (0.0%) |
| 20 to 34 years | 216 (72.0%) | 84 (28.0%) |
| 35 to 50 years | 67 (48.2%) | 72 (51.8%) |
| Total | 283 (64.5%) | 156 (35.5%) |
Fertility by Education in Jones County
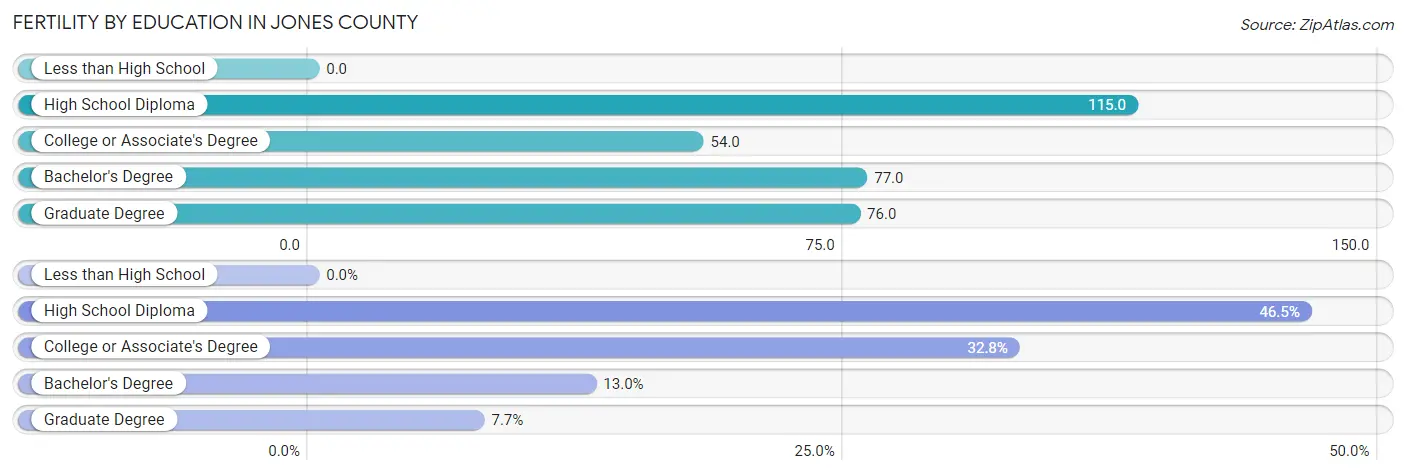
| Educational Attainment | Women with Births | Births / 1,000 Women |
| Less than High School | 0 (0.0%) | 0.0 |
| High School Diploma | 204 (46.5%) | 115.0 |
| College or Associate's Degree | 144 (32.8%) | 54.0 |
| Bachelor's Degree | 57 (13.0%) | 77.0 |
| Graduate Degree | 34 (7.7%) | 76.0 |
| Total | 439 (100.0%) | 69.0 |
Fertility by Education by Marriage Status in Jones County
35.5% of women with births in Jones County are unmarried. Women with the educational attainment of bachelor's degree are most likely to be married with 100.0% of them married at childbirth, while women with the educational attainment of college or associate's degree are least likely to be married with 64.6% of them unmarried at childbirth.
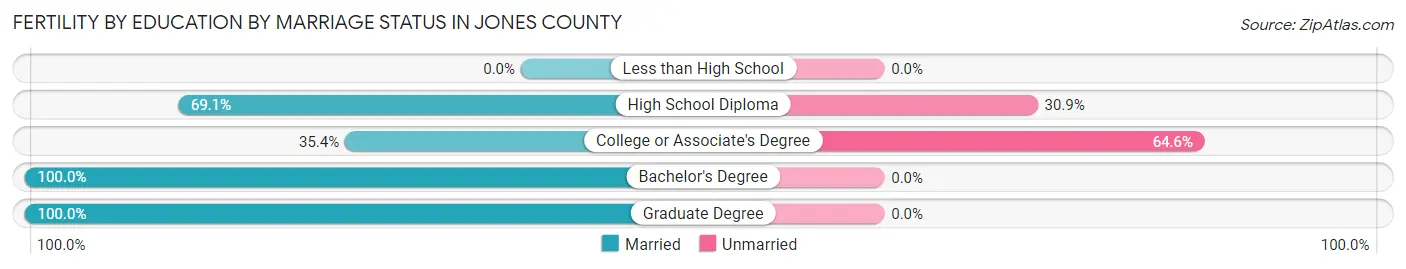
| Educational Attainment | Married | Unmarried |
| Less than High School | 0 (0.0%) | 0 (0.0%) |
| High School Diploma | 141 (69.1%) | 63 (30.9%) |
| College or Associate's Degree | 51 (35.4%) | 93 (64.6%) |
| Bachelor's Degree | 57 (100.0%) | 0 (0.0%) |
| Graduate Degree | 34 (100.0%) | 0 (0.0%) |
| Total | 283 (64.5%) | 156 (35.5%) |
Employment Characteristics in Jones County
Employment by Class of Employer in Jones County
Among the 12,627 employed individuals in Jones County, private company employees (8,692 | 68.8%), local government employees (1,338 | 10.6%), and not-for-profit organizations (603 | 4.8%) make up the most common classes of employment.
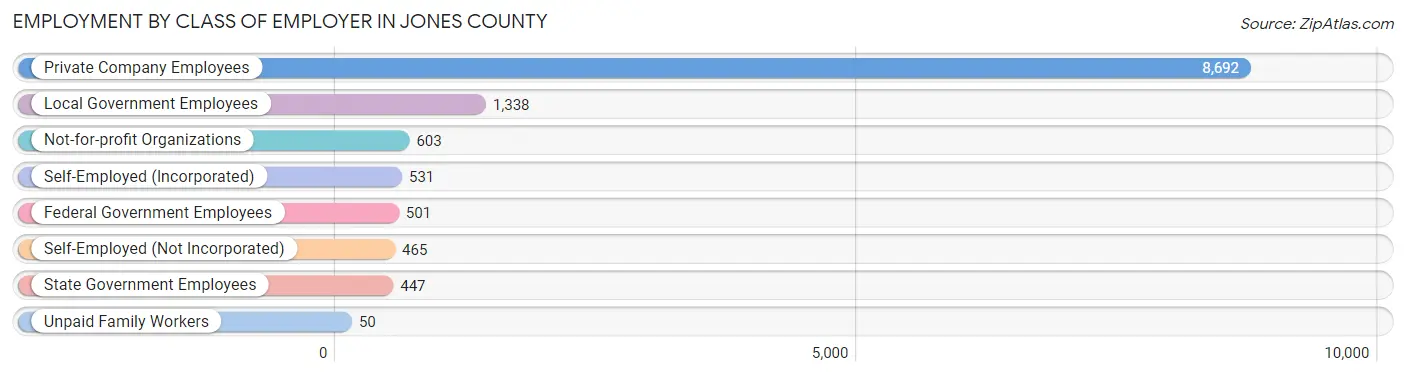
| Employer Class | # Employees | % Employees |
| Private Company Employees | 8,692 | 68.8% |
| Self-Employed (Incorporated) | 531 | 4.2% |
| Self-Employed (Not Incorporated) | 465 | 3.7% |
| Not-for-profit Organizations | 603 | 4.8% |
| Local Government Employees | 1,338 | 10.6% |
| State Government Employees | 447 | 3.5% |
| Federal Government Employees | 501 | 4.0% |
| Unpaid Family Workers | 50 | 0.4% |
| Total | 12,627 | 100.0% |
Employment Status by Age in Jones County
According to the labor force statistics for Jones County, out of the total population over 16 years of age (22,733), 58.4% or 13,276 individuals are in the labor force, with 4.3% or 571 of them unemployed. The age group with the highest labor force participation rate is 35 to 44 years, with 86.4% or 3,268 individuals in the labor force. Within the labor force, the 16 to 19 years age range has the highest percentage of unemployed individuals, with 11.0% or 37 of them being unemployed.
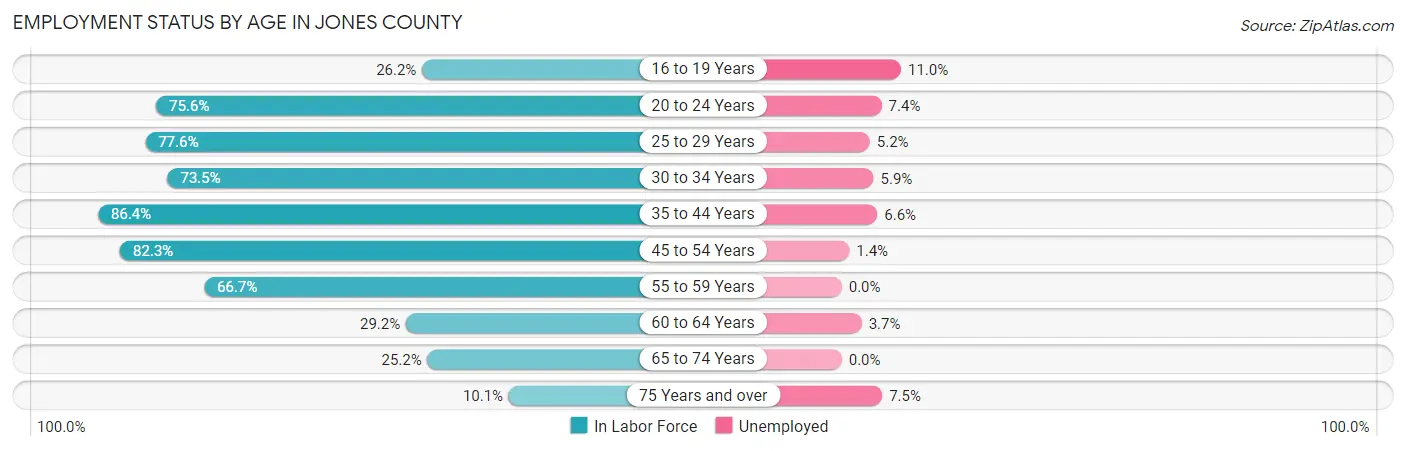
| Age Bracket | In Labor Force | Unemployed |
| 16 to 19 Years | 334 (26.2%) | 37 (11.0%) |
| 20 to 24 Years | 1,349 (75.6%) | 100 (7.4%) |
| 25 to 29 Years | 1,308 (77.6%) | 68 (5.2%) |
| 30 to 34 Years | 1,117 (73.5%) | 66 (5.9%) |
| 35 to 44 Years | 3,268 (86.4%) | 216 (6.6%) |
| 45 to 54 Years | 3,082 (82.3%) | 43 (1.4%) |
| 55 to 59 Years | 1,263 (66.7%) | 0 (0.0%) |
| 60 to 64 Years | 571 (29.2%) | 21 (3.7%) |
| 65 to 74 Years | 783 (25.2%) | 0 (0.0%) |
| 75 Years and over | 201 (10.1%) | 15 (7.5%) |
| Total | 13,276 (58.4%) | 571 (4.3%) |
Employment Status by Educational Attainment in Jones County
According to labor force statistics for Jones County, 72.7% of individuals (10,600) out of the total population between 25 and 64 years of age (14,581) are in the labor force, with 3.9% or 413 of them being unemployed. The group with the highest labor force participation rate are those with the educational attainment of bachelor's degree or higher, with 88.7% or 2,562 individuals in the labor force. Within the labor force, individuals with less than high school education have the highest percentage of unemployment, with 15.0% or 88 of them being unemployed.
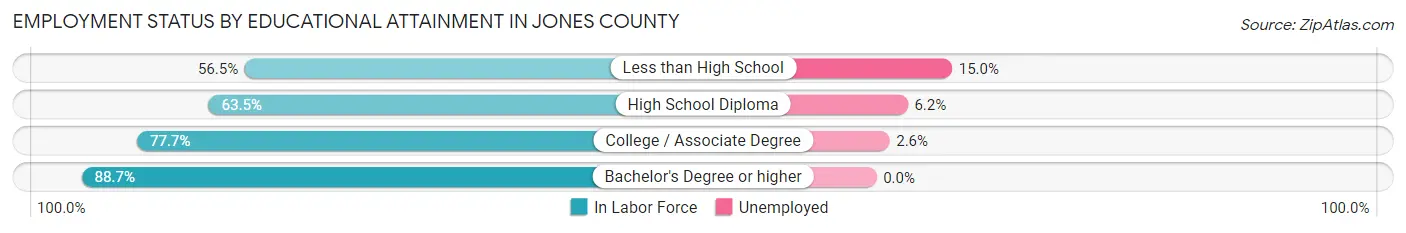
| Educational Attainment | In Labor Force | Unemployed |
| Less than High School | 585 (56.5%) | 155 (15.0%) |
| High School Diploma | 3,677 (63.5%) | 359 (6.2%) |
| College / Associate Degree | 3,782 (77.7%) | 127 (2.6%) |
| Bachelor's Degree or higher | 2,562 (88.7%) | 0 (0.0%) |
| Total | 10,600 (72.7%) | 569 (3.9%) |
Employment Occupations by Sex in Jones County
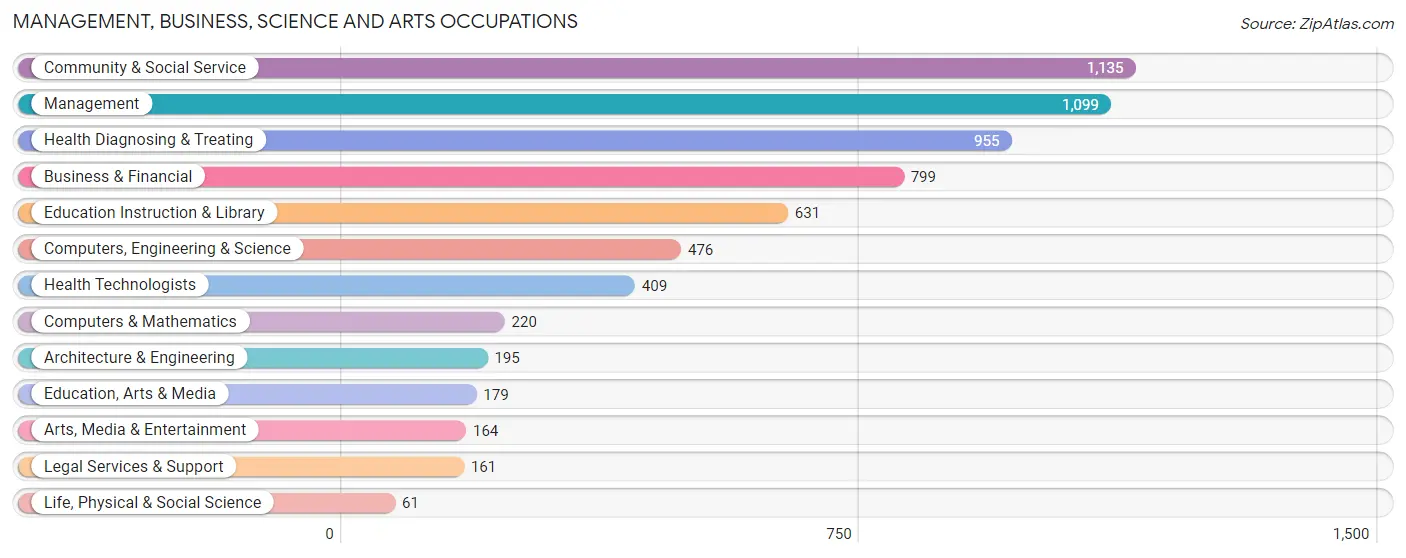
Management, Business, Science and Arts Occupations
The most common Management, Business, Science and Arts occupations in Jones County are Community & Social Service (1,135 | 8.9%), Management (1,099 | 8.7%), Health Diagnosing & Treating (955 | 7.5%), Business & Financial (799 | 6.3%), and Education Instruction & Library (631 | 5.0%).
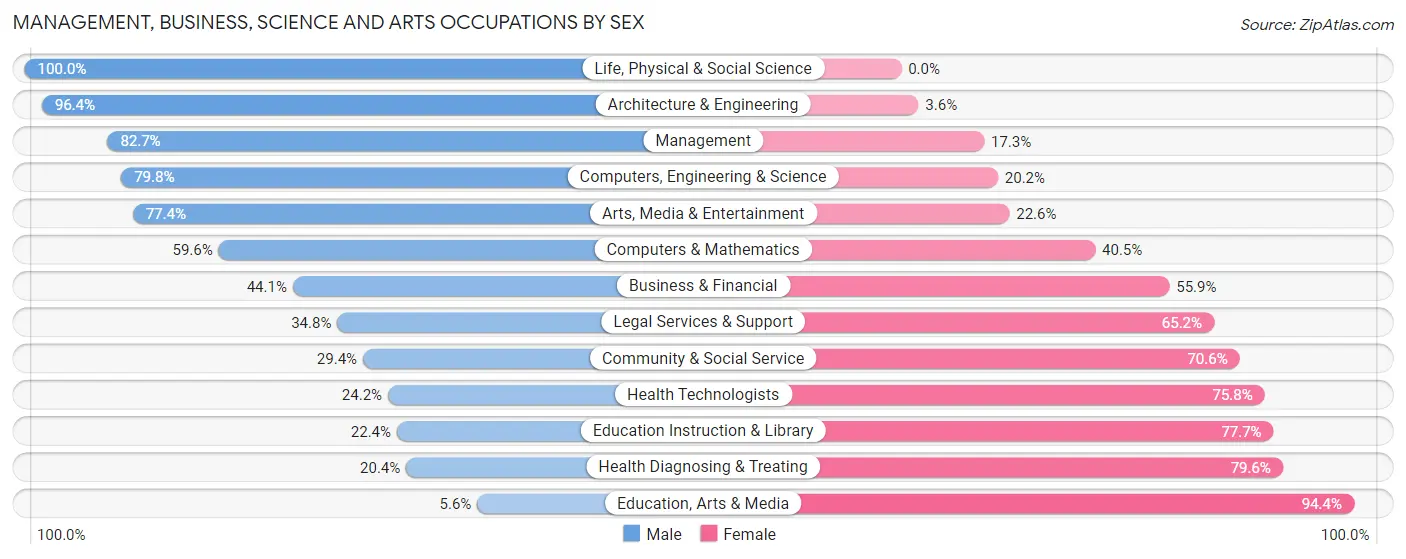
Management, Business, Science and Arts Occupations by Sex
Within the Management, Business, Science and Arts occupations in Jones County, the most male-oriented occupations are Life, Physical & Social Science (100.0%), Architecture & Engineering (96.4%), and Management (82.7%), while the most female-oriented occupations are Education, Arts & Media (94.4%), Health Diagnosing & Treating (79.6%), and Education Instruction & Library (77.6%).
| Occupation | Male | Female |
| Management | 909 (82.7%) | 190 (17.3%) |
| Business & Financial | 352 (44.1%) | 447 (55.9%) |
| Computers, Engineering & Science | 380 (79.8%) | 96 (20.2%) |
| Computers & Mathematics | 131 (59.6%) | 89 (40.5%) |
| Architecture & Engineering | 188 (96.4%) | 7 (3.6%) |
| Life, Physical & Social Science | 61 (100.0%) | 0 (0.0%) |
| Community & Social Service | 334 (29.4%) | 801 (70.6%) |
| Education, Arts & Media | 10 (5.6%) | 169 (94.4%) |
| Legal Services & Support | 56 (34.8%) | 105 (65.2%) |
| Education Instruction & Library | 141 (22.4%) | 490 (77.6%) |
| Arts, Media & Entertainment | 127 (77.4%) | 37 (22.6%) |
| Health Diagnosing & Treating | 195 (20.4%) | 760 (79.6%) |
| Health Technologists | 99 (24.2%) | 310 (75.8%) |
| Total (Category) | 2,170 (48.6%) | 2,294 (51.4%) |
| Total (Overall) | 6,142 (48.4%) | 6,551 (51.6%) |
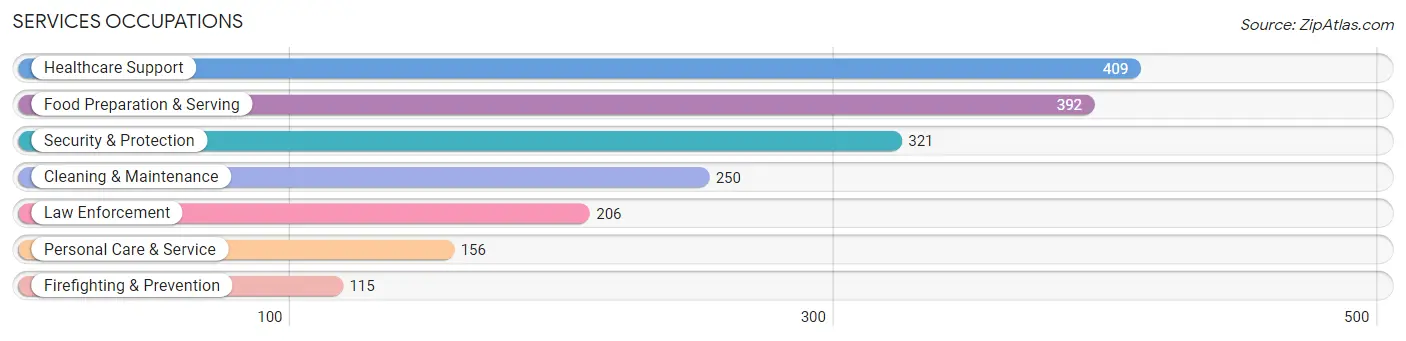
Services Occupations
The most common Services occupations in Jones County are Healthcare Support (409 | 3.2%), Food Preparation & Serving (392 | 3.1%), Security & Protection (321 | 2.5%), Cleaning & Maintenance (250 | 2.0%), and Law Enforcement (206 | 1.6%).
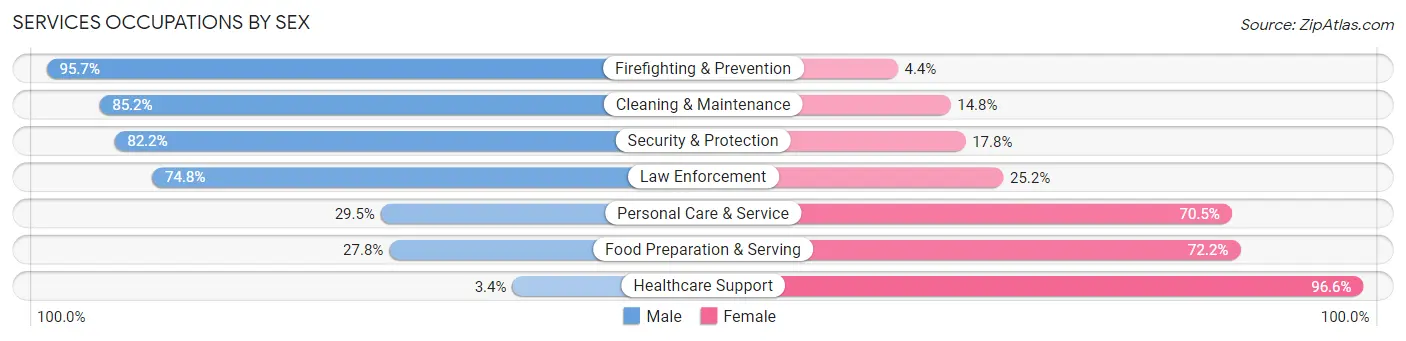
Services Occupations by Sex
Within the Services occupations in Jones County, the most male-oriented occupations are Firefighting & Prevention (95.7%), Cleaning & Maintenance (85.2%), and Security & Protection (82.2%), while the most female-oriented occupations are Healthcare Support (96.6%), Food Preparation & Serving (72.2%), and Personal Care & Service (70.5%).
| Occupation | Male | Female |
| Healthcare Support | 14 (3.4%) | 395 (96.6%) |
| Security & Protection | 264 (82.2%) | 57 (17.8%) |
| Firefighting & Prevention | 110 (95.7%) | 5 (4.3%) |
| Law Enforcement | 154 (74.8%) | 52 (25.2%) |
| Food Preparation & Serving | 109 (27.8%) | 283 (72.2%) |
| Cleaning & Maintenance | 213 (85.2%) | 37 (14.8%) |
| Personal Care & Service | 46 (29.5%) | 110 (70.5%) |
| Total (Category) | 646 (42.3%) | 882 (57.7%) |
| Total (Overall) | 6,142 (48.4%) | 6,551 (51.6%) |
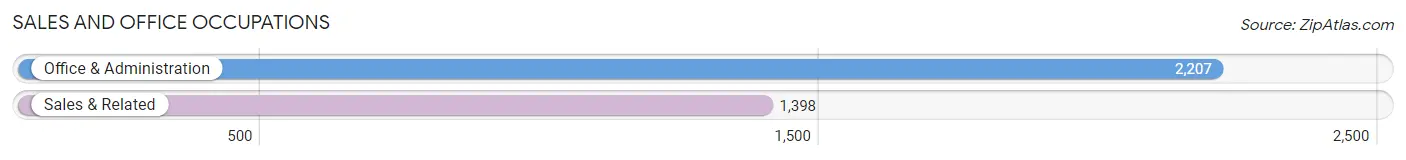
Sales and Office Occupations
The most common Sales and Office occupations in Jones County are Office & Administration (2,207 | 17.4%), and Sales & Related (1,398 | 11.0%).
Sales and Office Occupations by Sex
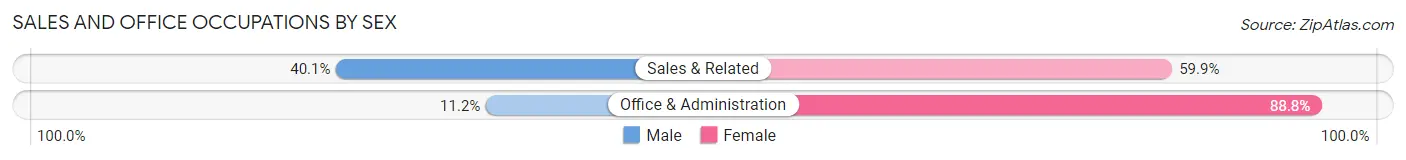
| Occupation | Male | Female |
| Sales & Related | 560 (40.1%) | 838 (59.9%) |
| Office & Administration | 248 (11.2%) | 1,959 (88.8%) |
| Total (Category) | 808 (22.4%) | 2,797 (77.6%) |
| Total (Overall) | 6,142 (48.4%) | 6,551 (51.6%) |
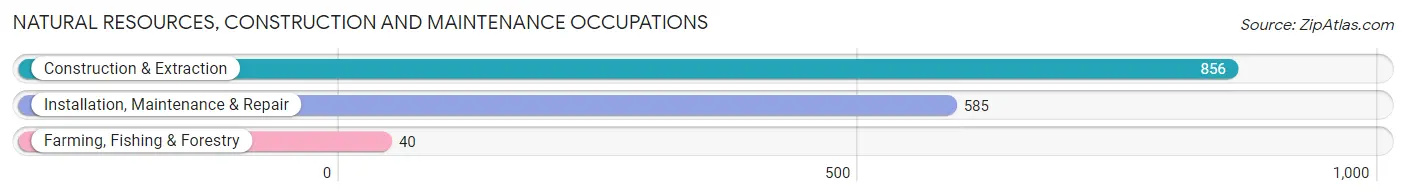
Natural Resources, Construction and Maintenance Occupations
The most common Natural Resources, Construction and Maintenance occupations in Jones County are Construction & Extraction (856 | 6.7%), Installation, Maintenance & Repair (585 | 4.6%), and Farming, Fishing & Forestry (40 | 0.3%).
Natural Resources, Construction and Maintenance Occupations by Sex
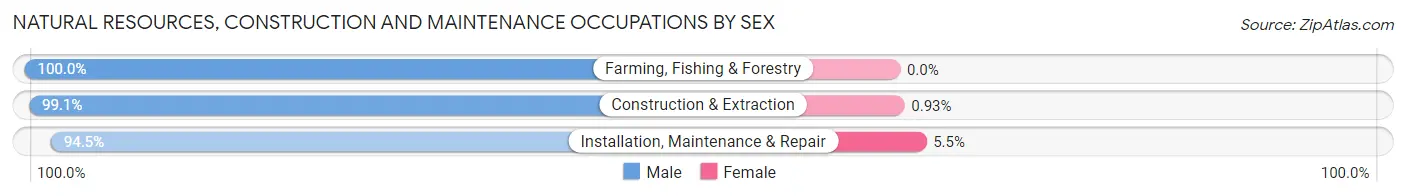
| Occupation | Male | Female |
| Farming, Fishing & Forestry | 40 (100.0%) | 0 (0.0%) |
| Construction & Extraction | 848 (99.1%) | 8 (0.9%) |
| Installation, Maintenance & Repair | 553 (94.5%) | 32 (5.5%) |
| Total (Category) | 1,441 (97.3%) | 40 (2.7%) |
| Total (Overall) | 6,142 (48.4%) | 6,551 (51.6%) |
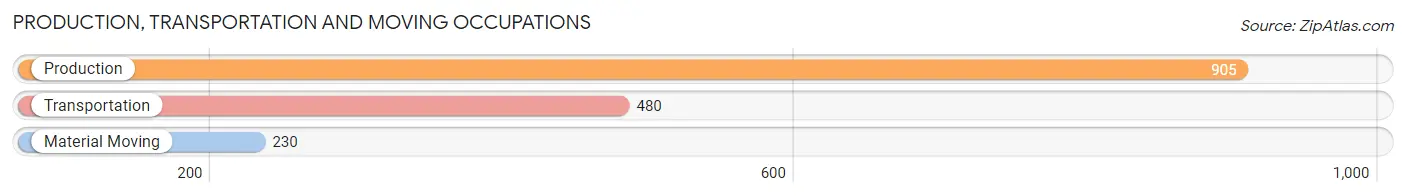
Production, Transportation and Moving Occupations
The most common Production, Transportation and Moving occupations in Jones County are Production (905 | 7.1%), Transportation (480 | 3.8%), and Material Moving (230 | 1.8%).
Production, Transportation and Moving Occupations by Sex
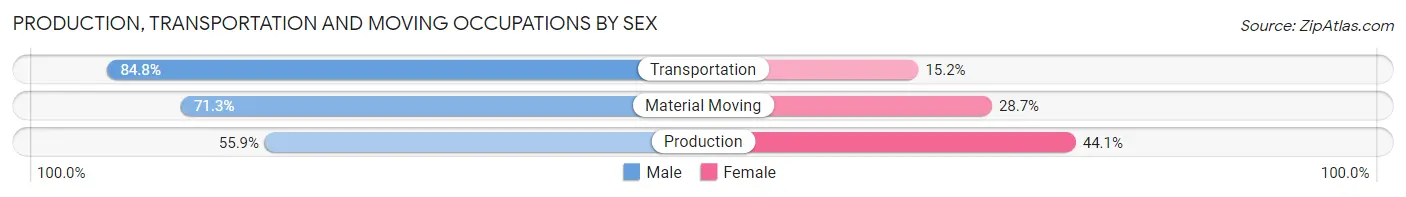
| Occupation | Male | Female |
| Production | 506 (55.9%) | 399 (44.1%) |
| Transportation | 407 (84.8%) | 73 (15.2%) |
| Material Moving | 164 (71.3%) | 66 (28.7%) |
| Total (Category) | 1,077 (66.7%) | 538 (33.3%) |
| Total (Overall) | 6,142 (48.4%) | 6,551 (51.6%) |
Employment Industries by Sex in Jones County
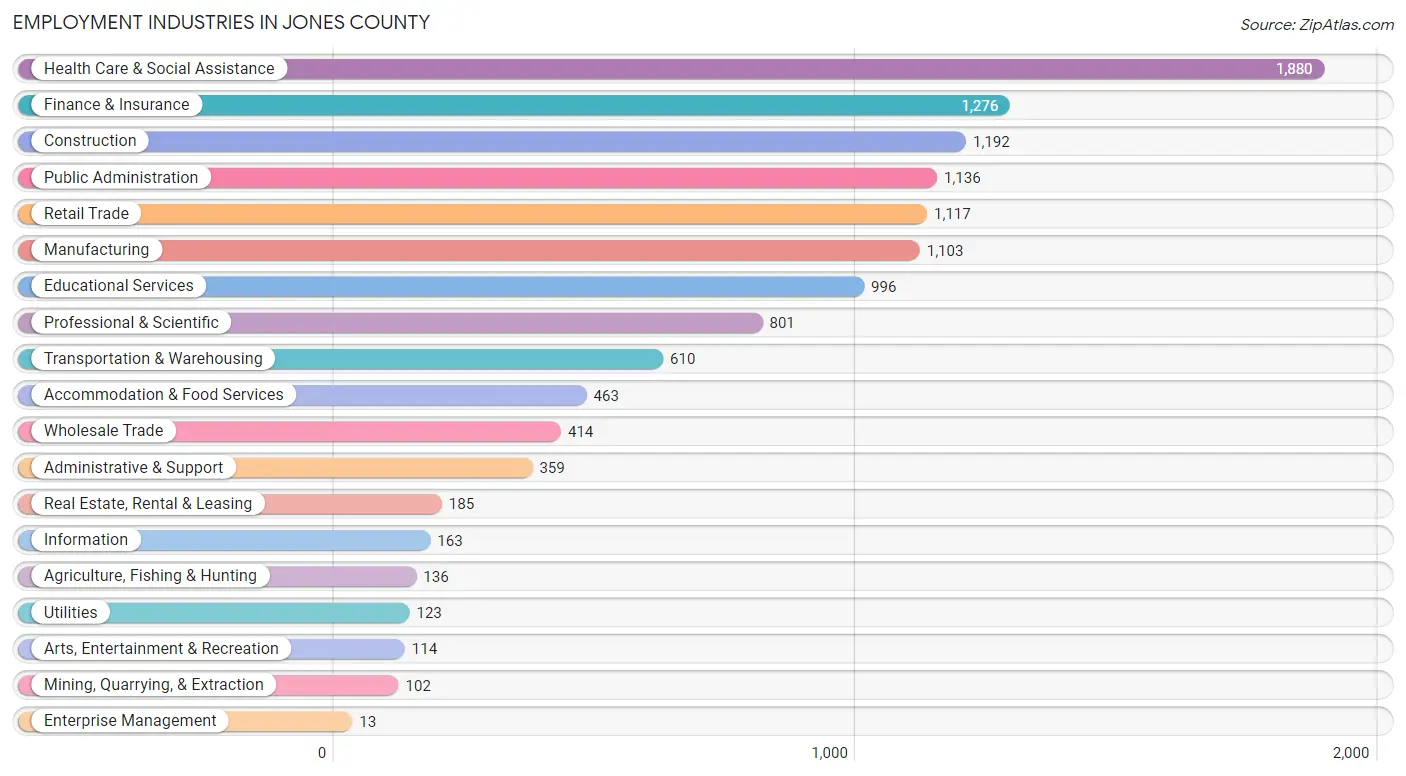
Employment Industries in Jones County
The major employment industries in Jones County include Health Care & Social Assistance (1,880 | 14.8%), Finance & Insurance (1,276 | 10.1%), Construction (1,192 | 9.4%), Public Administration (1,136 | 8.9%), and Retail Trade (1,117 | 8.8%).
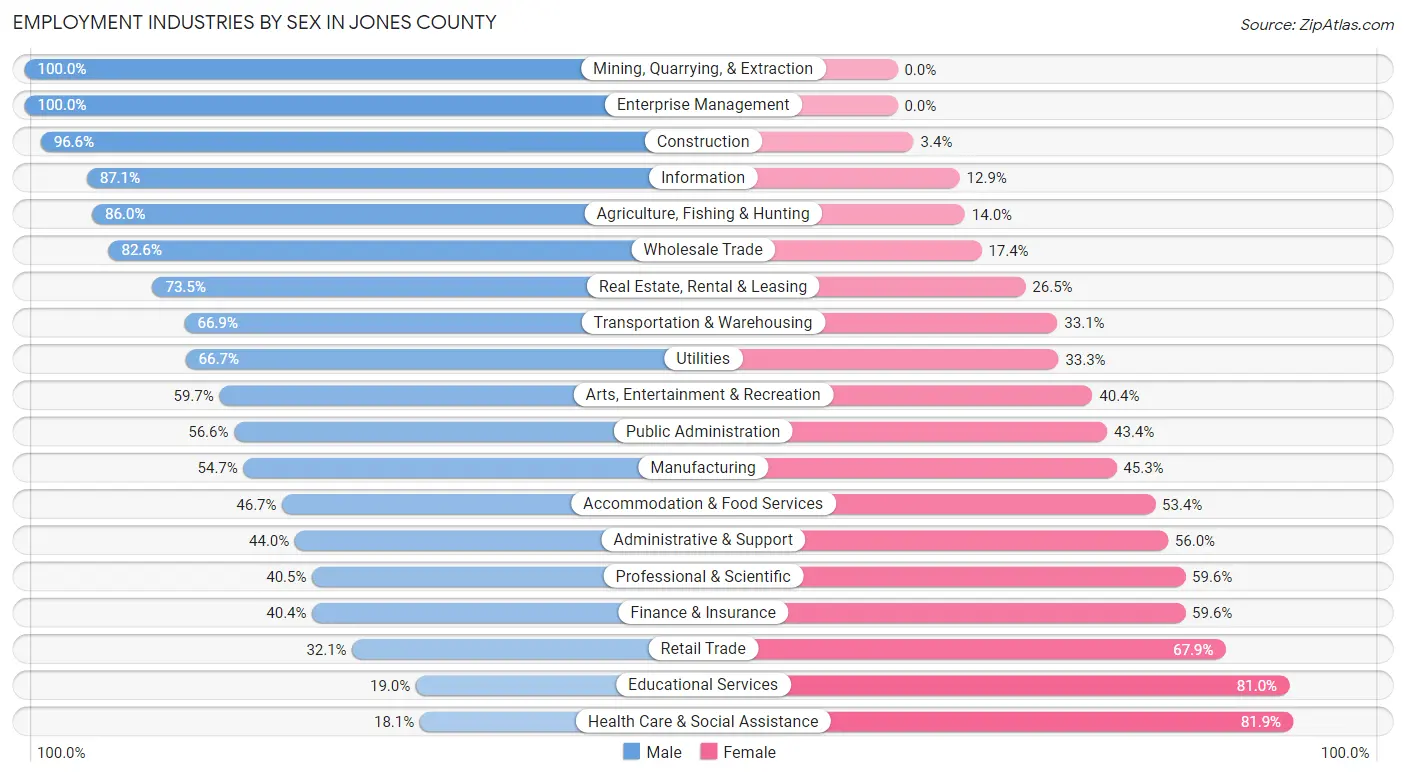
Employment Industries by Sex in Jones County
The Jones County industries that see more men than women are Mining, Quarrying, & Extraction (100.0%), Enterprise Management (100.0%), and Construction (96.6%), whereas the industries that tend to have a higher number of women are Health Care & Social Assistance (81.9%), Educational Services (81.0%), and Retail Trade (67.9%).
| Industry | Male | Female |
| Agriculture, Fishing & Hunting | 117 (86.0%) | 19 (14.0%) |
| Mining, Quarrying, & Extraction | 102 (100.0%) | 0 (0.0%) |
| Construction | 1,152 (96.6%) | 40 (3.4%) |
| Manufacturing | 603 (54.7%) | 500 (45.3%) |
| Wholesale Trade | 342 (82.6%) | 72 (17.4%) |
| Retail Trade | 359 (32.1%) | 758 (67.9%) |
| Transportation & Warehousing | 408 (66.9%) | 202 (33.1%) |
| Utilities | 82 (66.7%) | 41 (33.3%) |
| Information | 142 (87.1%) | 21 (12.9%) |
| Finance & Insurance | 516 (40.4%) | 760 (59.6%) |
| Real Estate, Rental & Leasing | 136 (73.5%) | 49 (26.5%) |
| Professional & Scientific | 324 (40.5%) | 477 (59.6%) |
| Enterprise Management | 13 (100.0%) | 0 (0.0%) |
| Administrative & Support | 158 (44.0%) | 201 (56.0%) |
| Educational Services | 189 (19.0%) | 807 (81.0%) |
| Health Care & Social Assistance | 341 (18.1%) | 1,539 (81.9%) |
| Arts, Entertainment & Recreation | 68 (59.7%) | 46 (40.4%) |
| Accommodation & Food Services | 216 (46.7%) | 247 (53.3%) |
| Public Administration | 643 (56.6%) | 493 (43.4%) |
| Total | 6,142 (48.4%) | 6,551 (51.6%) |
Education in Jones County
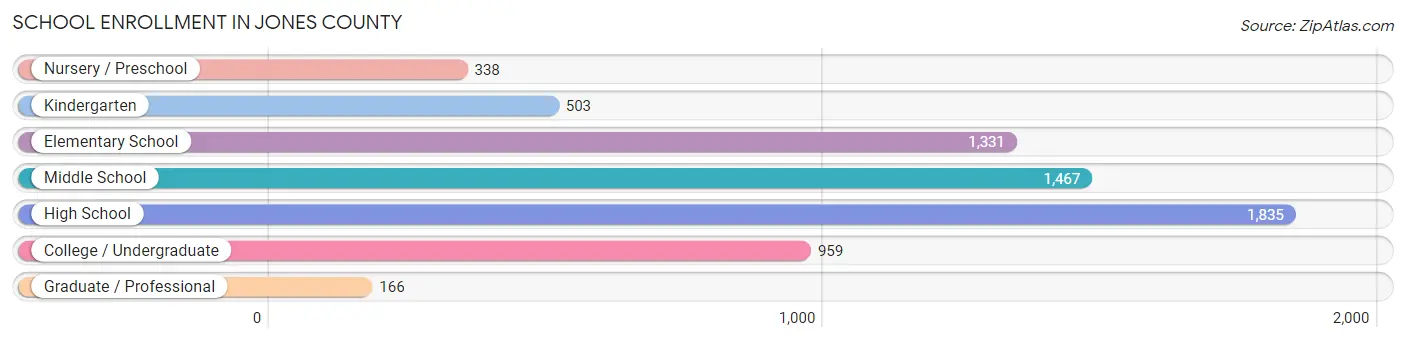
School Enrollment in Jones County
The most common levels of schooling among the 6,599 students in Jones County are high school (1,835 | 27.8%), middle school (1,467 | 22.2%), and elementary school (1,331 | 20.2%).
| School Level | # Students | % Students |
| Nursery / Preschool | 338 | 5.1% |
| Kindergarten | 503 | 7.6% |
| Elementary School | 1,331 | 20.2% |
| Middle School | 1,467 | 22.2% |
| High School | 1,835 | 27.8% |
| College / Undergraduate | 959 | 14.5% |
| Graduate / Professional | 166 | 2.5% |
| Total | 6,599 | 100.0% |
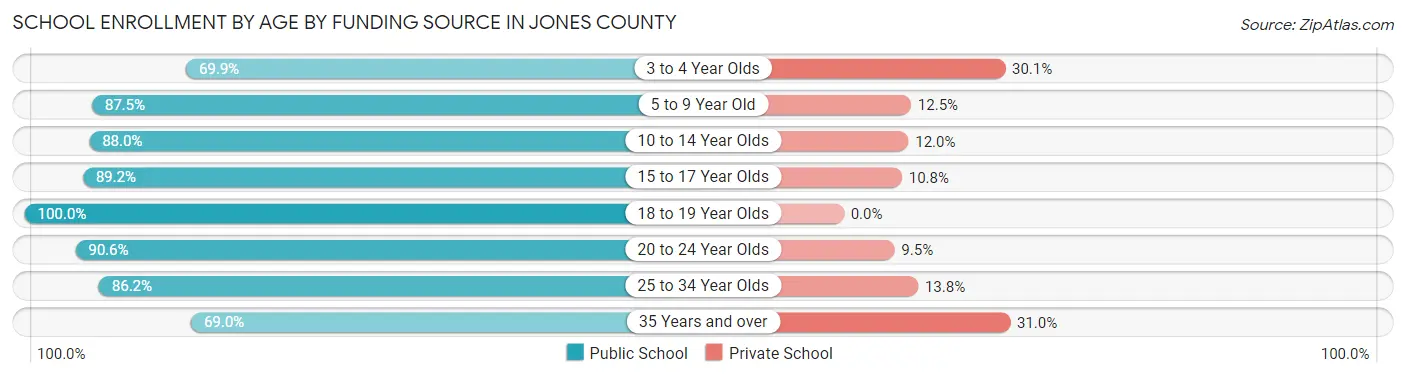
School Enrollment by Age by Funding Source in Jones County
Out of a total of 6,599 students who are enrolled in schools in Jones County, 851 (12.9%) attend a private institution, while the remaining 5,748 (87.1%) are enrolled in public schools. The age group of 35 years and over has the highest likelihood of being enrolled in private schools, with 106 (31.0% in the age bracket) enrolled. Conversely, the age group of 18 to 19 year olds has the lowest likelihood of being enrolled in a private school, with 415 (100.0% in the age bracket) attending a public institution.
| Age Bracket | Public School | Private School |
| 3 to 4 Year Olds | 228 (69.9%) | 98 (30.1%) |
| 5 to 9 Year Old | 1,439 (87.5%) | 206 (12.5%) |
| 10 to 14 Year Olds | 1,687 (88.0%) | 231 (12.0%) |
| 15 to 17 Year Olds | 1,136 (89.2%) | 138 (10.8%) |
| 18 to 19 Year Olds | 415 (100.0%) | 0 (0.0%) |
| 20 to 24 Year Olds | 412 (90.5%) | 43 (9.5%) |
| 25 to 34 Year Olds | 193 (86.2%) | 31 (13.8%) |
| 35 Years and over | 236 (69.0%) | 106 (31.0%) |
| Total | 5,748 (87.1%) | 851 (12.9%) |
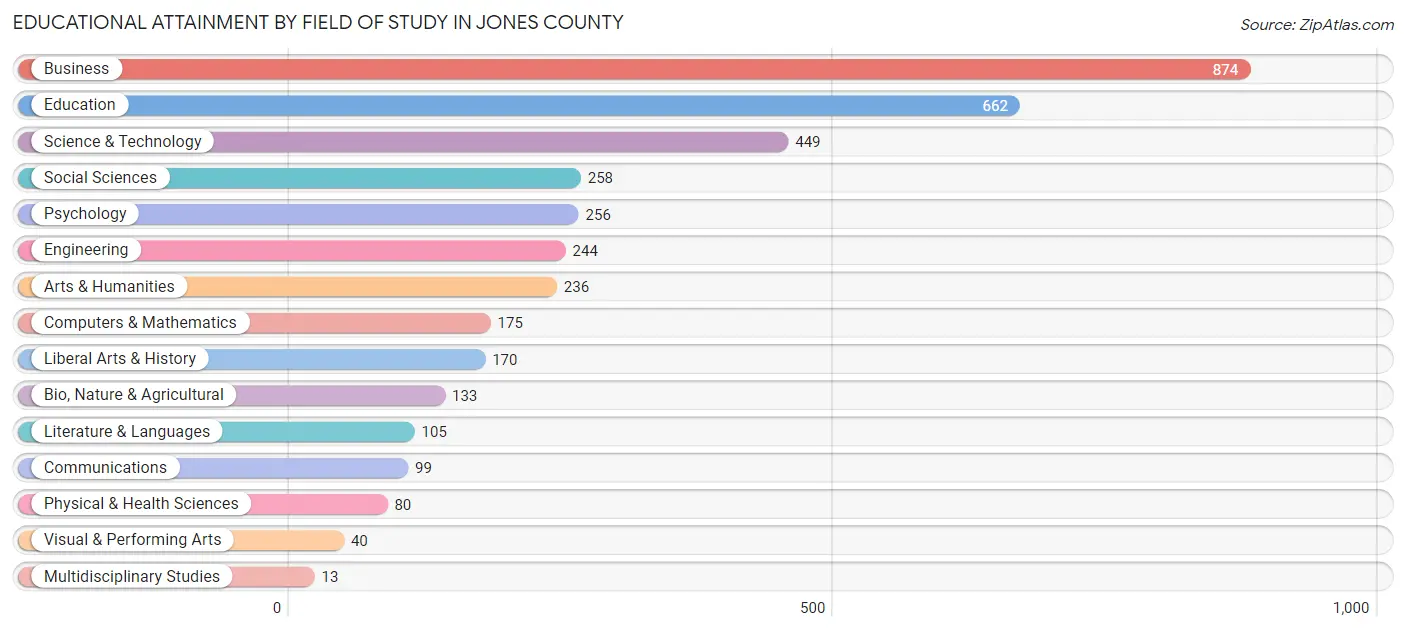
Educational Attainment by Field of Study in Jones County
Business (874 | 23.0%), education (662 | 17.4%), science & technology (449 | 11.8%), social sciences (258 | 6.8%), and psychology (256 | 6.8%) are the most common fields of study among 3,794 individuals in Jones County who have obtained a bachelor's degree or higher.
| Field of Study | # Graduates | % Graduates |
| Computers & Mathematics | 175 | 4.6% |
| Bio, Nature & Agricultural | 133 | 3.5% |
| Physical & Health Sciences | 80 | 2.1% |
| Psychology | 256 | 6.8% |
| Social Sciences | 258 | 6.8% |
| Engineering | 244 | 6.4% |
| Multidisciplinary Studies | 13 | 0.3% |
| Science & Technology | 449 | 11.8% |
| Business | 874 | 23.0% |
| Education | 662 | 17.4% |
| Literature & Languages | 105 | 2.8% |
| Liberal Arts & History | 170 | 4.5% |
| Visual & Performing Arts | 40 | 1.1% |
| Communications | 99 | 2.6% |
| Arts & Humanities | 236 | 6.2% |
| Total | 3,794 | 100.0% |
Transportation & Commute in Jones County
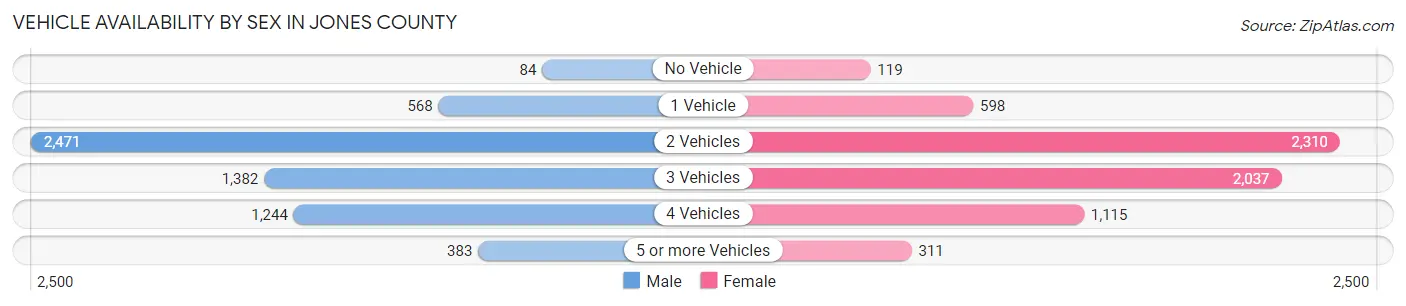
Vehicle Availability by Sex in Jones County
The most prevalent vehicle ownership categories in Jones County are males with 2 vehicles (2,471, accounting for 40.3%) and females with 2 vehicles (2,310, making up 38.1%).
| Vehicles Available | Male | Female |
| No Vehicle | 84 (1.4%) | 119 (1.8%) |
| 1 Vehicle | 568 (9.3%) | 598 (9.2%) |
| 2 Vehicles | 2,471 (40.3%) | 2,310 (35.6%) |
| 3 Vehicles | 1,382 (22.5%) | 2,037 (31.4%) |
| 4 Vehicles | 1,244 (20.3%) | 1,115 (17.2%) |
| 5 or more Vehicles | 383 (6.2%) | 311 (4.8%) |
| Total | 6,132 (100.0%) | 6,490 (100.0%) |
Commute Time in Jones County
The most frequently occuring commute durations in Jones County are 30 to 34 minutes (2,290 commuters, 19.5%), 20 to 24 minutes (1,612 commuters, 13.8%), and 15 to 19 minutes (1,460 commuters, 12.4%).
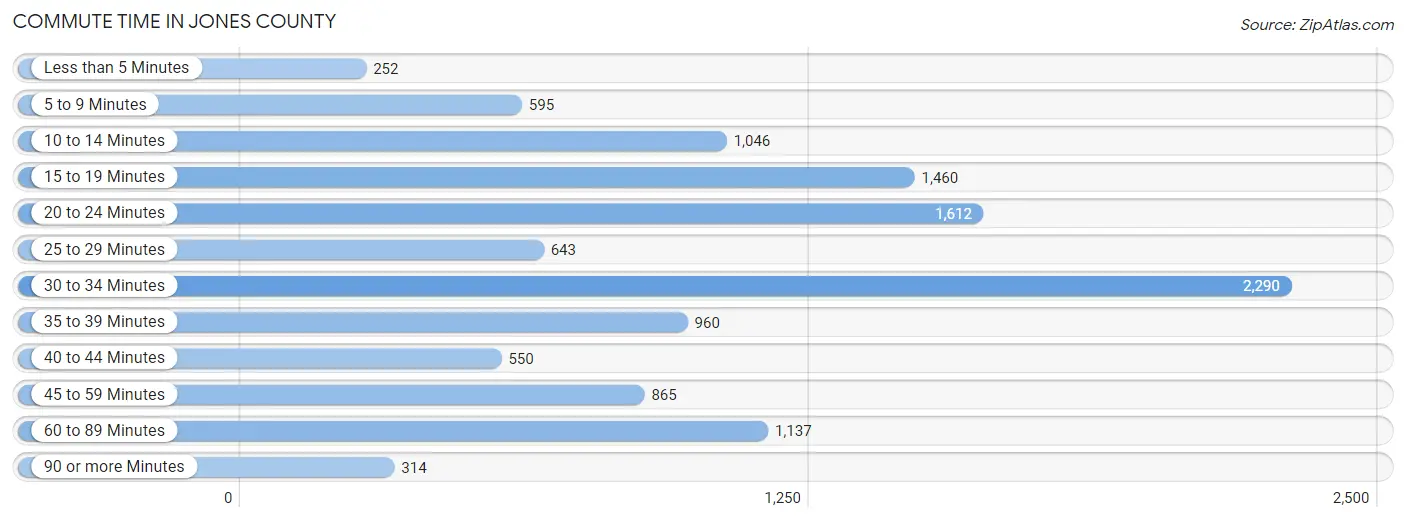
| Commute Time | # Commuters | % Commuters |
| Less than 5 Minutes | 252 | 2.1% |
| 5 to 9 Minutes | 595 | 5.1% |
| 10 to 14 Minutes | 1,046 | 8.9% |
| 15 to 19 Minutes | 1,460 | 12.4% |
| 20 to 24 Minutes | 1,612 | 13.8% |
| 25 to 29 Minutes | 643 | 5.5% |
| 30 to 34 Minutes | 2,290 | 19.5% |
| 35 to 39 Minutes | 960 | 8.2% |
| 40 to 44 Minutes | 550 | 4.7% |
| 45 to 59 Minutes | 865 | 7.4% |
| 60 to 89 Minutes | 1,137 | 9.7% |
| 90 or more Minutes | 314 | 2.7% |
Commute Time by Sex in Jones County
The most common commute times in Jones County are 30 to 34 minutes (1,002 commuters, 17.5%) for males and 30 to 34 minutes (1,288 commuters, 21.5%) for females.
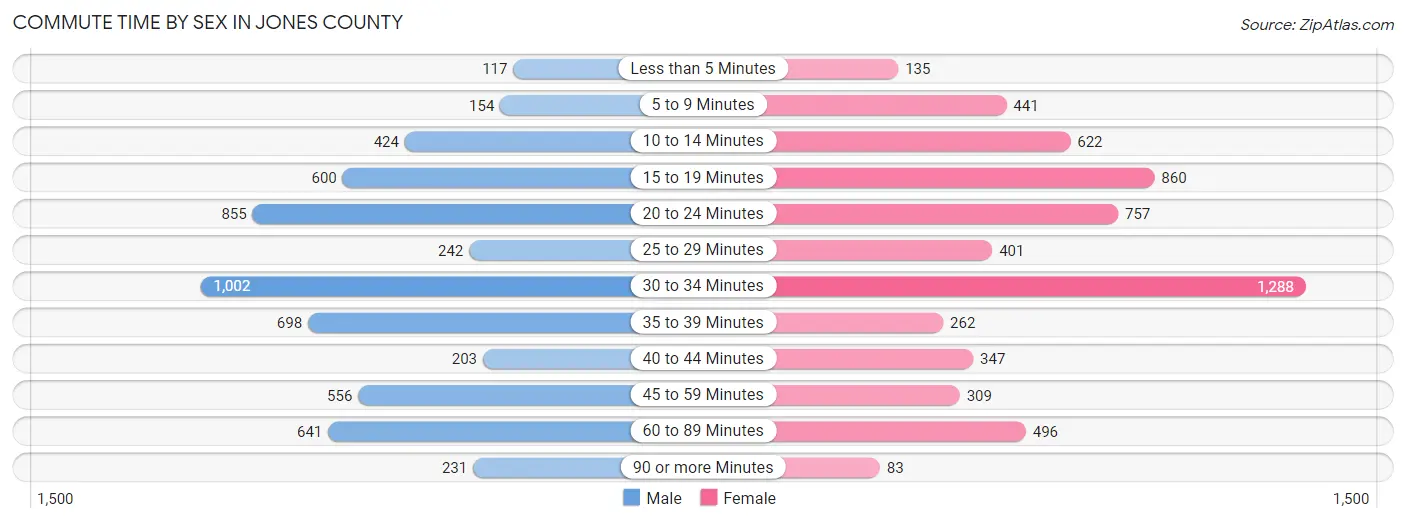
| Commute Time | Male | Female |
| Less than 5 Minutes | 117 (2.0%) | 135 (2.2%) |
| 5 to 9 Minutes | 154 (2.7%) | 441 (7.3%) |
| 10 to 14 Minutes | 424 (7.4%) | 622 (10.4%) |
| 15 to 19 Minutes | 600 (10.5%) | 860 (14.3%) |
| 20 to 24 Minutes | 855 (14.9%) | 757 (12.6%) |
| 25 to 29 Minutes | 242 (4.2%) | 401 (6.7%) |
| 30 to 34 Minutes | 1,002 (17.5%) | 1,288 (21.5%) |
| 35 to 39 Minutes | 698 (12.2%) | 262 (4.4%) |
| 40 to 44 Minutes | 203 (3.5%) | 347 (5.8%) |
| 45 to 59 Minutes | 556 (9.7%) | 309 (5.1%) |
| 60 to 89 Minutes | 641 (11.2%) | 496 (8.3%) |
| 90 or more Minutes | 231 (4.0%) | 83 (1.4%) |
Time of Departure to Work by Sex in Jones County
The most frequent times of departure to work in Jones County are 8:00 AM to 8:29 AM (1,082, 18.9%) for males and 7:00 AM to 7:29 AM (1,113, 18.5%) for females.
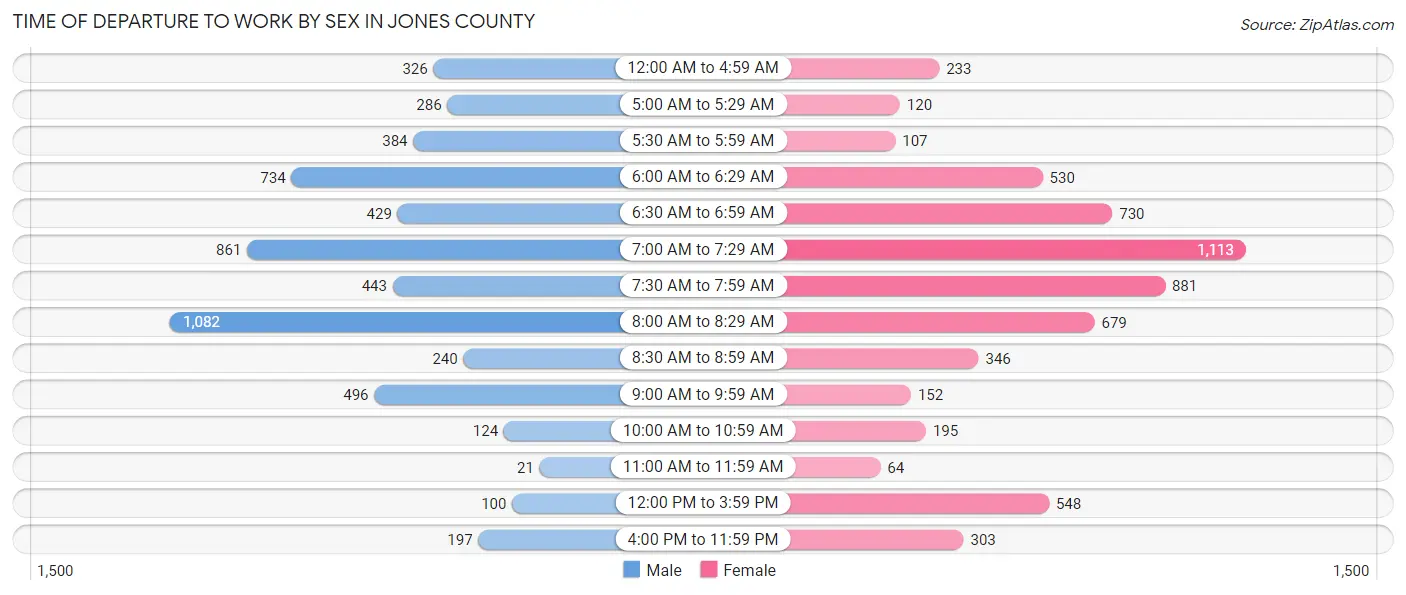
| Time of Departure | Male | Female |
| 12:00 AM to 4:59 AM | 326 (5.7%) | 233 (3.9%) |
| 5:00 AM to 5:29 AM | 286 (5.0%) | 120 (2.0%) |
| 5:30 AM to 5:59 AM | 384 (6.7%) | 107 (1.8%) |
| 6:00 AM to 6:29 AM | 734 (12.8%) | 530 (8.8%) |
| 6:30 AM to 6:59 AM | 429 (7.5%) | 730 (12.2%) |
| 7:00 AM to 7:29 AM | 861 (15.0%) | 1,113 (18.5%) |
| 7:30 AM to 7:59 AM | 443 (7.7%) | 881 (14.7%) |
| 8:00 AM to 8:29 AM | 1,082 (18.9%) | 679 (11.3%) |
| 8:30 AM to 8:59 AM | 240 (4.2%) | 346 (5.8%) |
| 9:00 AM to 9:59 AM | 496 (8.7%) | 152 (2.5%) |
| 10:00 AM to 10:59 AM | 124 (2.2%) | 195 (3.3%) |
| 11:00 AM to 11:59 AM | 21 (0.4%) | 64 (1.1%) |
| 12:00 PM to 3:59 PM | 100 (1.8%) | 548 (9.1%) |
| 4:00 PM to 11:59 PM | 197 (3.4%) | 303 (5.1%) |
| Total | 5,723 (100.0%) | 6,001 (100.0%) |
Housing Occupancy in Jones County
Occupancy by Ownership in Jones County
Of the total 10,581 dwellings in Jones County, owner-occupied units account for 8,756 (82.8%), while renter-occupied units make up 1,825 (17.2%).
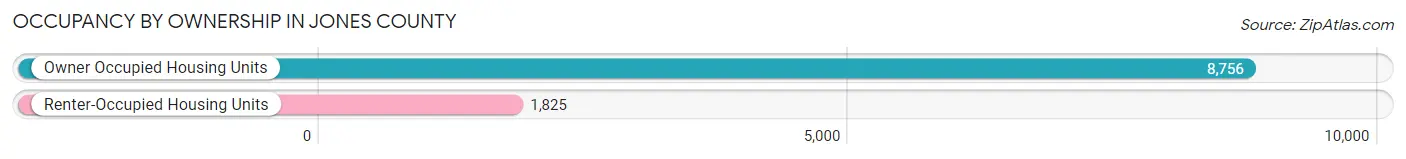
| Occupancy | # Housing Units | % Housing Units |
| Owner Occupied Housing Units | 8,756 | 82.8% |
| Renter-Occupied Housing Units | 1,825 | 17.2% |
| Total Occupied Housing Units | 10,581 | 100.0% |
Occupancy by Household Size in Jones County
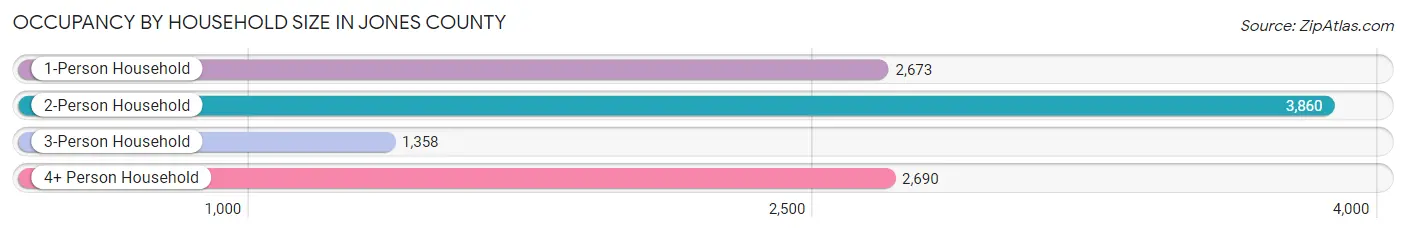
| Household Size | # Housing Units | % Housing Units |
| 1-Person Household | 2,673 | 25.3% |
| 2-Person Household | 3,860 | 36.5% |
| 3-Person Household | 1,358 | 12.8% |
| 4+ Person Household | 2,690 | 25.4% |
| Total Housing Units | 10,581 | 100.0% |
Occupancy by Ownership by Household Size in Jones County
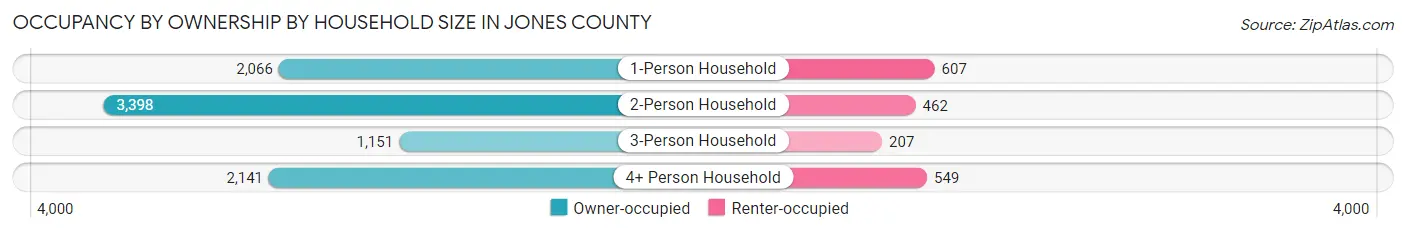
| Household Size | Owner-occupied | Renter-occupied |
| 1-Person Household | 2,066 (77.3%) | 607 (22.7%) |
| 2-Person Household | 3,398 (88.0%) | 462 (12.0%) |
| 3-Person Household | 1,151 (84.8%) | 207 (15.2%) |
| 4+ Person Household | 2,141 (79.6%) | 549 (20.4%) |
| Total Housing Units | 8,756 (82.8%) | 1,825 (17.2%) |
Occupancy by Educational Attainment in Jones County
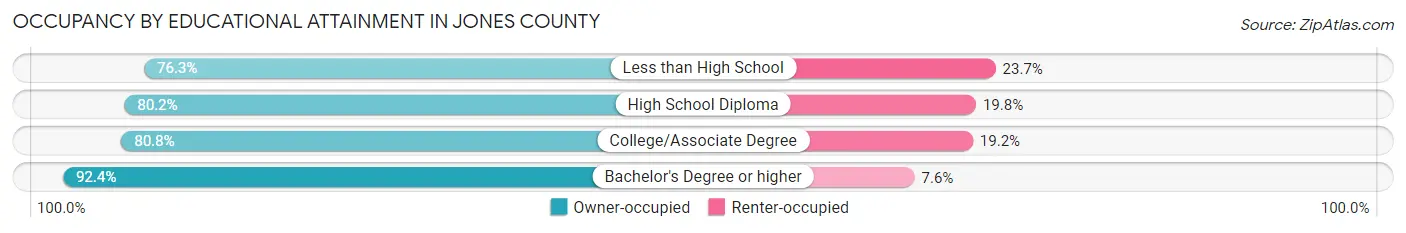
| Household Size | Owner-occupied | Renter-occupied |
| Less than High School | 554 (76.3%) | 172 (23.7%) |
| High School Diploma | 3,486 (80.2%) | 860 (19.8%) |
| College/Associate Degree | 2,608 (80.8%) | 619 (19.2%) |
| Bachelor's Degree or higher | 2,108 (92.4%) | 174 (7.6%) |
Occupancy by Age of Householder in Jones County
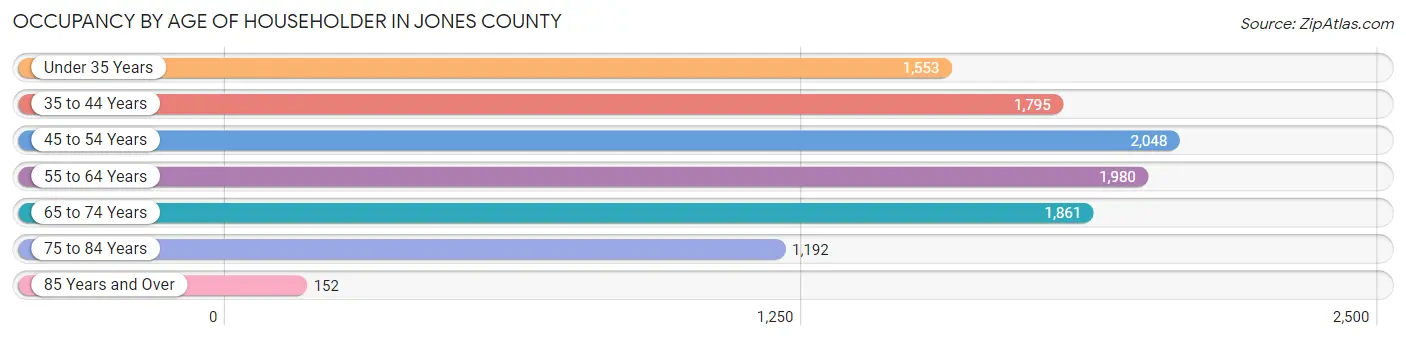
| Age Bracket | # Households | % Households |
| Under 35 Years | 1,553 | 14.7% |
| 35 to 44 Years | 1,795 | 17.0% |
| 45 to 54 Years | 2,048 | 19.4% |
| 55 to 64 Years | 1,980 | 18.7% |
| 65 to 74 Years | 1,861 | 17.6% |
| 75 to 84 Years | 1,192 | 11.3% |
| 85 Years and Over | 152 | 1.4% |
| Total | 10,581 | 100.0% |
Housing Finances in Jones County
Median Income by Occupancy in Jones County
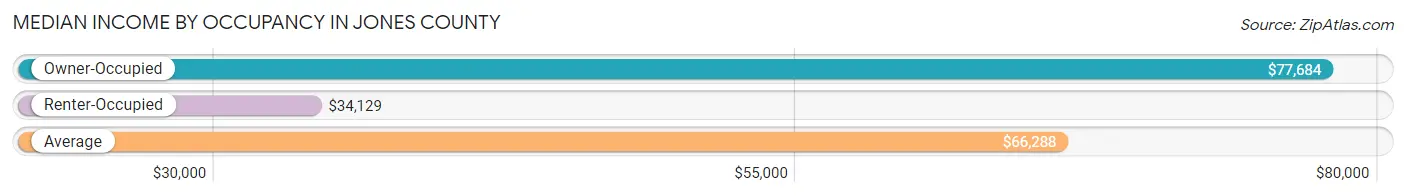
| Occupancy Type | # Households | Median Income |
| Owner-Occupied | 8,756 (82.8%) | $77,684 |
| Renter-Occupied | 1,825 (17.2%) | $34,129 |
| Average | 10,581 (100.0%) | $66,288 |
Occupancy by Householder Income Bracket in Jones County
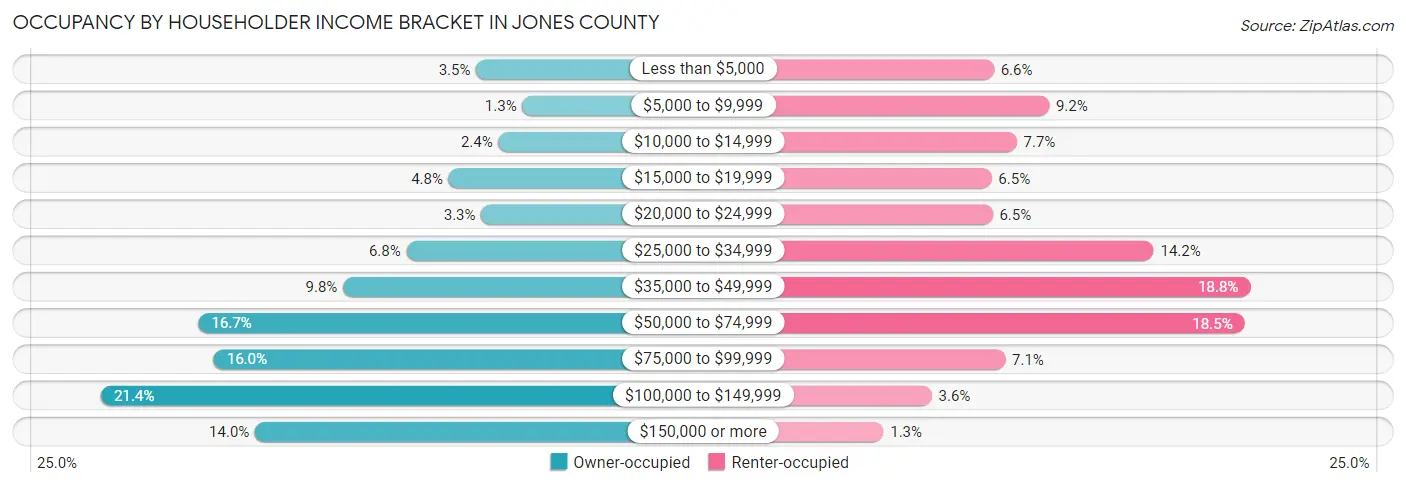
| Income Bracket | Owner-occupied | Renter-occupied |
| Less than $5,000 | 306 (3.5%) | 120 (6.6%) |
| $5,000 to $9,999 | 113 (1.3%) | 168 (9.2%) |
| $10,000 to $14,999 | 213 (2.4%) | 140 (7.7%) |
| $15,000 to $19,999 | 420 (4.8%) | 118 (6.5%) |
| $20,000 to $24,999 | 285 (3.3%) | 119 (6.5%) |
| $25,000 to $34,999 | 596 (6.8%) | 259 (14.2%) |
| $35,000 to $49,999 | 861 (9.8%) | 343 (18.8%) |
| $50,000 to $74,999 | 1,464 (16.7%) | 338 (18.5%) |
| $75,000 to $99,999 | 1,400 (16.0%) | 130 (7.1%) |
| $100,000 to $149,999 | 1,870 (21.4%) | 66 (3.6%) |
| $150,000 or more | 1,228 (14.0%) | 24 (1.3%) |
| Total | 8,756 (100.0%) | 1,825 (100.0%) |
Monthly Housing Cost Tiers in Jones County
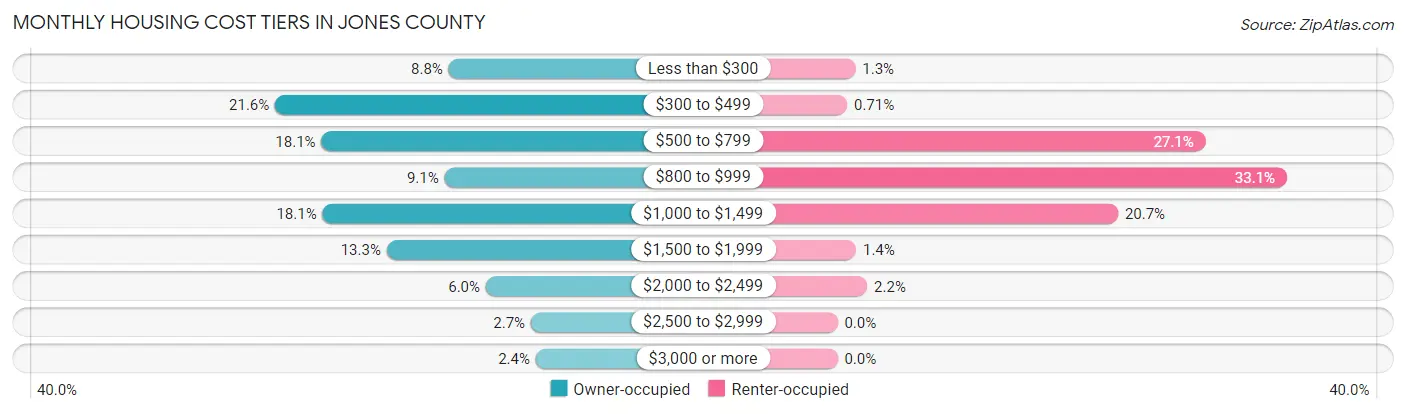
| Monthly Cost | Owner-occupied | Renter-occupied |
| Less than $300 | 768 (8.8%) | 24 (1.3%) |
| $300 to $499 | 1,887 (21.5%) | 13 (0.7%) |
| $500 to $799 | 1,588 (18.1%) | 495 (27.1%) |
| $800 to $999 | 794 (9.1%) | 604 (33.1%) |
| $1,000 to $1,499 | 1,581 (18.1%) | 377 (20.7%) |
| $1,500 to $1,999 | 1,167 (13.3%) | 25 (1.4%) |
| $2,000 to $2,499 | 528 (6.0%) | 40 (2.2%) |
| $2,500 to $2,999 | 237 (2.7%) | 0 (0.0%) |
| $3,000 or more | 206 (2.4%) | 0 (0.0%) |
| Total | 8,756 (100.0%) | 1,825 (100.0%) |
Physical Housing Characteristics in Jones County
Housing Structures in Jones County
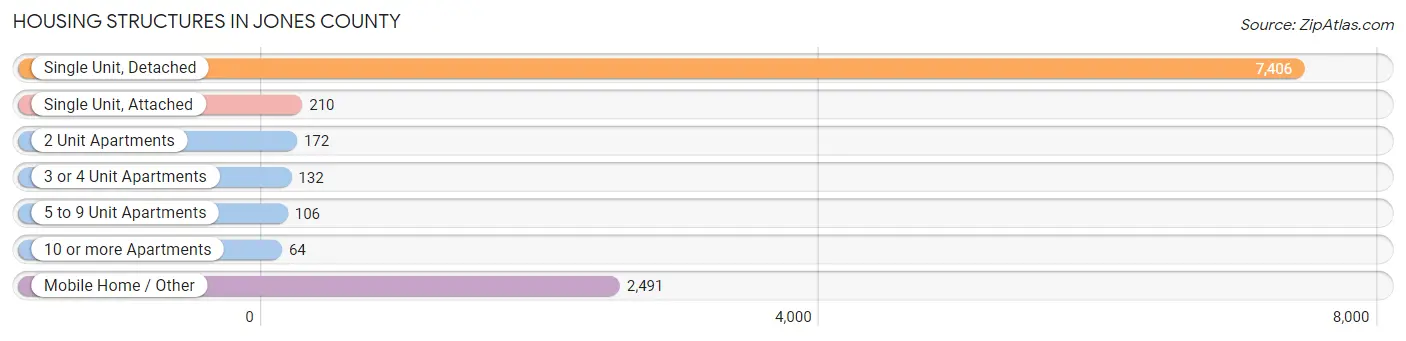
| Structure Type | # Housing Units | % Housing Units |
| Single Unit, Detached | 7,406 | 70.0% |
| Single Unit, Attached | 210 | 2.0% |
| 2 Unit Apartments | 172 | 1.6% |
| 3 or 4 Unit Apartments | 132 | 1.3% |
| 5 to 9 Unit Apartments | 106 | 1.0% |
| 10 or more Apartments | 64 | 0.6% |
| Mobile Home / Other | 2,491 | 23.5% |
| Total | 10,581 | 100.0% |
Housing Structures by Occupancy in Jones County
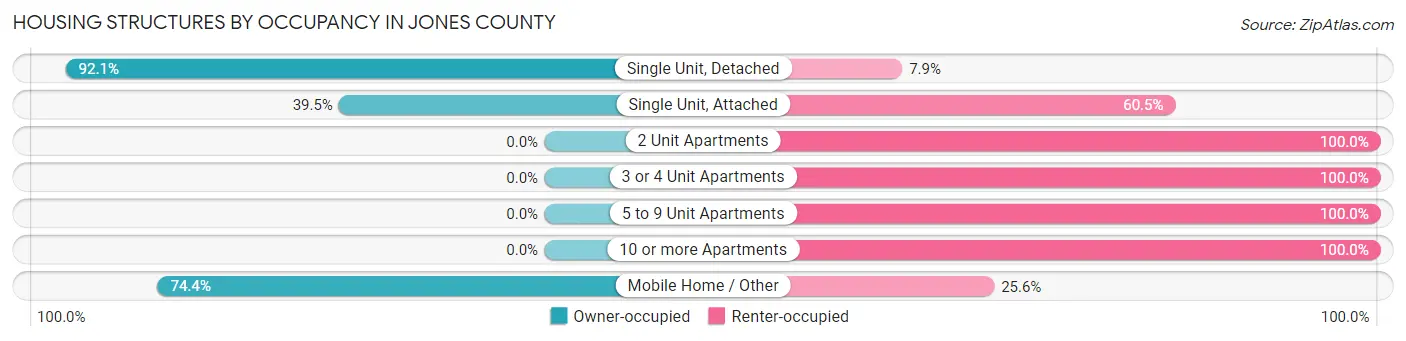
| Structure Type | Owner-occupied | Renter-occupied |
| Single Unit, Detached | 6,820 (92.1%) | 586 (7.9%) |
| Single Unit, Attached | 83 (39.5%) | 127 (60.5%) |
| 2 Unit Apartments | 0 (0.0%) | 172 (100.0%) |
| 3 or 4 Unit Apartments | 0 (0.0%) | 132 (100.0%) |
| 5 to 9 Unit Apartments | 0 (0.0%) | 106 (100.0%) |
| 10 or more Apartments | 0 (0.0%) | 64 (100.0%) |
| Mobile Home / Other | 1,853 (74.4%) | 638 (25.6%) |
| Total | 8,756 (82.8%) | 1,825 (17.2%) |
Housing Structures by Number of Rooms in Jones County
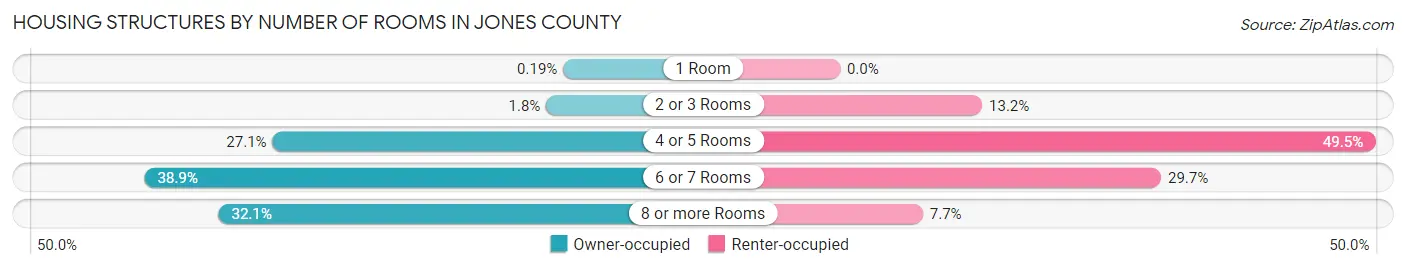
| Number of Rooms | Owner-occupied | Renter-occupied |
| 1 Room | 17 (0.2%) | 0 (0.0%) |
| 2 or 3 Rooms | 154 (1.8%) | 240 (13.2%) |
| 4 or 5 Rooms | 2,371 (27.1%) | 903 (49.5%) |
| 6 or 7 Rooms | 3,407 (38.9%) | 542 (29.7%) |
| 8 or more Rooms | 2,807 (32.1%) | 140 (7.7%) |
| Total | 8,756 (100.0%) | 1,825 (100.0%) |
Housing Structure by Heating Type in Jones County
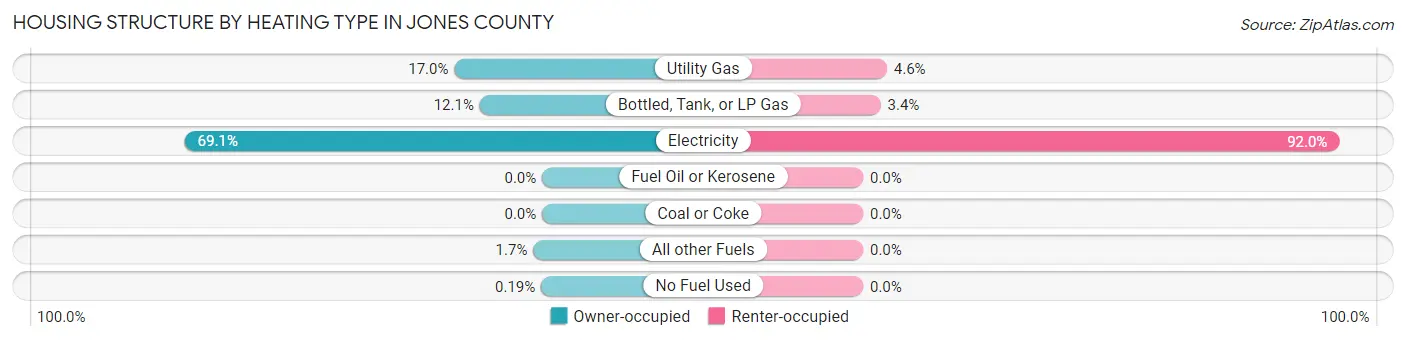
| Heating Type | Owner-occupied | Renter-occupied |
| Utility Gas | 1,486 (17.0%) | 84 (4.6%) |
| Bottled, Tank, or LP Gas | 1,055 (12.0%) | 62 (3.4%) |
| Electricity | 6,048 (69.1%) | 1,679 (92.0%) |
| Fuel Oil or Kerosene | 0 (0.0%) | 0 (0.0%) |
| Coal or Coke | 0 (0.0%) | 0 (0.0%) |
| All other Fuels | 150 (1.7%) | 0 (0.0%) |
| No Fuel Used | 17 (0.2%) | 0 (0.0%) |
| Total | 8,756 (100.0%) | 1,825 (100.0%) |
Household Vehicle Usage in Jones County
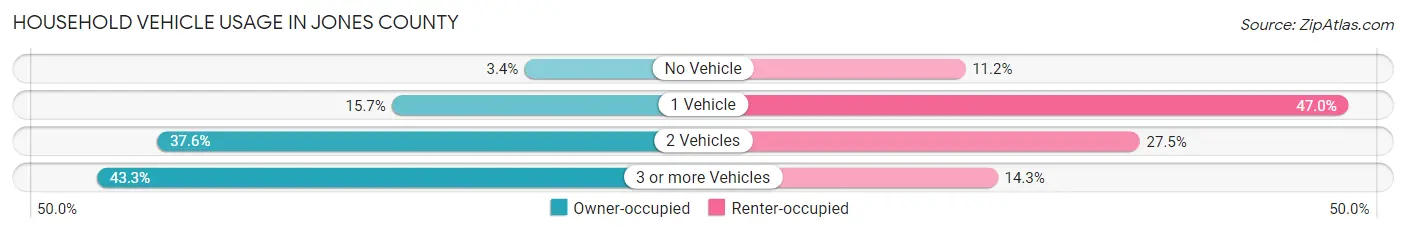
| Vehicles per Household | Owner-occupied | Renter-occupied |
| No Vehicle | 295 (3.4%) | 205 (11.2%) |
| 1 Vehicle | 1,378 (15.7%) | 858 (47.0%) |
| 2 Vehicles | 3,296 (37.6%) | 502 (27.5%) |
| 3 or more Vehicles | 3,787 (43.2%) | 260 (14.2%) |
| Total | 8,756 (100.0%) | 1,825 (100.0%) |
Real Estate & Mortgages in Jones County
Real Estate and Mortgage Overview in Jones County
| Characteristic | Without Mortgage | With Mortgage |
| Housing Units | 4,117 | 4,639 |
| Median Property Value | $110,800 | $185,400 |
| Median Household Income | $61,514 | $857 |
| Monthly Housing Costs | $447 | $206 |
| Real Estate Taxes | $1,171 | $93 |
Property Value by Mortgage Status in Jones County
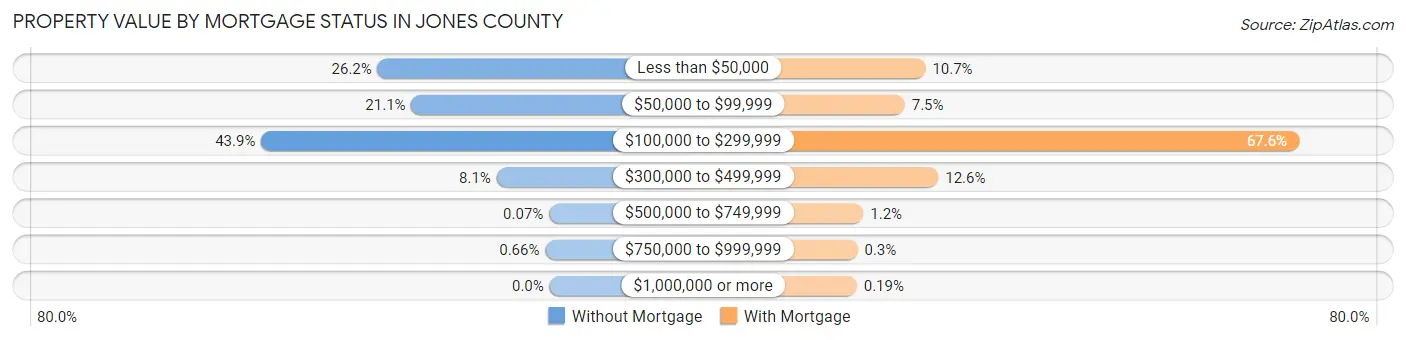
| Property Value | Without Mortgage | With Mortgage |
| Less than $50,000 | 1,079 (26.2%) | 494 (10.6%) |
| $50,000 to $99,999 | 867 (21.1%) | 348 (7.5%) |
| $100,000 to $299,999 | 1,809 (43.9%) | 3,134 (67.6%) |
| $300,000 to $499,999 | 332 (8.1%) | 585 (12.6%) |
| $500,000 to $749,999 | 3 (0.1%) | 55 (1.2%) |
| $750,000 to $999,999 | 27 (0.7%) | 14 (0.3%) |
| $1,000,000 or more | 0 (0.0%) | 9 (0.2%) |
| Total | 4,117 (100.0%) | 4,639 (100.0%) |
Household Income by Mortgage Status in Jones County
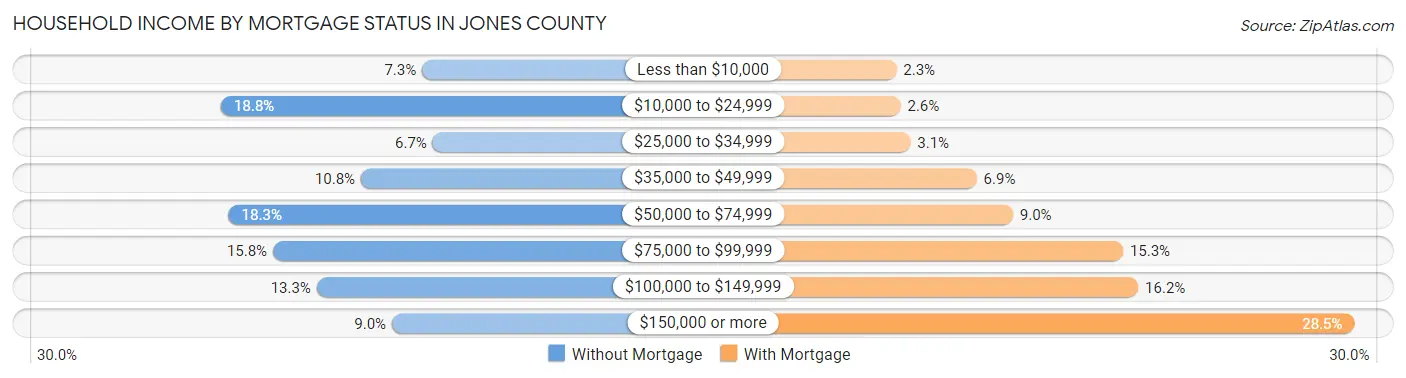
| Household Income | Without Mortgage | With Mortgage |
| Less than $10,000 | 300 (7.3%) | 108 (2.3%) |
| $10,000 to $24,999 | 773 (18.8%) | 119 (2.6%) |
| $25,000 to $34,999 | 275 (6.7%) | 145 (3.1%) |
| $35,000 to $49,999 | 444 (10.8%) | 321 (6.9%) |
| $50,000 to $74,999 | 755 (18.3%) | 417 (9.0%) |
| $75,000 to $99,999 | 651 (15.8%) | 709 (15.3%) |
| $100,000 to $149,999 | 548 (13.3%) | 749 (16.2%) |
| $150,000 or more | 371 (9.0%) | 1,322 (28.5%) |
| Total | 4,117 (100.0%) | 4,639 (100.0%) |
Property Value to Household Income Ratio in Jones County
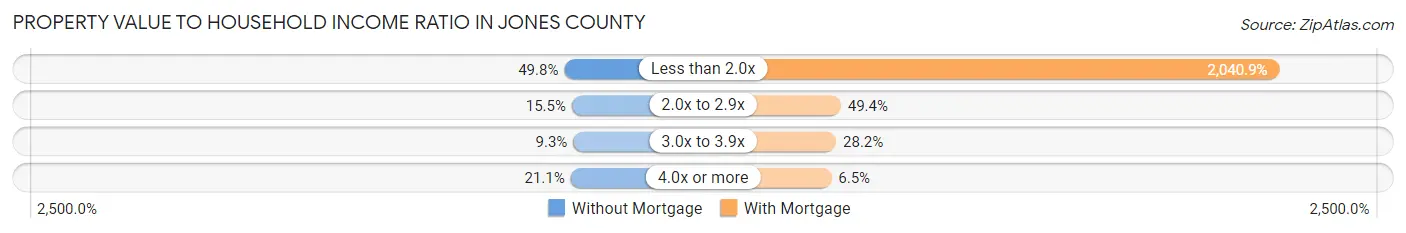
| Value-to-Income Ratio | Without Mortgage | With Mortgage |
| Less than 2.0x | 2,052 (49.8%) | 94,675 (2,040.9%) |
| 2.0x to 2.9x | 637 (15.5%) | 2,292 (49.4%) |
| 3.0x to 3.9x | 383 (9.3%) | 1,307 (28.2%) |
| 4.0x or more | 869 (21.1%) | 300 (6.5%) |
| Total | 4,117 (100.0%) | 4,639 (100.0%) |
Real Estate Taxes by Mortgage Status in Jones County
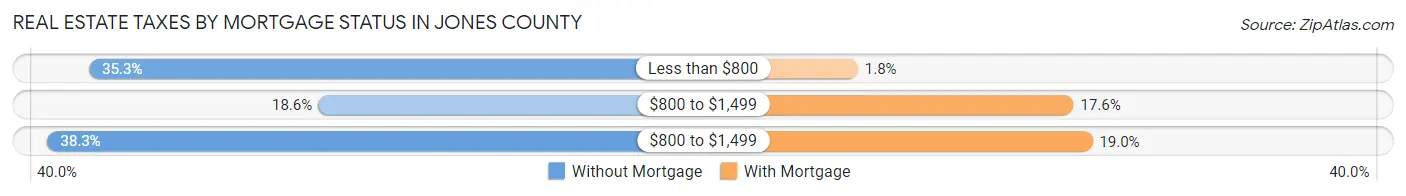
| Property Taxes | Without Mortgage | With Mortgage |
| Less than $800 | 1,453 (35.3%) | 84 (1.8%) |
| $800 to $1,499 | 764 (18.6%) | 815 (17.6%) |
| $800 to $1,499 | 1,578 (38.3%) | 879 (19.0%) |
| Total | 4,117 (100.0%) | 4,639 (100.0%) |
Health & Disability in Jones County
Health Insurance Coverage by Age in Jones County
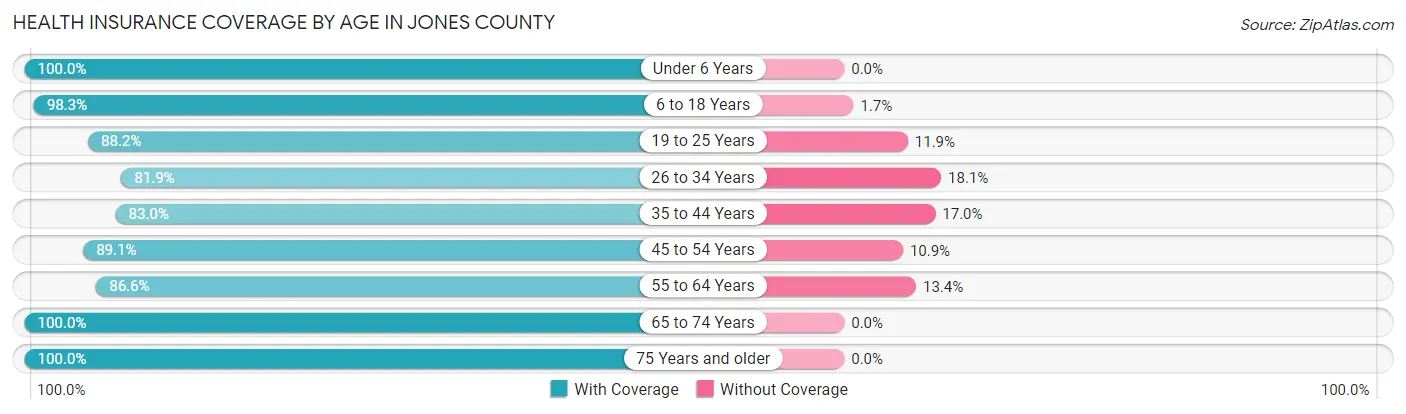
| Age Bracket | With Coverage | Without Coverage |
| Under 6 Years | 1,832 (100.0%) | 0 (0.0%) |
| 6 to 18 Years | 4,735 (98.3%) | 83 (1.7%) |
| 19 to 25 Years | 2,024 (88.1%) | 272 (11.8%) |
| 26 to 34 Years | 2,368 (81.9%) | 522 (18.1%) |
| 35 to 44 Years | 3,110 (83.0%) | 636 (17.0%) |
| 45 to 54 Years | 3,328 (89.1%) | 409 (10.9%) |
| 55 to 64 Years | 3,281 (86.6%) | 507 (13.4%) |
| 65 to 74 Years | 3,057 (100.0%) | 0 (0.0%) |
| 75 Years and older | 1,930 (100.0%) | 0 (0.0%) |
| Total | 25,665 (91.3%) | 2,429 (8.6%) |
Health Insurance Coverage by Citizenship Status in Jones County
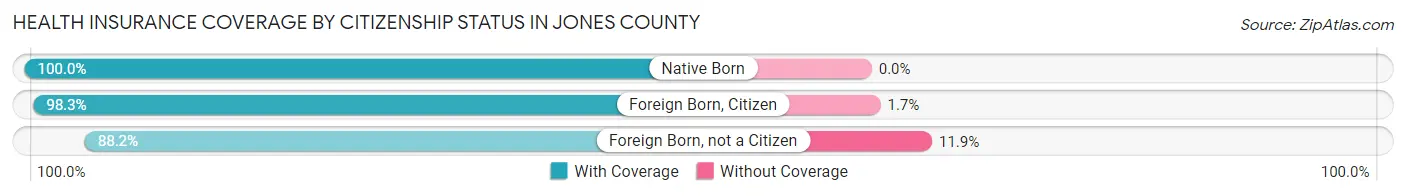
| Citizenship Status | With Coverage | Without Coverage |
| Native Born | 1,832 (100.0%) | 0 (0.0%) |
| Foreign Born, Citizen | 4,735 (98.3%) | 83 (1.7%) |
| Foreign Born, not a Citizen | 2,024 (88.1%) | 272 (11.8%) |
Health Insurance Coverage by Household Income in Jones County
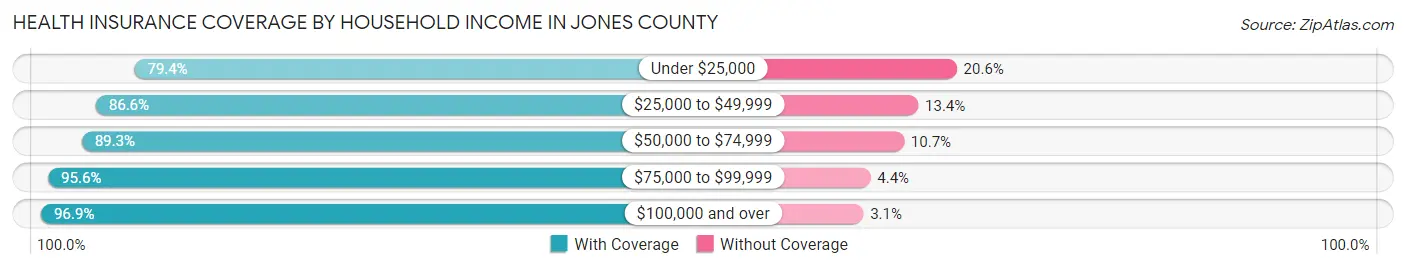
| Household Income | With Coverage | Without Coverage |
| Under $25,000 | 3,052 (79.4%) | 791 (20.6%) |
| $25,000 to $49,999 | 3,831 (86.6%) | 591 (13.4%) |
| $50,000 to $74,999 | 4,383 (89.3%) | 525 (10.7%) |
| $75,000 to $99,999 | 4,212 (95.6%) | 195 (4.4%) |
| $100,000 and over | 10,180 (96.9%) | 323 (3.1%) |
Public vs Private Health Insurance Coverage by Age in Jones County
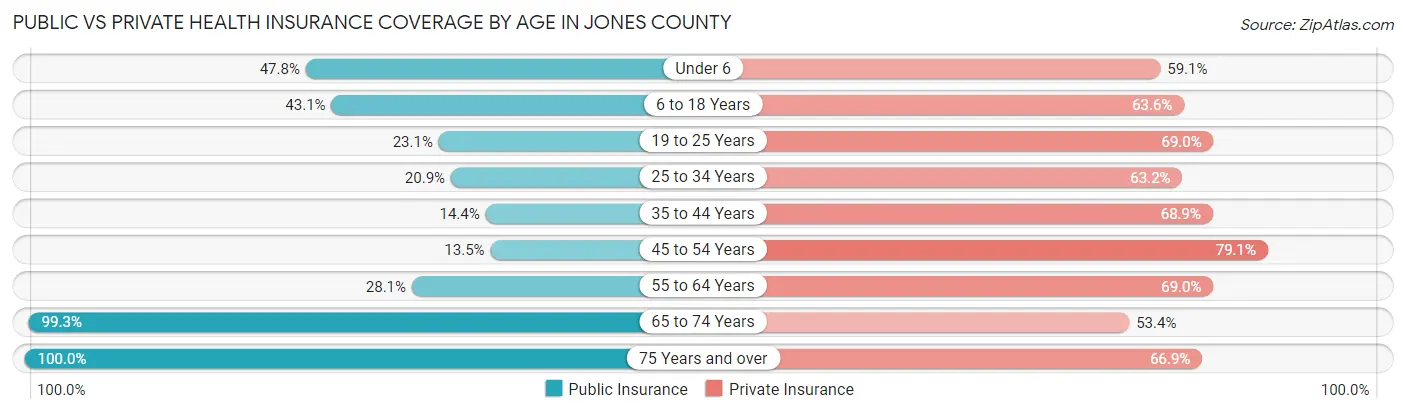
| Age Bracket | Public Insurance | Private Insurance |
| Under 6 | 876 (47.8%) | 1,083 (59.1%) |
| 6 to 18 Years | 2,074 (43.0%) | 3,062 (63.5%) |
| 19 to 25 Years | 531 (23.1%) | 1,584 (69.0%) |
| 25 to 34 Years | 603 (20.9%) | 1,827 (63.2%) |
| 35 to 44 Years | 541 (14.4%) | 2,579 (68.9%) |
| 45 to 54 Years | 506 (13.5%) | 2,955 (79.1%) |
| 55 to 64 Years | 1,065 (28.1%) | 2,612 (69.0%) |
| 65 to 74 Years | 3,034 (99.3%) | 1,631 (53.3%) |
| 75 Years and over | 1,930 (100.0%) | 1,291 (66.9%) |
| Total | 11,160 (39.7%) | 18,624 (66.3%) |
Disability Status by Sex by Age in Jones County
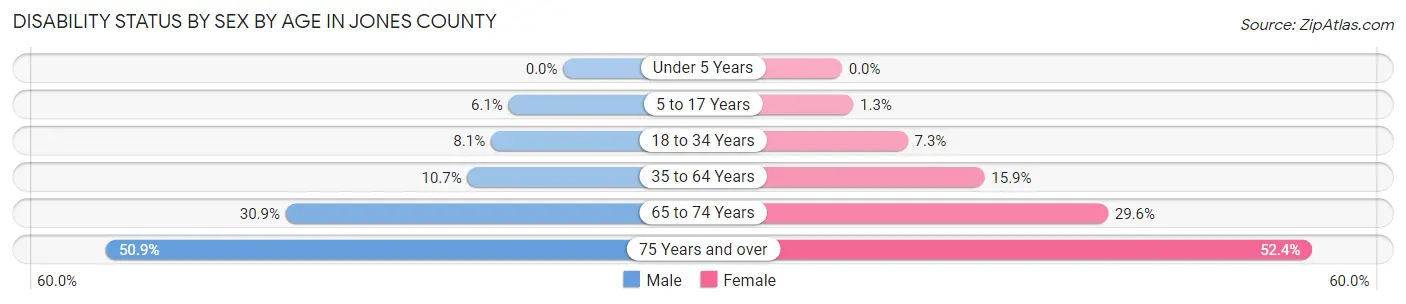
| Age Bracket | Male | Female |
| Under 5 Years | 0 (0.0%) | 0 (0.0%) |
| 5 to 17 Years | 151 (6.1%) | 31 (1.3%) |
| 18 to 34 Years | 227 (8.1%) | 192 (7.3%) |
| 35 to 64 Years | 578 (10.7%) | 930 (15.9%) |
| 65 to 74 Years | 443 (30.9%) | 481 (29.6%) |
| 75 Years and over | 385 (50.9%) | 615 (52.4%) |
Disability Class by Sex by Age in Jones County
Disability Class: Hearing Difficulty
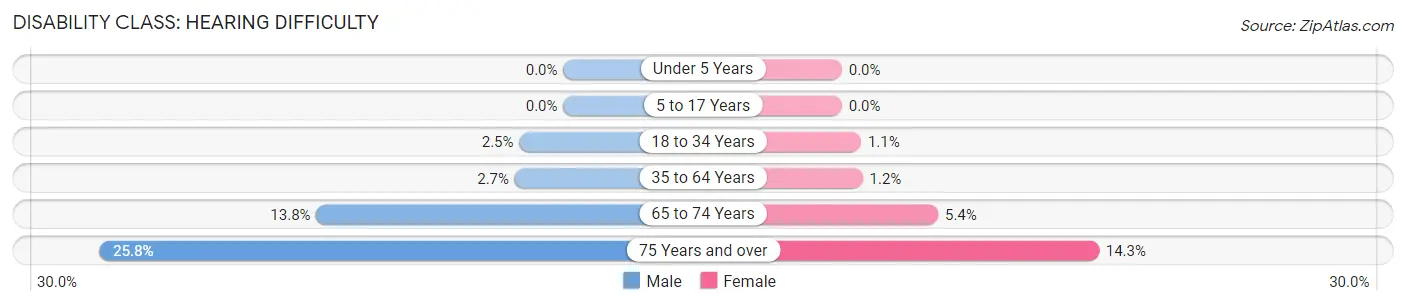
| Age Bracket | Male | Female |
| Under 5 Years | 0 (0.0%) | 0 (0.0%) |
| 5 to 17 Years | 0 (0.0%) | 0 (0.0%) |
| 18 to 34 Years | 69 (2.5%) | 28 (1.1%) |
| 35 to 64 Years | 146 (2.7%) | 68 (1.2%) |
| 65 to 74 Years | 197 (13.8%) | 87 (5.4%) |
| 75 Years and over | 195 (25.8%) | 168 (14.3%) |
Disability Class: Vision Difficulty
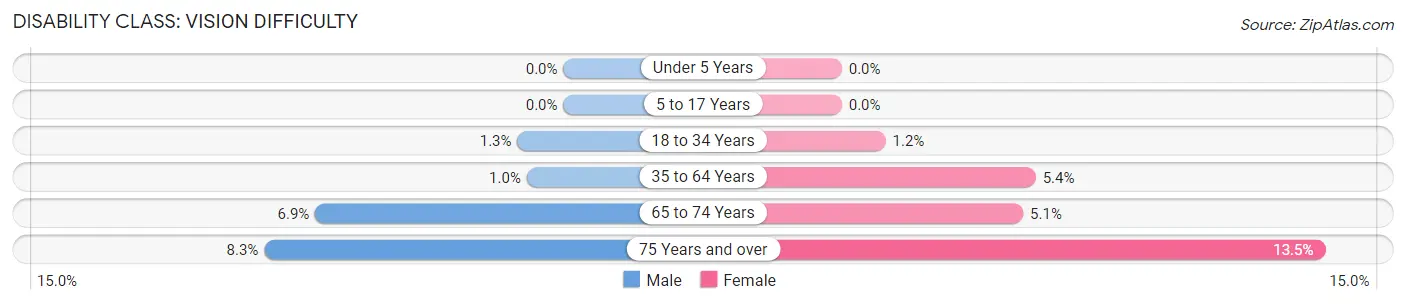
| Age Bracket | Male | Female |
| Under 5 Years | 0 (0.0%) | 0 (0.0%) |
| 5 to 17 Years | 0 (0.0%) | 0 (0.0%) |
| 18 to 34 Years | 36 (1.3%) | 32 (1.2%) |
| 35 to 64 Years | 55 (1.0%) | 316 (5.4%) |
| 65 to 74 Years | 99 (6.9%) | 82 (5.1%) |
| 75 Years and over | 63 (8.3%) | 158 (13.5%) |
Disability Class: Cognitive Difficulty
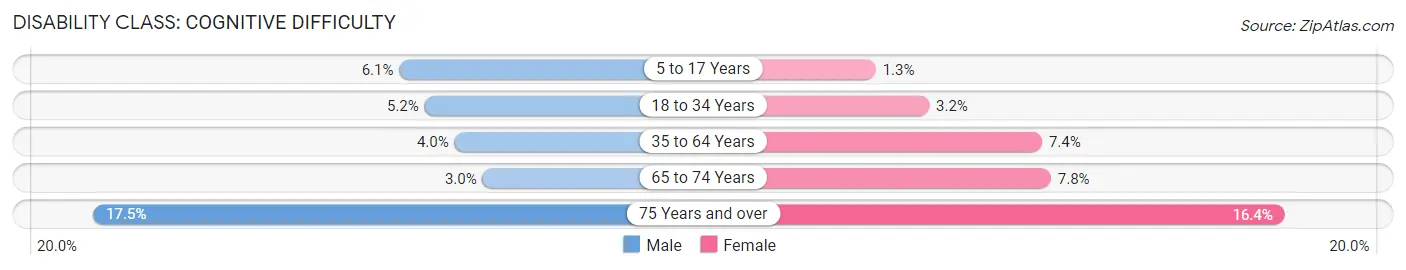
| Age Bracket | Male | Female |
| 5 to 17 Years | 151 (6.1%) | 31 (1.3%) |
| 18 to 34 Years | 145 (5.1%) | 85 (3.2%) |
| 35 to 64 Years | 219 (4.0%) | 435 (7.4%) |
| 65 to 74 Years | 43 (3.0%) | 126 (7.8%) |
| 75 Years and over | 132 (17.5%) | 193 (16.4%) |
Disability Class: Ambulatory Difficulty
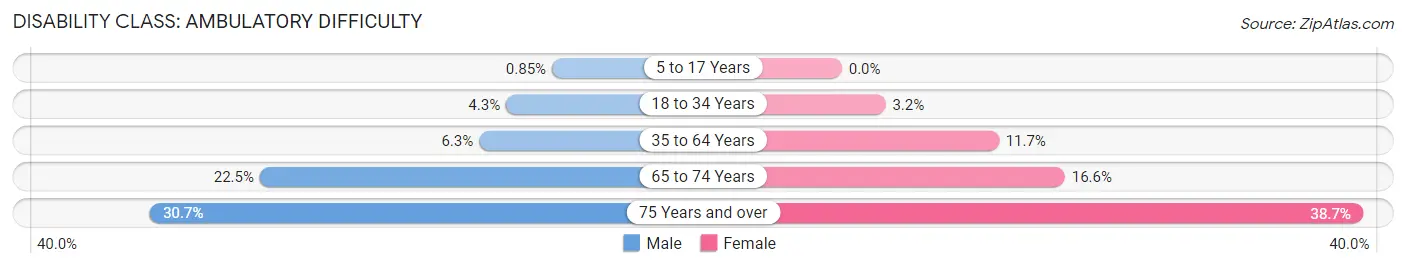
| Age Bracket | Male | Female |
| 5 to 17 Years | 21 (0.9%) | 0 (0.0%) |
| 18 to 34 Years | 120 (4.3%) | 85 (3.2%) |
| 35 to 64 Years | 339 (6.3%) | 682 (11.7%) |
| 65 to 74 Years | 323 (22.5%) | 269 (16.6%) |
| 75 Years and over | 232 (30.7%) | 454 (38.7%) |
Disability Class: Self-Care Difficulty
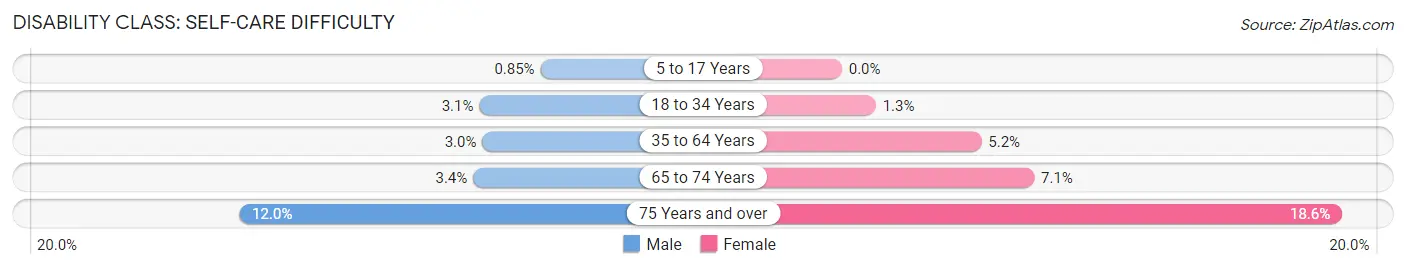
| Age Bracket | Male | Female |
| 5 to 17 Years | 21 (0.9%) | 0 (0.0%) |
| 18 to 34 Years | 88 (3.1%) | 33 (1.3%) |
| 35 to 64 Years | 163 (3.0%) | 303 (5.2%) |
| 65 to 74 Years | 48 (3.4%) | 116 (7.1%) |
| 75 Years and over | 91 (12.0%) | 218 (18.6%) |
Technology Access in Jones County
Computing Device Access in Jones County
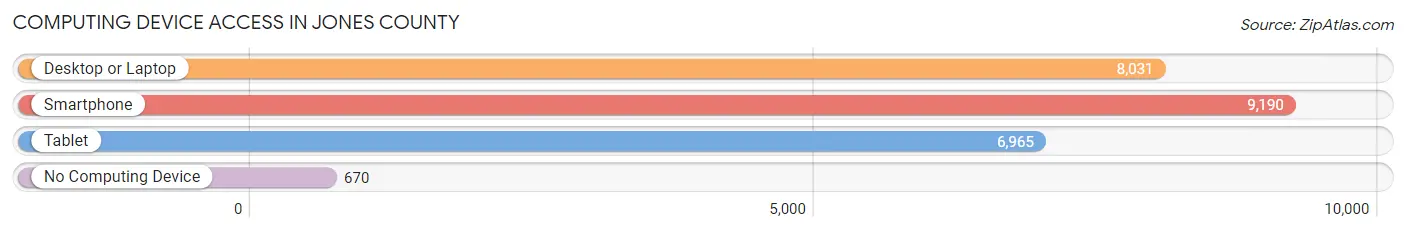
| Device Type | # Households | % Households |
| Desktop or Laptop | 8,031 | 75.9% |
| Smartphone | 9,190 | 86.9% |
| Tablet | 6,965 | 65.8% |
| No Computing Device | 670 | 6.3% |
| Total | 10,581 | 100.0% |
Internet Access in Jones County
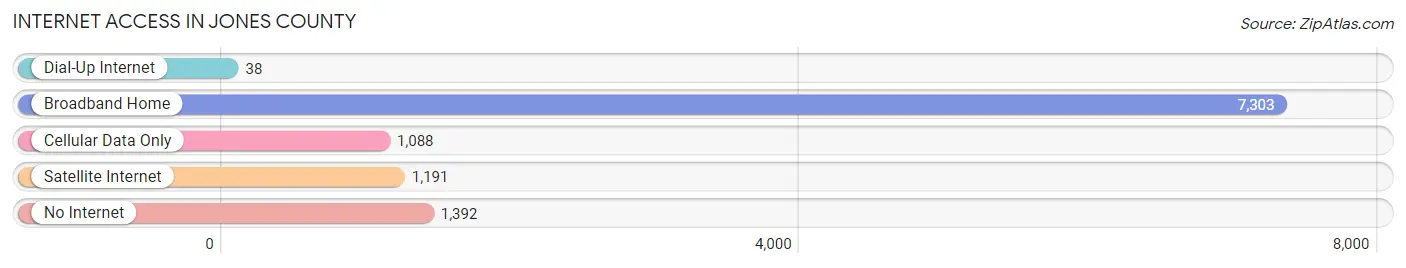
| Internet Type | # Households | % Households |
| Dial-Up Internet | 38 | 0.4% |
| Broadband Home | 7,303 | 69.0% |
| Cellular Data Only | 1,088 | 10.3% |
| Satellite Internet | 1,191 | 11.3% |
| No Internet | 1,392 | 13.2% |
| Total | 10,581 | 100.0% |
Jones County Summary
Jones County is located in the central part of the state of Georgia, in the United States. It is part of the Macon metropolitan statistical area and is bordered by Bibb, Twiggs, Wilkinson, Baldwin, Putnam, Jasper, and Monroe counties. The county seat is Gray.
History
Jones County was created in 1807 from parts of Baldwin and Houston counties. It was named for Noble Jones, a Revolutionary War hero and one of the original settlers of the area. Jones was a planter and a member of the Georgia General Assembly.
The county was home to several Native American tribes, including the Creek, Cherokee, and Choctaw. The first European settlers arrived in the area in the late 1700s. The county was largely agricultural, with cotton being the main crop.
In the early 1900s, the county experienced a period of growth and development. The county seat of Gray was incorporated in 1906, and the county's first bank opened in 1907. The county also saw the construction of several railroads, which helped to spur economic growth.
Geography
Jones County is located in the central part of the state of Georgia. It is bordered by Bibb, Twiggs, Wilkinson, Baldwin, Putnam, Jasper, and Monroe counties. The county has a total area of 441 square miles, of which 437 square miles is land and 4 square miles is water.
The county is mostly flat, with some rolling hills in the northern part. The Ocmulgee River runs through the county, and there are several creeks and streams. The county is home to several state parks, including High Falls State Park and Indian Springs State Park.
Economy
The economy of Jones County is largely based on agriculture. The county is home to several large farms, and the main crops grown are cotton, corn, soybeans, and peanuts. The county also has a thriving timber industry, and there are several sawmills in the area.
The county is also home to several manufacturing companies, including a paper mill, a furniture factory, and a plastics plant. The county is also home to several retail stores, restaurants, and other businesses.
Demographics
As of the 2010 census, Jones County had a population of 28,669. The racial makeup of the county was 79.3% White, 17.2% African American, 0.4% Native American, 0.7% Asian, 0.1% Pacific Islander, 1.2% from other races, and 1.1% from two or more races. Hispanic or Latino of any race were 3.2% of the population.
The median income for a household in the county was $37,945, and the median income for a family was $45,945. The per capita income for the county was $18,945. About 17.2% of the population was below the poverty line.
Common Questions
What is Per Capita Income in Jones County?
Per Capita income in Jones County is $31,934.
What is the Median Family Income in Jones County?
Median Family Income in Jones County is $80,876.
What is the Median Household income in Jones County?
Median Household Income in Jones County is $66,288.
What is Income or Wage Gap in Jones County?
Income or Wage Gap in Jones County is 25.6%.
Women in Jones County earn 74.4 cents for every dollar earned by a man.
What is Family Income Deficit in Jones County?
Family Income Deficit in Jones County is $12,475.
Families that are below poverty line in Jones County earn $12,475 less on average than the poverty threshold level.
What is Inequality or Gini Index in Jones County?
Inequality or Gini Index in Jones County is 0.45.
What is the Total Population of Jones County?
Total Population of Jones County is 28,382.
What is the Total Male Population of Jones County?
Total Male Population of Jones County is 13,905.
What is the Total Female Population of Jones County?
Total Female Population of Jones County is 14,477.
What is the Ratio of Males per 100 Females in Jones County?
There are 96.05 Males per 100 Females in Jones County.
What is the Ratio of Females per 100 Males in Jones County?
There are 104.11 Females per 100 Males in Jones County.
What is the Median Population Age in Jones County?
Median Population Age in Jones County is 41.3 Years.
What is the Average Family Size in Jones County
Average Family Size in Jones County is 3.2 People.
What is the Average Household Size in Jones County
Average Household Size in Jones County is 2.7 People.
How Large is the Labor Force in Jones County?
There are 13,276 People in the Labor Forcein in Jones County.
What is the Percentage of People in the Labor Force in Jones County?
58.4% of People are in the Labor Force in Jones County.
What is the Unemployment Rate in Jones County?
Unemployment Rate in Jones County is 4.3%.