Harris County, GA Map & Demographics
Harris County Map
Harris County Overview
$39,851
PER CAPITA INCOME
$99,819
AVG FAMILY INCOME
$85,936
AVG HOUSEHOLD INCOME
28.0%
WAGE / INCOME GAP [ % ]
72.0¢/ $1
WAGE / INCOME GAP [ $ ]
$12,086
FAMILY INCOME DEFICIT
0.41
INEQUALITY / GINI INDEX
34,914
TOTAL POPULATION
17,698
MALE POPULATION
17,216
FEMALE POPULATION
102.80
MALES / 100 FEMALES
97.28
FEMALES / 100 MALES
43.2
MEDIAN AGE
3.2
AVG FAMILY SIZE
2.8
AVG HOUSEHOLD SIZE
17,088
LABOR FORCE [ PEOPLE ]
60.2%
PERCENT IN LABOR FORCE
5.8%
UNEMPLOYMENT RATE
Harris County Area Codes
Income in Harris County
Income Overview in Harris County
Per Capita Income in Harris County is $39,851, while median incomes of families and households are $99,819 and $85,936 respectively.
| Characteristic | Number | Measure |
| Per Capita Income | 34,914 | $39,851 |
| Median Family Income | 9,487 | $99,819 |
| Mean Family Income | 9,487 | $124,044 |
| Median Household Income | 12,204 | $85,936 |
| Mean Household Income | 12,204 | $109,995 |
| Income Deficit | 9,487 | $12,086 |
| Wage / Income Gap (%) | 34,914 | 27.97% |
| Wage / Income Gap ($) | 34,914 | 72.03¢ per $1 |
| Gini / Inequality Index | 34,914 | 0.41 |
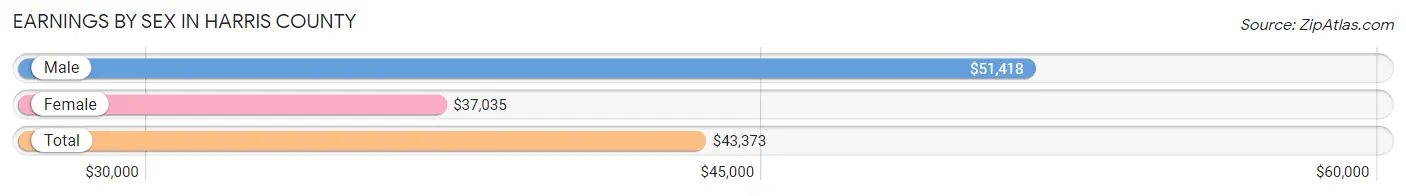
Earnings by Sex in Harris County
Average Earnings in Harris County are $43,373, $51,418 for men and $37,035 for women, a difference of 28.0%.
| Sex | Number | Average Earnings |
| Male | 9,585 (53.9%) | $51,418 |
| Female | 8,209 (46.1%) | $37,035 |
| Total | 17,794 (100.0%) | $43,373 |
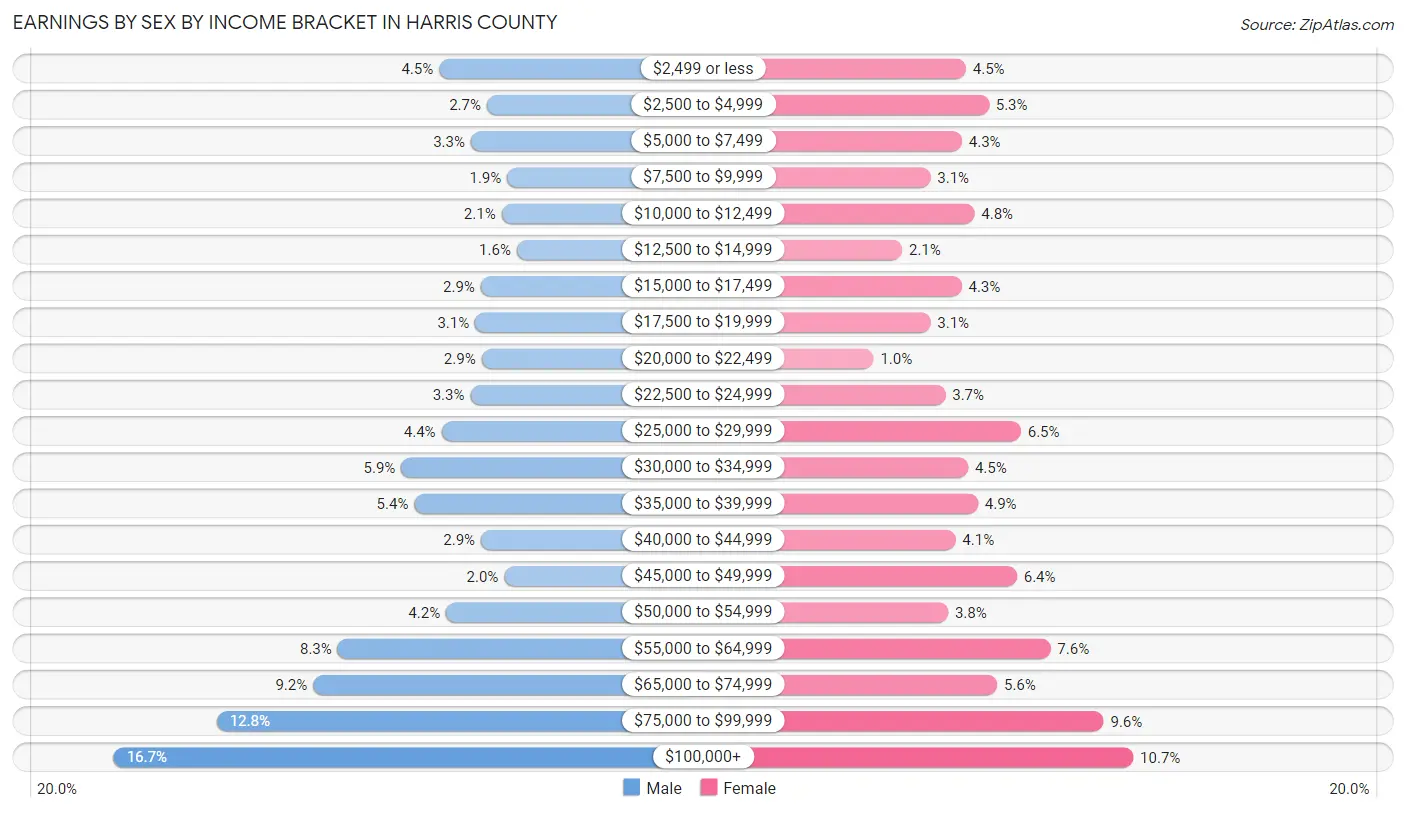
Earnings by Sex by Income Bracket in Harris County
The most common earnings brackets in Harris County are $100,000+ for men (1,597 | 16.7%) and $100,000+ for women (881 | 10.7%).
| Income | Male | Female |
| $2,499 or less | 428 (4.5%) | 366 (4.5%) |
| $2,500 to $4,999 | 257 (2.7%) | 437 (5.3%) |
| $5,000 to $7,499 | 314 (3.3%) | 354 (4.3%) |
| $7,500 to $9,999 | 184 (1.9%) | 257 (3.1%) |
| $10,000 to $12,499 | 204 (2.1%) | 392 (4.8%) |
| $12,500 to $14,999 | 150 (1.6%) | 170 (2.1%) |
| $15,000 to $17,499 | 279 (2.9%) | 353 (4.3%) |
| $17,500 to $19,999 | 299 (3.1%) | 257 (3.1%) |
| $20,000 to $22,499 | 276 (2.9%) | 82 (1.0%) |
| $22,500 to $24,999 | 316 (3.3%) | 303 (3.7%) |
| $25,000 to $29,999 | 420 (4.4%) | 535 (6.5%) |
| $30,000 to $34,999 | 565 (5.9%) | 373 (4.5%) |
| $35,000 to $39,999 | 518 (5.4%) | 403 (4.9%) |
| $40,000 to $44,999 | 278 (2.9%) | 334 (4.1%) |
| $45,000 to $49,999 | 195 (2.0%) | 523 (6.4%) |
| $50,000 to $54,999 | 404 (4.2%) | 311 (3.8%) |
| $55,000 to $64,999 | 793 (8.3%) | 626 (7.6%) |
| $65,000 to $74,999 | 881 (9.2%) | 462 (5.6%) |
| $75,000 to $99,999 | 1,227 (12.8%) | 790 (9.6%) |
| $100,000+ | 1,597 (16.7%) | 881 (10.7%) |
| Total | 9,585 (100.0%) | 8,209 (100.0%) |
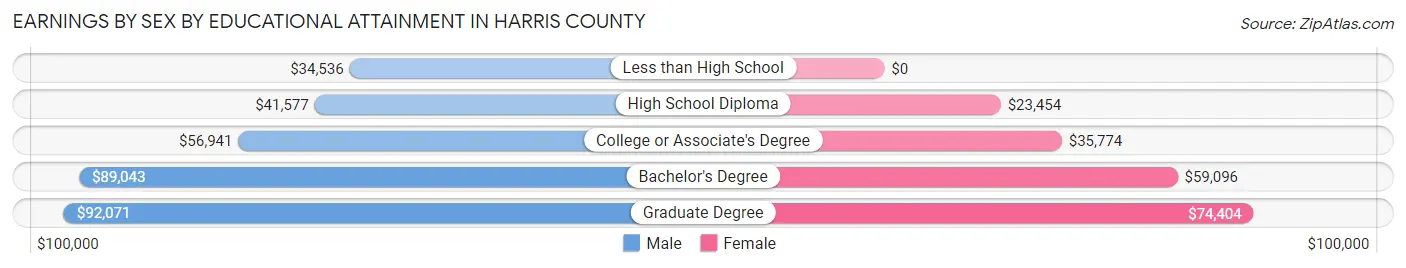
Earnings by Sex by Educational Attainment in Harris County
Average earnings in Harris County are $60,858 for men and $45,065 for women, a difference of 26.0%. Men with an educational attainment of graduate degree enjoy the highest average annual earnings of $92,071, while those with less than high school education earn the least with $34,536. Women with an educational attainment of graduate degree earn the most with the average annual earnings of $74,404, while those with high school diploma education have the smallest earnings of $23,454.
| Educational Attainment | Male Income | Female Income |
| Less than High School | $34,536 | $0 |
| High School Diploma | $41,577 | $23,454 |
| College or Associate's Degree | $56,941 | $35,774 |
| Bachelor's Degree | $89,043 | $59,096 |
| Graduate Degree | $92,071 | $74,404 |
| Total | $60,858 | $45,065 |
Family Income in Harris County
Family Income Brackets in Harris County
According to the Harris County family income data, there are 2,154 families falling into the $100,000 to $149,999 income range, which is the most common income bracket and makes up 22.7% of all families. Conversely, the $10,000 to $14,999 income bracket is the least frequent group with only 142 families (1.5%) belonging to this category.
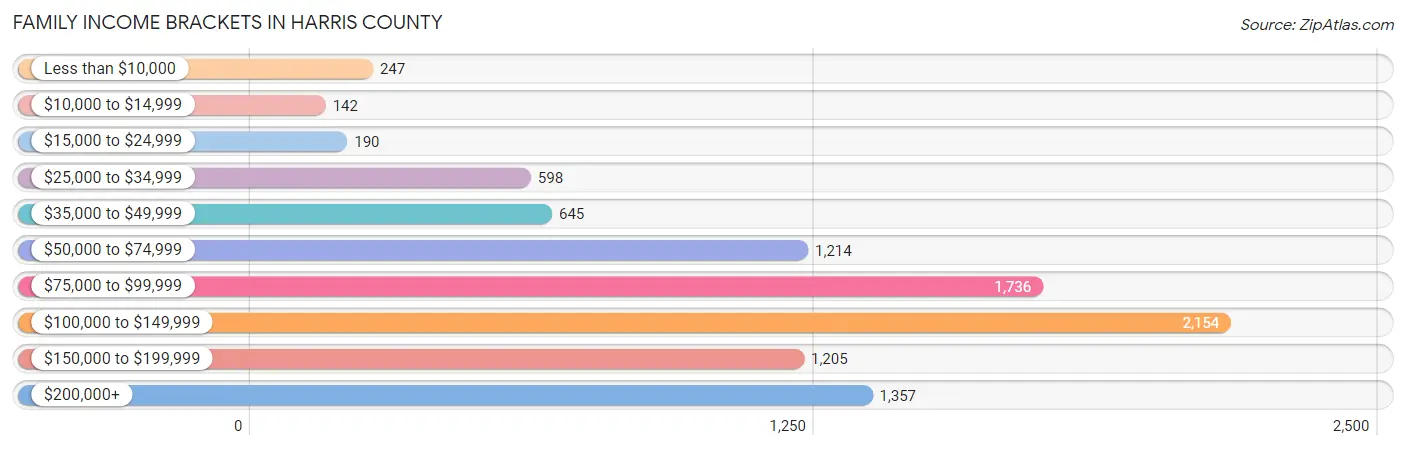
| Income Bracket | # Families | % Families |
| Less than $10,000 | 247 | 2.6% |
| $10,000 to $14,999 | 142 | 1.5% |
| $15,000 to $24,999 | 190 | 2.0% |
| $25,000 to $34,999 | 598 | 6.3% |
| $35,000 to $49,999 | 645 | 6.8% |
| $50,000 to $74,999 | 1,214 | 12.8% |
| $75,000 to $99,999 | 1,736 | 18.3% |
| $100,000 to $149,999 | 2,154 | 22.7% |
| $150,000 to $199,999 | 1,205 | 12.7% |
| $200,000+ | 1,357 | 14.3% |
Family Income by Famaliy Size in Harris County
6-person families (332 | 3.5%) account for the highest median family income in Harris County with $155,755 per family, while 2-person families (4,855 | 51.2%) have the highest median income of $44,010 per family member.
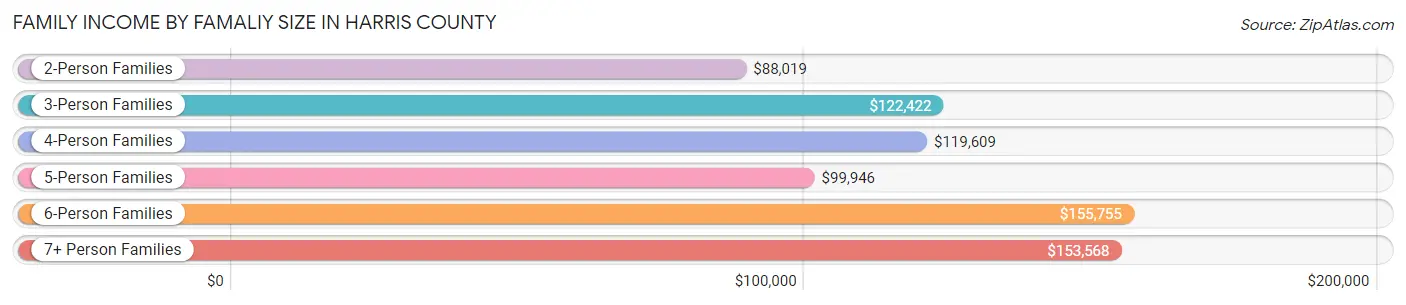
| Income Bracket | # Families | Median Income |
| 2-Person Families | 4,855 (51.2%) | $88,019 |
| 3-Person Families | 1,701 (17.9%) | $122,422 |
| 4-Person Families | 1,752 (18.5%) | $119,609 |
| 5-Person Families | 704 (7.4%) | $99,946 |
| 6-Person Families | 332 (3.5%) | $155,755 |
| 7+ Person Families | 143 (1.5%) | $153,568 |
| Total | 9,487 (100.0%) | $99,819 |
Family Income by Number of Earners in Harris County
The median family income in Harris County is $99,819, with families comprising 3+ earners (1,077) having the highest median family income of $168,542, while families with no earners (1,839) have the lowest median family income of $58,210, accounting for 11.4% and 19.4% of families, respectively.
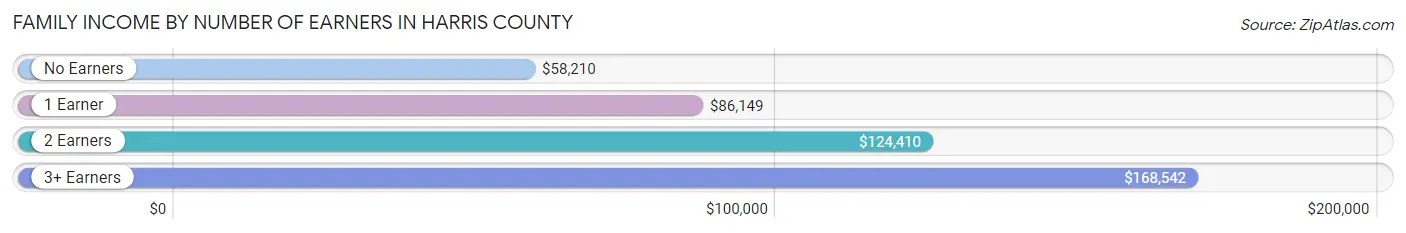
| Number of Earners | # Families | Median Income |
| No Earners | 1,839 (19.4%) | $58,210 |
| 1 Earner | 2,860 (30.1%) | $86,149 |
| 2 Earners | 3,711 (39.1%) | $124,410 |
| 3+ Earners | 1,077 (11.4%) | $168,542 |
| Total | 9,487 (100.0%) | $99,819 |
Household Income in Harris County
Household Income Brackets in Harris County
With 2,270 households falling in the category, the $50,000 to $74,999 income range is the most frequent in Harris County, accounting for 18.6% of all households. In contrast, only 232 households (1.9%) fall into the $10,000 to $14,999 income bracket, making it the least populous group.
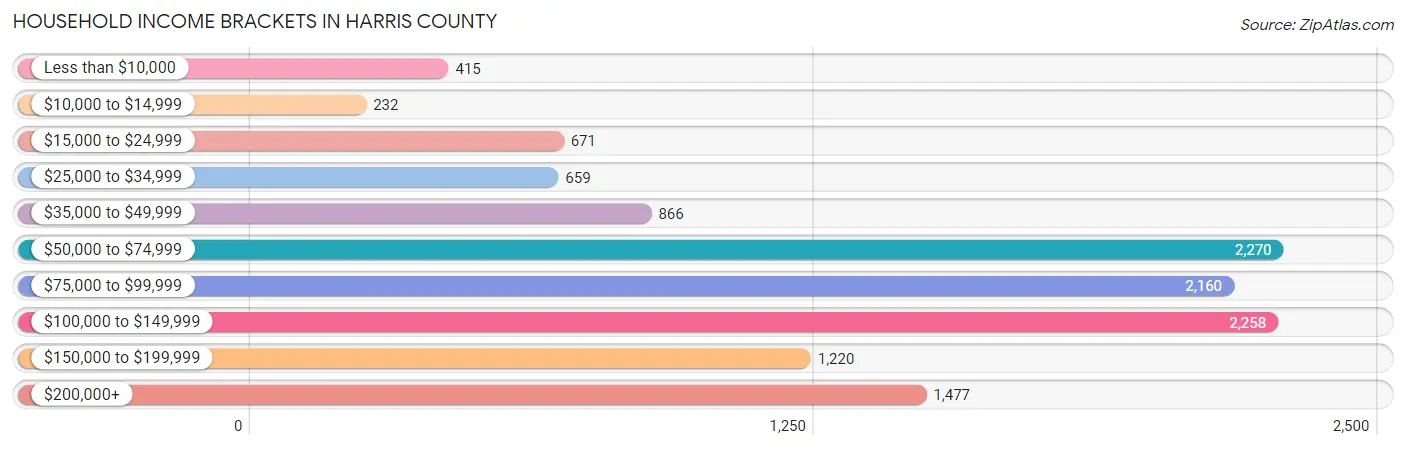
| Income Bracket | # Households | % Households |
| Less than $10,000 | 415 | 3.4% |
| $10,000 to $14,999 | 232 | 1.9% |
| $15,000 to $24,999 | 671 | 5.5% |
| $25,000 to $34,999 | 659 | 5.4% |
| $35,000 to $49,999 | 866 | 7.1% |
| $50,000 to $74,999 | 2,270 | 18.6% |
| $75,000 to $99,999 | 2,160 | 17.7% |
| $100,000 to $149,999 | 2,258 | 18.5% |
| $150,000 to $199,999 | 1,220 | 10.0% |
| $200,000+ | 1,477 | 12.1% |
Household Income by Householder Age in Harris County
The median household income in Harris County is $85,936, with the highest median household income of $98,333 found in the 45 to 64 years age bracket for the primary householder. A total of 5,078 households (41.6%) fall into this category. Meanwhile, the 15 to 24 years age bracket for the primary householder has the lowest median household income of $0, with 113 households (0.9%) in this group.
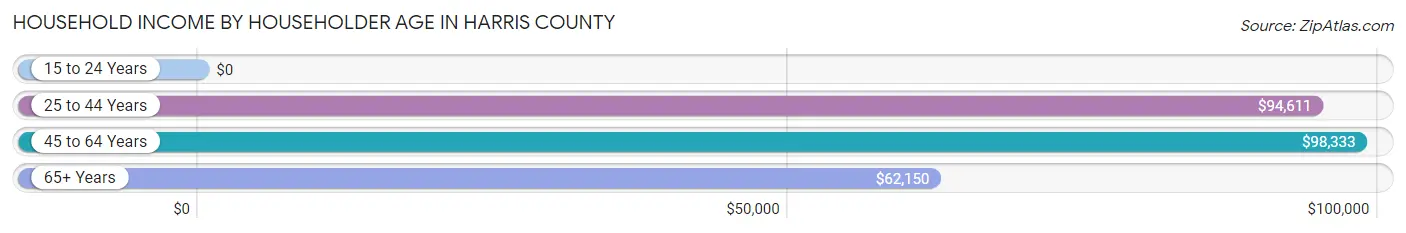
| Income Bracket | # Households | Median Income |
| 15 to 24 Years | 113 (0.9%) | $0 |
| 25 to 44 Years | 3,322 (27.2%) | $94,611 |
| 45 to 64 Years | 5,078 (41.6%) | $98,333 |
| 65+ Years | 3,691 (30.2%) | $62,150 |
| Total | 12,204 (100.0%) | $85,936 |
Poverty in Harris County
Income Below Poverty by Sex and Age in Harris County
With 7.3% poverty level for males and 7.7% for females among the residents of Harris County, 18 to 24 year old males and 16 and 17 year old females are the most vulnerable to poverty, with 152 males (10.5%) and 116 females (28.4%) in their respective age groups living below the poverty level.
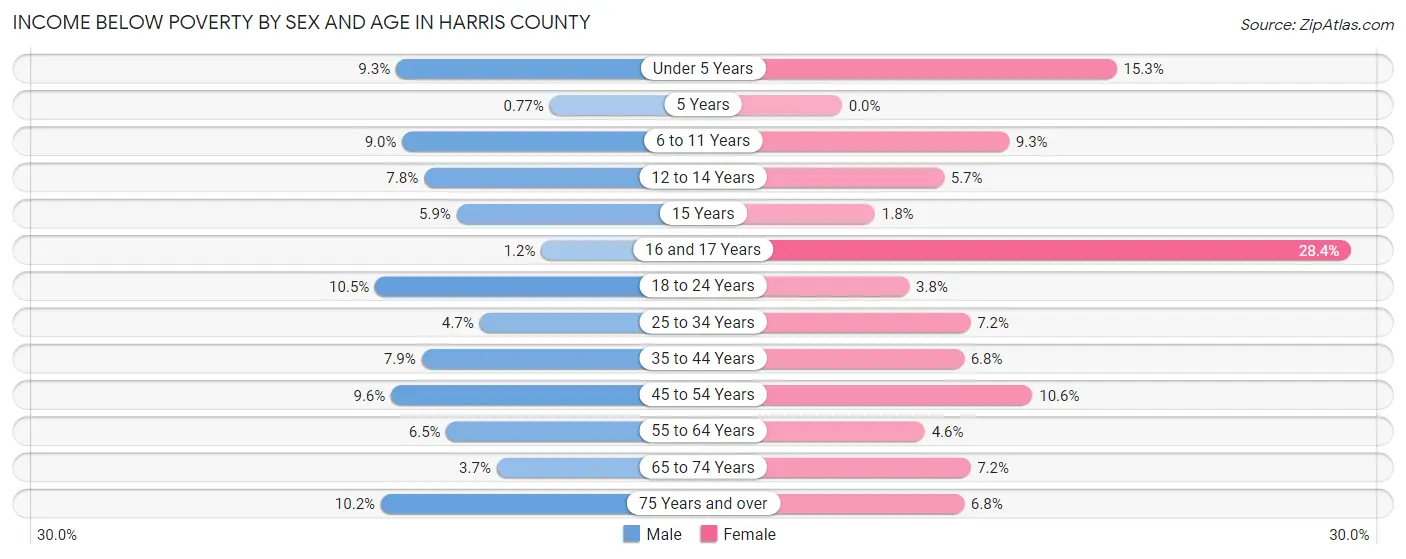
| Age Bracket | Male | Female |
| Under 5 Years | 92 (9.3%) | 112 (15.3%) |
| 5 Years | 1 (0.8%) | 0 (0.0%) |
| 6 to 11 Years | 120 (9.0%) | 99 (9.3%) |
| 12 to 14 Years | 54 (7.8%) | 44 (5.7%) |
| 15 Years | 18 (5.9%) | 5 (1.8%) |
| 16 and 17 Years | 6 (1.2%) | 116 (28.4%) |
| 18 to 24 Years | 152 (10.5%) | 47 (3.7%) |
| 25 to 34 Years | 83 (4.7%) | 129 (7.1%) |
| 35 to 44 Years | 161 (7.9%) | 141 (6.8%) |
| 45 to 54 Years | 233 (9.6%) | 270 (10.6%) |
| 55 to 64 Years | 170 (6.5%) | 120 (4.6%) |
| 65 to 74 Years | 76 (3.7%) | 158 (7.1%) |
| 75 Years and over | 105 (10.2%) | 76 (6.8%) |
| Total | 1,271 (7.3%) | 1,317 (7.7%) |
Income Above Poverty by Sex and Age in Harris County
According to the poverty statistics in Harris County, males aged 5 years and females aged 5 years are the age groups that are most secure financially, with 99.2% of males and 100.0% of females in these age groups living above the poverty line.
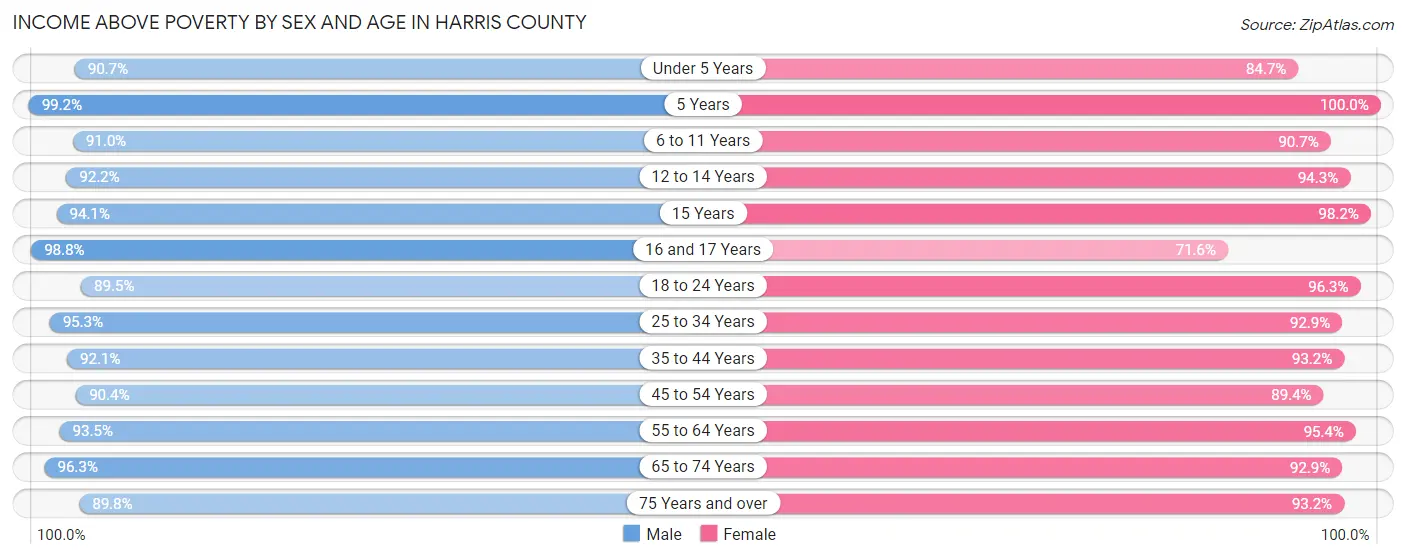
| Age Bracket | Male | Female |
| Under 5 Years | 895 (90.7%) | 620 (84.7%) |
| 5 Years | 129 (99.2%) | 222 (100.0%) |
| 6 to 11 Years | 1,218 (91.0%) | 965 (90.7%) |
| 12 to 14 Years | 642 (92.2%) | 730 (94.3%) |
| 15 Years | 285 (94.1%) | 267 (98.2%) |
| 16 and 17 Years | 483 (98.8%) | 293 (71.6%) |
| 18 to 24 Years | 1,298 (89.5%) | 1,205 (96.3%) |
| 25 to 34 Years | 1,693 (95.3%) | 1,675 (92.8%) |
| 35 to 44 Years | 1,877 (92.1%) | 1,937 (93.2%) |
| 45 to 54 Years | 2,197 (90.4%) | 2,274 (89.4%) |
| 55 to 64 Years | 2,441 (93.5%) | 2,476 (95.4%) |
| 65 to 74 Years | 1,972 (96.3%) | 2,053 (92.8%) |
| 75 Years and over | 928 (89.8%) | 1,042 (93.2%) |
| Total | 16,058 (92.7%) | 15,759 (92.3%) |
Income Below Poverty Among Married-Couple Families in Harris County
The poverty statistics for married-couple families in Harris County show that 2.7% or 217 of the total 7,922 families live below the poverty line. Families with 3 or 4 children have the highest poverty rate of 4.7%, comprising of 34 families. On the other hand, families with 5 or more children have the lowest poverty rate of 0.0%, which includes 0 families.
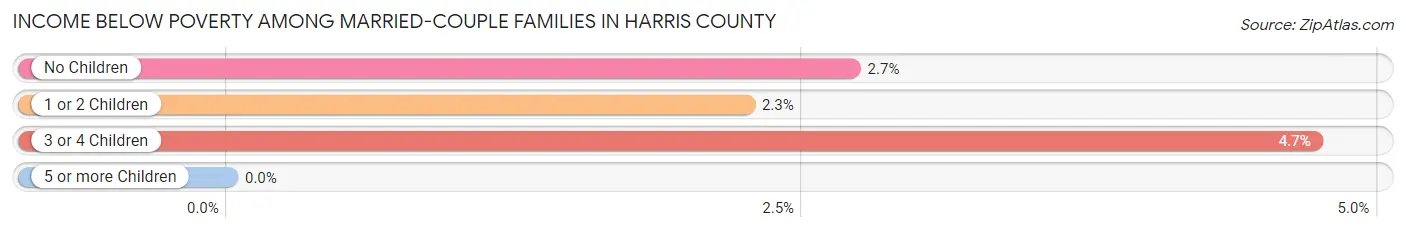
| Children | Above Poverty | Below Poverty |
| No Children | 4,557 (97.3%) | 127 (2.7%) |
| 1 or 2 Children | 2,433 (97.8%) | 56 (2.2%) |
| 3 or 4 Children | 687 (95.3%) | 34 (4.7%) |
| 5 or more Children | 28 (100.0%) | 0 (0.0%) |
| Total | 7,705 (97.3%) | 217 (2.7%) |
Income Below Poverty Among Single-Parent Households in Harris County
According to the poverty data in Harris County, 17.0% or 89 single-father households and 23.5% or 245 single-mother households are living below the poverty line. Among single-father households, those with 1 or 2 children have the highest poverty rate, with 39 households (29.8%) experiencing poverty. Likewise, among single-mother households, those with 3 or 4 children have the highest poverty rate, with 47 households (59.5%) falling below the poverty line.
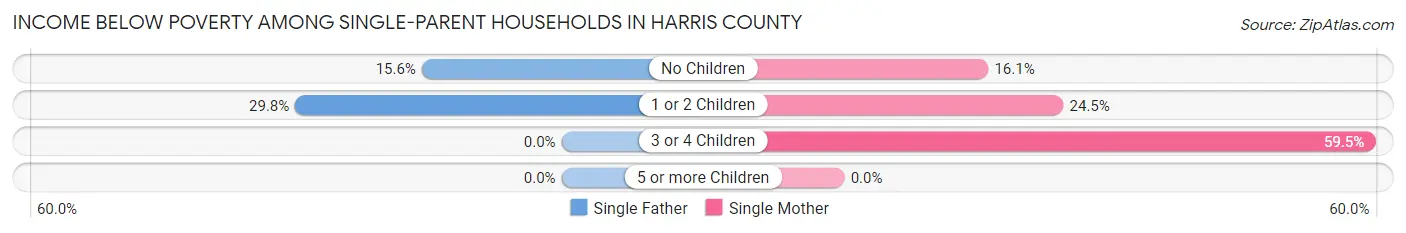
| Children | Single Father | Single Mother |
| No Children | 50 (15.6%) | 72 (16.1%) |
| 1 or 2 Children | 39 (29.8%) | 126 (24.5%) |
| 3 or 4 Children | 0 (0.0%) | 47 (59.5%) |
| 5 or more Children | 0 (0.0%) | 0 (0.0%) |
| Total | 89 (17.0%) | 245 (23.5%) |
Income Below Poverty Among Married-Couple vs Single-Parent Households in Harris County
The poverty data for Harris County shows that 217 of the married-couple family households (2.7%) and 334 of the single-parent households (21.3%) are living below the poverty level. Within the married-couple family households, those with 3 or 4 children have the highest poverty rate, with 34 households (4.7%) falling below the poverty line. Among the single-parent households, those with 3 or 4 children have the highest poverty rate, with 47 household (31.1%) living below poverty.
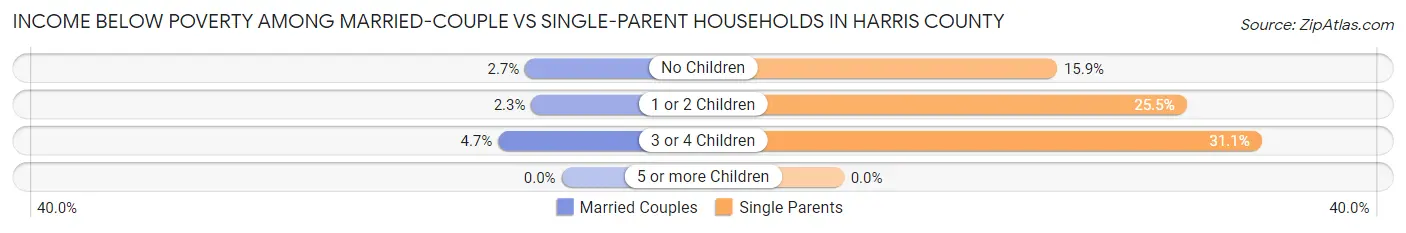
| Children | Married-Couple Families | Single-Parent Households |
| No Children | 127 (2.7%) | 122 (15.9%) |
| 1 or 2 Children | 56 (2.2%) | 165 (25.5%) |
| 3 or 4 Children | 34 (4.7%) | 47 (31.1%) |
| 5 or more Children | 0 (0.0%) | 0 (0.0%) |
| Total | 217 (2.7%) | 334 (21.3%) |
Race in Harris County
The most populous races in Harris County are White / Caucasian (27,027 | 77.4%), Black / African American (5,432 | 15.6%), and Hispanic or Latino (1,551 | 4.4%).
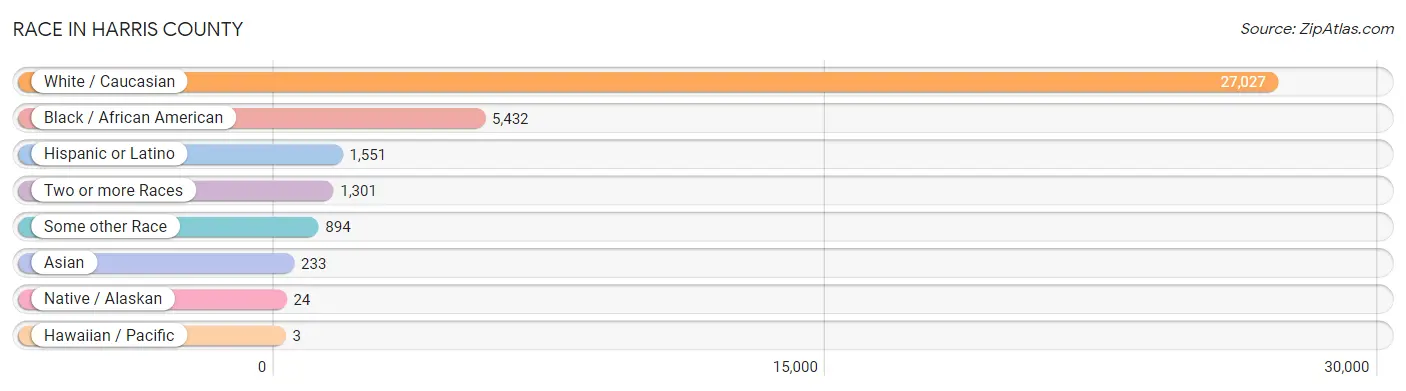
| Race | # Population | % Population |
| Asian | 233 | 0.7% |
| Black / African American | 5,432 | 15.6% |
| Hawaiian / Pacific | 3 | 0.0% |
| Hispanic or Latino | 1,551 | 4.4% |
| Native / Alaskan | 24 | 0.1% |
| White / Caucasian | 27,027 | 77.4% |
| Two or more Races | 1,301 | 3.7% |
| Some other Race | 894 | 2.6% |
| Total | 34,914 | 100.0% |
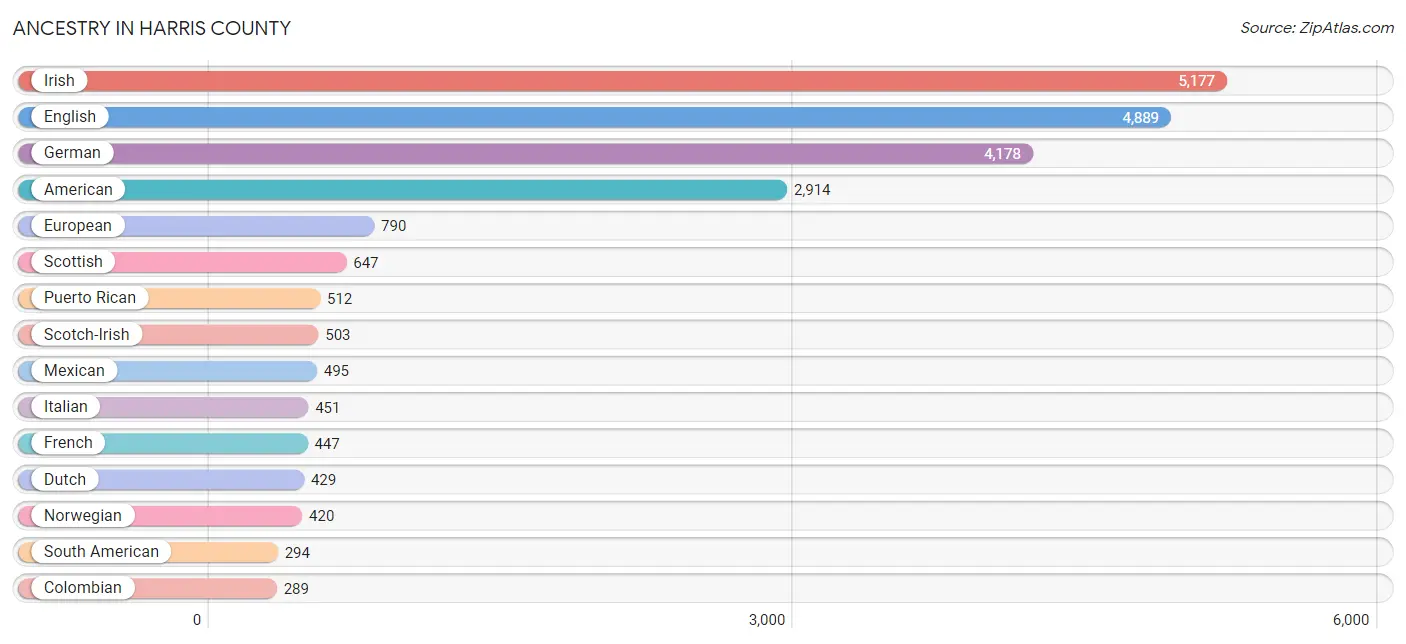
Ancestry in Harris County
The most populous ancestries reported in Harris County are Irish (5,177 | 14.8%), English (4,889 | 14.0%), German (4,178 | 12.0%), American (2,914 | 8.4%), and European (790 | 2.3%), together accounting for 51.4% of all Harris County residents.
| Ancestry | # Population | % Population |
| African | 33 | 0.1% |
| Aleut | 6 | 0.0% |
| American | 2,914 | 8.4% |
| Arab | 27 | 0.1% |
| Austrian | 43 | 0.1% |
| Bhutanese | 200 | 0.6% |
| Brazilian | 52 | 0.2% |
| British | 168 | 0.5% |
| Burmese | 135 | 0.4% |
| Canadian | 19 | 0.1% |
| Central American | 42 | 0.1% |
| Central American Indian | 6 | 0.0% |
| Cherokee | 115 | 0.3% |
| Chippewa | 14 | 0.0% |
| Colombian | 289 | 0.8% |
| Creek | 13 | 0.0% |
| Croatian | 9 | 0.0% |
| Cuban | 31 | 0.1% |
| Czech | 53 | 0.2% |
| Czechoslovakian | 76 | 0.2% |
| Danish | 154 | 0.4% |
| Dominican | 38 | 0.1% |
| Dutch | 429 | 1.2% |
| Eastern European | 152 | 0.4% |
| English | 4,889 | 14.0% |
| European | 790 | 2.3% |
| Finnish | 5 | 0.0% |
| French | 447 | 1.3% |
| French Canadian | 53 | 0.2% |
| German | 4,178 | 12.0% |
| Greek | 22 | 0.1% |
| Guatemalan | 14 | 0.0% |
| Haitian | 21 | 0.1% |
| Honduran | 4 | 0.0% |
| Hungarian | 97 | 0.3% |
| Indian (Asian) | 26 | 0.1% |
| Irish | 5,177 | 14.8% |
| Iroquois | 56 | 0.2% |
| Israeli | 16 | 0.1% |
| Italian | 451 | 1.3% |
| Jamaican | 95 | 0.3% |
| Korean | 115 | 0.3% |
| Lebanese | 20 | 0.1% |
| Maltese | 17 | 0.1% |
| Mexican | 495 | 1.4% |
| Native Hawaiian | 3 | 0.0% |
| Navajo | 29 | 0.1% |
| Northern European | 26 | 0.1% |
| Norwegian | 420 | 1.2% |
| Paiute | 1 | 0.0% |
| Pakistani | 9 | 0.0% |
| Panamanian | 24 | 0.1% |
| Peruvian | 5 | 0.0% |
| Polish | 212 | 0.6% |
| Portuguese | 13 | 0.0% |
| Puerto Rican | 512 | 1.5% |
| Romanian | 58 | 0.2% |
| Russian | 59 | 0.2% |
| Scandinavian | 104 | 0.3% |
| Scotch-Irish | 503 | 1.4% |
| Scottish | 647 | 1.8% |
| Sioux | 61 | 0.2% |
| Slovak | 12 | 0.0% |
| South American | 294 | 0.8% |
| Spaniard | 53 | 0.2% |
| Spanish | 1 | 0.0% |
| Sri Lankan | 40 | 0.1% |
| Subsaharan African | 33 | 0.1% |
| Swedish | 75 | 0.2% |
| Swiss | 3 | 0.0% |
| Syrian | 7 | 0.0% |
| Thai | 154 | 0.4% |
| Ukrainian | 25 | 0.1% |
| Welsh | 148 | 0.4% |
| West Indian | 1 | 0.0% | View All 75 Rows |
Immigrants in Harris County
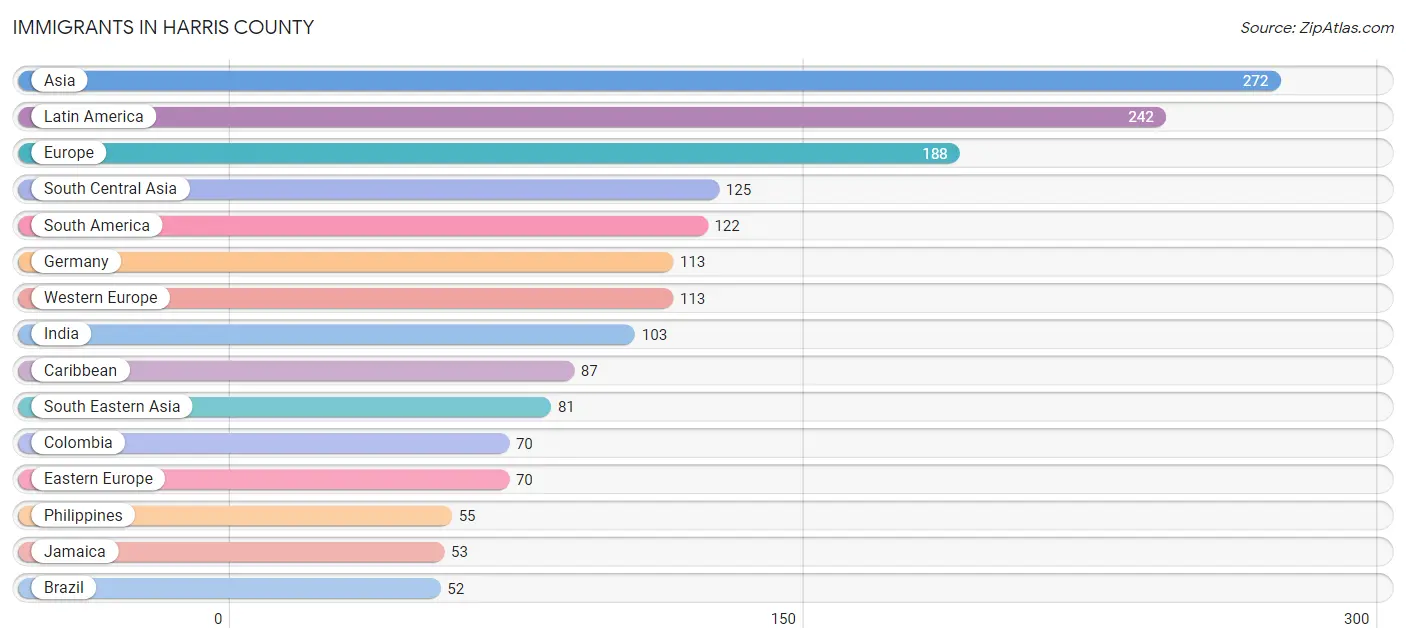
The most numerous immigrant groups reported in Harris County came from Asia (272 | 0.8%), Latin America (242 | 0.7%), Europe (188 | 0.5%), South Central Asia (125 | 0.4%), and South America (122 | 0.4%), together accounting for 2.7% of all Harris County residents.
| Immigration Origin | # Population | % Population |
| Africa | 47 | 0.1% |
| Asia | 272 | 0.8% |
| Bangladesh | 5 | 0.0% |
| Brazil | 52 | 0.2% |
| Canada | 24 | 0.1% |
| Caribbean | 87 | 0.3% |
| Central America | 33 | 0.1% |
| Colombia | 70 | 0.2% |
| Dominican Republic | 34 | 0.1% |
| Eastern Asia | 50 | 0.1% |
| Eastern Europe | 70 | 0.2% |
| El Salvador | 7 | 0.0% |
| England | 3 | 0.0% |
| Europe | 188 | 0.5% |
| Germany | 113 | 0.3% |
| India | 103 | 0.3% |
| Israel | 16 | 0.1% |
| Jamaica | 53 | 0.2% |
| Japan | 13 | 0.0% |
| Kazakhstan | 17 | 0.1% |
| Korea | 37 | 0.1% |
| Latin America | 242 | 0.7% |
| Mexico | 26 | 0.1% |
| Middle Africa | 47 | 0.1% |
| Northern Europe | 5 | 0.0% |
| Oceania | 4 | 0.0% |
| Philippines | 55 | 0.2% |
| Poland | 36 | 0.1% |
| Romania | 17 | 0.1% |
| Scotland | 2 | 0.0% |
| South America | 122 | 0.4% |
| South Central Asia | 125 | 0.4% |
| South Eastern Asia | 81 | 0.2% |
| Thailand | 9 | 0.0% |
| Vietnam | 17 | 0.1% |
| Western Asia | 16 | 0.1% |
| Western Europe | 113 | 0.3% |
| Zaire | 47 | 0.1% | View All 38 Rows |
Sex and Age in Harris County
Sex and Age in Harris County
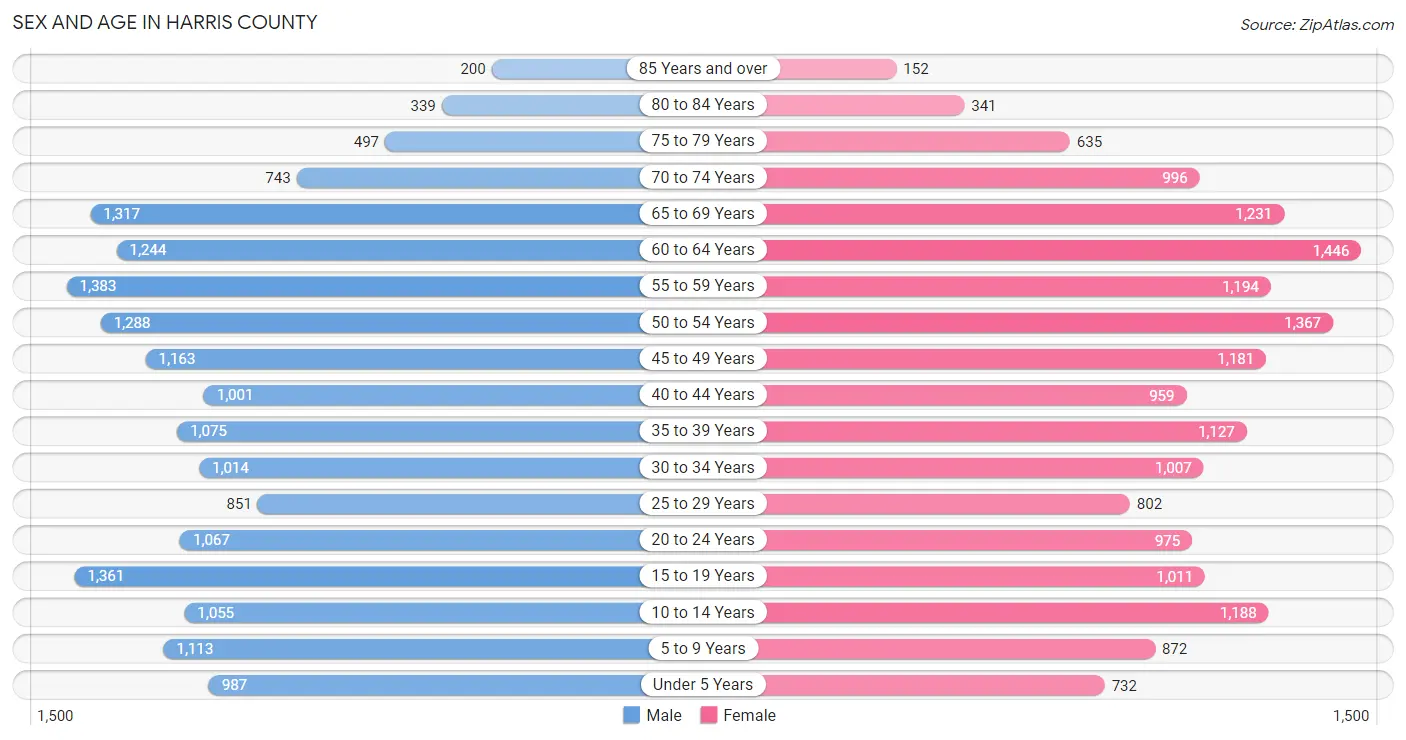
The most populous age groups in Harris County are 55 to 59 Years (1,383 | 7.8%) for men and 60 to 64 Years (1,446 | 8.4%) for women.
| Age Bracket | Male | Female |
| Under 5 Years | 987 (5.6%) | 732 (4.3%) |
| 5 to 9 Years | 1,113 (6.3%) | 872 (5.1%) |
| 10 to 14 Years | 1,055 (6.0%) | 1,188 (6.9%) |
| 15 to 19 Years | 1,361 (7.7%) | 1,011 (5.9%) |
| 20 to 24 Years | 1,067 (6.0%) | 975 (5.7%) |
| 25 to 29 Years | 851 (4.8%) | 802 (4.7%) |
| 30 to 34 Years | 1,014 (5.7%) | 1,007 (5.9%) |
| 35 to 39 Years | 1,075 (6.1%) | 1,127 (6.6%) |
| 40 to 44 Years | 1,001 (5.7%) | 959 (5.6%) |
| 45 to 49 Years | 1,163 (6.6%) | 1,181 (6.9%) |
| 50 to 54 Years | 1,288 (7.3%) | 1,367 (7.9%) |
| 55 to 59 Years | 1,383 (7.8%) | 1,194 (6.9%) |
| 60 to 64 Years | 1,244 (7.0%) | 1,446 (8.4%) |
| 65 to 69 Years | 1,317 (7.4%) | 1,231 (7.1%) |
| 70 to 74 Years | 743 (4.2%) | 996 (5.8%) |
| 75 to 79 Years | 497 (2.8%) | 635 (3.7%) |
| 80 to 84 Years | 339 (1.9%) | 341 (2.0%) |
| 85 Years and over | 200 (1.1%) | 152 (0.9%) |
| Total | 17,698 (100.0%) | 17,216 (100.0%) |
Families and Households in Harris County
Median Family Size in Harris County
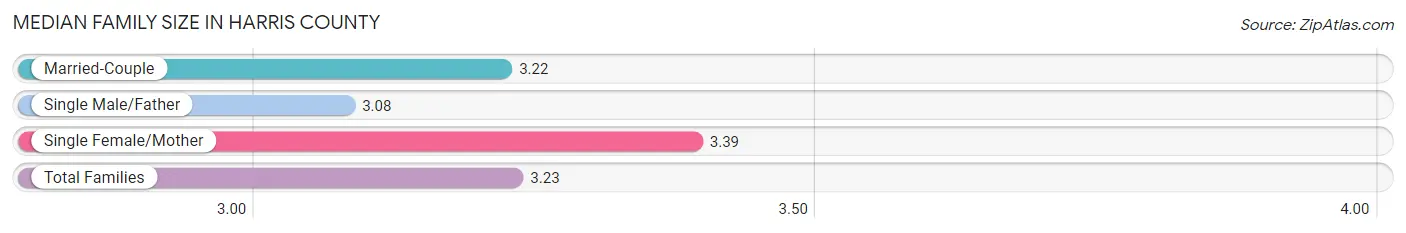
The median family size in Harris County is 3.23 persons per family, with single female/mother families (1,042 | 11.0%) accounting for the largest median family size of 3.39 persons per family. On the other hand, single male/father families (523 | 5.5%) represent the smallest median family size with 3.08 persons per family.
| Family Type | # Families | Family Size |
| Married-Couple | 7,922 (83.5%) | 3.22 |
| Single Male/Father | 523 (5.5%) | 3.08 |
| Single Female/Mother | 1,042 (11.0%) | 3.39 |
| Total Families | 9,487 (100.0%) | 3.23 |
Median Household Size in Harris County
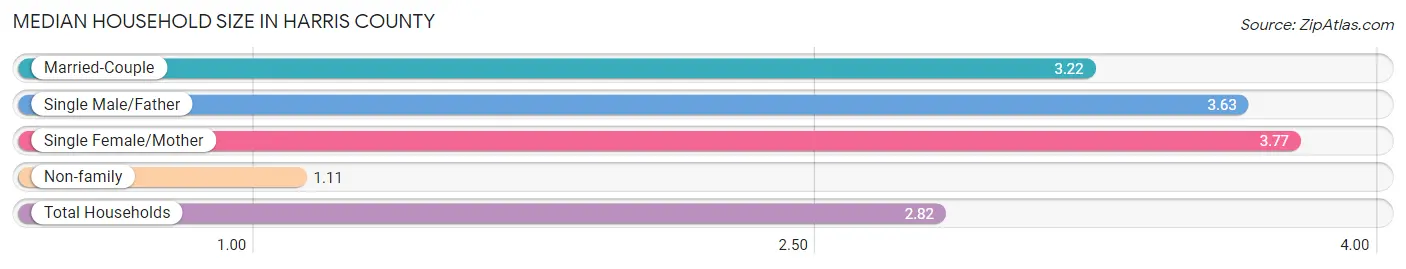
The median household size in Harris County is 2.82 persons per household, with single female/mother households (1,042 | 8.5%) accounting for the largest median household size of 3.77 persons per household. non-family households (2,717 | 22.3%) represent the smallest median household size with 1.11 persons per household.
| Household Type | # Households | Household Size |
| Married-Couple | 7,922 (64.9%) | 3.22 |
| Single Male/Father | 523 (4.3%) | 3.63 |
| Single Female/Mother | 1,042 (8.5%) | 3.77 |
| Non-family | 2,717 (22.3%) | 1.11 |
| Total Households | 12,204 (100.0%) | 2.82 |
Household Size by Marriage Status in Harris County
Out of a total of 12,204 households in Harris County, 9,487 (77.7%) are family households, while 2,717 (22.3%) are nonfamily households. The most numerous type of family households are 2-person households, comprising 4,632, and the most common type of nonfamily households are 1-person households, comprising 2,551.
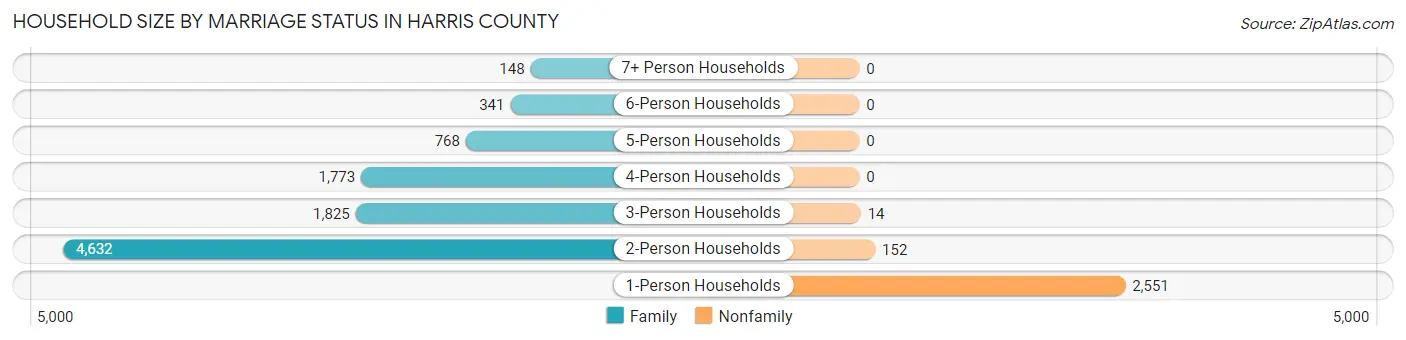
| Household Size | Family Households | Nonfamily Households |
| 1-Person Households | - | 2,551 (20.9%) |
| 2-Person Households | 4,632 (38.0%) | 152 (1.3%) |
| 3-Person Households | 1,825 (14.9%) | 14 (0.1%) |
| 4-Person Households | 1,773 (14.5%) | 0 (0.0%) |
| 5-Person Households | 768 (6.3%) | 0 (0.0%) |
| 6-Person Households | 341 (2.8%) | 0 (0.0%) |
| 7+ Person Households | 148 (1.2%) | 0 (0.0%) |
| Total | 9,487 (77.7%) | 2,717 (22.3%) |
Female Fertility in Harris County
Fertility by Age in Harris County
Average fertility rate in Harris County is 49.0 births per 1,000 women. Women in the age bracket of 20 to 34 years have the highest fertility rate with 92.0 births per 1,000 women. Women in the age bracket of 20 to 34 years acount for 71.9% of all women with births.
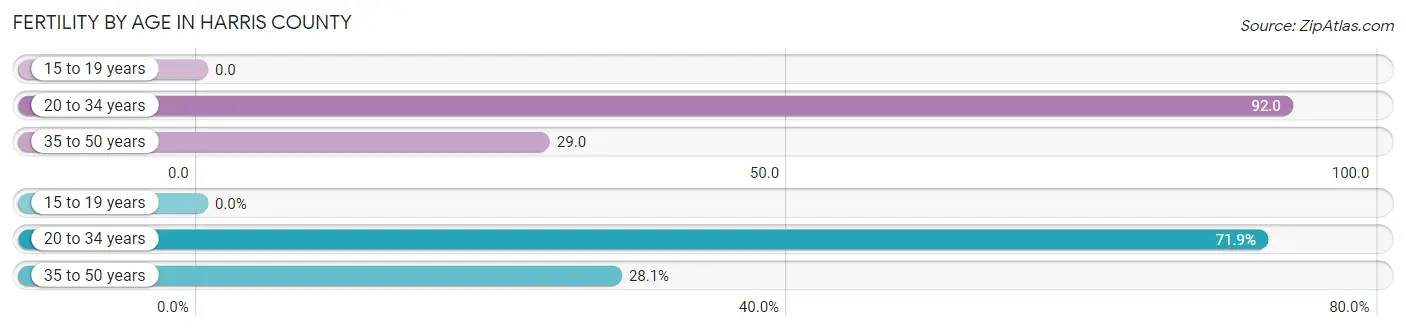
| Age Bracket | Women with Births | Births / 1,000 Women |
| 15 to 19 years | 0 (0.0%) | 0.0 |
| 20 to 34 years | 256 (71.9%) | 92.0 |
| 35 to 50 years | 100 (28.1%) | 29.0 |
| Total | 356 (100.0%) | 49.0 |
Fertility by Age by Marriage Status in Harris County
87.4% of women with births (356) in Harris County are married. The highest percentage of unmarried women with births falls into 35 to 50 years age bracket with 28.0% of them unmarried at the time of birth, while the lowest percentage of unmarried women with births belong to 20 to 34 years age bracket with 6.6% of them unmarried.
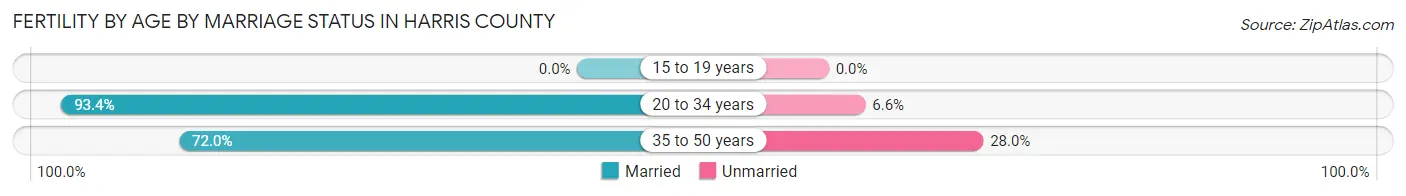
| Age Bracket | Married | Unmarried |
| 15 to 19 years | 0 (0.0%) | 0 (0.0%) |
| 20 to 34 years | 239 (93.4%) | 17 (6.6%) |
| 35 to 50 years | 72 (72.0%) | 28 (28.0%) |
| Total | 311 (87.4%) | 45 (12.6%) |
Fertility by Education in Harris County
Average fertility rate in Harris County is 49.0 births per 1,000 women. Women with the education attainment of graduate degree have the highest fertility rate of 163.0 births per 1,000 women, while women with the education attainment of high school diploma have the lowest fertility at 6.0 births per 1,000 women. Women with the education attainment of graduate degree represent 44.7% of all women with births.
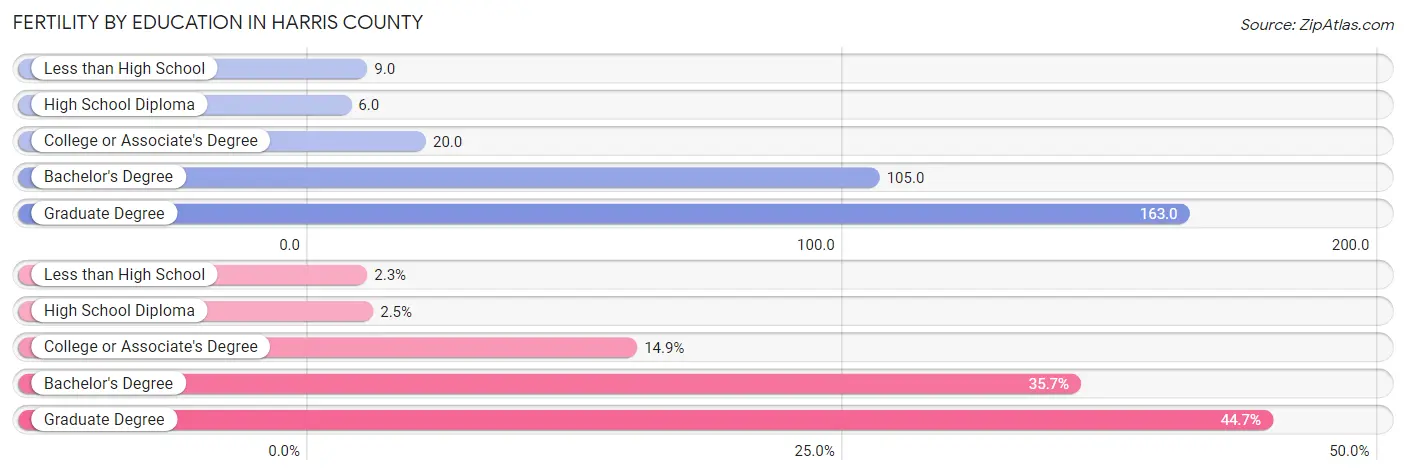
| Educational Attainment | Women with Births | Births / 1,000 Women |
| Less than High School | 8 (2.2%) | 9.0 |
| High School Diploma | 9 (2.5%) | 6.0 |
| College or Associate's Degree | 53 (14.9%) | 20.0 |
| Bachelor's Degree | 127 (35.7%) | 105.0 |
| Graduate Degree | 159 (44.7%) | 163.0 |
| Total | 356 (100.0%) | 49.0 |
Fertility by Education by Marriage Status in Harris County
12.6% of women with births in Harris County are unmarried. Women with the educational attainment of college or associate's degree are most likely to be married with 100.0% of them married at childbirth, while women with the educational attainment of less than high school are least likely to be married with 100.0% of them unmarried at childbirth.
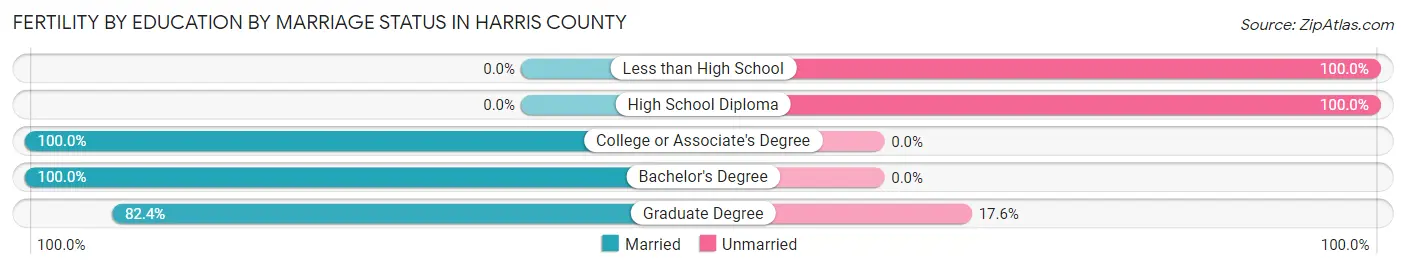
| Educational Attainment | Married | Unmarried |
| Less than High School | 0 (0.0%) | 8 (100.0%) |
| High School Diploma | 0 (0.0%) | 9 (100.0%) |
| College or Associate's Degree | 53 (100.0%) | 0 (0.0%) |
| Bachelor's Degree | 127 (100.0%) | 0 (0.0%) |
| Graduate Degree | 131 (82.4%) | 28 (17.6%) |
| Total | 311 (87.4%) | 45 (12.6%) |
Employment Characteristics in Harris County
Employment by Class of Employer in Harris County
Among the 15,595 employed individuals in Harris County, private company employees (9,784 | 62.7%), local government employees (1,718 | 11.0%), and not-for-profit organizations (1,329 | 8.5%) make up the most common classes of employment.
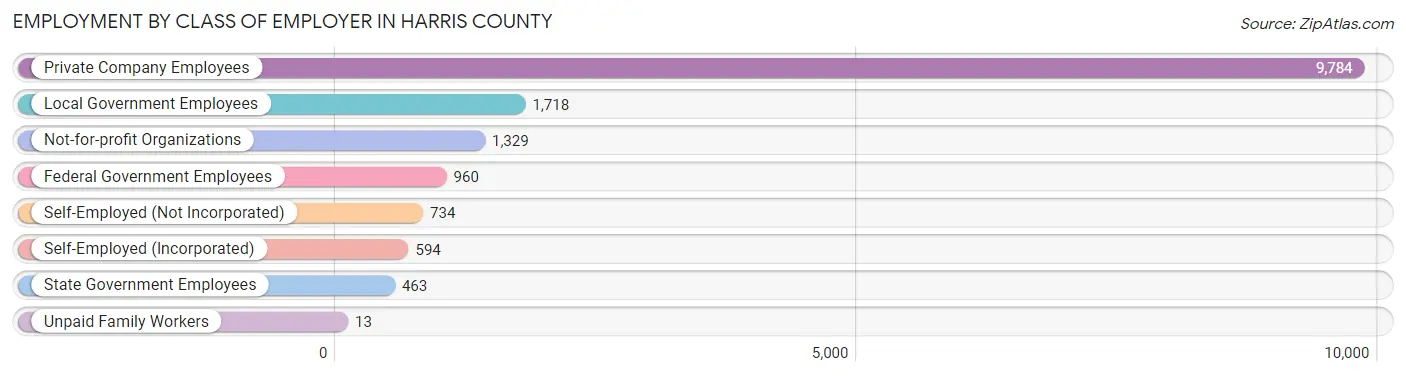
| Employer Class | # Employees | % Employees |
| Private Company Employees | 9,784 | 62.7% |
| Self-Employed (Incorporated) | 594 | 3.8% |
| Self-Employed (Not Incorporated) | 734 | 4.7% |
| Not-for-profit Organizations | 1,329 | 8.5% |
| Local Government Employees | 1,718 | 11.0% |
| State Government Employees | 463 | 3.0% |
| Federal Government Employees | 960 | 6.2% |
| Unpaid Family Workers | 13 | 0.1% |
| Total | 15,595 | 100.0% |
Employment Status by Age in Harris County
According to the labor force statistics for Harris County, out of the total population over 16 years of age (28,386), 60.2% or 17,088 individuals are in the labor force, with 5.8% or 991 of them unemployed. The age group with the highest labor force participation rate is 25 to 29 years, with 89.2% or 1,474 individuals in the labor force. Within the labor force, the 16 to 19 years age range has the highest percentage of unemployed individuals, with 11.5% or 86 of them being unemployed.
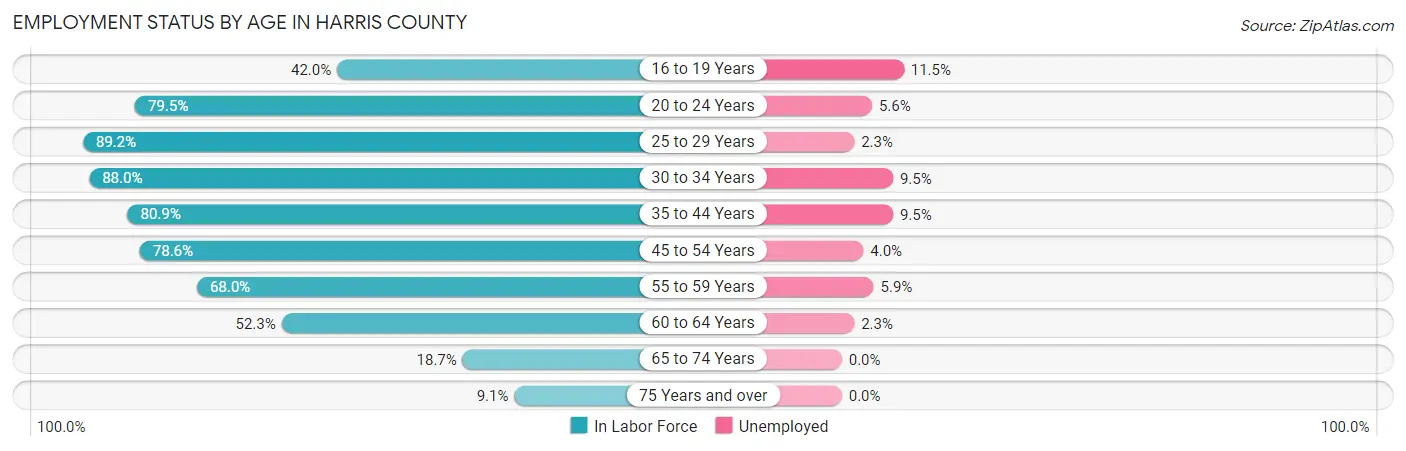
| Age Bracket | In Labor Force | Unemployed |
| 16 to 19 Years | 752 (42.0%) | 86 (11.5%) |
| 20 to 24 Years | 1,623 (79.5%) | 91 (5.6%) |
| 25 to 29 Years | 1,474 (89.2%) | 34 (2.3%) |
| 30 to 34 Years | 1,778 (88.0%) | 169 (9.5%) |
| 35 to 44 Years | 3,367 (80.9%) | 320 (9.5%) |
| 45 to 54 Years | 3,929 (78.6%) | 157 (4.0%) |
| 55 to 59 Years | 1,752 (68.0%) | 103 (5.9%) |
| 60 to 64 Years | 1,407 (52.3%) | 32 (2.3%) |
| 65 to 74 Years | 802 (18.7%) | 0 (0.0%) |
| 75 Years and over | 197 (9.1%) | 0 (0.0%) |
| Total | 17,088 (60.2%) | 991 (5.8%) |
Employment Status by Educational Attainment in Harris County
According to labor force statistics for Harris County, 75.7% of individuals (13,703) out of the total population between 25 and 64 years of age (18,102) are in the labor force, with 5.9% or 808 of them being unemployed. The group with the highest labor force participation rate are those with the educational attainment of bachelor's degree or higher, with 82.9% or 5,037 individuals in the labor force. Within the labor force, individuals with high school diploma education have the highest percentage of unemployment, with 11.4% or 400 of them being unemployed.
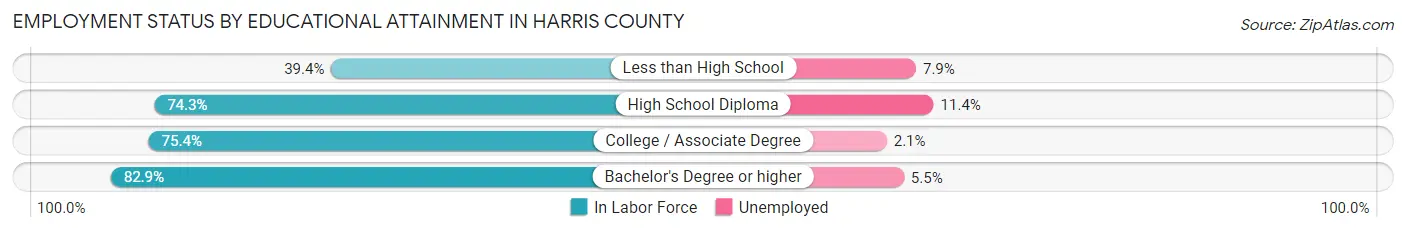
| Educational Attainment | In Labor Force | Unemployed |
| Less than High School | 381 (39.4%) | 76 (7.9%) |
| High School Diploma | 3,506 (74.3%) | 538 (11.4%) |
| College / Associate Degree | 4,780 (75.4%) | 133 (2.1%) |
| Bachelor's Degree or higher | 5,037 (82.9%) | 334 (5.5%) |
| Total | 13,703 (75.7%) | 1,068 (5.9%) |
Employment Occupations by Sex in Harris County
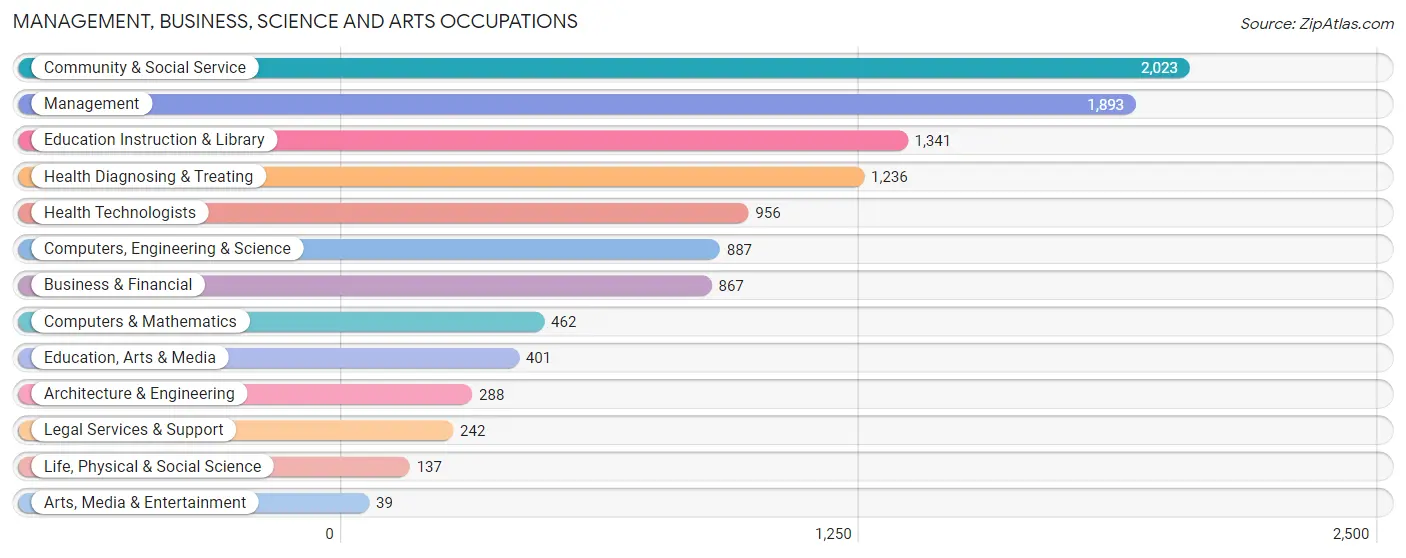
Management, Business, Science and Arts Occupations
The most common Management, Business, Science and Arts occupations in Harris County are Community & Social Service (2,023 | 12.9%), Management (1,893 | 12.0%), Education Instruction & Library (1,341 | 8.5%), Health Diagnosing & Treating (1,236 | 7.9%), and Health Technologists (956 | 6.1%).
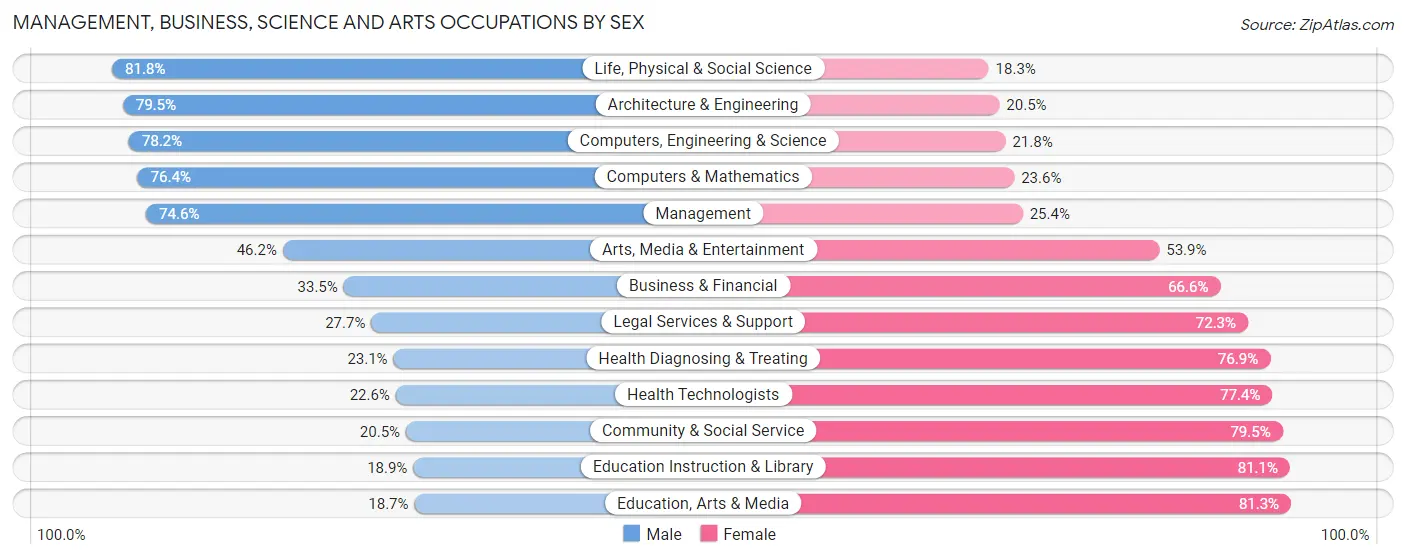
Management, Business, Science and Arts Occupations by Sex
Within the Management, Business, Science and Arts occupations in Harris County, the most male-oriented occupations are Life, Physical & Social Science (81.8%), Architecture & Engineering (79.5%), and Computers, Engineering & Science (78.2%), while the most female-oriented occupations are Education, Arts & Media (81.3%), Education Instruction & Library (81.1%), and Community & Social Service (79.5%).
| Occupation | Male | Female |
| Management | 1,413 (74.6%) | 480 (25.4%) |
| Business & Financial | 290 (33.5%) | 577 (66.5%) |
| Computers, Engineering & Science | 694 (78.2%) | 193 (21.8%) |
| Computers & Mathematics | 353 (76.4%) | 109 (23.6%) |
| Architecture & Engineering | 229 (79.5%) | 59 (20.5%) |
| Life, Physical & Social Science | 112 (81.8%) | 25 (18.2%) |
| Community & Social Service | 414 (20.5%) | 1,609 (79.5%) |
| Education, Arts & Media | 75 (18.7%) | 326 (81.3%) |
| Legal Services & Support | 67 (27.7%) | 175 (72.3%) |
| Education Instruction & Library | 254 (18.9%) | 1,087 (81.1%) |
| Arts, Media & Entertainment | 18 (46.2%) | 21 (53.8%) |
| Health Diagnosing & Treating | 285 (23.1%) | 951 (76.9%) |
| Health Technologists | 216 (22.6%) | 740 (77.4%) |
| Total (Category) | 3,096 (44.8%) | 3,810 (55.2%) |
| Total (Overall) | 8,423 (53.5%) | 7,324 (46.5%) |
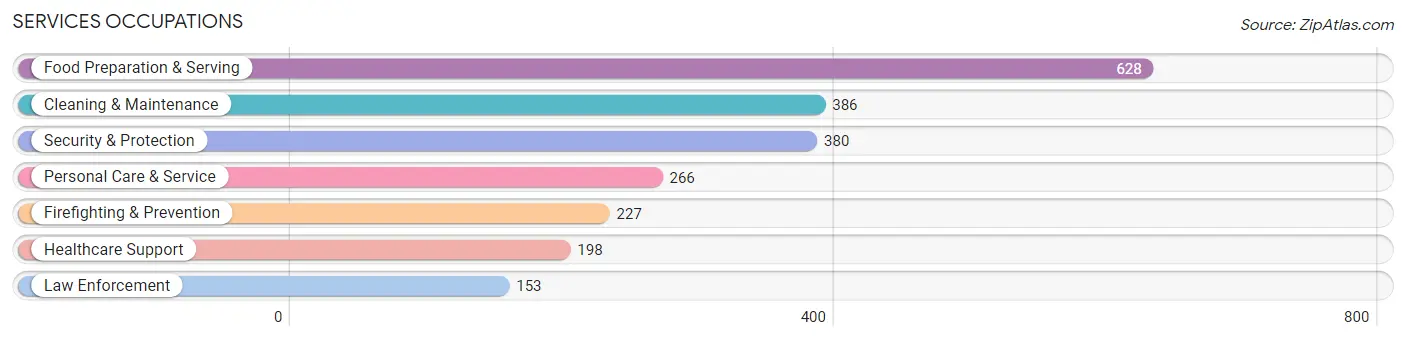
Services Occupations
The most common Services occupations in Harris County are Food Preparation & Serving (628 | 4.0%), Cleaning & Maintenance (386 | 2.5%), Security & Protection (380 | 2.4%), Personal Care & Service (266 | 1.7%), and Firefighting & Prevention (227 | 1.4%).
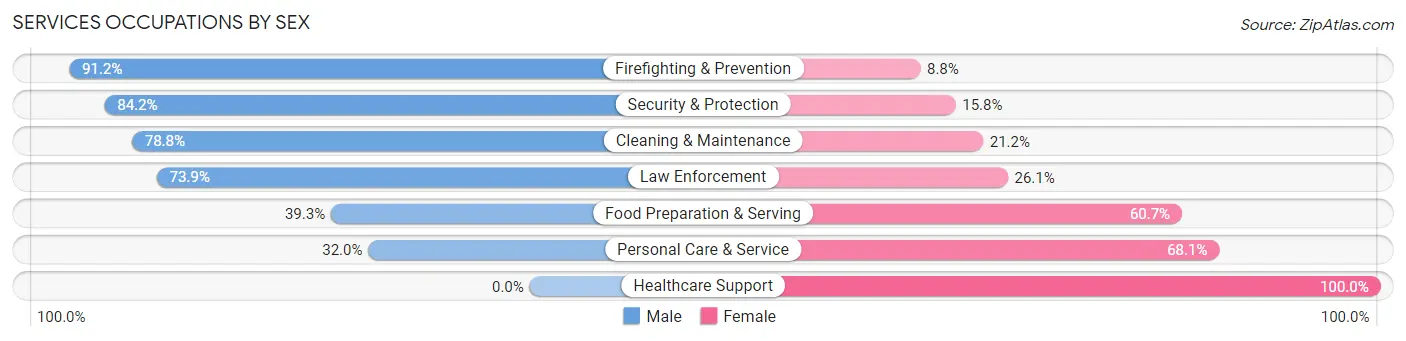
Services Occupations by Sex
Within the Services occupations in Harris County, the most male-oriented occupations are Firefighting & Prevention (91.2%), Security & Protection (84.2%), and Cleaning & Maintenance (78.8%), while the most female-oriented occupations are Healthcare Support (100.0%), Personal Care & Service (68.0%), and Food Preparation & Serving (60.7%).
| Occupation | Male | Female |
| Healthcare Support | 0 (0.0%) | 198 (100.0%) |
| Security & Protection | 320 (84.2%) | 60 (15.8%) |
| Firefighting & Prevention | 207 (91.2%) | 20 (8.8%) |
| Law Enforcement | 113 (73.9%) | 40 (26.1%) |
| Food Preparation & Serving | 247 (39.3%) | 381 (60.7%) |
| Cleaning & Maintenance | 304 (78.8%) | 82 (21.2%) |
| Personal Care & Service | 85 (32.0%) | 181 (68.0%) |
| Total (Category) | 956 (51.4%) | 902 (48.5%) |
| Total (Overall) | 8,423 (53.5%) | 7,324 (46.5%) |
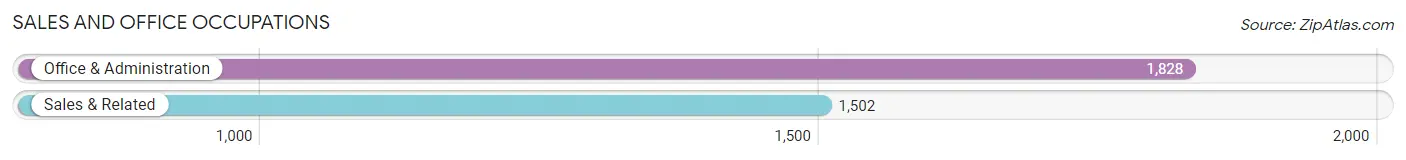
Sales and Office Occupations
The most common Sales and Office occupations in Harris County are Office & Administration (1,828 | 11.6%), and Sales & Related (1,502 | 9.5%).
Sales and Office Occupations by Sex
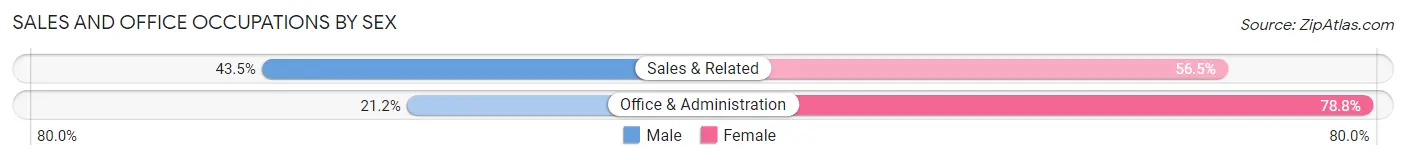
| Occupation | Male | Female |
| Sales & Related | 654 (43.5%) | 848 (56.5%) |
| Office & Administration | 388 (21.2%) | 1,440 (78.8%) |
| Total (Category) | 1,042 (31.3%) | 2,288 (68.7%) |
| Total (Overall) | 8,423 (53.5%) | 7,324 (46.5%) |
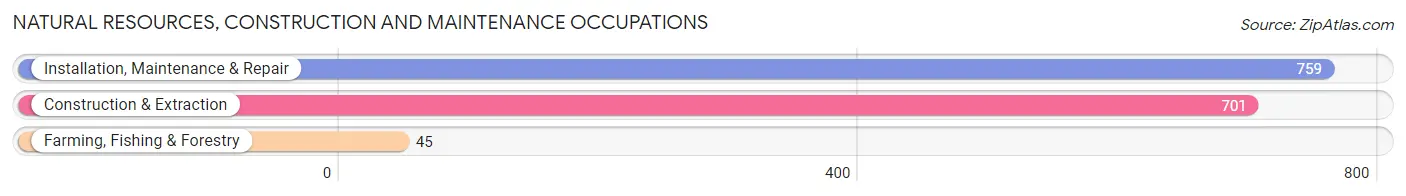
Natural Resources, Construction and Maintenance Occupations
The most common Natural Resources, Construction and Maintenance occupations in Harris County are Installation, Maintenance & Repair (759 | 4.8%), Construction & Extraction (701 | 4.4%), and Farming, Fishing & Forestry (45 | 0.3%).
Natural Resources, Construction and Maintenance Occupations by Sex
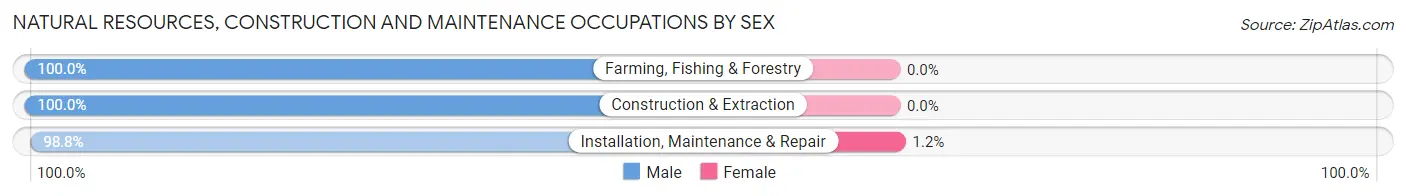
| Occupation | Male | Female |
| Farming, Fishing & Forestry | 45 (100.0%) | 0 (0.0%) |
| Construction & Extraction | 701 (100.0%) | 0 (0.0%) |
| Installation, Maintenance & Repair | 750 (98.8%) | 9 (1.2%) |
| Total (Category) | 1,496 (99.4%) | 9 (0.6%) |
| Total (Overall) | 8,423 (53.5%) | 7,324 (46.5%) |
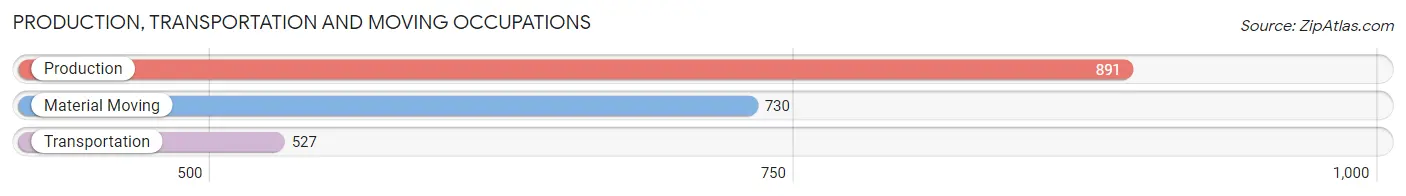
Production, Transportation and Moving Occupations
The most common Production, Transportation and Moving occupations in Harris County are Production (891 | 5.7%), Material Moving (730 | 4.6%), and Transportation (527 | 3.4%).
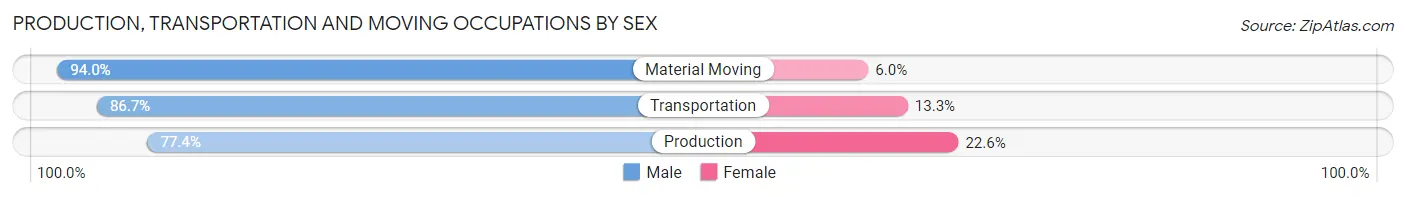
Production, Transportation and Moving Occupations by Sex
| Occupation | Male | Female |
| Production | 690 (77.4%) | 201 (22.6%) |
| Transportation | 457 (86.7%) | 70 (13.3%) |
| Material Moving | 686 (94.0%) | 44 (6.0%) |
| Total (Category) | 1,833 (85.3%) | 315 (14.7%) |
| Total (Overall) | 8,423 (53.5%) | 7,324 (46.5%) |
Employment Industries by Sex in Harris County
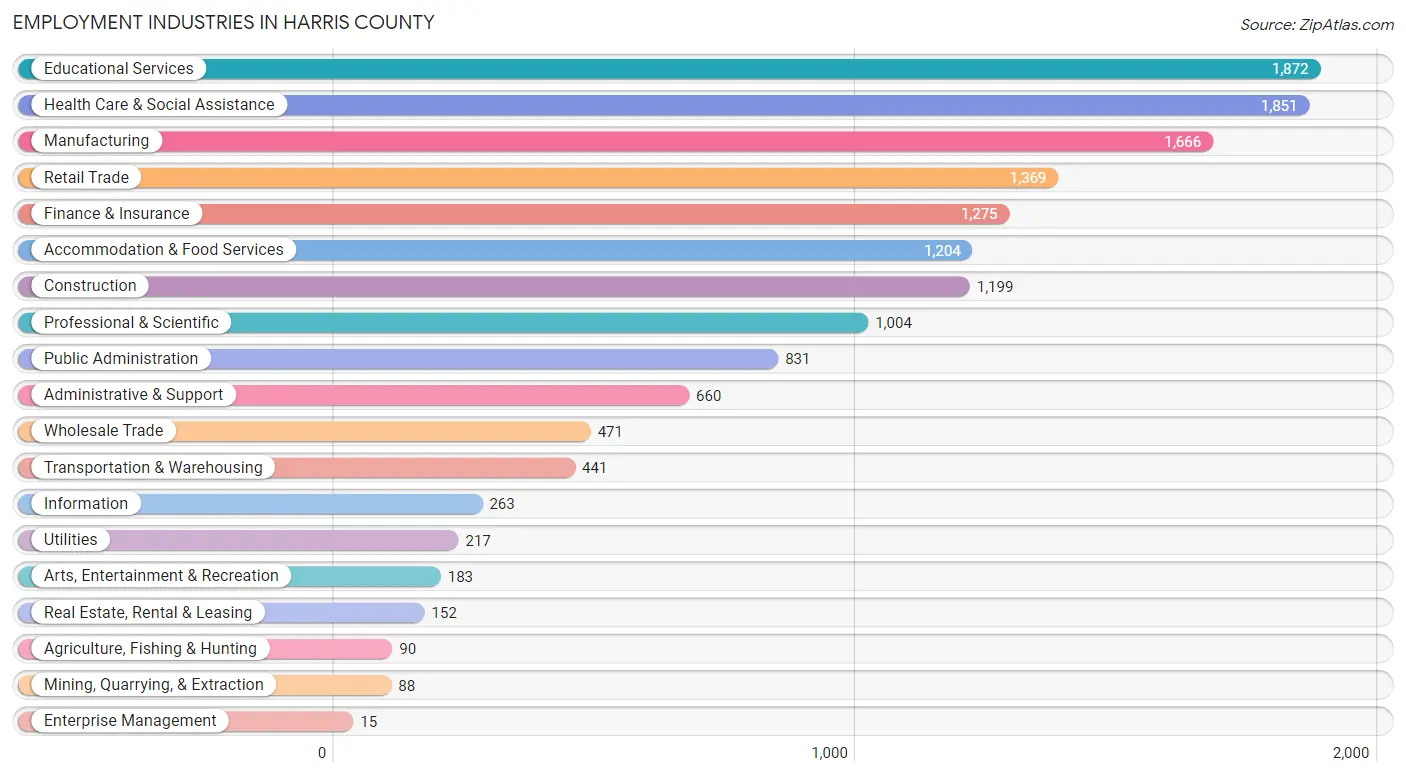
Employment Industries in Harris County
The major employment industries in Harris County include Educational Services (1,872 | 11.9%), Health Care & Social Assistance (1,851 | 11.7%), Manufacturing (1,666 | 10.6%), Retail Trade (1,369 | 8.7%), and Finance & Insurance (1,275 | 8.1%).
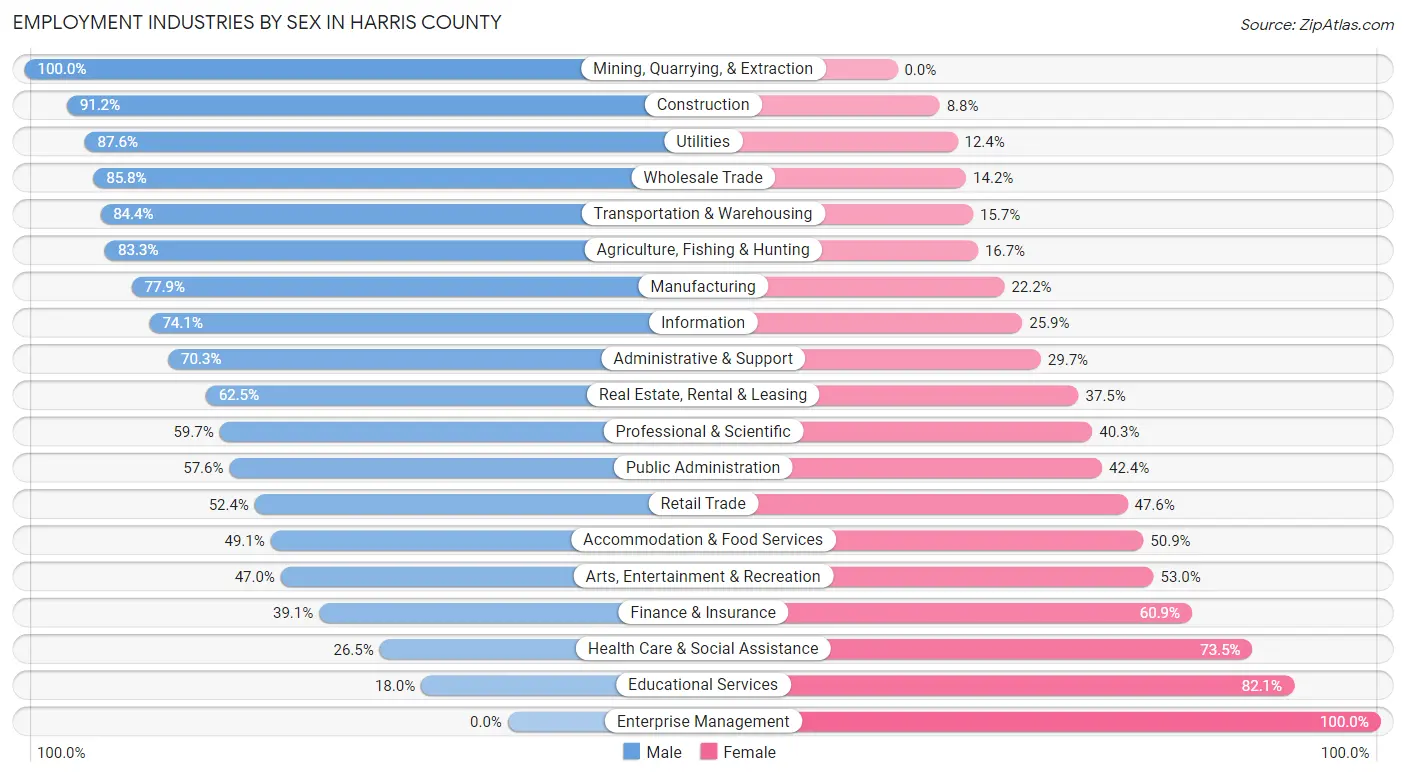
Employment Industries by Sex in Harris County
The Harris County industries that see more men than women are Mining, Quarrying, & Extraction (100.0%), Construction (91.2%), and Utilities (87.6%), whereas the industries that tend to have a higher number of women are Enterprise Management (100.0%), Educational Services (82.1%), and Health Care & Social Assistance (73.5%).
| Industry | Male | Female |
| Agriculture, Fishing & Hunting | 75 (83.3%) | 15 (16.7%) |
| Mining, Quarrying, & Extraction | 88 (100.0%) | 0 (0.0%) |
| Construction | 1,094 (91.2%) | 105 (8.8%) |
| Manufacturing | 1,297 (77.8%) | 369 (22.2%) |
| Wholesale Trade | 404 (85.8%) | 67 (14.2%) |
| Retail Trade | 717 (52.4%) | 652 (47.6%) |
| Transportation & Warehousing | 372 (84.4%) | 69 (15.7%) |
| Utilities | 190 (87.6%) | 27 (12.4%) |
| Information | 195 (74.1%) | 68 (25.9%) |
| Finance & Insurance | 498 (39.1%) | 777 (60.9%) |
| Real Estate, Rental & Leasing | 95 (62.5%) | 57 (37.5%) |
| Professional & Scientific | 599 (59.7%) | 405 (40.3%) |
| Enterprise Management | 0 (0.0%) | 15 (100.0%) |
| Administrative & Support | 464 (70.3%) | 196 (29.7%) |
| Educational Services | 336 (17.9%) | 1,536 (82.1%) |
| Health Care & Social Assistance | 491 (26.5%) | 1,360 (73.5%) |
| Arts, Entertainment & Recreation | 86 (47.0%) | 97 (53.0%) |
| Accommodation & Food Services | 591 (49.1%) | 613 (50.9%) |
| Public Administration | 479 (57.6%) | 352 (42.4%) |
| Total | 8,423 (53.5%) | 7,324 (46.5%) |
Education in Harris County
School Enrollment in Harris County
The most common levels of schooling among the 8,647 students in Harris County are high school (2,097 | 24.2%), middle school (1,818 | 21.0%), and college / undergraduate (1,715 | 19.8%).
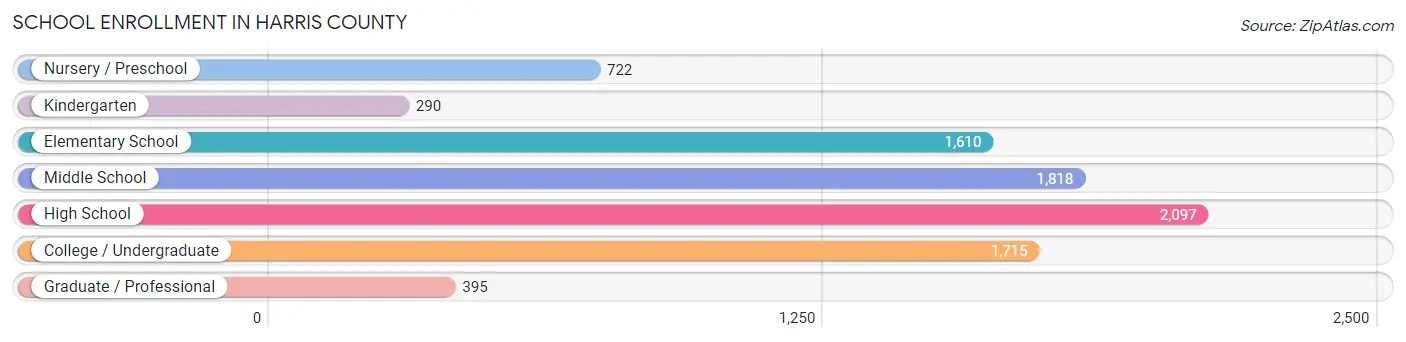
| School Level | # Students | % Students |
| Nursery / Preschool | 722 | 8.4% |
| Kindergarten | 290 | 3.4% |
| Elementary School | 1,610 | 18.6% |
| Middle School | 1,818 | 21.0% |
| High School | 2,097 | 24.2% |
| College / Undergraduate | 1,715 | 19.8% |
| Graduate / Professional | 395 | 4.6% |
| Total | 8,647 | 100.0% |
School Enrollment by Age by Funding Source in Harris County
Out of a total of 8,647 students who are enrolled in schools in Harris County, 943 (10.9%) attend a private institution, while the remaining 7,704 (89.1%) are enrolled in public schools. The age group of 3 to 4 year olds has the highest likelihood of being enrolled in private schools, with 221 (38.8% in the age bracket) enrolled. Conversely, the age group of 35 years and over has the lowest likelihood of being enrolled in a private school, with 441 (94.4% in the age bracket) attending a public institution.
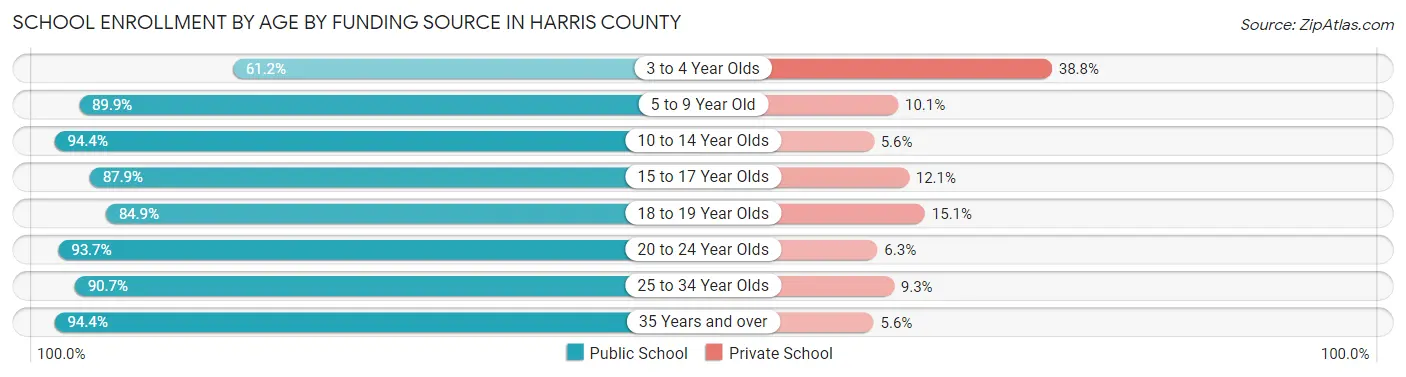
| Age Bracket | Public School | Private School |
| 3 to 4 Year Olds | 349 (61.2%) | 221 (38.8%) |
| 5 to 9 Year Old | 1,730 (89.9%) | 195 (10.1%) |
| 10 to 14 Year Olds | 2,096 (94.4%) | 124 (5.6%) |
| 15 to 17 Year Olds | 1,297 (87.9%) | 179 (12.1%) |
| 18 to 19 Year Olds | 539 (84.9%) | 96 (15.1%) |
| 20 to 24 Year Olds | 687 (93.7%) | 46 (6.3%) |
| 25 to 34 Year Olds | 563 (90.7%) | 58 (9.3%) |
| 35 Years and over | 441 (94.4%) | 26 (5.6%) |
| Total | 7,704 (89.1%) | 943 (10.9%) |
Educational Attainment by Field of Study in Harris County
Business (2,034 | 24.4%), education (1,485 | 17.8%), science & technology (810 | 9.7%), arts & humanities (660 | 7.9%), and psychology (563 | 6.8%) are the most common fields of study among 8,326 individuals in Harris County who have obtained a bachelor's degree or higher.
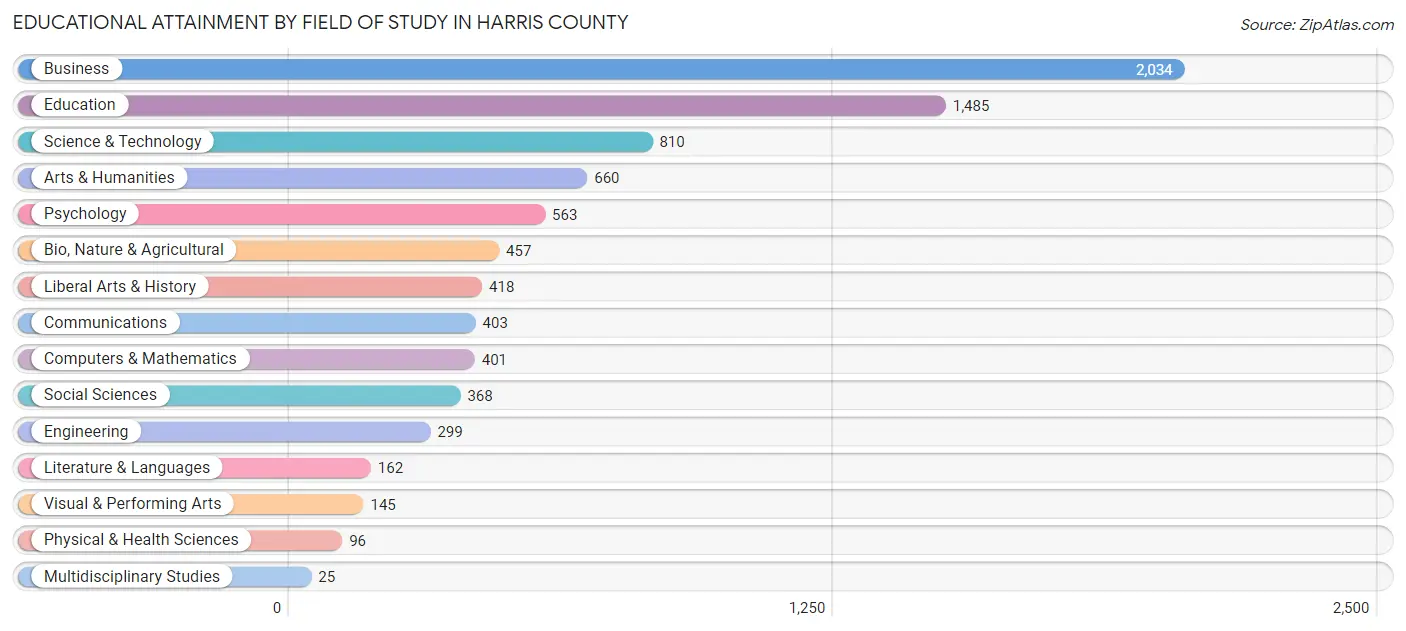
| Field of Study | # Graduates | % Graduates |
| Computers & Mathematics | 401 | 4.8% |
| Bio, Nature & Agricultural | 457 | 5.5% |
| Physical & Health Sciences | 96 | 1.1% |
| Psychology | 563 | 6.8% |
| Social Sciences | 368 | 4.4% |
| Engineering | 299 | 3.6% |
| Multidisciplinary Studies | 25 | 0.3% |
| Science & Technology | 810 | 9.7% |
| Business | 2,034 | 24.4% |
| Education | 1,485 | 17.8% |
| Literature & Languages | 162 | 1.9% |
| Liberal Arts & History | 418 | 5.0% |
| Visual & Performing Arts | 145 | 1.7% |
| Communications | 403 | 4.8% |
| Arts & Humanities | 660 | 7.9% |
| Total | 8,326 | 100.0% |
Transportation & Commute in Harris County
Vehicle Availability by Sex in Harris County
The most prevalent vehicle ownership categories in Harris County are males with 2 vehicles (3,116, accounting for 36.9%) and females with 2 vehicles (2,478, making up 44.4%).
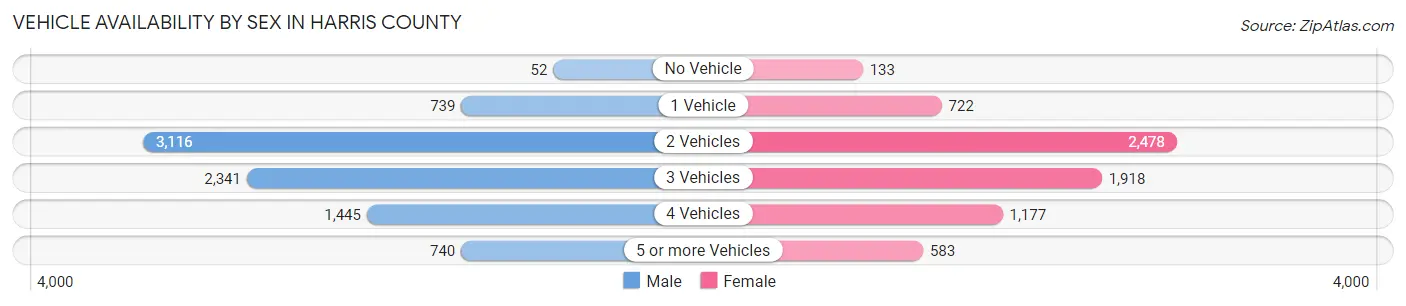
| Vehicles Available | Male | Female |
| No Vehicle | 52 (0.6%) | 133 (1.9%) |
| 1 Vehicle | 739 (8.8%) | 722 (10.3%) |
| 2 Vehicles | 3,116 (36.9%) | 2,478 (35.3%) |
| 3 Vehicles | 2,341 (27.8%) | 1,918 (27.4%) |
| 4 Vehicles | 1,445 (17.1%) | 1,177 (16.8%) |
| 5 or more Vehicles | 740 (8.8%) | 583 (8.3%) |
| Total | 8,433 (100.0%) | 7,011 (100.0%) |
Commute Time in Harris County
The most frequently occuring commute durations in Harris County are 20 to 24 minutes (3,176 commuters, 22.1%), 30 to 34 minutes (2,684 commuters, 18.7%), and 15 to 19 minutes (2,159 commuters, 15.0%).
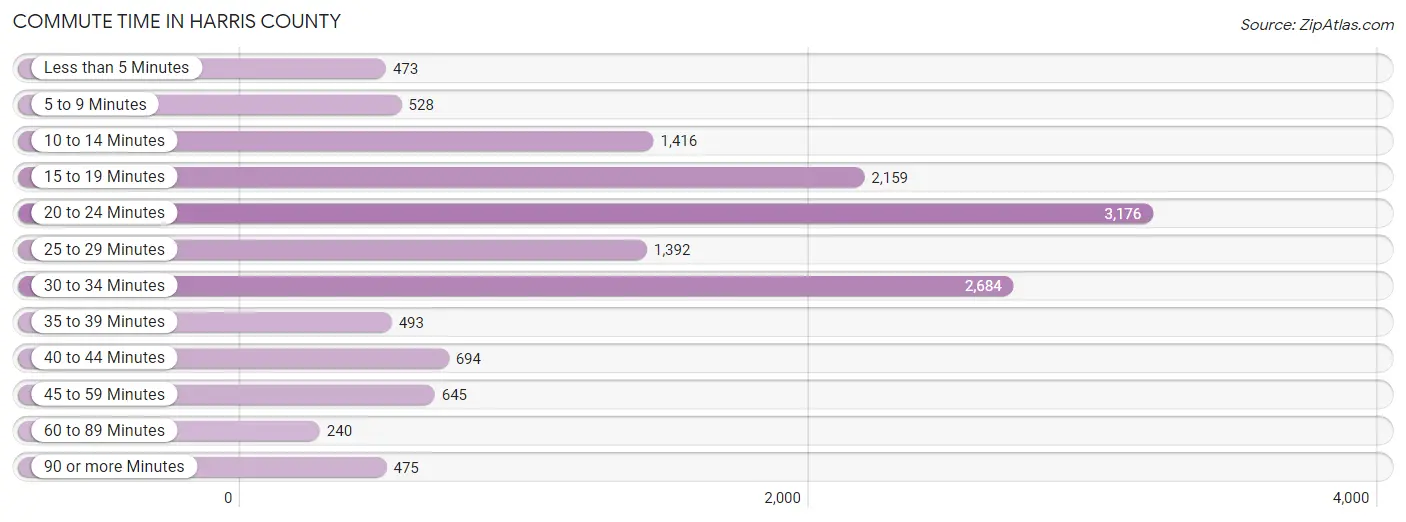
| Commute Time | # Commuters | % Commuters |
| Less than 5 Minutes | 473 | 3.3% |
| 5 to 9 Minutes | 528 | 3.7% |
| 10 to 14 Minutes | 1,416 | 9.9% |
| 15 to 19 Minutes | 2,159 | 15.0% |
| 20 to 24 Minutes | 3,176 | 22.1% |
| 25 to 29 Minutes | 1,392 | 9.7% |
| 30 to 34 Minutes | 2,684 | 18.7% |
| 35 to 39 Minutes | 493 | 3.4% |
| 40 to 44 Minutes | 694 | 4.8% |
| 45 to 59 Minutes | 645 | 4.5% |
| 60 to 89 Minutes | 240 | 1.7% |
| 90 or more Minutes | 475 | 3.3% |
Commute Time by Sex in Harris County
The most common commute times in Harris County are 20 to 24 minutes (1,758 commuters, 21.9%) for males and 20 to 24 minutes (1,418 commuters, 22.4%) for females.
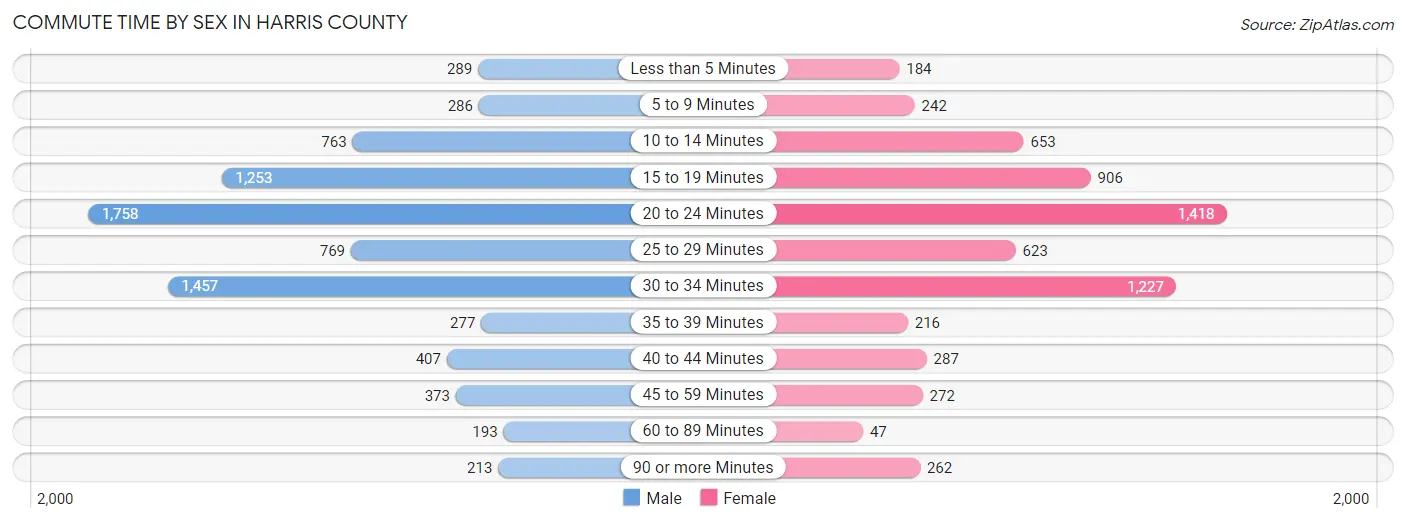
| Commute Time | Male | Female |
| Less than 5 Minutes | 289 (3.6%) | 184 (2.9%) |
| 5 to 9 Minutes | 286 (3.6%) | 242 (3.8%) |
| 10 to 14 Minutes | 763 (9.5%) | 653 (10.3%) |
| 15 to 19 Minutes | 1,253 (15.6%) | 906 (14.3%) |
| 20 to 24 Minutes | 1,758 (21.9%) | 1,418 (22.4%) |
| 25 to 29 Minutes | 769 (9.6%) | 623 (9.8%) |
| 30 to 34 Minutes | 1,457 (18.1%) | 1,227 (19.4%) |
| 35 to 39 Minutes | 277 (3.5%) | 216 (3.4%) |
| 40 to 44 Minutes | 407 (5.1%) | 287 (4.5%) |
| 45 to 59 Minutes | 373 (4.6%) | 272 (4.3%) |
| 60 to 89 Minutes | 193 (2.4%) | 47 (0.7%) |
| 90 or more Minutes | 213 (2.6%) | 262 (4.1%) |
Time of Departure to Work by Sex in Harris County
The most frequent times of departure to work in Harris County are 7:00 AM to 7:29 AM (1,628, 20.3%) for males and 7:00 AM to 7:29 AM (1,155, 18.2%) for females.
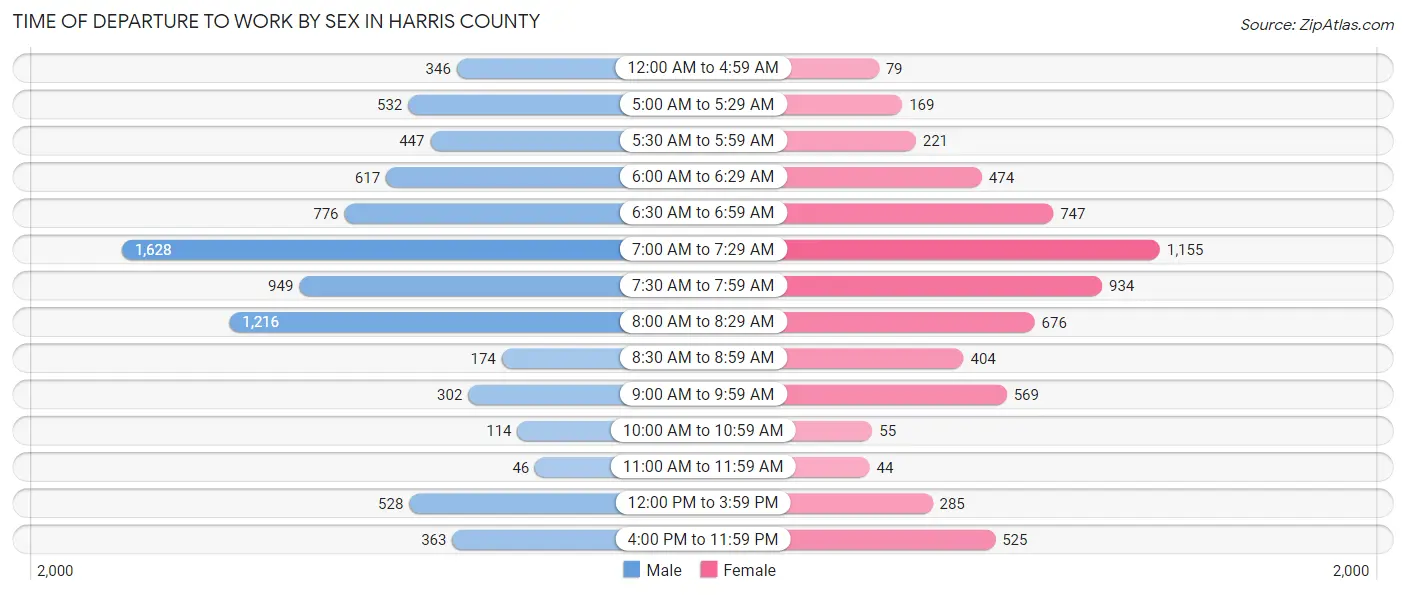
| Time of Departure | Male | Female |
| 12:00 AM to 4:59 AM | 346 (4.3%) | 79 (1.3%) |
| 5:00 AM to 5:29 AM | 532 (6.6%) | 169 (2.7%) |
| 5:30 AM to 5:59 AM | 447 (5.6%) | 221 (3.5%) |
| 6:00 AM to 6:29 AM | 617 (7.7%) | 474 (7.5%) |
| 6:30 AM to 6:59 AM | 776 (9.7%) | 747 (11.8%) |
| 7:00 AM to 7:29 AM | 1,628 (20.3%) | 1,155 (18.2%) |
| 7:30 AM to 7:59 AM | 949 (11.8%) | 934 (14.7%) |
| 8:00 AM to 8:29 AM | 1,216 (15.1%) | 676 (10.7%) |
| 8:30 AM to 8:59 AM | 174 (2.2%) | 404 (6.4%) |
| 9:00 AM to 9:59 AM | 302 (3.8%) | 569 (9.0%) |
| 10:00 AM to 10:59 AM | 114 (1.4%) | 55 (0.9%) |
| 11:00 AM to 11:59 AM | 46 (0.6%) | 44 (0.7%) |
| 12:00 PM to 3:59 PM | 528 (6.6%) | 285 (4.5%) |
| 4:00 PM to 11:59 PM | 363 (4.5%) | 525 (8.3%) |
| Total | 8,038 (100.0%) | 6,337 (100.0%) |
Housing Occupancy in Harris County
Occupancy by Ownership in Harris County
Of the total 12,204 dwellings in Harris County, owner-occupied units account for 10,890 (89.2%), while renter-occupied units make up 1,314 (10.8%).
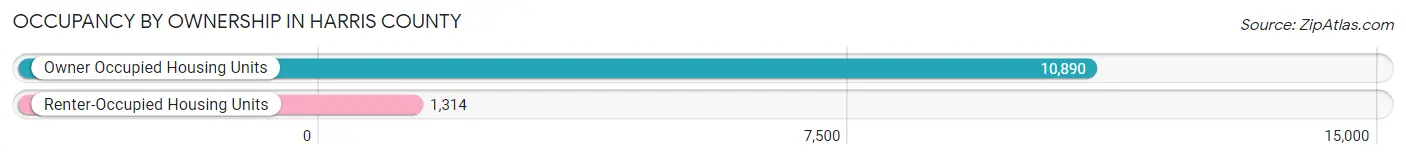
| Occupancy | # Housing Units | % Housing Units |
| Owner Occupied Housing Units | 10,890 | 89.2% |
| Renter-Occupied Housing Units | 1,314 | 10.8% |
| Total Occupied Housing Units | 12,204 | 100.0% |
Occupancy by Household Size in Harris County
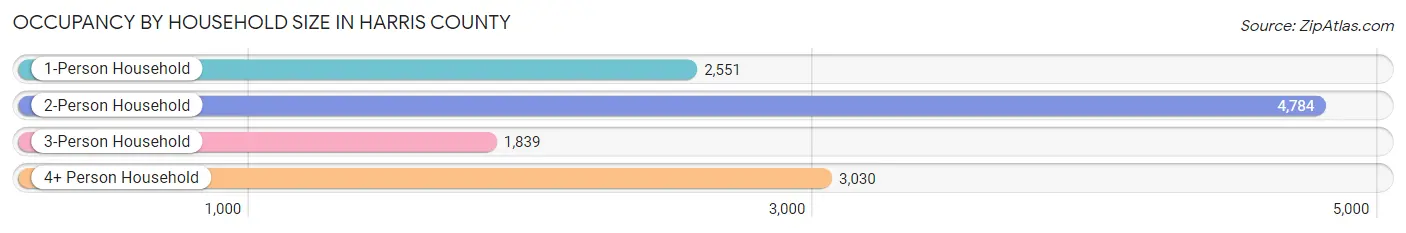
| Household Size | # Housing Units | % Housing Units |
| 1-Person Household | 2,551 | 20.9% |
| 2-Person Household | 4,784 | 39.2% |
| 3-Person Household | 1,839 | 15.1% |
| 4+ Person Household | 3,030 | 24.8% |
| Total Housing Units | 12,204 | 100.0% |
Occupancy by Ownership by Household Size in Harris County
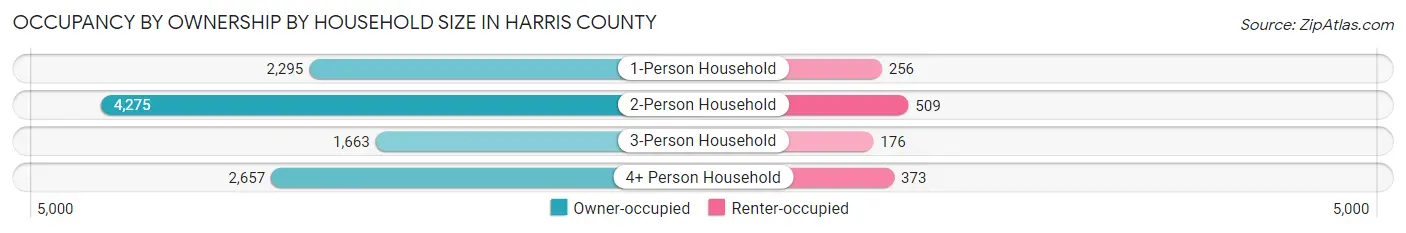
| Household Size | Owner-occupied | Renter-occupied |
| 1-Person Household | 2,295 (90.0%) | 256 (10.0%) |
| 2-Person Household | 4,275 (89.4%) | 509 (10.6%) |
| 3-Person Household | 1,663 (90.4%) | 176 (9.6%) |
| 4+ Person Household | 2,657 (87.7%) | 373 (12.3%) |
| Total Housing Units | 10,890 (89.2%) | 1,314 (10.8%) |
Occupancy by Educational Attainment in Harris County
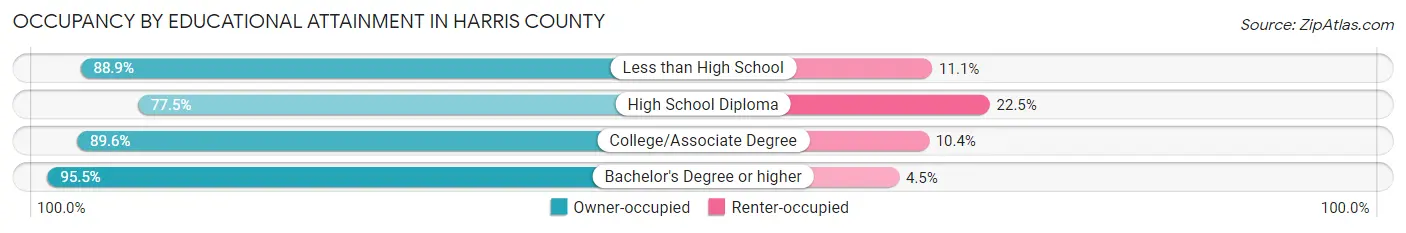
| Household Size | Owner-occupied | Renter-occupied |
| Less than High School | 649 (88.9%) | 81 (11.1%) |
| High School Diploma | 2,013 (77.5%) | 584 (22.5%) |
| College/Associate Degree | 3,759 (89.6%) | 437 (10.4%) |
| Bachelor's Degree or higher | 4,469 (95.5%) | 212 (4.5%) |
Occupancy by Age of Householder in Harris County
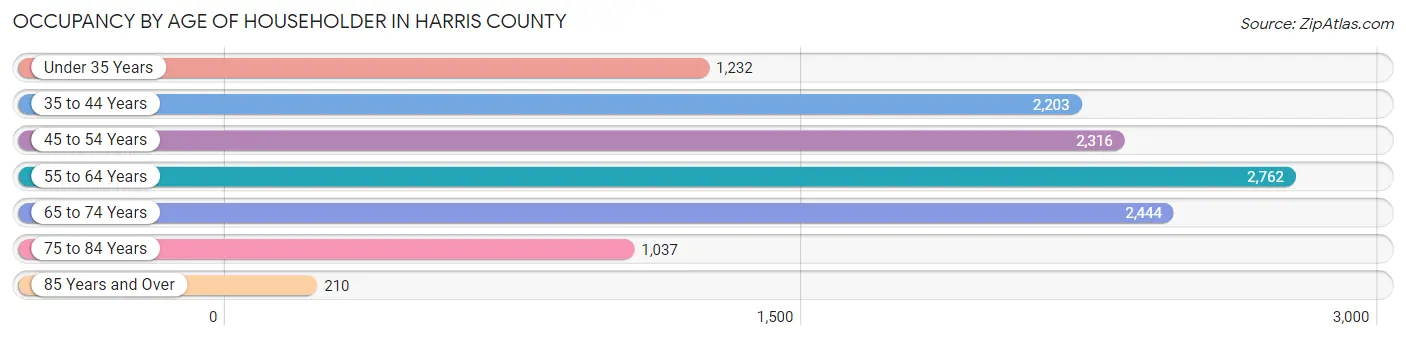
| Age Bracket | # Households | % Households |
| Under 35 Years | 1,232 | 10.1% |
| 35 to 44 Years | 2,203 | 18.0% |
| 45 to 54 Years | 2,316 | 19.0% |
| 55 to 64 Years | 2,762 | 22.6% |
| 65 to 74 Years | 2,444 | 20.0% |
| 75 to 84 Years | 1,037 | 8.5% |
| 85 Years and Over | 210 | 1.7% |
| Total | 12,204 | 100.0% |
Housing Finances in Harris County
Median Income by Occupancy in Harris County
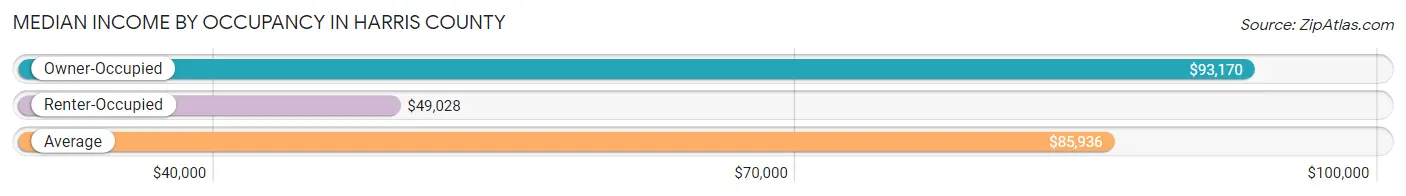
| Occupancy Type | # Households | Median Income |
| Owner-Occupied | 10,890 (89.2%) | $93,170 |
| Renter-Occupied | 1,314 (10.8%) | $49,028 |
| Average | 12,204 (100.0%) | $85,936 |
Occupancy by Householder Income Bracket in Harris County
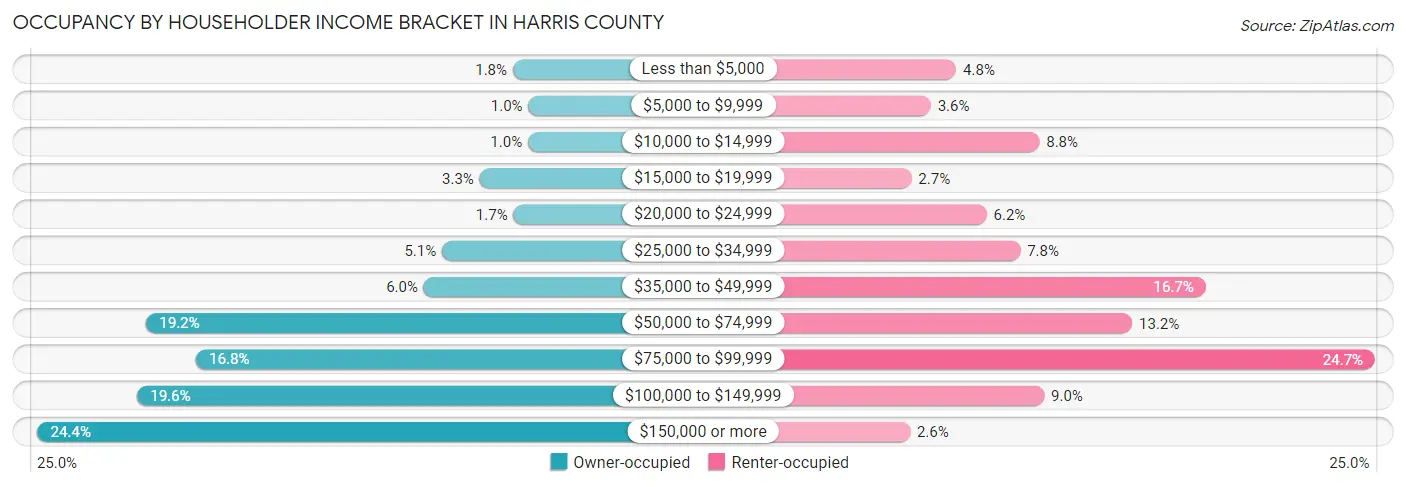
| Income Bracket | Owner-occupied | Renter-occupied |
| Less than $5,000 | 191 (1.8%) | 63 (4.8%) |
| $5,000 to $9,999 | 110 (1.0%) | 47 (3.6%) |
| $10,000 to $14,999 | 112 (1.0%) | 115 (8.7%) |
| $15,000 to $19,999 | 363 (3.3%) | 35 (2.7%) |
| $20,000 to $24,999 | 187 (1.7%) | 82 (6.2%) |
| $25,000 to $34,999 | 558 (5.1%) | 103 (7.8%) |
| $35,000 to $49,999 | 652 (6.0%) | 219 (16.7%) |
| $50,000 to $74,999 | 2,091 (19.2%) | 173 (13.2%) |
| $75,000 to $99,999 | 1,833 (16.8%) | 325 (24.7%) |
| $100,000 to $149,999 | 2,138 (19.6%) | 118 (9.0%) |
| $150,000 or more | 2,655 (24.4%) | 34 (2.6%) |
| Total | 10,890 (100.0%) | 1,314 (100.0%) |
Monthly Housing Cost Tiers in Harris County
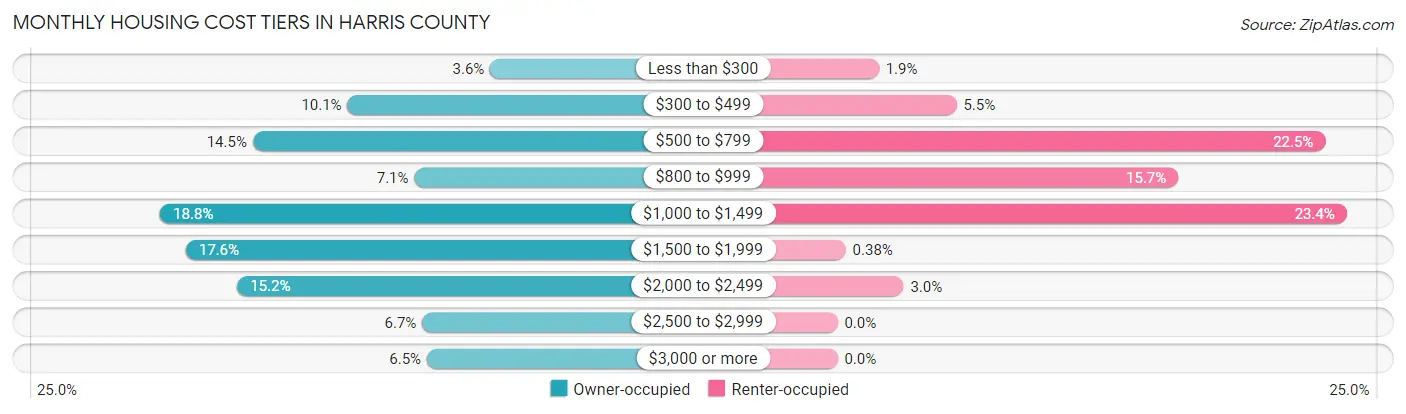
| Monthly Cost | Owner-occupied | Renter-occupied |
| Less than $300 | 389 (3.6%) | 25 (1.9%) |
| $300 to $499 | 1,104 (10.1%) | 72 (5.5%) |
| $500 to $799 | 1,579 (14.5%) | 295 (22.5%) |
| $800 to $999 | 769 (7.1%) | 206 (15.7%) |
| $1,000 to $1,499 | 2,043 (18.8%) | 308 (23.4%) |
| $1,500 to $1,999 | 1,914 (17.6%) | 5 (0.4%) |
| $2,000 to $2,499 | 1,656 (15.2%) | 40 (3.0%) |
| $2,500 to $2,999 | 730 (6.7%) | 0 (0.0%) |
| $3,000 or more | 706 (6.5%) | 0 (0.0%) |
| Total | 10,890 (100.0%) | 1,314 (100.0%) |
Physical Housing Characteristics in Harris County
Housing Structures in Harris County
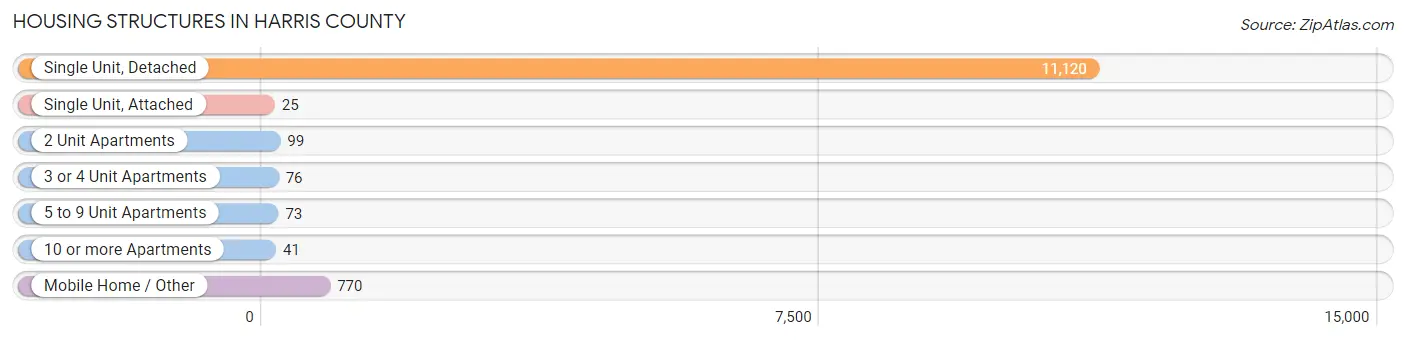
| Structure Type | # Housing Units | % Housing Units |
| Single Unit, Detached | 11,120 | 91.1% |
| Single Unit, Attached | 25 | 0.2% |
| 2 Unit Apartments | 99 | 0.8% |
| 3 or 4 Unit Apartments | 76 | 0.6% |
| 5 to 9 Unit Apartments | 73 | 0.6% |
| 10 or more Apartments | 41 | 0.3% |
| Mobile Home / Other | 770 | 6.3% |
| Total | 12,204 | 100.0% |
Housing Structures by Occupancy in Harris County
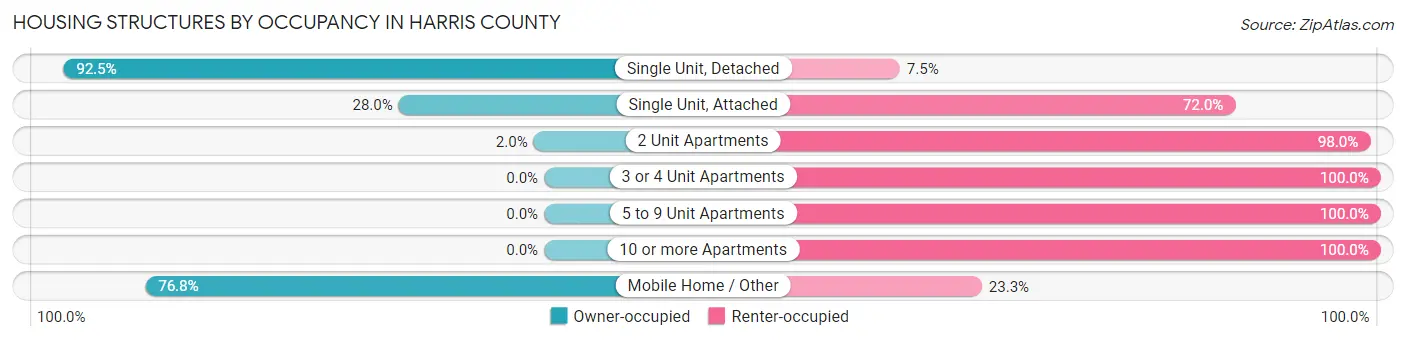
| Structure Type | Owner-occupied | Renter-occupied |
| Single Unit, Detached | 10,290 (92.5%) | 830 (7.5%) |
| Single Unit, Attached | 7 (28.0%) | 18 (72.0%) |
| 2 Unit Apartments | 2 (2.0%) | 97 (98.0%) |
| 3 or 4 Unit Apartments | 0 (0.0%) | 76 (100.0%) |
| 5 to 9 Unit Apartments | 0 (0.0%) | 73 (100.0%) |
| 10 or more Apartments | 0 (0.0%) | 41 (100.0%) |
| Mobile Home / Other | 591 (76.7%) | 179 (23.3%) |
| Total | 10,890 (89.2%) | 1,314 (10.8%) |
Housing Structures by Number of Rooms in Harris County
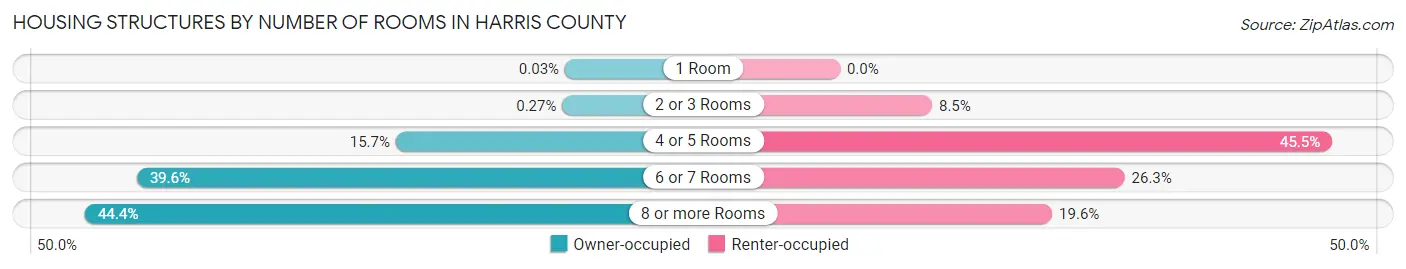
| Number of Rooms | Owner-occupied | Renter-occupied |
| 1 Room | 3 (0.0%) | 0 (0.0%) |
| 2 or 3 Rooms | 29 (0.3%) | 112 (8.5%) |
| 4 or 5 Rooms | 1,706 (15.7%) | 598 (45.5%) |
| 6 or 7 Rooms | 4,316 (39.6%) | 346 (26.3%) |
| 8 or more Rooms | 4,836 (44.4%) | 258 (19.6%) |
| Total | 10,890 (100.0%) | 1,314 (100.0%) |
Housing Structure by Heating Type in Harris County
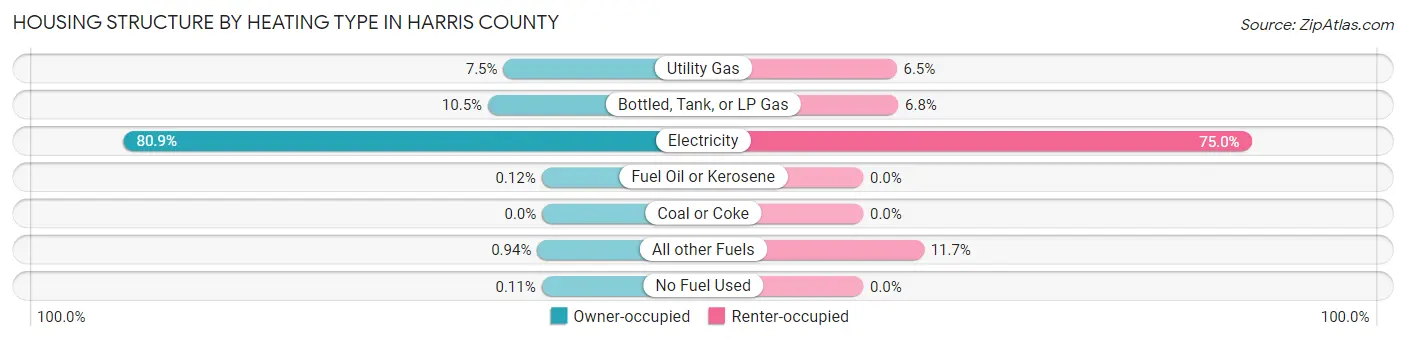
| Heating Type | Owner-occupied | Renter-occupied |
| Utility Gas | 816 (7.5%) | 85 (6.5%) |
| Bottled, Tank, or LP Gas | 1,140 (10.5%) | 89 (6.8%) |
| Electricity | 8,807 (80.9%) | 986 (75.0%) |
| Fuel Oil or Kerosene | 13 (0.1%) | 0 (0.0%) |
| Coal or Coke | 0 (0.0%) | 0 (0.0%) |
| All other Fuels | 102 (0.9%) | 154 (11.7%) |
| No Fuel Used | 12 (0.1%) | 0 (0.0%) |
| Total | 10,890 (100.0%) | 1,314 (100.0%) |
Household Vehicle Usage in Harris County
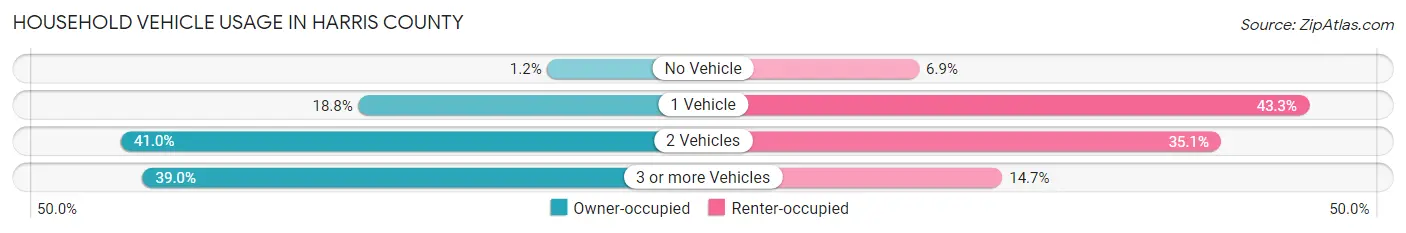
| Vehicles per Household | Owner-occupied | Renter-occupied |
| No Vehicle | 130 (1.2%) | 91 (6.9%) |
| 1 Vehicle | 2,051 (18.8%) | 569 (43.3%) |
| 2 Vehicles | 4,464 (41.0%) | 461 (35.1%) |
| 3 or more Vehicles | 4,245 (39.0%) | 193 (14.7%) |
| Total | 10,890 (100.0%) | 1,314 (100.0%) |
Real Estate & Mortgages in Harris County
Real Estate and Mortgage Overview in Harris County
| Characteristic | Without Mortgage | With Mortgage |
| Housing Units | 3,634 | 7,256 |
| Median Property Value | $229,000 | $296,400 |
| Median Household Income | $67,870 | $2,127 |
| Monthly Housing Costs | $564 | $704 |
| Real Estate Taxes | $1,954 | $118 |
Property Value by Mortgage Status in Harris County
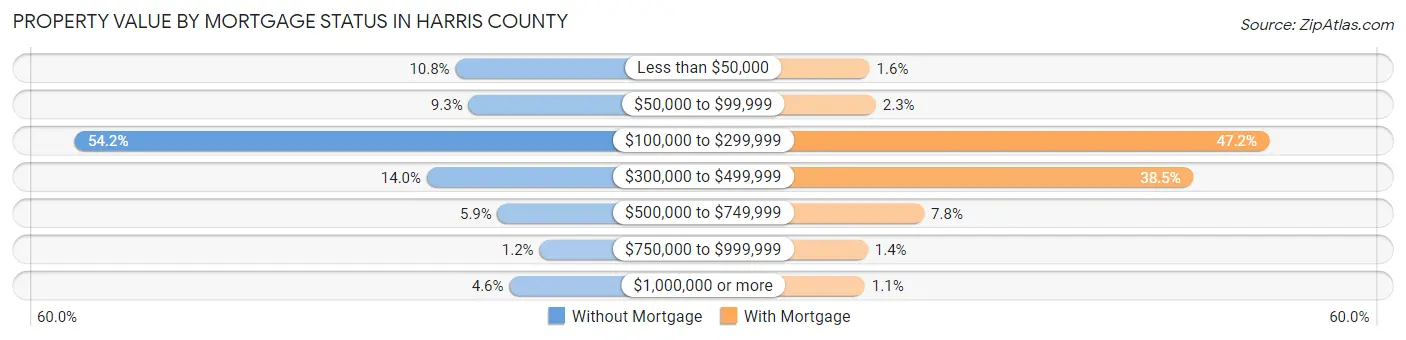
| Property Value | Without Mortgage | With Mortgage |
| Less than $50,000 | 391 (10.8%) | 117 (1.6%) |
| $50,000 to $99,999 | 337 (9.3%) | 168 (2.3%) |
| $100,000 to $299,999 | 1,971 (54.2%) | 3,427 (47.2%) |
| $300,000 to $499,999 | 510 (14.0%) | 2,795 (38.5%) |
| $500,000 to $749,999 | 216 (5.9%) | 569 (7.8%) |
| $750,000 to $999,999 | 42 (1.2%) | 102 (1.4%) |
| $1,000,000 or more | 167 (4.6%) | 78 (1.1%) |
| Total | 3,634 (100.0%) | 7,256 (100.0%) |
Household Income by Mortgage Status in Harris County
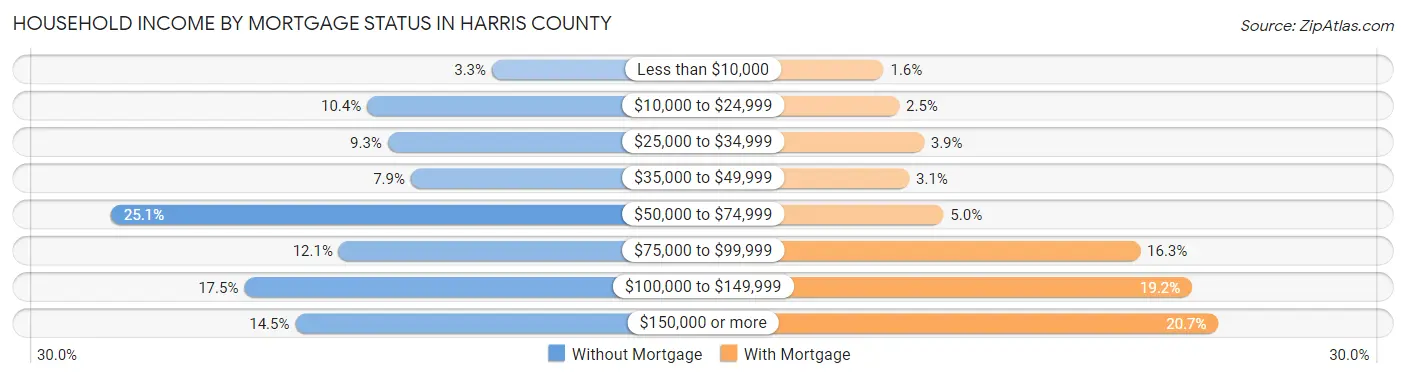
| Household Income | Without Mortgage | With Mortgage |
| Less than $10,000 | 120 (3.3%) | 116 (1.6%) |
| $10,000 to $24,999 | 379 (10.4%) | 181 (2.5%) |
| $25,000 to $34,999 | 336 (9.2%) | 283 (3.9%) |
| $35,000 to $49,999 | 288 (7.9%) | 222 (3.1%) |
| $50,000 to $74,999 | 911 (25.1%) | 364 (5.0%) |
| $75,000 to $99,999 | 438 (12.0%) | 1,180 (16.3%) |
| $100,000 to $149,999 | 634 (17.4%) | 1,395 (19.2%) |
| $150,000 or more | 528 (14.5%) | 1,504 (20.7%) |
| Total | 3,634 (100.0%) | 7,256 (100.0%) |
Property Value to Household Income Ratio in Harris County
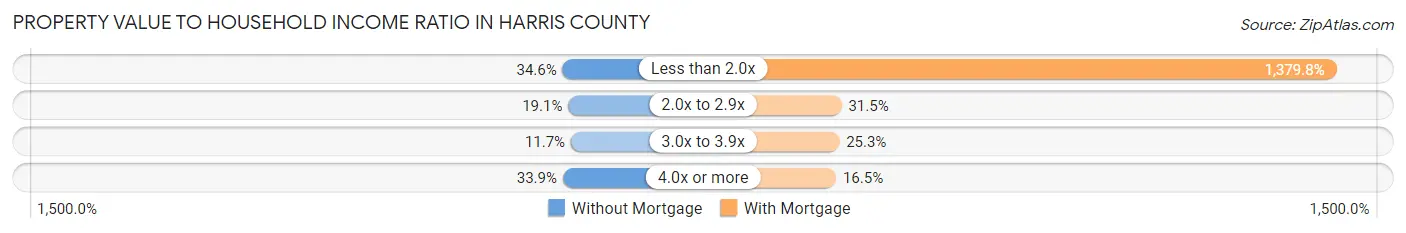
| Value-to-Income Ratio | Without Mortgage | With Mortgage |
| Less than 2.0x | 1,258 (34.6%) | 100,121 (1,379.8%) |
| 2.0x to 2.9x | 694 (19.1%) | 2,283 (31.5%) |
| 3.0x to 3.9x | 425 (11.7%) | 1,835 (25.3%) |
| 4.0x or more | 1,232 (33.9%) | 1,199 (16.5%) |
| Total | 3,634 (100.0%) | 7,256 (100.0%) |
Real Estate Taxes by Mortgage Status in Harris County
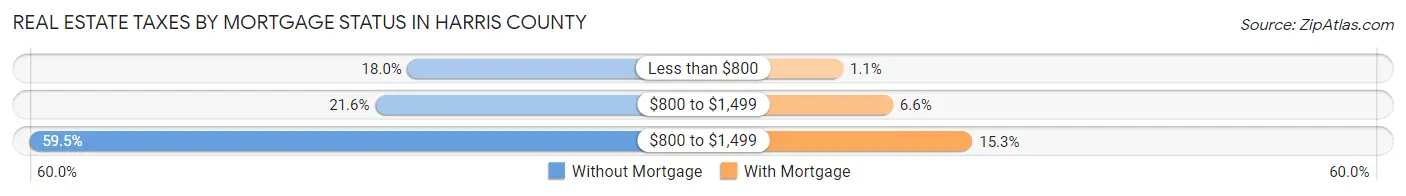
| Property Taxes | Without Mortgage | With Mortgage |
| Less than $800 | 655 (18.0%) | 79 (1.1%) |
| $800 to $1,499 | 784 (21.6%) | 476 (6.6%) |
| $800 to $1,499 | 2,162 (59.5%) | 1,107 (15.3%) |
| Total | 3,634 (100.0%) | 7,256 (100.0%) |
Health & Disability in Harris County
Health Insurance Coverage by Age in Harris County
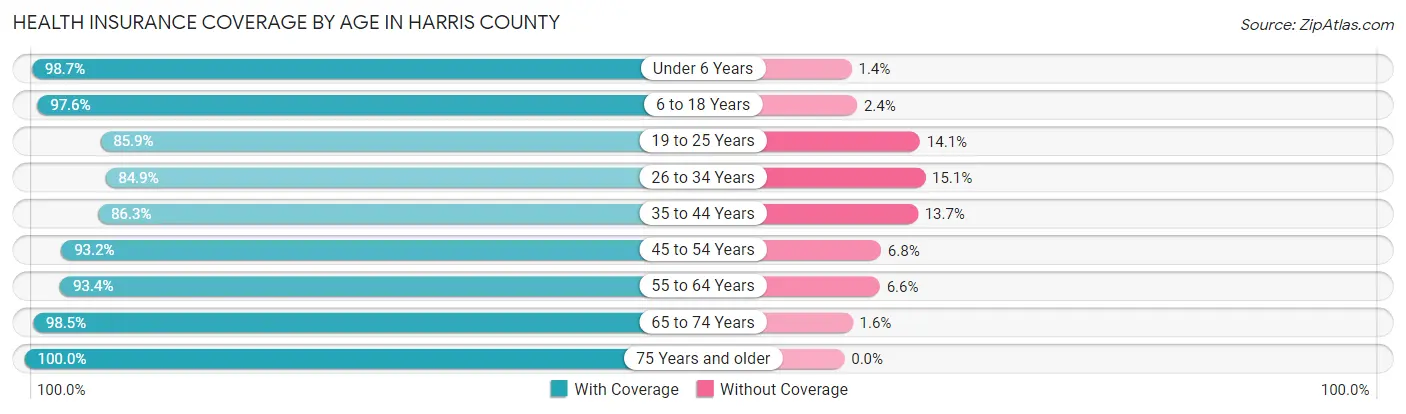
| Age Bracket | With Coverage | Without Coverage |
| Under 6 Years | 2,043 (98.7%) | 28 (1.3%) |
| 6 to 18 Years | 5,768 (97.6%) | 140 (2.4%) |
| 19 to 25 Years | 2,218 (85.9%) | 364 (14.1%) |
| 26 to 34 Years | 2,618 (84.9%) | 464 (15.1%) |
| 35 to 44 Years | 3,437 (86.3%) | 545 (13.7%) |
| 45 to 54 Years | 4,623 (93.2%) | 339 (6.8%) |
| 55 to 64 Years | 4,863 (93.4%) | 344 (6.6%) |
| 65 to 74 Years | 4,193 (98.5%) | 66 (1.5%) |
| 75 Years and older | 2,151 (100.0%) | 0 (0.0%) |
| Total | 31,914 (93.3%) | 2,290 (6.7%) |
Health Insurance Coverage by Citizenship Status in Harris County
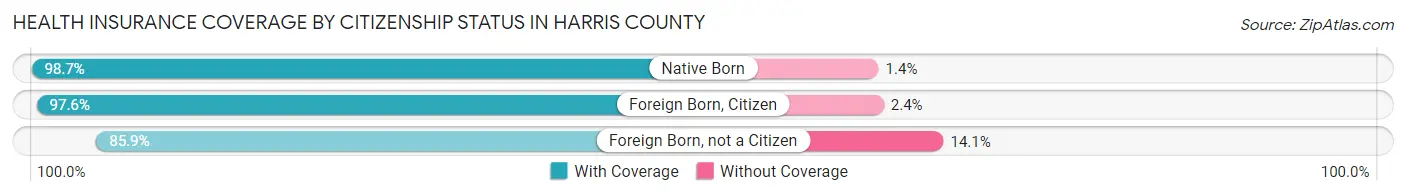
| Citizenship Status | With Coverage | Without Coverage |
| Native Born | 2,043 (98.7%) | 28 (1.3%) |
| Foreign Born, Citizen | 5,768 (97.6%) | 140 (2.4%) |
| Foreign Born, not a Citizen | 2,218 (85.9%) | 364 (14.1%) |
Health Insurance Coverage by Household Income in Harris County
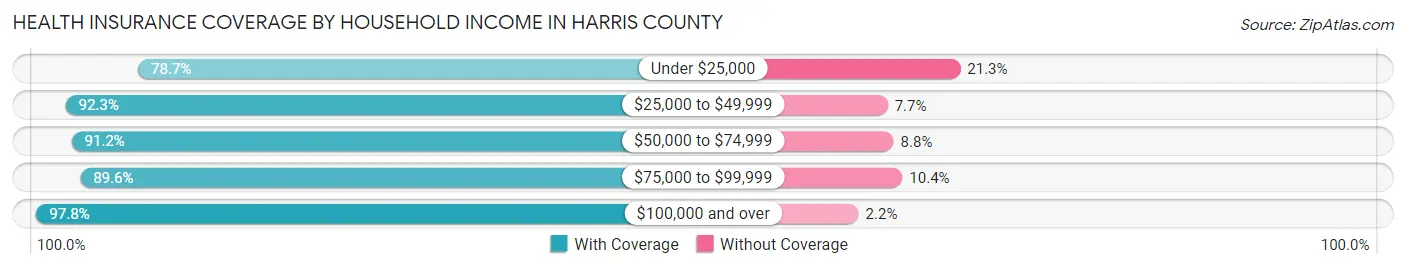
| Household Income | With Coverage | Without Coverage |
| Under $25,000 | 2,194 (78.7%) | 593 (21.3%) |
| $25,000 to $49,999 | 3,129 (92.3%) | 260 (7.7%) |
| $50,000 to $74,999 | 4,583 (91.2%) | 441 (8.8%) |
| $75,000 to $99,999 | 5,038 (89.6%) | 586 (10.4%) |
| $100,000 and over | 16,919 (97.8%) | 384 (2.2%) |
Public vs Private Health Insurance Coverage by Age in Harris County
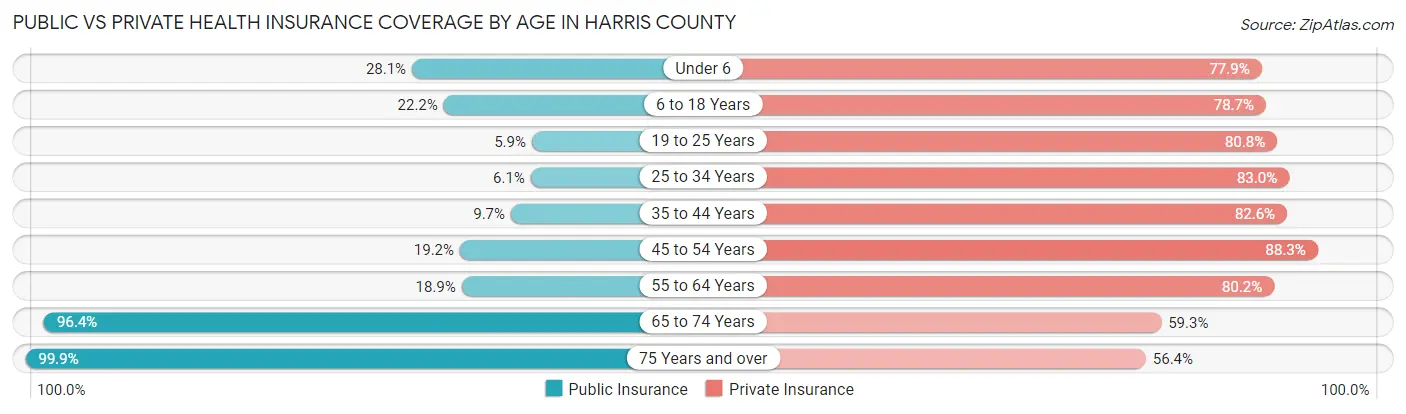
| Age Bracket | Public Insurance | Private Insurance |
| Under 6 | 582 (28.1%) | 1,613 (77.9%) |
| 6 to 18 Years | 1,313 (22.2%) | 4,649 (78.7%) |
| 19 to 25 Years | 151 (5.9%) | 2,086 (80.8%) |
| 25 to 34 Years | 187 (6.1%) | 2,558 (83.0%) |
| 35 to 44 Years | 388 (9.7%) | 3,290 (82.6%) |
| 45 to 54 Years | 953 (19.2%) | 4,382 (88.3%) |
| 55 to 64 Years | 984 (18.9%) | 4,178 (80.2%) |
| 65 to 74 Years | 4,106 (96.4%) | 2,525 (59.3%) |
| 75 Years and over | 2,148 (99.9%) | 1,214 (56.4%) |
| Total | 10,812 (31.6%) | 26,495 (77.5%) |
Disability Status by Sex by Age in Harris County
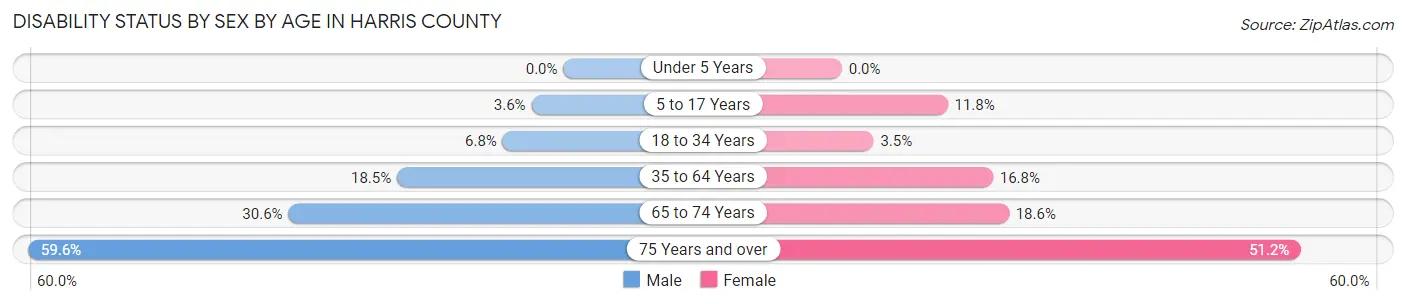
| Age Bracket | Male | Female |
| Under 5 Years | 0 (0.0%) | 0 (0.0%) |
| 5 to 17 Years | 105 (3.5%) | 323 (11.8%) |
| 18 to 34 Years | 212 (6.8%) | 109 (3.5%) |
| 35 to 64 Years | 1,284 (18.5%) | 1,214 (16.8%) |
| 65 to 74 Years | 627 (30.6%) | 411 (18.6%) |
| 75 Years and over | 616 (59.6%) | 572 (51.2%) |
Disability Class by Sex by Age in Harris County
Disability Class: Hearing Difficulty
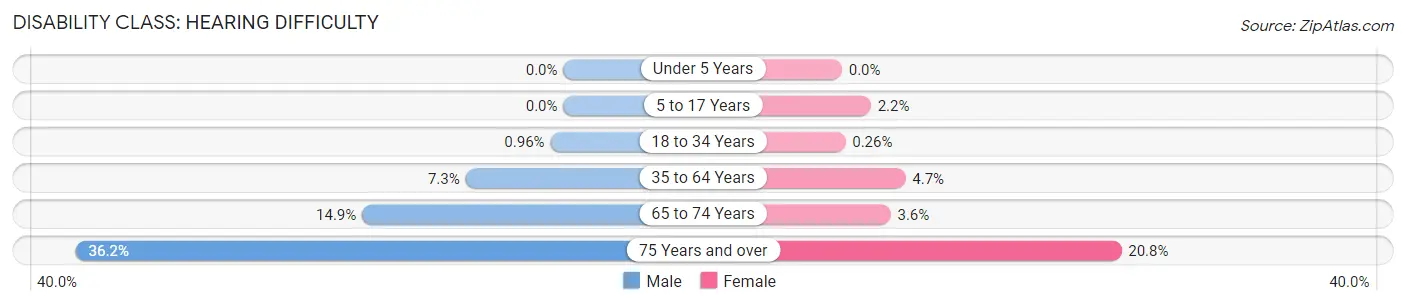
| Age Bracket | Male | Female |
| Under 5 Years | 0 (0.0%) | 0 (0.0%) |
| 5 to 17 Years | 0 (0.0%) | 59 (2.1%) |
| 18 to 34 Years | 30 (1.0%) | 8 (0.3%) |
| 35 to 64 Years | 503 (7.3%) | 341 (4.7%) |
| 65 to 74 Years | 306 (14.9%) | 80 (3.6%) |
| 75 Years and over | 374 (36.2%) | 232 (20.7%) |
Disability Class: Vision Difficulty
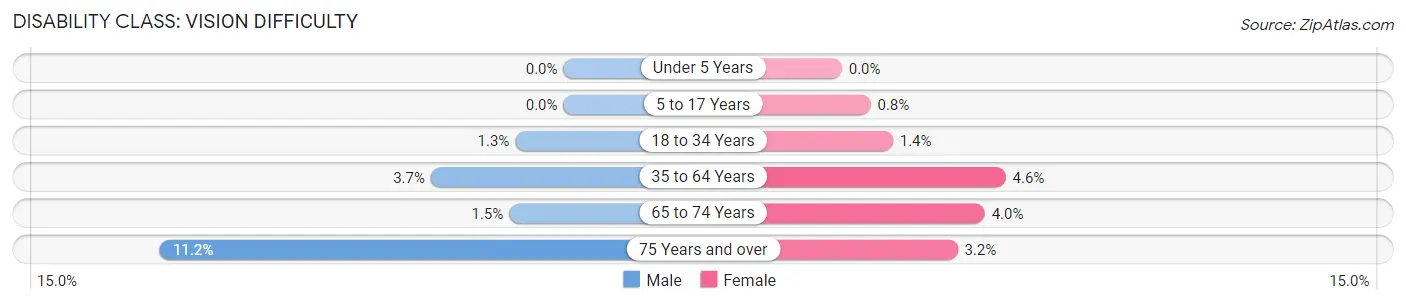
| Age Bracket | Male | Female |
| Under 5 Years | 0 (0.0%) | 0 (0.0%) |
| 5 to 17 Years | 0 (0.0%) | 22 (0.8%) |
| 18 to 34 Years | 42 (1.3%) | 44 (1.4%) |
| 35 to 64 Years | 256 (3.7%) | 329 (4.6%) |
| 65 to 74 Years | 31 (1.5%) | 88 (4.0%) |
| 75 Years and over | 116 (11.2%) | 36 (3.2%) |
Disability Class: Cognitive Difficulty
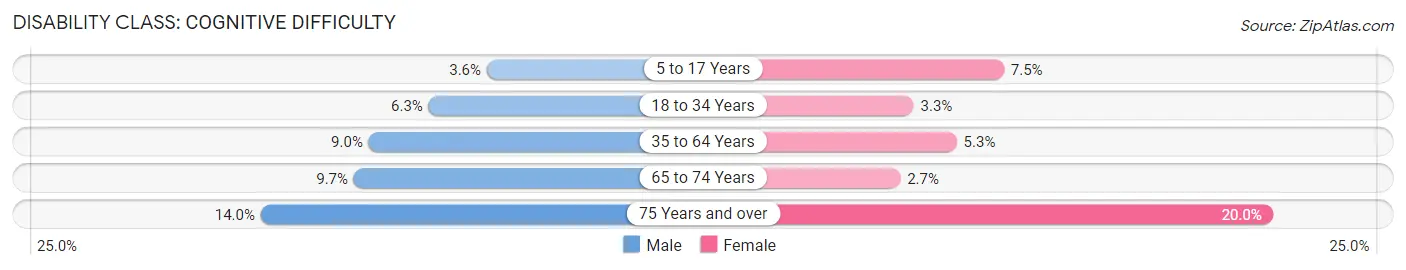
| Age Bracket | Male | Female |
| 5 to 17 Years | 105 (3.5%) | 206 (7.5%) |
| 18 to 34 Years | 196 (6.2%) | 103 (3.3%) |
| 35 to 64 Years | 626 (9.0%) | 385 (5.3%) |
| 65 to 74 Years | 199 (9.7%) | 60 (2.7%) |
| 75 Years and over | 145 (14.0%) | 224 (20.0%) |
Disability Class: Ambulatory Difficulty
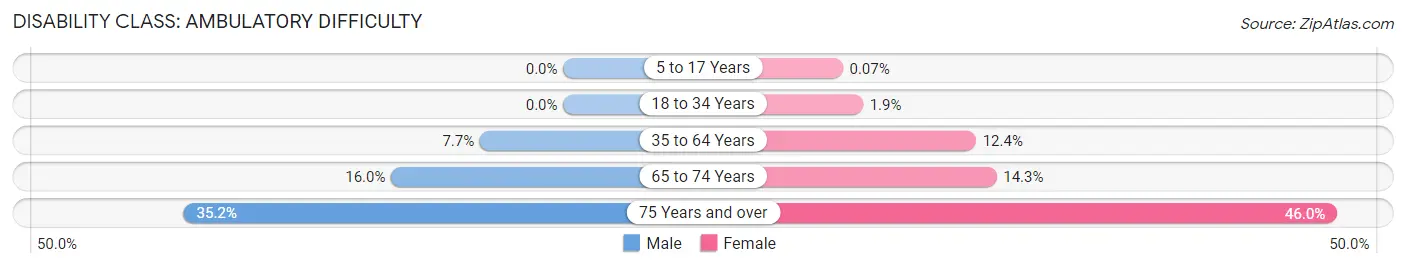
| Age Bracket | Male | Female |
| 5 to 17 Years | 0 (0.0%) | 2 (0.1%) |
| 18 to 34 Years | 0 (0.0%) | 60 (1.9%) |
| 35 to 64 Years | 536 (7.7%) | 897 (12.4%) |
| 65 to 74 Years | 327 (16.0%) | 317 (14.3%) |
| 75 Years and over | 364 (35.2%) | 514 (46.0%) |
Disability Class: Self-Care Difficulty
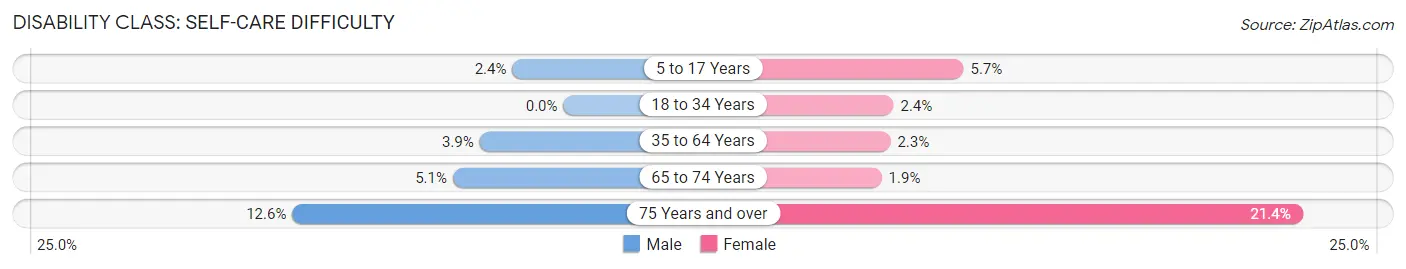
| Age Bracket | Male | Female |
| 5 to 17 Years | 70 (2.4%) | 155 (5.7%) |
| 18 to 34 Years | 0 (0.0%) | 74 (2.4%) |
| 35 to 64 Years | 270 (3.9%) | 163 (2.3%) |
| 65 to 74 Years | 105 (5.1%) | 41 (1.8%) |
| 75 Years and over | 130 (12.6%) | 239 (21.4%) |
Technology Access in Harris County
Computing Device Access in Harris County
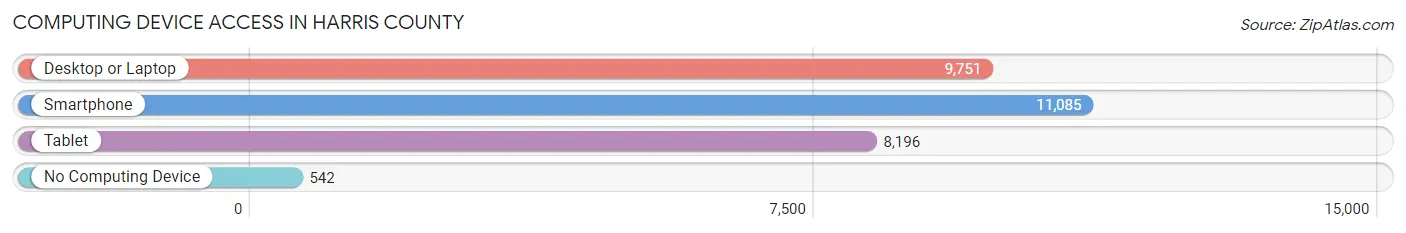
| Device Type | # Households | % Households |
| Desktop or Laptop | 9,751 | 79.9% |
| Smartphone | 11,085 | 90.8% |
| Tablet | 8,196 | 67.2% |
| No Computing Device | 542 | 4.4% |
| Total | 12,204 | 100.0% |
Internet Access in Harris County
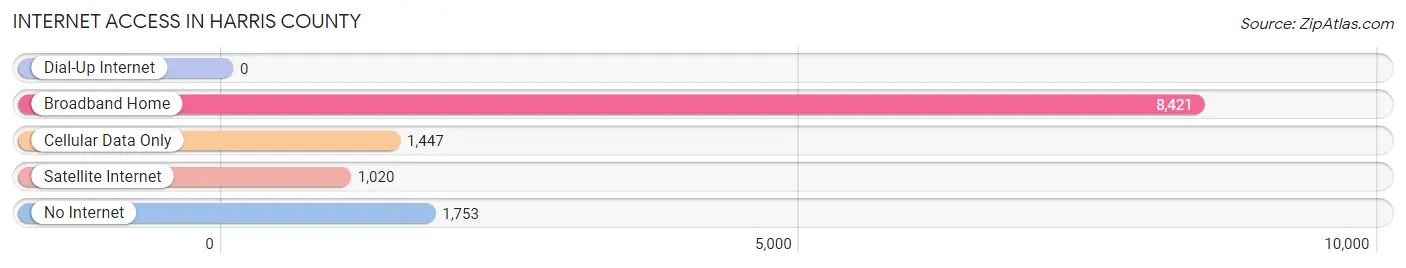
| Internet Type | # Households | % Households |
| Dial-Up Internet | 0 | 0.0% |
| Broadband Home | 8,421 | 69.0% |
| Cellular Data Only | 1,447 | 11.9% |
| Satellite Internet | 1,020 | 8.4% |
| No Internet | 1,753 | 14.4% |
| Total | 12,204 | 100.0% |
Harris County Summary
Harris County, Georgia is located in the west-central part of the state, and is part of the Columbus, Georgia metropolitan area. It is bordered by Muscogee County to the north, Talbot County to the east, Taylor County to the south, and Troup County to the west. The county seat is Hamilton, and the county was named for Charles Harris, a Revolutionary War soldier.
History
Harris County was created in 1827 from parts of Muscogee and Troup counties. It was named for Charles Harris, a Revolutionary War soldier who was killed in the Battle of Kettle Creek in 1779. The county was originally part of the Creek Nation, and the area was home to many Native American tribes, including the Creek, Cherokee, and Choctaw.
The county was largely agricultural in the 19th century, with cotton being the main crop. The county was also home to several small towns, including Hamilton, Waverly Hall, and Pine Mountain.
In the early 20th century, the county began to experience rapid growth due to the development of the textile industry. The county was home to several large mills, including the Hamilton Mill, the Waverly Hall Mill, and the Pine Mountain Mill.
Geography
Harris County is located in the west-central part of Georgia, and is part of the Columbus, Georgia metropolitan area. It is bordered by Muscogee County to the north, Talbot County to the east, Taylor County to the south, and Troup County to the west. The county has a total area of 441 square miles, of which 437 square miles is land and 4.2 square miles is water.
The county is mostly flat, with some rolling hills in the northern part of the county. The Flint River runs through the county, and there are several small lakes and ponds. The county is home to several state parks, including F.D. Roosevelt State Park, which is the largest state park in Georgia.
Economy
The economy of Harris County is largely based on agriculture and manufacturing. The county is home to several large farms, and the main crops are cotton, corn, soybeans, and peanuts. The county is also home to several large manufacturing companies, including the Hamilton Mill, the Waverly Hall Mill, and the Pine Mountain Mill.
The county is also home to several small businesses, including restaurants, retail stores, and service providers. The county is home to several large employers, including the Hamilton Mill, the Waverly Hall Mill, and the Pine Mountain Mill.
Demographics
As of the 2010 census, the population of Harris County was 32,622. The population density was 74 people per square mile. The racial makeup of the county was 68.3% White, 28.2% African American, 0.3% Native American, 0.7% Asian, 0.1% Pacific Islander, 0.7% from other races, and 1.9% from two or more races. Hispanic or Latino of any race were 2.3% of the population.
The median income for a household in the county was $37,945, and the median income for a family was $45,945. The per capita income for the county was $18,945. About 17.3% of the population was below the poverty line.
Conclusion
Harris County, Georgia is a rural county located in the west-central part of the state. It is bordered by Muscogee County to the north, Talbot County to the east, Taylor County to the south, and Troup County to the west. The county was created in 1827 and was named for Charles Harris, a Revolutionary War soldier. The county is largely agricultural, with cotton being the main crop. The county is also home to several large manufacturing companies, and the economy is also supported by small businesses and large employers. The population of Harris County was 32,622 as of the 2010 census, and the median income for a household was $37,945.
Common Questions
What is Per Capita Income in Harris County?
Per Capita income in Harris County is $39,851.
What is the Median Family Income in Harris County?
Median Family Income in Harris County is $99,819.
What is the Median Household income in Harris County?
Median Household Income in Harris County is $85,936.
What is Income or Wage Gap in Harris County?
Income or Wage Gap in Harris County is 28.0%.
Women in Harris County earn 72.0 cents for every dollar earned by a man.
What is Family Income Deficit in Harris County?
Family Income Deficit in Harris County is $12,086.
Families that are below poverty line in Harris County earn $12,086 less on average than the poverty threshold level.
What is Inequality or Gini Index in Harris County?
Inequality or Gini Index in Harris County is 0.41.
What is the Total Population of Harris County?
Total Population of Harris County is 34,914.
What is the Total Male Population of Harris County?
Total Male Population of Harris County is 17,698.
What is the Total Female Population of Harris County?
Total Female Population of Harris County is 17,216.
What is the Ratio of Males per 100 Females in Harris County?
There are 102.80 Males per 100 Females in Harris County.
What is the Ratio of Females per 100 Males in Harris County?
There are 97.28 Females per 100 Males in Harris County.
What is the Median Population Age in Harris County?
Median Population Age in Harris County is 43.2 Years.
What is the Average Family Size in Harris County
Average Family Size in Harris County is 3.2 People.
What is the Average Household Size in Harris County
Average Household Size in Harris County is 2.8 People.
How Large is the Labor Force in Harris County?
There are 17,088 People in the Labor Forcein in Harris County.
What is the Percentage of People in the Labor Force in Harris County?
60.2% of People are in the Labor Force in Harris County.
What is the Unemployment Rate in Harris County?
Unemployment Rate in Harris County is 5.8%.