Hancock County, GA Map & Demographics
Hancock County Map
Hancock County Overview
$19,730
PER CAPITA INCOME
$57,070
AVG FAMILY INCOME
$31,767
AVG HOUSEHOLD INCOME
36.9%
WAGE / INCOME GAP [ % ]
63.1¢/ $1
WAGE / INCOME GAP [ $ ]
0.50
INEQUALITY / GINI INDEX
8,588
TOTAL POPULATION
4,502
MALE POPULATION
4,086
FEMALE POPULATION
110.18
MALES / 100 FEMALES
90.76
FEMALES / 100 MALES
46.0
MEDIAN AGE
3.5
AVG FAMILY SIZE
2.5
AVG HOUSEHOLD SIZE
2,698
LABOR FORCE [ PEOPLE ]
35.6%
PERCENT IN LABOR FORCE
6.2%
UNEMPLOYMENT RATE
Hancock County Area Codes
Income in Hancock County
Income Overview in Hancock County
Per Capita Income in Hancock County is $19,730, while median incomes of families and households are $57,070 and $31,767 respectively.
| Characteristic | Number | Measure |
| Per Capita Income | 8,588 | $19,730 |
| Median Family Income | 1,663 | $57,070 |
| Mean Family Income | 1,663 | $74,390 |
| Median Household Income | 2,785 | $31,767 |
| Mean Household Income | 2,785 | $53,841 |
| Income Deficit | 1,663 | $0 |
| Wage / Income Gap (%) | 8,588 | 36.85% |
| Wage / Income Gap ($) | 8,588 | 63.15¢ per $1 |
| Gini / Inequality Index | 8,588 | 0.50 |
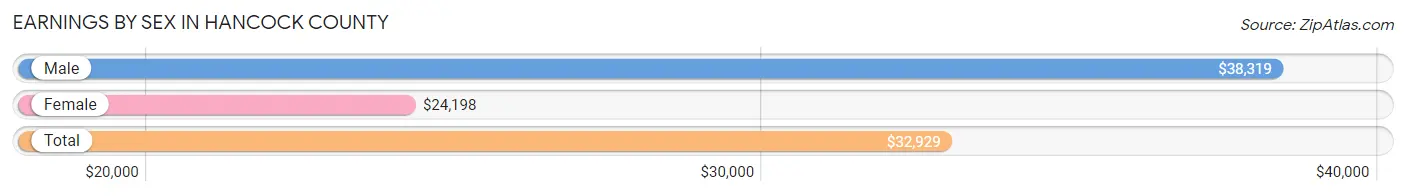
Earnings by Sex in Hancock County
Average Earnings in Hancock County are $32,929, $38,319 for men and $24,198 for women, a difference of 36.8%.
| Sex | Number | Average Earnings |
| Male | 1,327 (47.7%) | $38,319 |
| Female | 1,456 (52.3%) | $24,198 |
| Total | 2,783 (100.0%) | $32,929 |
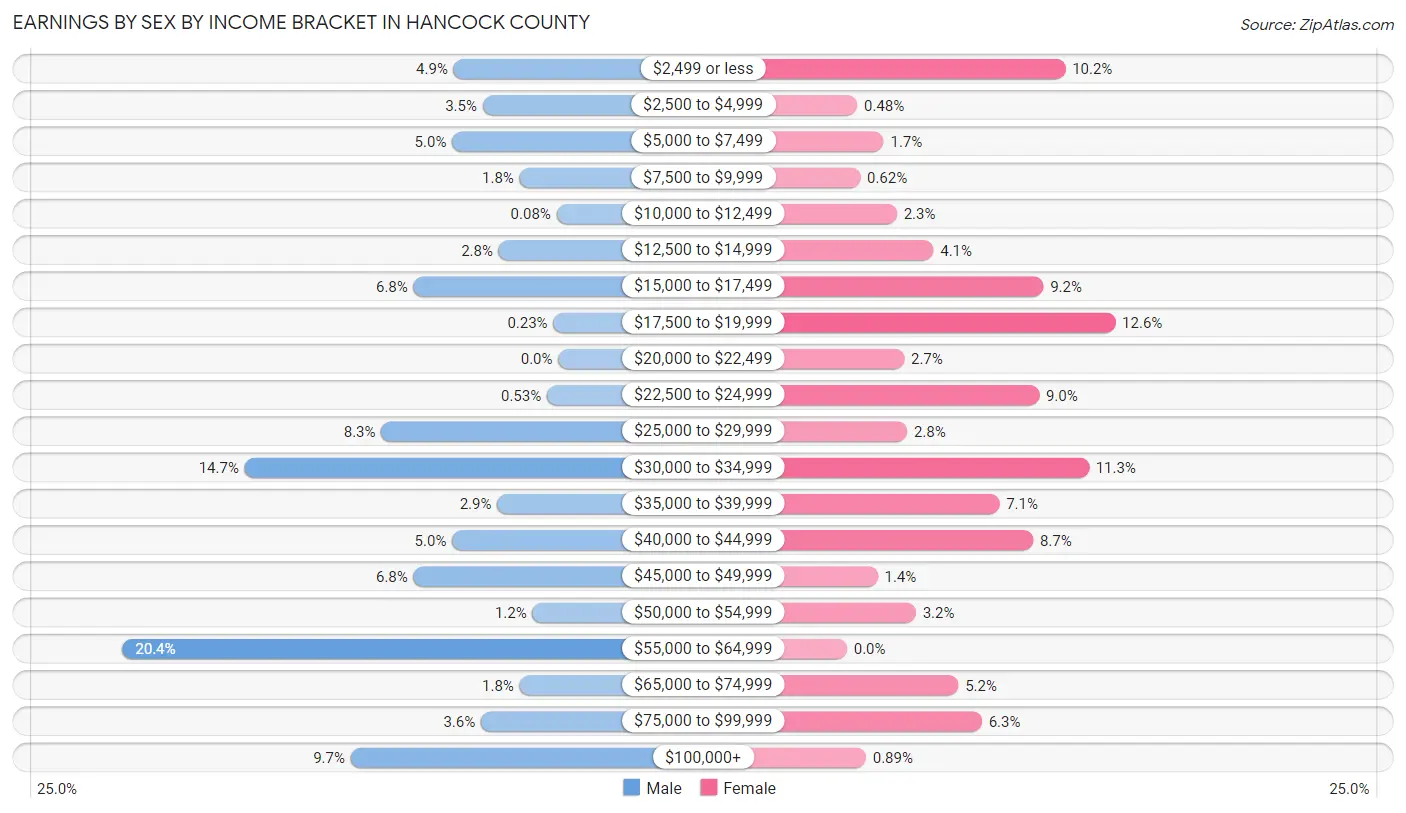
Earnings by Sex by Income Bracket in Hancock County
The most common earnings brackets in Hancock County are $55,000 to $64,999 for men (271 | 20.4%) and $17,500 to $19,999 for women (183 | 12.6%).
| Income | Male | Female |
| $2,499 or less | 65 (4.9%) | 149 (10.2%) |
| $2,500 to $4,999 | 47 (3.5%) | 7 (0.5%) |
| $5,000 to $7,499 | 66 (5.0%) | 25 (1.7%) |
| $7,500 to $9,999 | 24 (1.8%) | 9 (0.6%) |
| $10,000 to $12,499 | 1 (0.1%) | 34 (2.3%) |
| $12,500 to $14,999 | 37 (2.8%) | 59 (4.1%) |
| $15,000 to $17,499 | 90 (6.8%) | 134 (9.2%) |
| $17,500 to $19,999 | 3 (0.2%) | 183 (12.6%) |
| $20,000 to $22,499 | 0 (0.0%) | 39 (2.7%) |
| $22,500 to $24,999 | 7 (0.5%) | 131 (9.0%) |
| $25,000 to $29,999 | 110 (8.3%) | 41 (2.8%) |
| $30,000 to $34,999 | 195 (14.7%) | 165 (11.3%) |
| $35,000 to $39,999 | 38 (2.9%) | 104 (7.1%) |
| $40,000 to $44,999 | 66 (5.0%) | 127 (8.7%) |
| $45,000 to $49,999 | 90 (6.8%) | 21 (1.4%) |
| $50,000 to $54,999 | 16 (1.2%) | 47 (3.2%) |
| $55,000 to $64,999 | 271 (20.4%) | 0 (0.0%) |
| $65,000 to $74,999 | 24 (1.8%) | 76 (5.2%) |
| $75,000 to $99,999 | 48 (3.6%) | 92 (6.3%) |
| $100,000+ | 129 (9.7%) | 13 (0.9%) |
| Total | 1,327 (100.0%) | 1,456 (100.0%) |
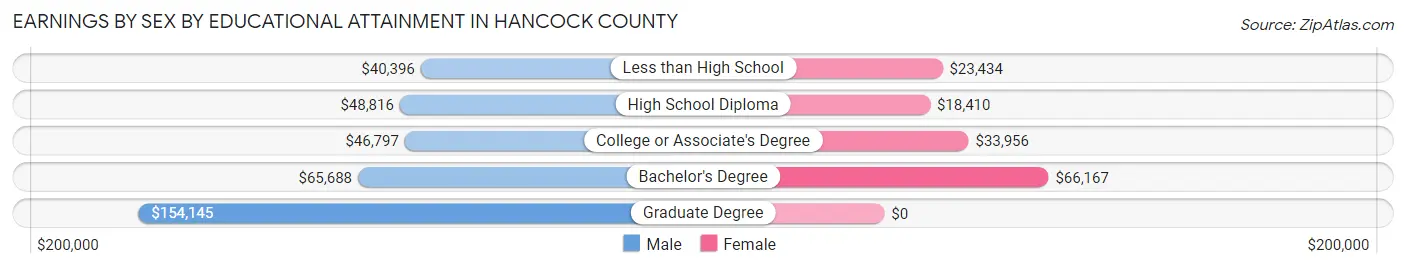
Earnings by Sex by Educational Attainment in Hancock County
Average earnings in Hancock County are $46,250 for men and $24,551 for women, a difference of 46.9%. Men with an educational attainment of graduate degree enjoy the highest average annual earnings of $154,145, while those with less than high school education earn the least with $40,396. Women with an educational attainment of bachelor's degree earn the most with the average annual earnings of $66,167, while those with high school diploma education have the smallest earnings of $18,410.
| Educational Attainment | Male Income | Female Income |
| Less than High School | $40,396 | $23,434 |
| High School Diploma | $48,816 | $18,410 |
| College or Associate's Degree | $46,797 | $33,956 |
| Bachelor's Degree | $65,688 | $66,167 |
| Graduate Degree | $154,145 | $0 |
| Total | $46,250 | $24,551 |
Family Income in Hancock County
Family Income Brackets in Hancock County
According to the Hancock County family income data, there are 314 families falling into the $15,000 to $24,999 income range, which is the most common income bracket and makes up 18.9% of all families.
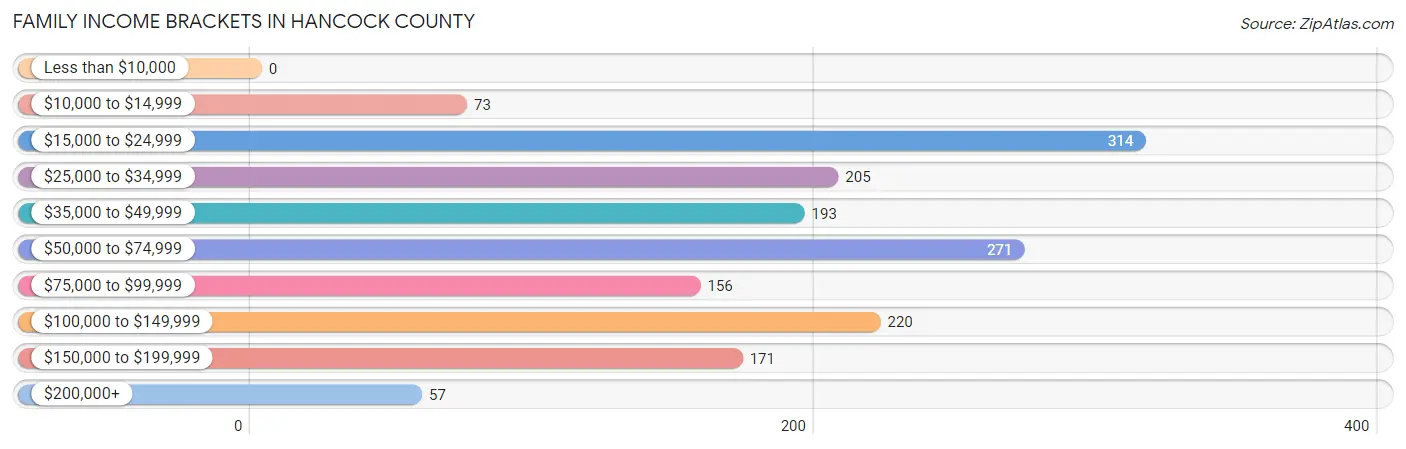
| Income Bracket | # Families | % Families |
| Less than $10,000 | 0 | 0.0% |
| $10,000 to $14,999 | 73 | 4.4% |
| $15,000 to $24,999 | 314 | 18.9% |
| $25,000 to $34,999 | 205 | 12.3% |
| $35,000 to $49,999 | 193 | 11.6% |
| $50,000 to $74,999 | 271 | 16.3% |
| $75,000 to $99,999 | 156 | 9.4% |
| $100,000 to $149,999 | 220 | 13.2% |
| $150,000 to $199,999 | 171 | 10.3% |
| $200,000+ | 57 | 3.4% |
Family Income by Famaliy Size in Hancock County
5-person families (97 | 5.8%) account for the highest median family income in Hancock County with $84,609 per family, while 3-person families (499 | 30.0%) have the highest median income of $22,909 per family member.
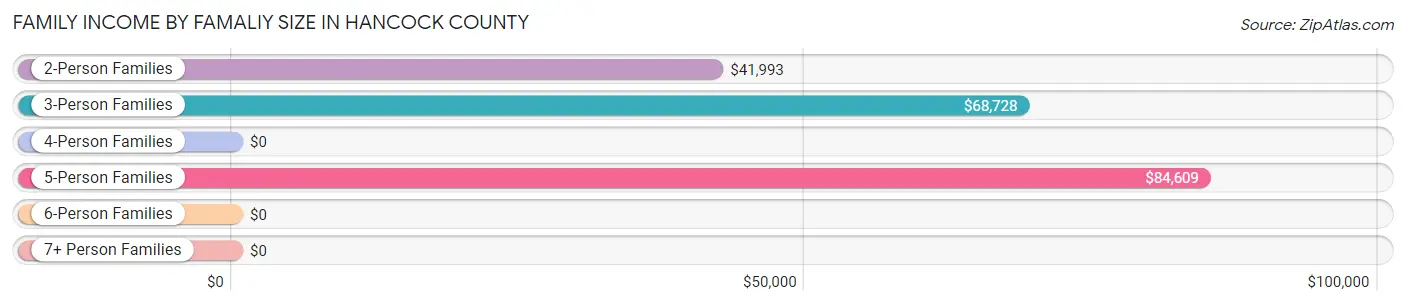
| Income Bracket | # Families | Median Income |
| 2-Person Families | 883 (53.1%) | $41,993 |
| 3-Person Families | 499 (30.0%) | $68,728 |
| 4-Person Families | 140 (8.4%) | $0 |
| 5-Person Families | 97 (5.8%) | $84,609 |
| 6-Person Families | 44 (2.6%) | $0 |
| 7+ Person Families | 0 (0.0%) | $0 |
| Total | 1,663 (100.0%) | $57,070 |
Family Income by Number of Earners in Hancock County
The median family income in Hancock County is $57,070, with families comprising 3+ earners (51) having the highest median family income of $124,338, while families with no earners (500) have the lowest median family income of $28,804, accounting for 3.1% and 30.1% of families, respectively.
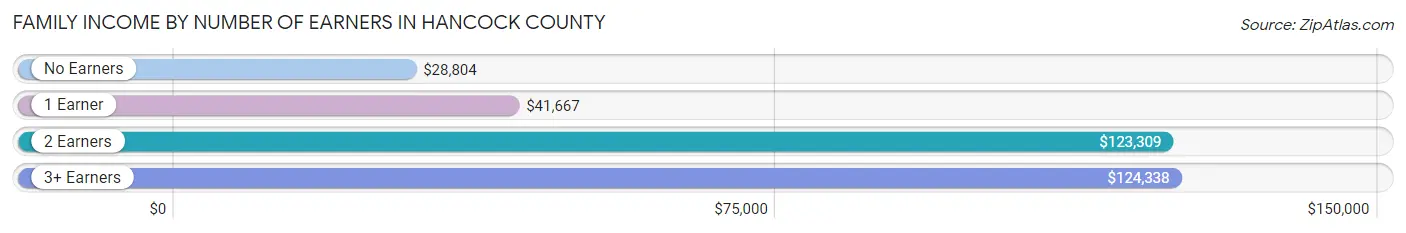
| Number of Earners | # Families | Median Income |
| No Earners | 500 (30.1%) | $28,804 |
| 1 Earner | 782 (47.0%) | $41,667 |
| 2 Earners | 330 (19.8%) | $123,309 |
| 3+ Earners | 51 (3.1%) | $124,338 |
| Total | 1,663 (100.0%) | $57,070 |
Household Income in Hancock County
Household Income Brackets in Hancock County
With 588 households falling in the category, the $15,000 to $24,999 income range is the most frequent in Hancock County, accounting for 21.1% of all households. In contrast, only 56 households (2.0%) fall into the $200,000+ income bracket, making it the least populous group.
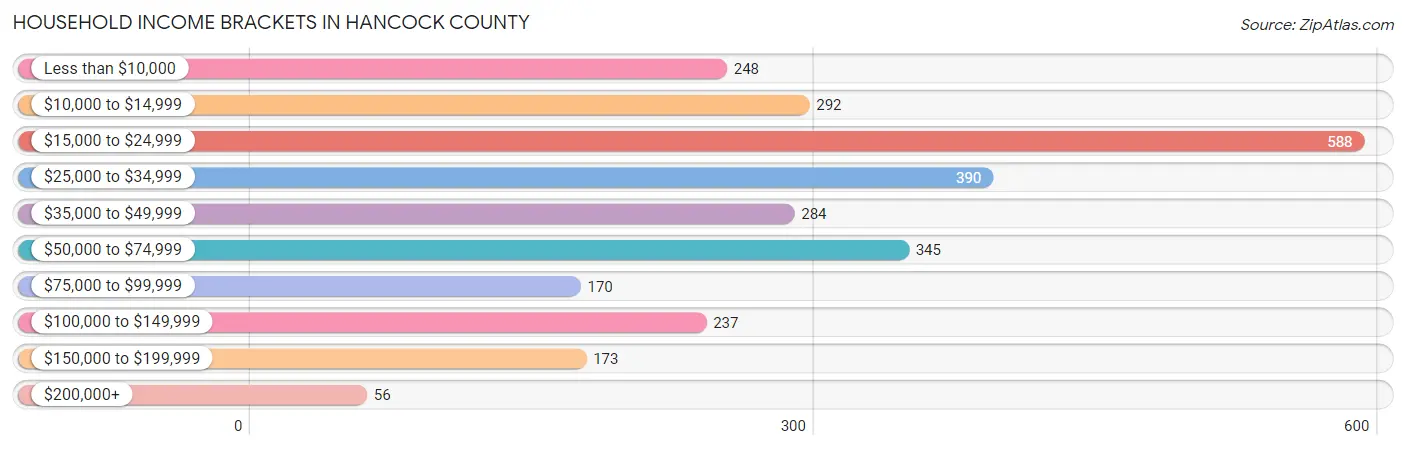
| Income Bracket | # Households | % Households |
| Less than $10,000 | 248 | 8.9% |
| $10,000 to $14,999 | 292 | 10.5% |
| $15,000 to $24,999 | 588 | 21.1% |
| $25,000 to $34,999 | 390 | 14.0% |
| $35,000 to $49,999 | 284 | 10.2% |
| $50,000 to $74,999 | 345 | 12.4% |
| $75,000 to $99,999 | 170 | 6.1% |
| $100,000 to $149,999 | 237 | 8.5% |
| $150,000 to $199,999 | 173 | 6.2% |
| $200,000+ | 56 | 2.0% |
Household Income by Householder Age in Hancock County
The median household income in Hancock County is $31,767, with the highest median household income of $32,639 found in the 45 to 64 years age bracket for the primary householder. A total of 1,020 households (36.6%) fall into this category. Meanwhile, the 15 to 24 years age bracket for the primary householder has the lowest median household income of $0, with 29 households (1.0%) in this group.
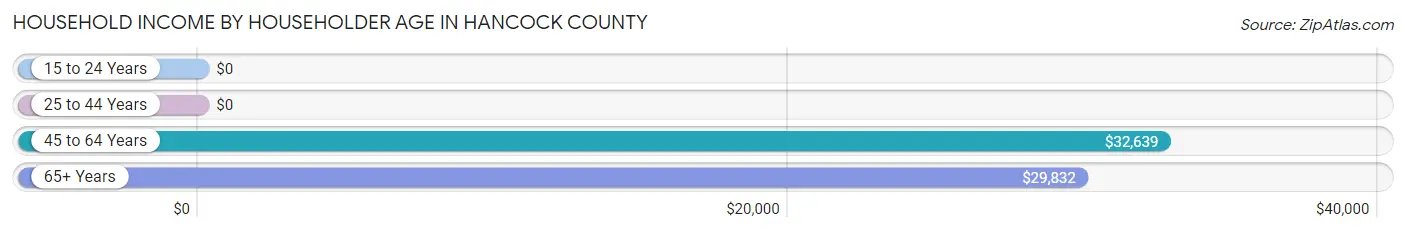
| Income Bracket | # Households | Median Income |
| 15 to 24 Years | 29 (1.0%) | $0 |
| 25 to 44 Years | 446 (16.0%) | $0 |
| 45 to 64 Years | 1,020 (36.6%) | $32,639 |
| 65+ Years | 1,290 (46.3%) | $29,832 |
| Total | 2,785 (100.0%) | $31,767 |
Poverty in Hancock County
Income Below Poverty by Sex and Age in Hancock County
With 18.3% poverty level for males and 34.6% for females among the residents of Hancock County, 6 to 11 year old males and 5 year old females are the most vulnerable to poverty, with 78 males (60.9%) and 60 females (100.0%) in their respective age groups living below the poverty level.
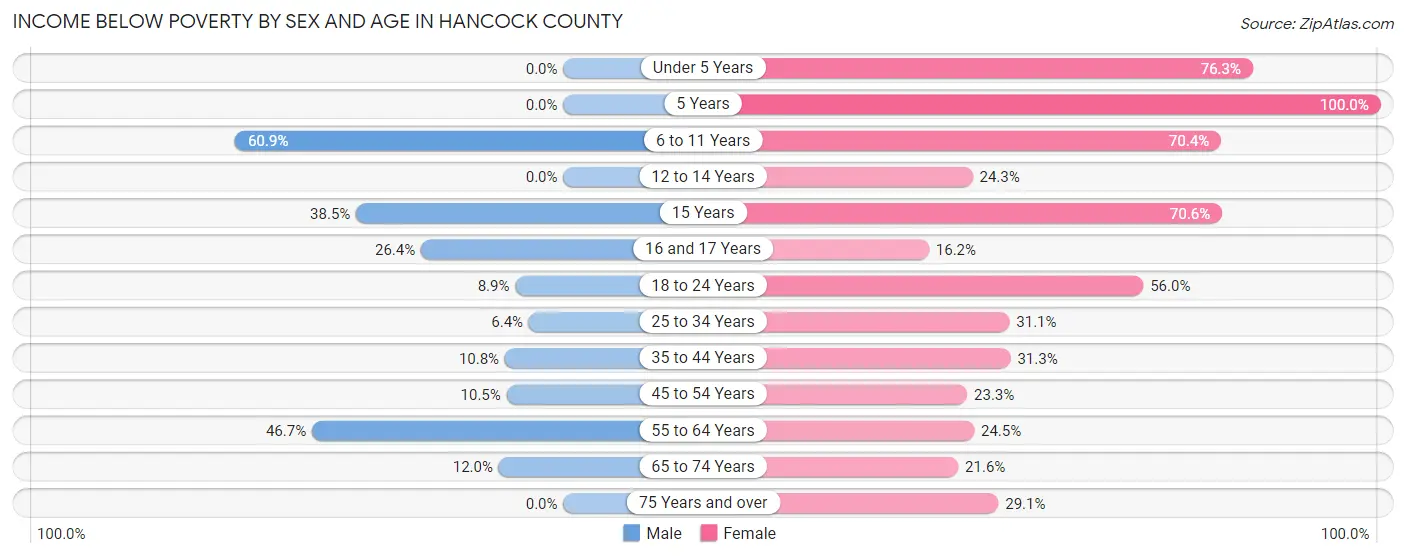
| Age Bracket | Male | Female |
| Under 5 Years | 0 (0.0%) | 119 (76.3%) |
| 5 Years | 0 (0.0%) | 60 (100.0%) |
| 6 to 11 Years | 78 (60.9%) | 207 (70.4%) |
| 12 to 14 Years | 0 (0.0%) | 50 (24.3%) |
| 15 Years | 5 (38.5%) | 48 (70.6%) |
| 16 and 17 Years | 14 (26.4%) | 16 (16.2%) |
| 18 to 24 Years | 38 (8.9%) | 127 (55.9%) |
| 25 to 34 Years | 23 (6.4%) | 88 (31.1%) |
| 35 to 44 Years | 18 (10.8%) | 139 (31.3%) |
| 45 to 54 Years | 40 (10.5%) | 100 (23.3%) |
| 55 to 64 Years | 272 (46.7%) | 161 (24.5%) |
| 65 to 74 Years | 72 (12.0%) | 135 (21.6%) |
| 75 Years and over | 0 (0.0%) | 122 (29.0%) |
| Total | 560 (18.3%) | 1,372 (34.6%) |
Income Above Poverty by Sex and Age in Hancock County
According to the poverty statistics in Hancock County, males aged under 5 years and females aged 16 and 17 years are the age groups that are most secure financially, with 100.0% of males and 83.8% of females in these age groups living above the poverty line.
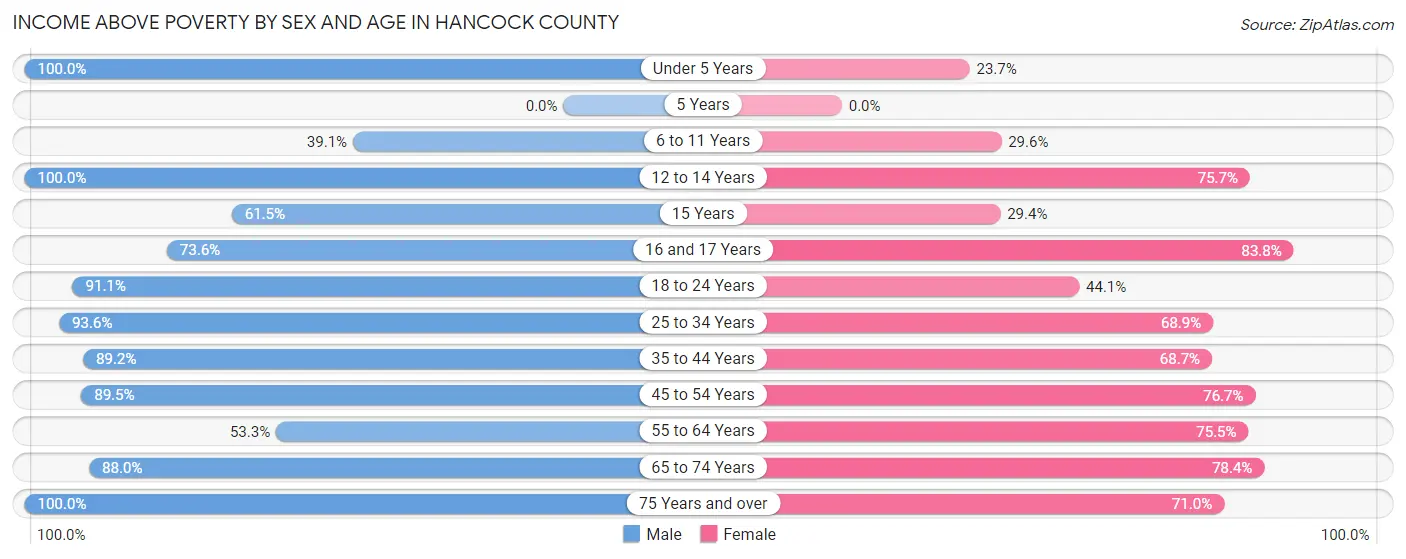
| Age Bracket | Male | Female |
| Under 5 Years | 16 (100.0%) | 37 (23.7%) |
| 5 Years | 0 (0.0%) | 0 (0.0%) |
| 6 to 11 Years | 50 (39.1%) | 87 (29.6%) |
| 12 to 14 Years | 20 (100.0%) | 156 (75.7%) |
| 15 Years | 8 (61.5%) | 20 (29.4%) |
| 16 and 17 Years | 39 (73.6%) | 83 (83.8%) |
| 18 to 24 Years | 388 (91.1%) | 100 (44.1%) |
| 25 to 34 Years | 337 (93.6%) | 195 (68.9%) |
| 35 to 44 Years | 148 (89.2%) | 305 (68.7%) |
| 45 to 54 Years | 340 (89.5%) | 330 (76.7%) |
| 55 to 64 Years | 311 (53.3%) | 495 (75.5%) |
| 65 to 74 Years | 529 (88.0%) | 490 (78.4%) |
| 75 Years and over | 312 (100.0%) | 298 (71.0%) |
| Total | 2,498 (81.7%) | 2,596 (65.4%) |
Income Below Poverty Among Married-Couple Families in Hancock County
The poverty statistics for married-couple families in Hancock County show that 4.0% or 45 of the total 1,134 families live below the poverty line. Families with no children have the highest poverty rate of 4.7%, comprising of 45 families. On the other hand, families with 1 or 2 children have the lowest poverty rate of 0.0%, which includes 0 families.
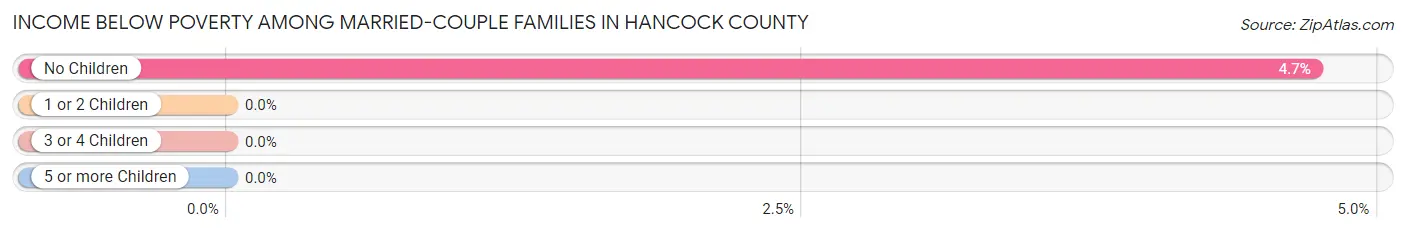
| Children | Above Poverty | Below Poverty |
| No Children | 909 (95.3%) | 45 (4.7%) |
| 1 or 2 Children | 180 (100.0%) | 0 (0.0%) |
| 3 or 4 Children | 0 (0.0%) | 0 (0.0%) |
| 5 or more Children | 0 (0.0%) | 0 (0.0%) |
| Total | 1,089 (96.0%) | 45 (4.0%) |
Income Below Poverty Among Single-Parent Households in Hancock County
According to the poverty data in Hancock County, 14.1% or 10 single-father households and 66.8% or 306 single-mother households are living below the poverty line. Among single-father households, those with no children have the highest poverty rate, with 10 households (16.4%) experiencing poverty. Likewise, among single-mother households, those with 3 or 4 children have the highest poverty rate, with 107 households (100.0%) falling below the poverty line.
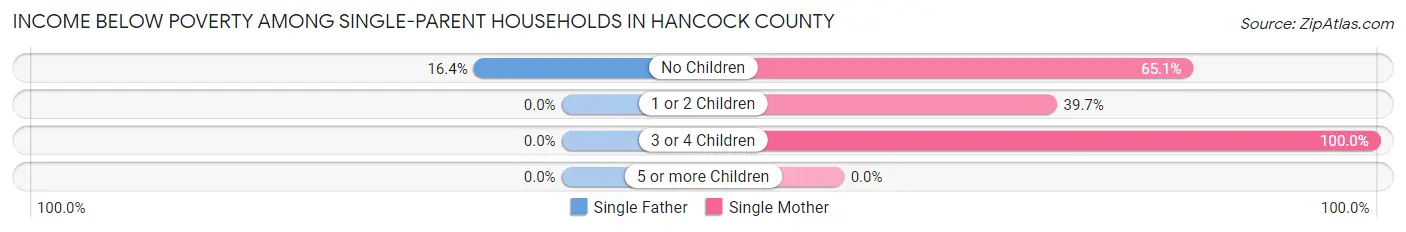
| Children | Single Father | Single Mother |
| No Children | 10 (16.4%) | 153 (65.1%) |
| 1 or 2 Children | 0 (0.0%) | 46 (39.7%) |
| 3 or 4 Children | 0 (0.0%) | 107 (100.0%) |
| 5 or more Children | 0 (0.0%) | 0 (0.0%) |
| Total | 10 (14.1%) | 306 (66.8%) |
Income Below Poverty Among Married-Couple vs Single-Parent Households in Hancock County
The poverty data for Hancock County shows that 45 of the married-couple family households (4.0%) and 316 of the single-parent households (59.7%) are living below the poverty level. Within the married-couple family households, those with no children have the highest poverty rate, with 45 households (4.7%) falling below the poverty line. Among the single-parent households, those with 3 or 4 children have the highest poverty rate, with 107 household (100.0%) living below poverty.
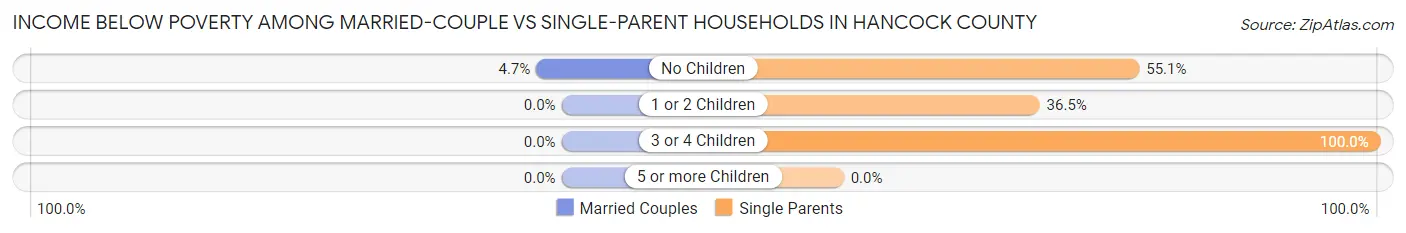
| Children | Married-Couple Families | Single-Parent Households |
| No Children | 45 (4.7%) | 163 (55.1%) |
| 1 or 2 Children | 0 (0.0%) | 46 (36.5%) |
| 3 or 4 Children | 0 (0.0%) | 107 (100.0%) |
| 5 or more Children | 0 (0.0%) | 0 (0.0%) |
| Total | 45 (4.0%) | 316 (59.7%) |
Race in Hancock County
The most populous races in Hancock County are Black / African American (6,156 | 71.7%), White / Caucasian (2,178 | 25.4%), and Two or more Races (125 | 1.5%).
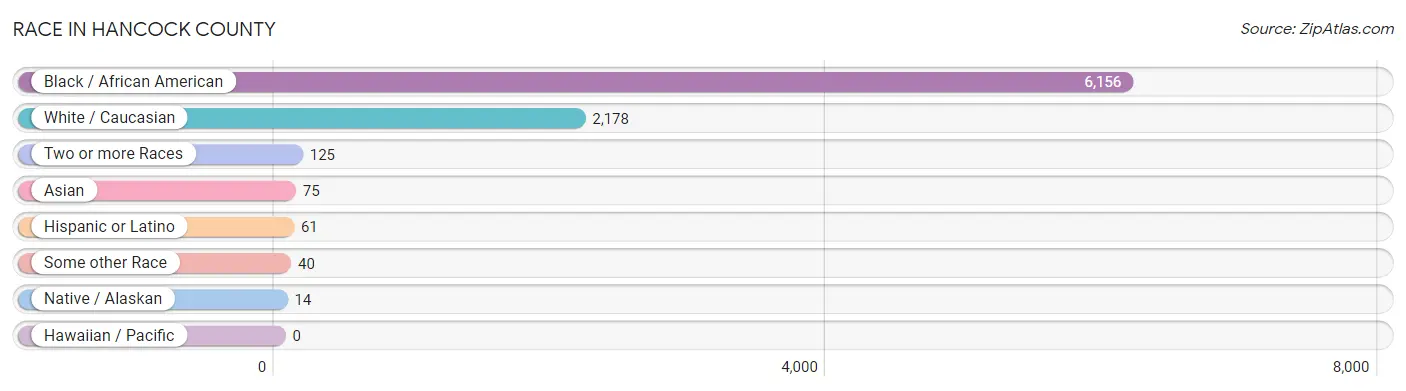
| Race | # Population | % Population |
| Asian | 75 | 0.9% |
| Black / African American | 6,156 | 71.7% |
| Hawaiian / Pacific | 0 | 0.0% |
| Hispanic or Latino | 61 | 0.7% |
| Native / Alaskan | 14 | 0.2% |
| White / Caucasian | 2,178 | 25.4% |
| Two or more Races | 125 | 1.5% |
| Some other Race | 40 | 0.5% |
| Total | 8,588 | 100.0% |
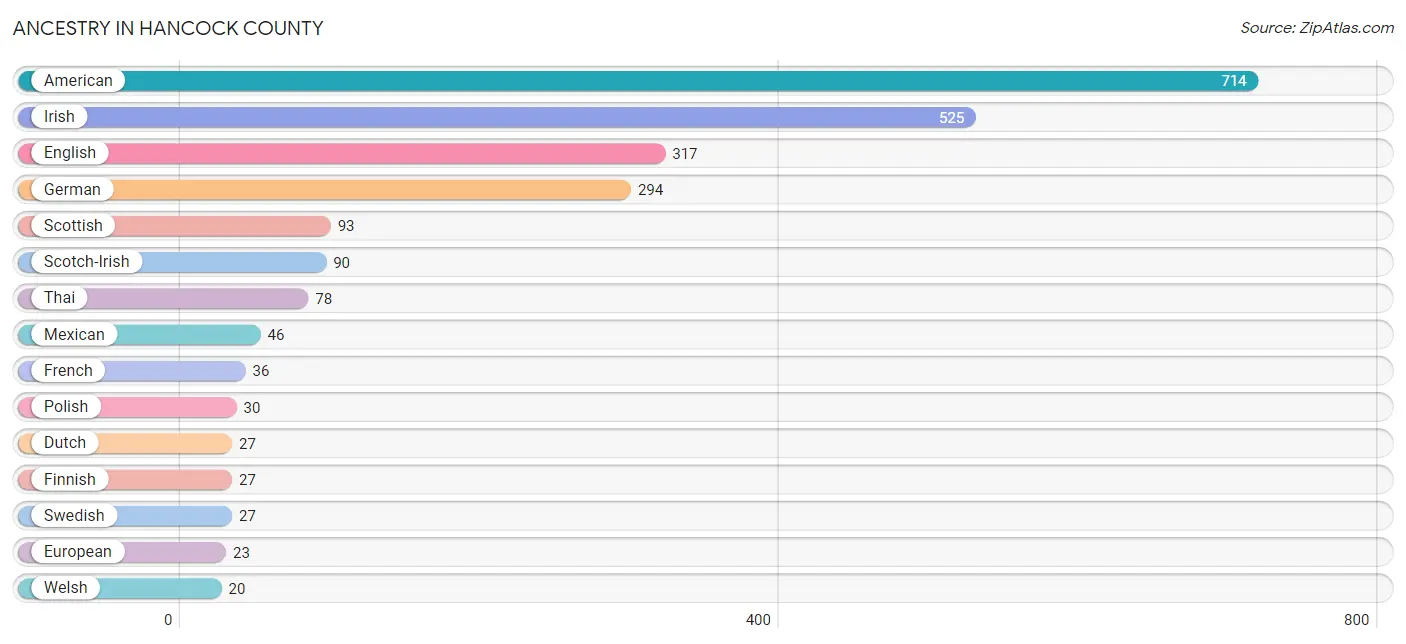
Ancestry in Hancock County
The most populous ancestries reported in Hancock County are American (714 | 8.3%), Irish (525 | 6.1%), English (317 | 3.7%), German (294 | 3.4%), and Scottish (93 | 1.1%), together accounting for 22.6% of all Hancock County residents.
| Ancestry | # Population | % Population |
| American | 714 | 8.3% |
| Arab | 1 | 0.0% |
| British | 14 | 0.2% |
| Burmese | 7 | 0.1% |
| Canadian | 16 | 0.2% |
| Cherokee | 14 | 0.2% |
| Choctaw | 1 | 0.0% |
| Cuban | 11 | 0.1% |
| Czechoslovakian | 13 | 0.2% |
| Dutch | 27 | 0.3% |
| Eastern European | 13 | 0.2% |
| Egyptian | 1 | 0.0% |
| English | 317 | 3.7% |
| European | 23 | 0.3% |
| Finnish | 27 | 0.3% |
| French | 36 | 0.4% |
| French Canadian | 8 | 0.1% |
| German | 294 | 3.4% |
| Guamanian / Chamorro | 14 | 0.2% |
| Indian (Asian) | 1 | 0.0% |
| Irish | 525 | 6.1% |
| Israeli | 18 | 0.2% |
| Italian | 6 | 0.1% |
| Mexican | 46 | 0.5% |
| Mexican American Indian | 14 | 0.2% |
| Native Hawaiian | 14 | 0.2% |
| Nigerian | 1 | 0.0% |
| Norwegian | 8 | 0.1% |
| Polish | 30 | 0.4% |
| Samoan | 14 | 0.2% |
| Scandinavian | 6 | 0.1% |
| Scotch-Irish | 90 | 1.1% |
| Scottish | 93 | 1.1% |
| Sri Lankan | 4 | 0.1% |
| Subsaharan African | 1 | 0.0% |
| Swedish | 27 | 0.3% |
| Swiss | 15 | 0.2% |
| Thai | 78 | 0.9% |
| Welsh | 20 | 0.2% | View All 39 Rows |
Immigrants in Hancock County
The most numerous immigrant groups reported in Hancock County came from Asia (50 | 0.6%), Central America (50 | 0.6%), Latin America (50 | 0.6%), Mexico (46 | 0.5%), and India (39 | 0.4%), together accounting for 2.7% of all Hancock County residents.
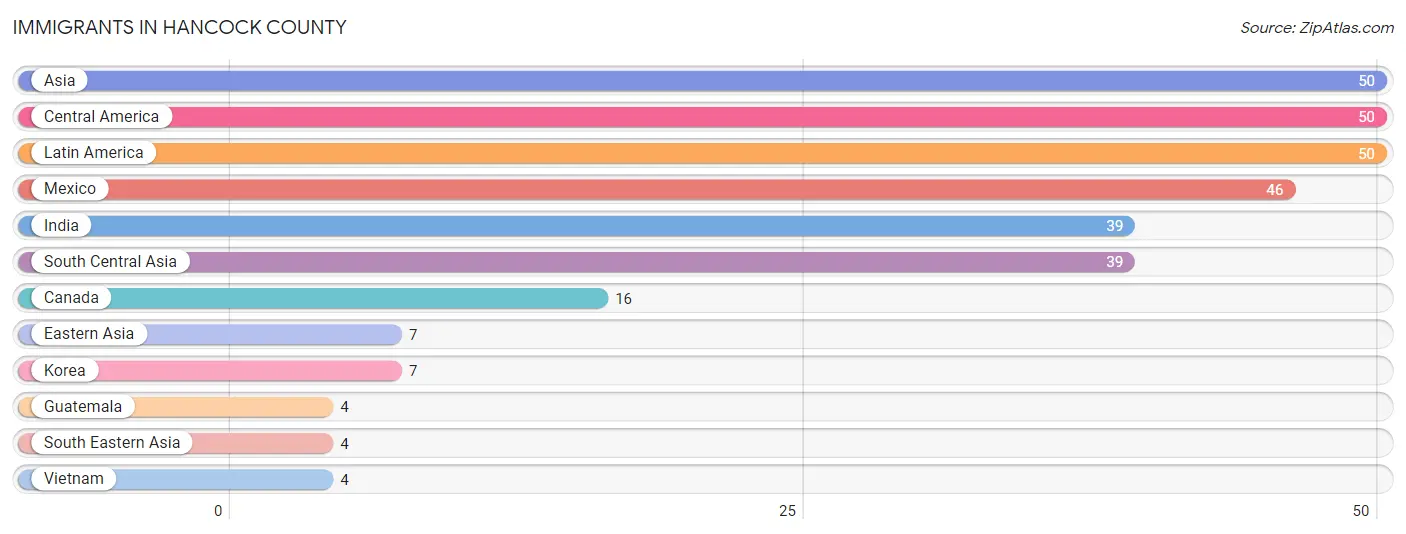
| Immigration Origin | # Population | % Population |
| Asia | 50 | 0.6% |
| Canada | 16 | 0.2% |
| Central America | 50 | 0.6% |
| Eastern Asia | 7 | 0.1% |
| Guatemala | 4 | 0.1% |
| India | 39 | 0.4% |
| Korea | 7 | 0.1% |
| Latin America | 50 | 0.6% |
| Mexico | 46 | 0.5% |
| South Central Asia | 39 | 0.4% |
| South Eastern Asia | 4 | 0.1% |
| Vietnam | 4 | 0.1% | View All 12 Rows |
Sex and Age in Hancock County
Sex and Age in Hancock County
The most populous age groups in Hancock County are 20 to 24 Years (570 | 12.7%) for men and 55 to 59 Years (439 | 10.7%) for women.
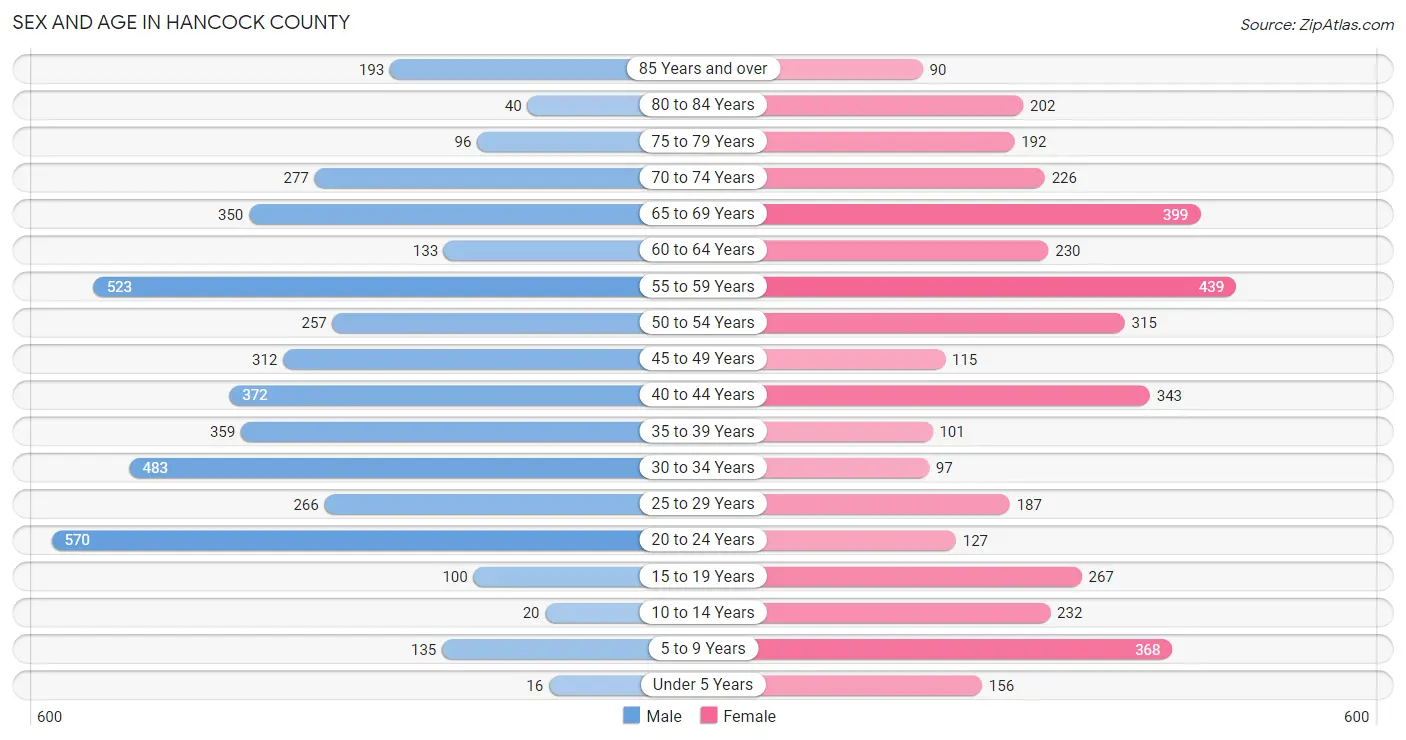
| Age Bracket | Male | Female |
| Under 5 Years | 16 (0.4%) | 156 (3.8%) |
| 5 to 9 Years | 135 (3.0%) | 368 (9.0%) |
| 10 to 14 Years | 20 (0.4%) | 232 (5.7%) |
| 15 to 19 Years | 100 (2.2%) | 267 (6.5%) |
| 20 to 24 Years | 570 (12.7%) | 127 (3.1%) |
| 25 to 29 Years | 266 (5.9%) | 187 (4.6%) |
| 30 to 34 Years | 483 (10.7%) | 97 (2.4%) |
| 35 to 39 Years | 359 (8.0%) | 101 (2.5%) |
| 40 to 44 Years | 372 (8.3%) | 343 (8.4%) |
| 45 to 49 Years | 312 (6.9%) | 115 (2.8%) |
| 50 to 54 Years | 257 (5.7%) | 315 (7.7%) |
| 55 to 59 Years | 523 (11.6%) | 439 (10.7%) |
| 60 to 64 Years | 133 (2.9%) | 230 (5.6%) |
| 65 to 69 Years | 350 (7.8%) | 399 (9.8%) |
| 70 to 74 Years | 277 (6.1%) | 226 (5.5%) |
| 75 to 79 Years | 96 (2.1%) | 192 (4.7%) |
| 80 to 84 Years | 40 (0.9%) | 202 (4.9%) |
| 85 Years and over | 193 (4.3%) | 90 (2.2%) |
| Total | 4,502 (100.0%) | 4,086 (100.0%) |
Families and Households in Hancock County
Median Family Size in Hancock County
The median family size in Hancock County is 3.46 persons per family, with single female/mother families (458 | 27.5%) accounting for the largest median family size of 4.69 persons per family. On the other hand, married-couple families (1,134 | 68.2%) represent the smallest median family size with 2.97 persons per family.
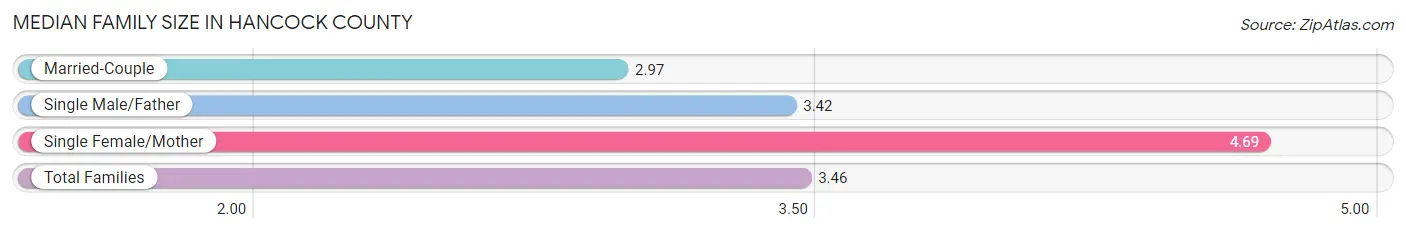
| Family Type | # Families | Family Size |
| Married-Couple | 1,134 (68.2%) | 2.97 |
| Single Male/Father | 71 (4.3%) | 3.42 |
| Single Female/Mother | 458 (27.5%) | 4.69 |
| Total Families | 1,663 (100.0%) | 3.46 |
Median Household Size in Hancock County
The median household size in Hancock County is 2.54 persons per household, with single female/mother households (458 | 16.5%) accounting for the largest median household size of 4.69 persons per household. non-family households (1,122 | 40.3%) represent the smallest median household size with 1.17 persons per household.
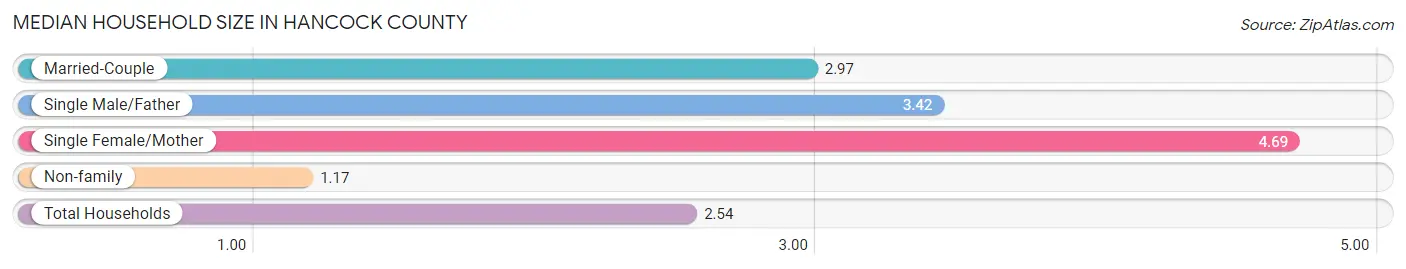
| Household Type | # Households | Household Size |
| Married-Couple | 1,134 (40.7%) | 2.97 |
| Single Male/Father | 71 (2.5%) | 3.42 |
| Single Female/Mother | 458 (16.5%) | 4.69 |
| Non-family | 1,122 (40.3%) | 1.17 |
| Total Households | 2,785 (100.0%) | 2.54 |
Household Size by Marriage Status in Hancock County
Out of a total of 2,785 households in Hancock County, 1,663 (59.7%) are family households, while 1,122 (40.3%) are nonfamily households. The most numerous type of family households are 2-person households, comprising 883, and the most common type of nonfamily households are 1-person households, comprising 1,025.
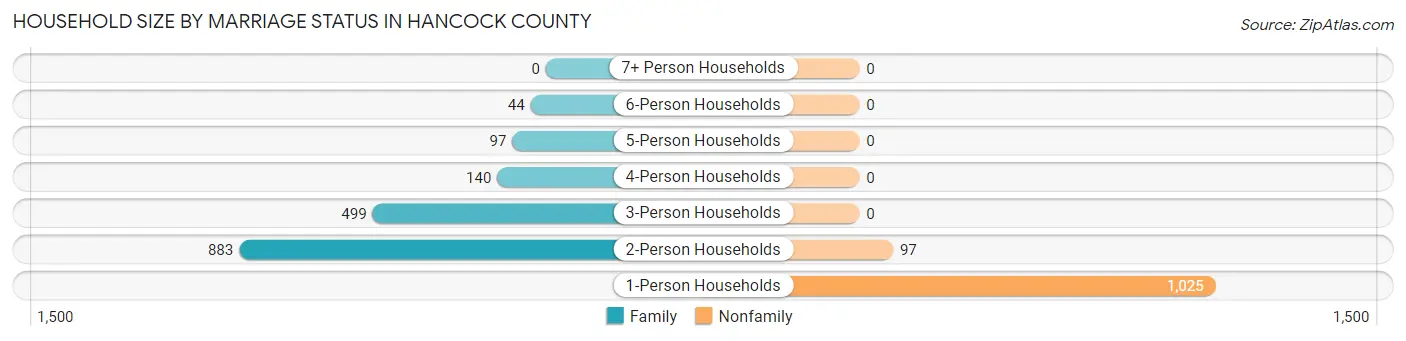
| Household Size | Family Households | Nonfamily Households |
| 1-Person Households | - | 1,025 (36.8%) |
| 2-Person Households | 883 (31.7%) | 97 (3.5%) |
| 3-Person Households | 499 (17.9%) | 0 (0.0%) |
| 4-Person Households | 140 (5.0%) | 0 (0.0%) |
| 5-Person Households | 97 (3.5%) | 0 (0.0%) |
| 6-Person Households | 44 (1.6%) | 0 (0.0%) |
| 7+ Person Households | 0 (0.0%) | 0 (0.0%) |
| Total | 1,663 (59.7%) | 1,122 (40.3%) |
Female Fertility in Hancock County
Fertility by Age in Hancock County
| Age Bracket | Women with Births | Births / 1,000 Women |
| 15 to 19 years | 0 (0.0%) | 0.0 |
| 20 to 34 years | 0 (0.0%) | 0.0 |
| 35 to 50 years | 0 (0.0%) | 0.0 |
| Total | 0 (0.0%) | 0.0 |
Fertility by Age by Marriage Status in Hancock County
| Age Bracket | Married | Unmarried |
| 15 to 19 years | 0 (0.0%) | 0 (0.0%) |
| 20 to 34 years | 0 (0.0%) | 0 (0.0%) |
| 35 to 50 years | 0 (0.0%) | 0 (0.0%) |
| Total | 0 (0.0%) | 0 (0.0%) |
Fertility by Education in Hancock County
| Educational Attainment | Women with Births | Births / 1,000 Women |
| Less than High School | 0 (0.0%) | 0.0 |
| High School Diploma | 0 (0.0%) | 0.0 |
| College or Associate's Degree | 0 (0.0%) | 0.0 |
| Bachelor's Degree | 0 (0.0%) | 0.0 |
| Graduate Degree | 0 (0.0%) | 0.0 |
| Total | 0 (0.0%) | 0.0 |
Fertility by Education by Marriage Status in Hancock County
| Educational Attainment | Married | Unmarried |
| Less than High School | 0 (0.0%) | 0 (0.0%) |
| High School Diploma | 0 (0.0%) | 0 (0.0%) |
| College or Associate's Degree | 0 (0.0%) | 0 (0.0%) |
| Bachelor's Degree | 0 (0.0%) | 0 (0.0%) |
| Graduate Degree | 0 (0.0%) | 0 (0.0%) |
| Total | 0 (0.0%) | 0 (0.0%) |
Employment Characteristics in Hancock County
Employment by Class of Employer in Hancock County
Among the 2,445 employed individuals in Hancock County, private company employees (1,460 | 59.7%), state government employees (391 | 16.0%), and local government employees (185 | 7.6%) make up the most common classes of employment.
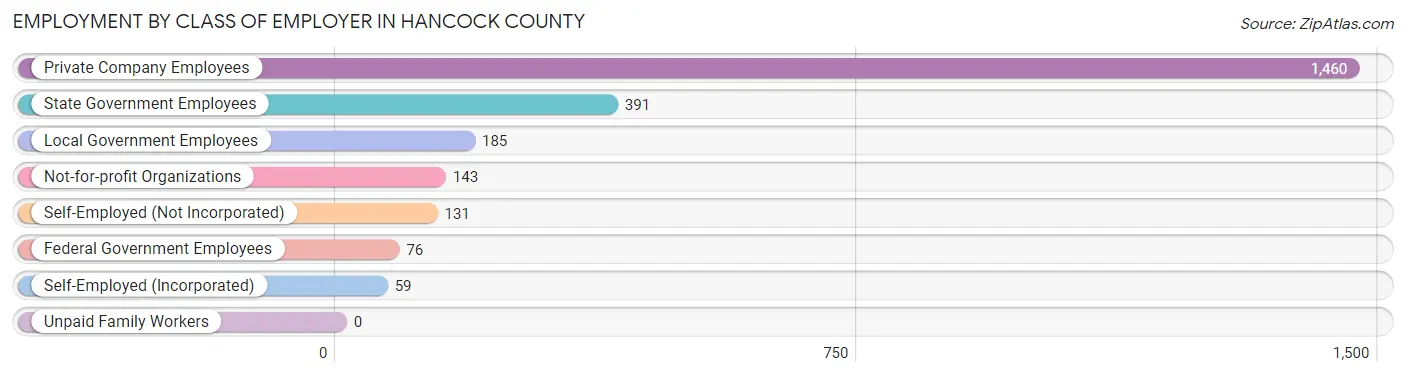
| Employer Class | # Employees | % Employees |
| Private Company Employees | 1,460 | 59.7% |
| Self-Employed (Incorporated) | 59 | 2.4% |
| Self-Employed (Not Incorporated) | 131 | 5.4% |
| Not-for-profit Organizations | 143 | 5.9% |
| Local Government Employees | 185 | 7.6% |
| State Government Employees | 391 | 16.0% |
| Federal Government Employees | 76 | 3.1% |
| Unpaid Family Workers | 0 | 0.0% |
| Total | 2,445 | 100.0% |
Employment Status by Age in Hancock County
According to the labor force statistics for Hancock County, out of the total population over 16 years of age (7,580), 35.6% or 2,698 individuals are in the labor force, with 6.2% or 167 of them unemployed. The age group with the highest labor force participation rate is 30 to 34 years, with 50.3% or 292 individuals in the labor force. Within the labor force, the 16 to 19 years age range has the highest percentage of unemployed individuals, with 26.7% or 4 of them being unemployed.
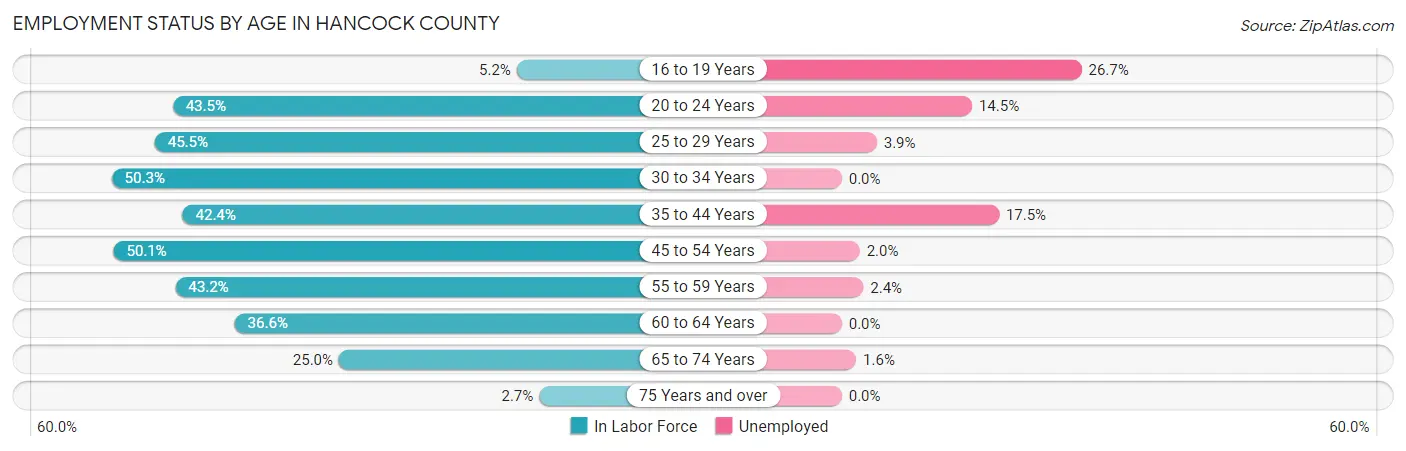
| Age Bracket | In Labor Force | Unemployed |
| 16 to 19 Years | 15 (5.2%) | 4 (26.7%) |
| 20 to 24 Years | 303 (43.5%) | 44 (14.5%) |
| 25 to 29 Years | 206 (45.5%) | 8 (3.9%) |
| 30 to 34 Years | 292 (50.3%) | 0 (0.0%) |
| 35 to 44 Years | 498 (42.4%) | 87 (17.5%) |
| 45 to 54 Years | 500 (50.1%) | 10 (2.0%) |
| 55 to 59 Years | 416 (43.2%) | 10 (2.4%) |
| 60 to 64 Years | 133 (36.6%) | 0 (0.0%) |
| 65 to 74 Years | 313 (25.0%) | 5 (1.6%) |
| 75 Years and over | 22 (2.7%) | 0 (0.0%) |
| Total | 2,698 (35.6%) | 167 (6.2%) |
Employment Status by Educational Attainment in Hancock County
According to labor force statistics for Hancock County, 45.1% of individuals (2,044) out of the total population between 25 and 64 years of age (4,532) are in the labor force, with 5.6% or 114 of them being unemployed. The group with the highest labor force participation rate are those with the educational attainment of bachelor's degree or higher, with 64.7% or 209 individuals in the labor force. Within the labor force, individuals with high school diploma education have the highest percentage of unemployment, with 12.0% or 97 of them being unemployed.
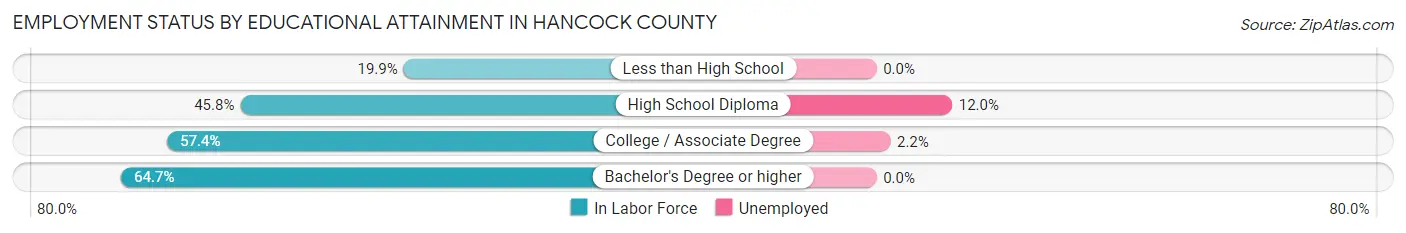
| Educational Attainment | In Labor Force | Unemployed |
| Less than High School | 199 (19.9%) | 0 (0.0%) |
| High School Diploma | 808 (45.8%) | 212 (12.0%) |
| College / Associate Degree | 829 (57.4%) | 32 (2.2%) |
| Bachelor's Degree or higher | 209 (64.7%) | 0 (0.0%) |
| Total | 2,044 (45.1%) | 254 (5.6%) |
Employment Occupations by Sex in Hancock County
Management, Business, Science and Arts Occupations
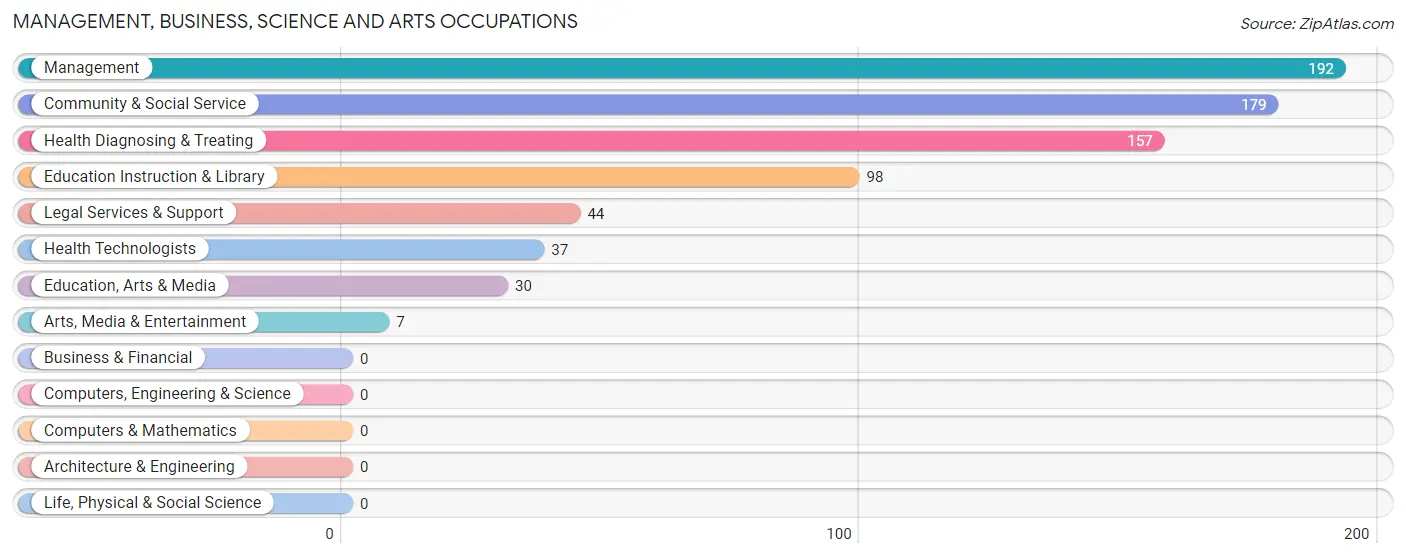
The most common Management, Business, Science and Arts occupations in Hancock County are Management (192 | 7.6%), Community & Social Service (179 | 7.1%), Health Diagnosing & Treating (157 | 6.2%), Education Instruction & Library (98 | 3.9%), and Legal Services & Support (44 | 1.7%).
Management, Business, Science and Arts Occupations by Sex
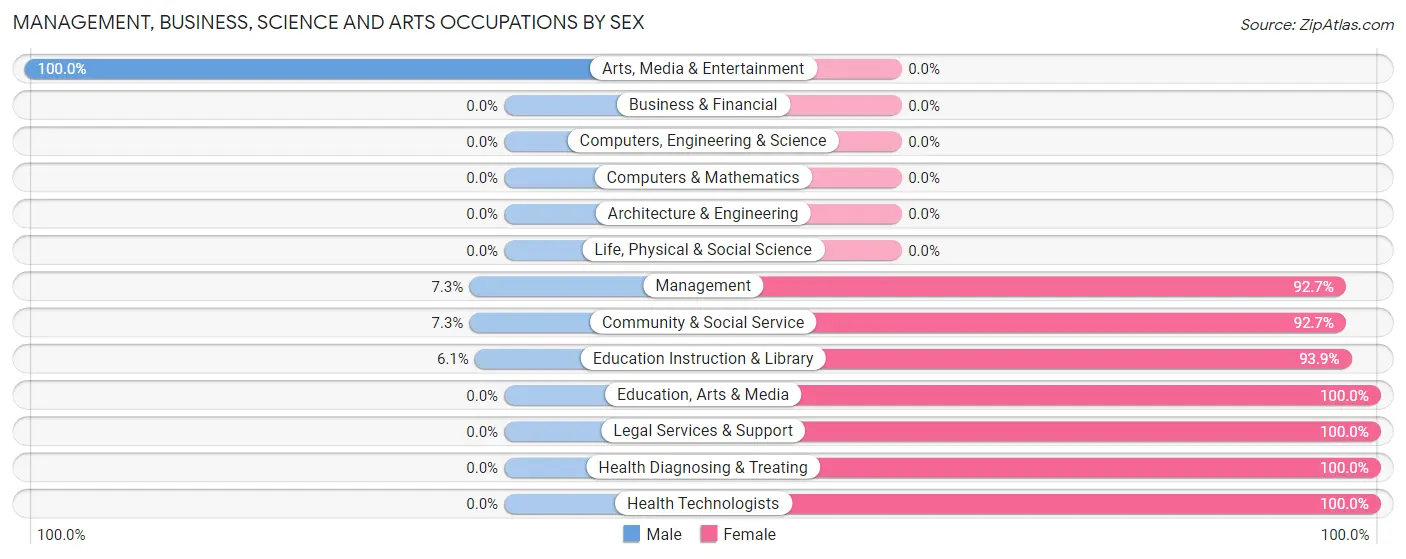
Within the Management, Business, Science and Arts occupations in Hancock County, the most male-oriented occupations are Arts, Media & Entertainment (100.0%), Management (7.3%), and Community & Social Service (7.3%), while the most female-oriented occupations are Education, Arts & Media (100.0%), Legal Services & Support (100.0%), and Health Diagnosing & Treating (100.0%).
| Occupation | Male | Female |
| Management | 14 (7.3%) | 178 (92.7%) |
| Business & Financial | 0 (0.0%) | 0 (0.0%) |
| Computers, Engineering & Science | 0 (0.0%) | 0 (0.0%) |
| Computers & Mathematics | 0 (0.0%) | 0 (0.0%) |
| Architecture & Engineering | 0 (0.0%) | 0 (0.0%) |
| Life, Physical & Social Science | 0 (0.0%) | 0 (0.0%) |
| Community & Social Service | 13 (7.3%) | 166 (92.7%) |
| Education, Arts & Media | 0 (0.0%) | 30 (100.0%) |
| Legal Services & Support | 0 (0.0%) | 44 (100.0%) |
| Education Instruction & Library | 6 (6.1%) | 92 (93.9%) |
| Arts, Media & Entertainment | 7 (100.0%) | 0 (0.0%) |
| Health Diagnosing & Treating | 0 (0.0%) | 157 (100.0%) |
| Health Technologists | 0 (0.0%) | 37 (100.0%) |
| Total (Category) | 27 (5.1%) | 501 (94.9%) |
| Total (Overall) | 1,133 (44.8%) | 1,397 (55.2%) |
Services Occupations
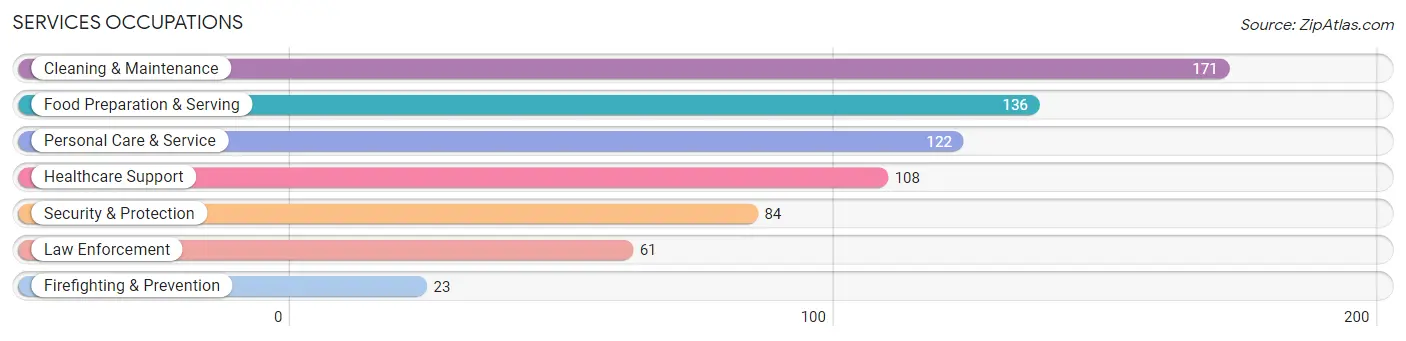
The most common Services occupations in Hancock County are Cleaning & Maintenance (171 | 6.8%), Food Preparation & Serving (136 | 5.4%), Personal Care & Service (122 | 4.8%), Healthcare Support (108 | 4.3%), and Security & Protection (84 | 3.3%).
Services Occupations by Sex
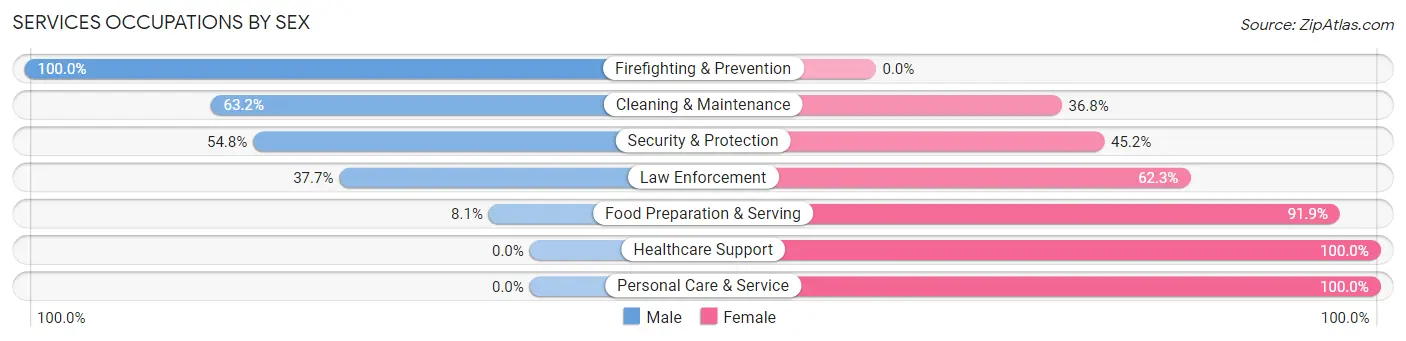
Within the Services occupations in Hancock County, the most male-oriented occupations are Firefighting & Prevention (100.0%), Cleaning & Maintenance (63.2%), and Security & Protection (54.8%), while the most female-oriented occupations are Healthcare Support (100.0%), Personal Care & Service (100.0%), and Food Preparation & Serving (91.9%).
| Occupation | Male | Female |
| Healthcare Support | 0 (0.0%) | 108 (100.0%) |
| Security & Protection | 46 (54.8%) | 38 (45.2%) |
| Firefighting & Prevention | 23 (100.0%) | 0 (0.0%) |
| Law Enforcement | 23 (37.7%) | 38 (62.3%) |
| Food Preparation & Serving | 11 (8.1%) | 125 (91.9%) |
| Cleaning & Maintenance | 108 (63.2%) | 63 (36.8%) |
| Personal Care & Service | 0 (0.0%) | 122 (100.0%) |
| Total (Category) | 165 (26.6%) | 456 (73.4%) |
| Total (Overall) | 1,133 (44.8%) | 1,397 (55.2%) |
Sales and Office Occupations
The most common Sales and Office occupations in Hancock County are Office & Administration (378 | 14.9%), and Sales & Related (133 | 5.3%).
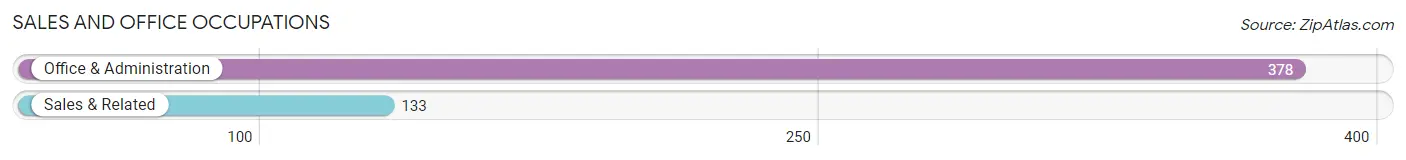
Sales and Office Occupations by Sex
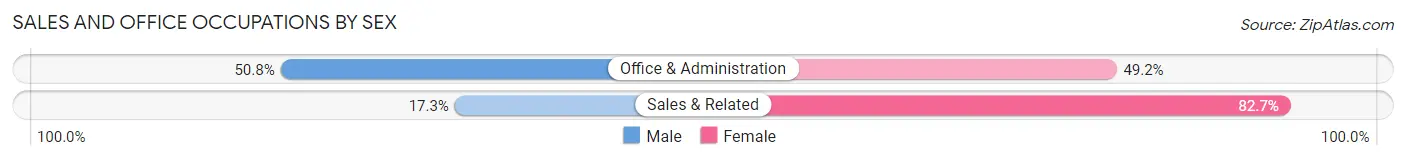
| Occupation | Male | Female |
| Sales & Related | 23 (17.3%) | 110 (82.7%) |
| Office & Administration | 192 (50.8%) | 186 (49.2%) |
| Total (Category) | 215 (42.1%) | 296 (57.9%) |
| Total (Overall) | 1,133 (44.8%) | 1,397 (55.2%) |
Natural Resources, Construction and Maintenance Occupations
The most common Natural Resources, Construction and Maintenance occupations in Hancock County are Construction & Extraction (153 | 6.0%), Installation, Maintenance & Repair (47 | 1.9%), and Farming, Fishing & Forestry (8 | 0.3%).
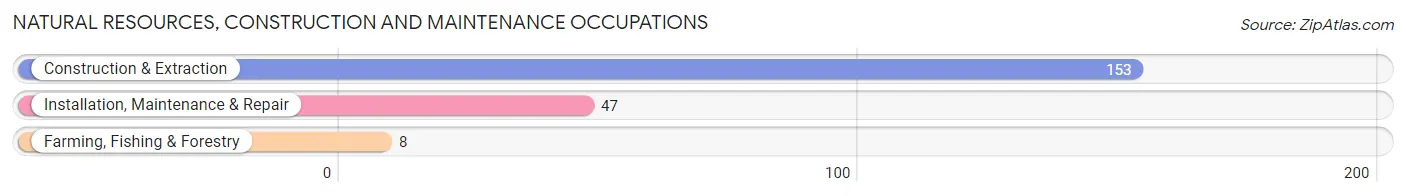
Natural Resources, Construction and Maintenance Occupations by Sex
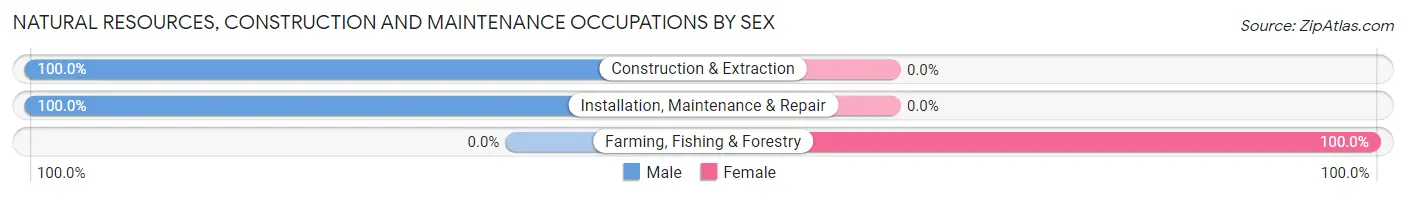
| Occupation | Male | Female |
| Farming, Fishing & Forestry | 0 (0.0%) | 8 (100.0%) |
| Construction & Extraction | 153 (100.0%) | 0 (0.0%) |
| Installation, Maintenance & Repair | 47 (100.0%) | 0 (0.0%) |
| Total (Category) | 200 (96.2%) | 8 (3.8%) |
| Total (Overall) | 1,133 (44.8%) | 1,397 (55.2%) |
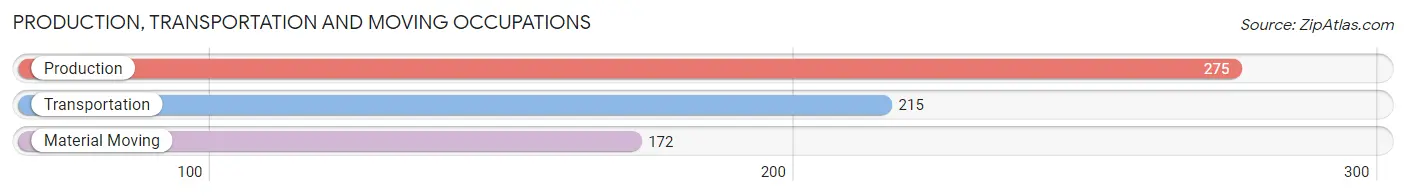
Production, Transportation and Moving Occupations
The most common Production, Transportation and Moving occupations in Hancock County are Production (275 | 10.9%), Transportation (215 | 8.5%), and Material Moving (172 | 6.8%).
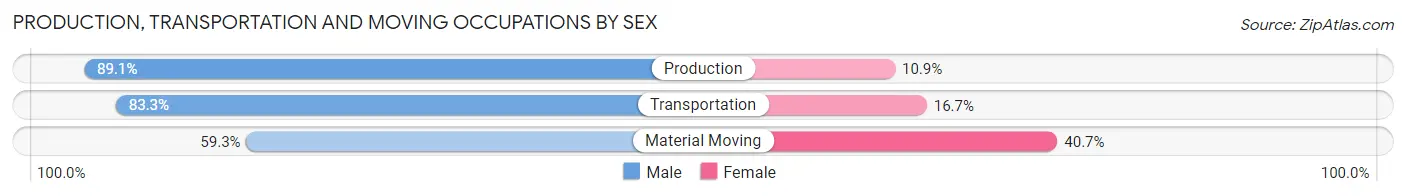
Production, Transportation and Moving Occupations by Sex
| Occupation | Male | Female |
| Production | 245 (89.1%) | 30 (10.9%) |
| Transportation | 179 (83.3%) | 36 (16.7%) |
| Material Moving | 102 (59.3%) | 70 (40.7%) |
| Total (Category) | 526 (79.5%) | 136 (20.5%) |
| Total (Overall) | 1,133 (44.8%) | 1,397 (55.2%) |
Employment Industries by Sex in Hancock County
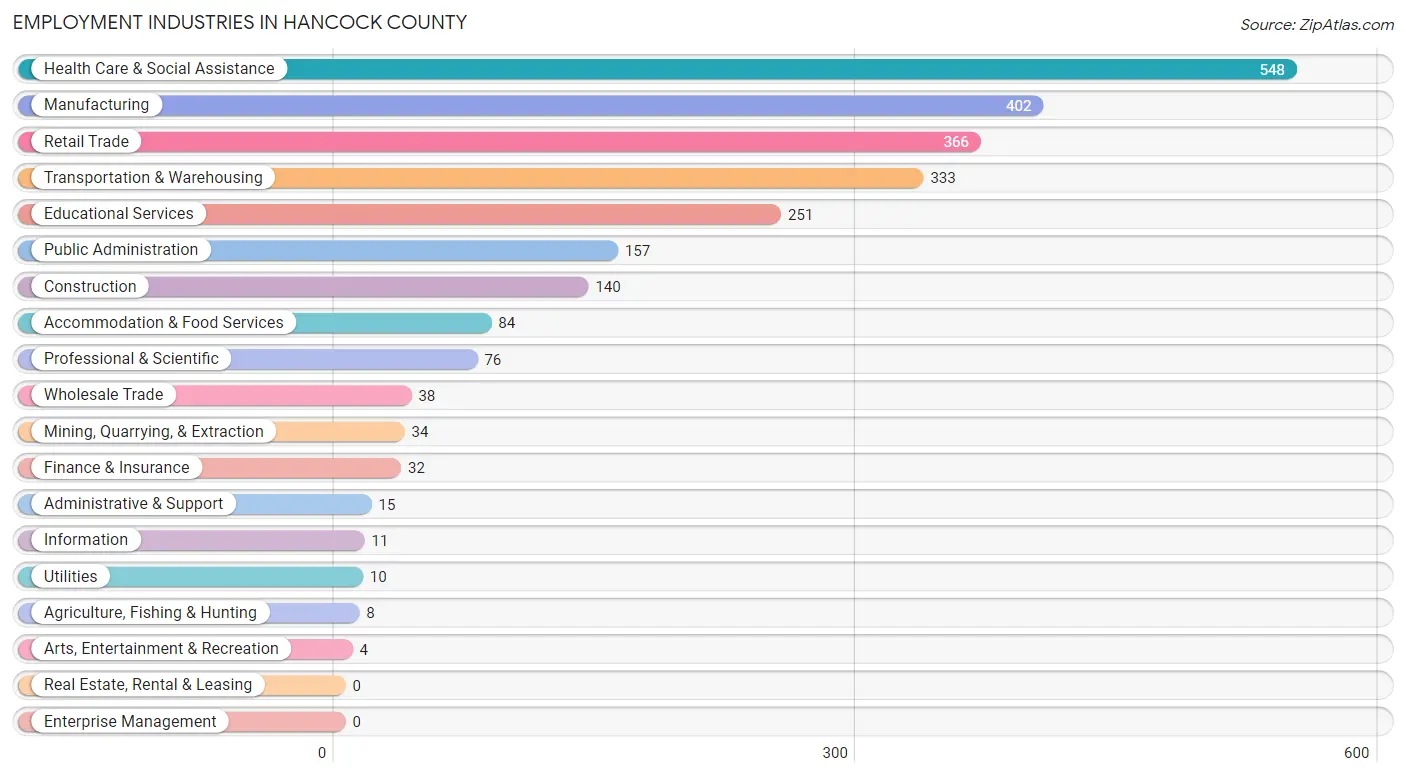
Employment Industries in Hancock County
The major employment industries in Hancock County include Health Care & Social Assistance (548 | 21.7%), Manufacturing (402 | 15.9%), Retail Trade (366 | 14.5%), Transportation & Warehousing (333 | 13.2%), and Educational Services (251 | 9.9%).
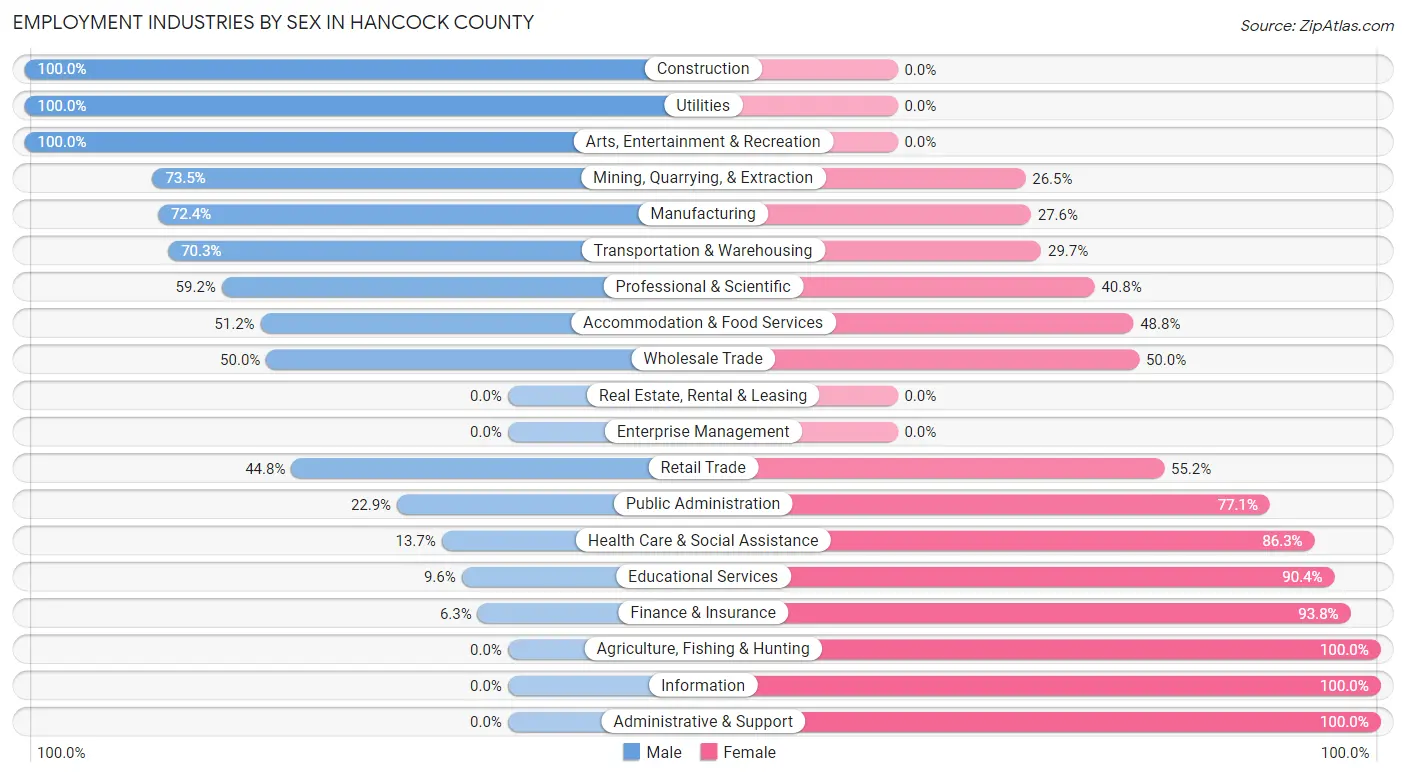
Employment Industries by Sex in Hancock County
The Hancock County industries that see more men than women are Construction (100.0%), Utilities (100.0%), and Arts, Entertainment & Recreation (100.0%), whereas the industries that tend to have a higher number of women are Agriculture, Fishing & Hunting (100.0%), Information (100.0%), and Administrative & Support (100.0%).
| Industry | Male | Female |
| Agriculture, Fishing & Hunting | 0 (0.0%) | 8 (100.0%) |
| Mining, Quarrying, & Extraction | 25 (73.5%) | 9 (26.5%) |
| Construction | 140 (100.0%) | 0 (0.0%) |
| Manufacturing | 291 (72.4%) | 111 (27.6%) |
| Wholesale Trade | 19 (50.0%) | 19 (50.0%) |
| Retail Trade | 164 (44.8%) | 202 (55.2%) |
| Transportation & Warehousing | 234 (70.3%) | 99 (29.7%) |
| Utilities | 10 (100.0%) | 0 (0.0%) |
| Information | 0 (0.0%) | 11 (100.0%) |
| Finance & Insurance | 2 (6.2%) | 30 (93.8%) |
| Real Estate, Rental & Leasing | 0 (0.0%) | 0 (0.0%) |
| Professional & Scientific | 45 (59.2%) | 31 (40.8%) |
| Enterprise Management | 0 (0.0%) | 0 (0.0%) |
| Administrative & Support | 0 (0.0%) | 15 (100.0%) |
| Educational Services | 24 (9.6%) | 227 (90.4%) |
| Health Care & Social Assistance | 75 (13.7%) | 473 (86.3%) |
| Arts, Entertainment & Recreation | 4 (100.0%) | 0 (0.0%) |
| Accommodation & Food Services | 43 (51.2%) | 41 (48.8%) |
| Public Administration | 36 (22.9%) | 121 (77.1%) |
| Total | 1,133 (44.8%) | 1,397 (55.2%) |
Education in Hancock County
School Enrollment in Hancock County
The most common levels of schooling among the 1,384 students in Hancock County are elementary school (402 | 29.0%), high school (309 | 22.3%), and college / undergraduate (277 | 20.0%).
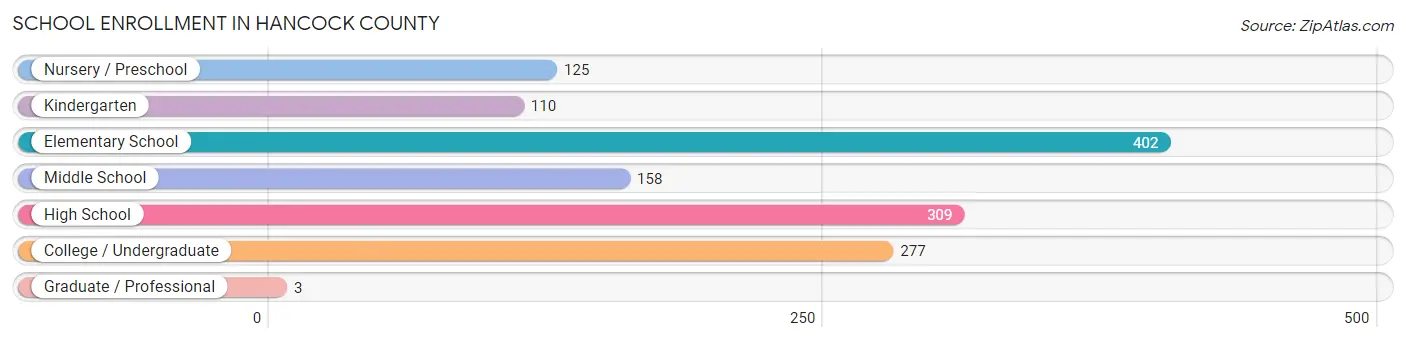
| School Level | # Students | % Students |
| Nursery / Preschool | 125 | 9.0% |
| Kindergarten | 110 | 8.0% |
| Elementary School | 402 | 29.0% |
| Middle School | 158 | 11.4% |
| High School | 309 | 22.3% |
| College / Undergraduate | 277 | 20.0% |
| Graduate / Professional | 3 | 0.2% |
| Total | 1,384 | 100.0% |
School Enrollment by Age by Funding Source in Hancock County
Out of a total of 1,384 students who are enrolled in schools in Hancock County, 84 (6.1%) attend a private institution, while the remaining 1,300 (93.9%) are enrolled in public schools. The age group of 18 to 19 year olds has the highest likelihood of being enrolled in private schools, with 28 (82.4% in the age bracket) enrolled. Conversely, the age group of 3 to 4 year olds has the lowest likelihood of being enrolled in a private school, with 125 (100.0% in the age bracket) attending a public institution.
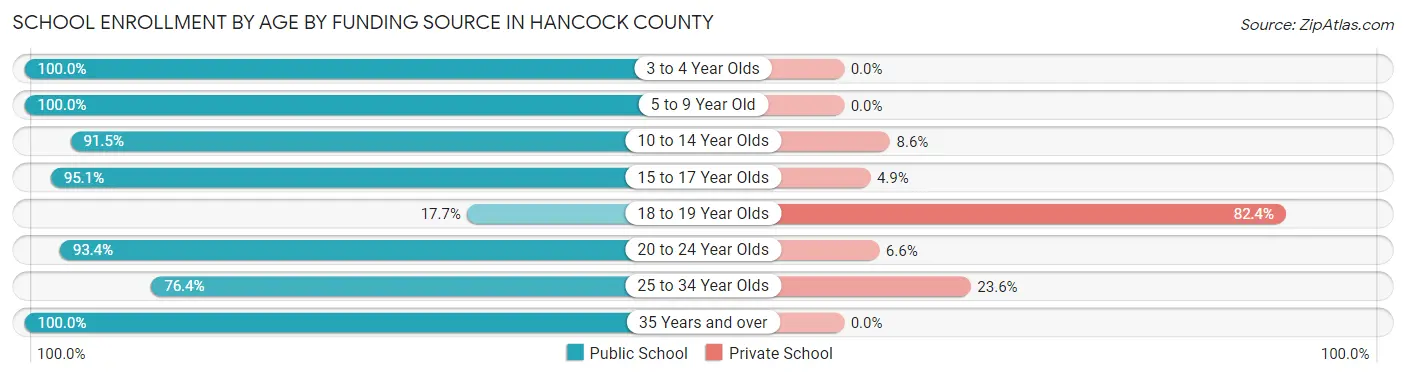
| Age Bracket | Public School | Private School |
| 3 to 4 Year Olds | 125 (100.0%) | 0 (0.0%) |
| 5 to 9 Year Old | 486 (100.0%) | 0 (0.0%) |
| 10 to 14 Year Olds | 214 (91.4%) | 20 (8.6%) |
| 15 to 17 Year Olds | 214 (95.1%) | 11 (4.9%) |
| 18 to 19 Year Olds | 6 (17.6%) | 28 (82.4%) |
| 20 to 24 Year Olds | 114 (93.4%) | 8 (6.6%) |
| 25 to 34 Year Olds | 55 (76.4%) | 17 (23.6%) |
| 35 Years and over | 86 (100.0%) | 0 (0.0%) |
| Total | 1,300 (93.9%) | 84 (6.1%) |
Educational Attainment by Field of Study in Hancock County
Business (175 | 27.6%), education (111 | 17.5%), bio, nature & agricultural (85 | 13.4%), social sciences (48 | 7.6%), and engineering (47 | 7.4%) are the most common fields of study among 635 individuals in Hancock County who have obtained a bachelor's degree or higher.
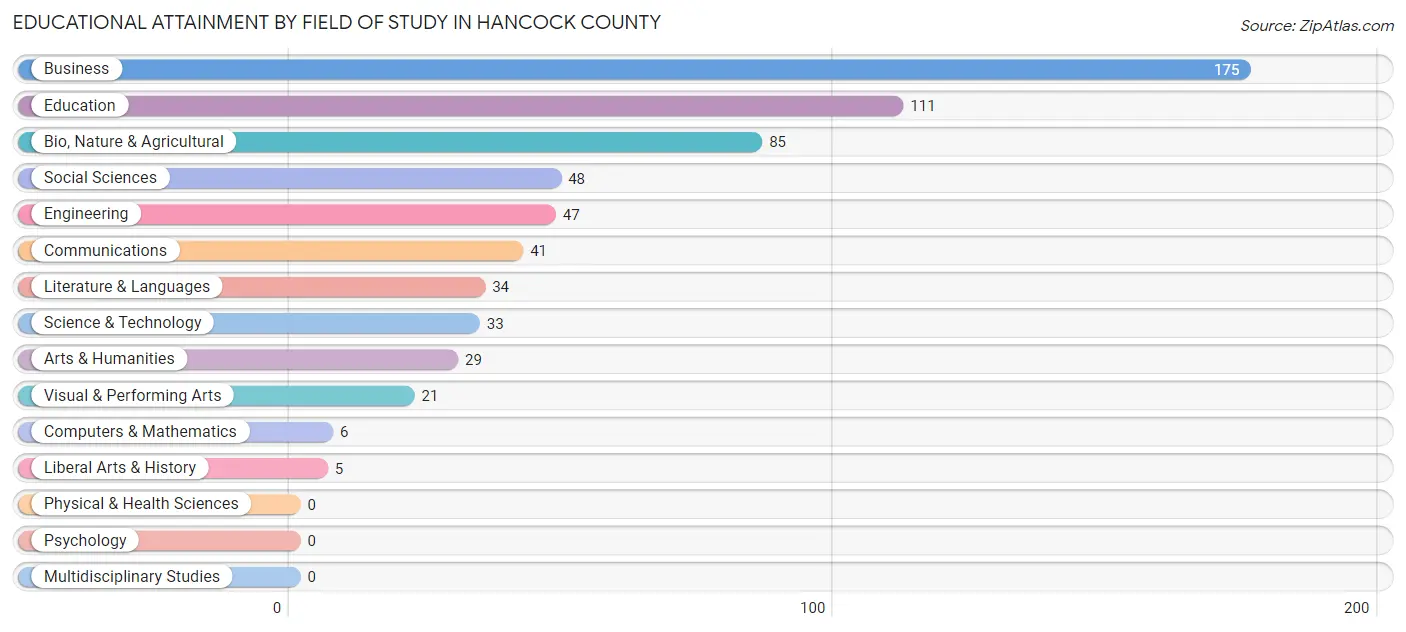
| Field of Study | # Graduates | % Graduates |
| Computers & Mathematics | 6 | 0.9% |
| Bio, Nature & Agricultural | 85 | 13.4% |
| Physical & Health Sciences | 0 | 0.0% |
| Psychology | 0 | 0.0% |
| Social Sciences | 48 | 7.6% |
| Engineering | 47 | 7.4% |
| Multidisciplinary Studies | 0 | 0.0% |
| Science & Technology | 33 | 5.2% |
| Business | 175 | 27.6% |
| Education | 111 | 17.5% |
| Literature & Languages | 34 | 5.3% |
| Liberal Arts & History | 5 | 0.8% |
| Visual & Performing Arts | 21 | 3.3% |
| Communications | 41 | 6.5% |
| Arts & Humanities | 29 | 4.6% |
| Total | 635 | 100.0% |
Transportation & Commute in Hancock County
Vehicle Availability by Sex in Hancock County
The most prevalent vehicle ownership categories in Hancock County are males with 3 vehicles (313, accounting for 28.4%) and females with 3 vehicles (291, making up 23.3%).
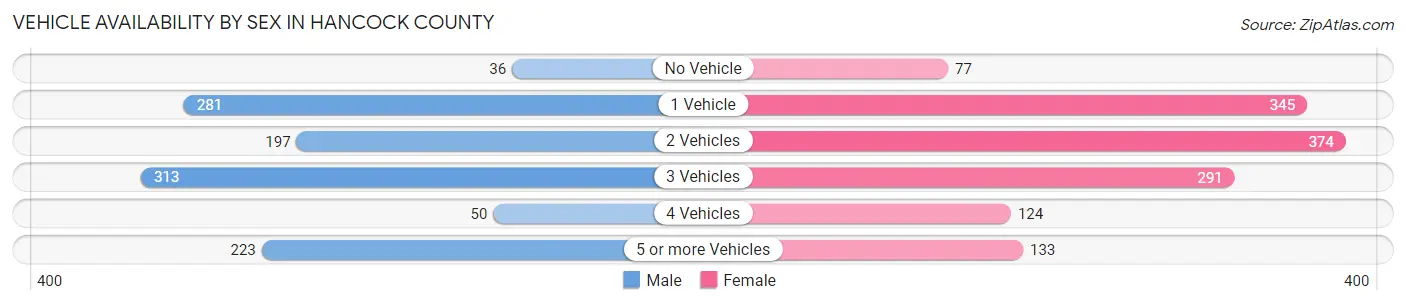
| Vehicles Available | Male | Female |
| No Vehicle | 36 (3.3%) | 77 (5.7%) |
| 1 Vehicle | 281 (25.6%) | 345 (25.7%) |
| 2 Vehicles | 197 (17.9%) | 374 (27.8%) |
| 3 Vehicles | 313 (28.4%) | 291 (21.6%) |
| 4 Vehicles | 50 (4.5%) | 124 (9.2%) |
| 5 or more Vehicles | 223 (20.3%) | 133 (9.9%) |
| Total | 1,100 (100.0%) | 1,344 (100.0%) |
Commute Time in Hancock County
The most frequently occuring commute durations in Hancock County are 5 to 9 minutes (362 commuters, 15.5%), 30 to 34 minutes (348 commuters, 14.9%), and 15 to 19 minutes (311 commuters, 13.4%).
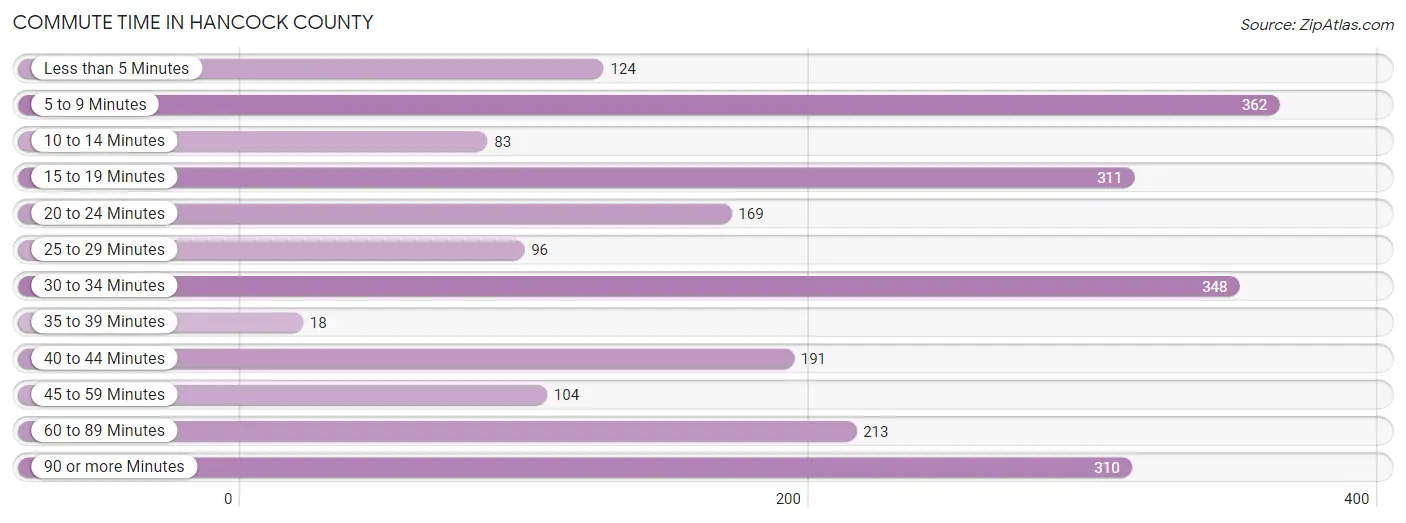
| Commute Time | # Commuters | % Commuters |
| Less than 5 Minutes | 124 | 5.3% |
| 5 to 9 Minutes | 362 | 15.5% |
| 10 to 14 Minutes | 83 | 3.6% |
| 15 to 19 Minutes | 311 | 13.4% |
| 20 to 24 Minutes | 169 | 7.3% |
| 25 to 29 Minutes | 96 | 4.1% |
| 30 to 34 Minutes | 348 | 14.9% |
| 35 to 39 Minutes | 18 | 0.8% |
| 40 to 44 Minutes | 191 | 8.2% |
| 45 to 59 Minutes | 104 | 4.5% |
| 60 to 89 Minutes | 213 | 9.1% |
| 90 or more Minutes | 310 | 13.3% |
Commute Time by Sex in Hancock County
The most common commute times in Hancock County are 90 or more minutes (230 commuters, 22.4%) for males and 5 to 9 minutes (255 commuters, 19.6%) for females.
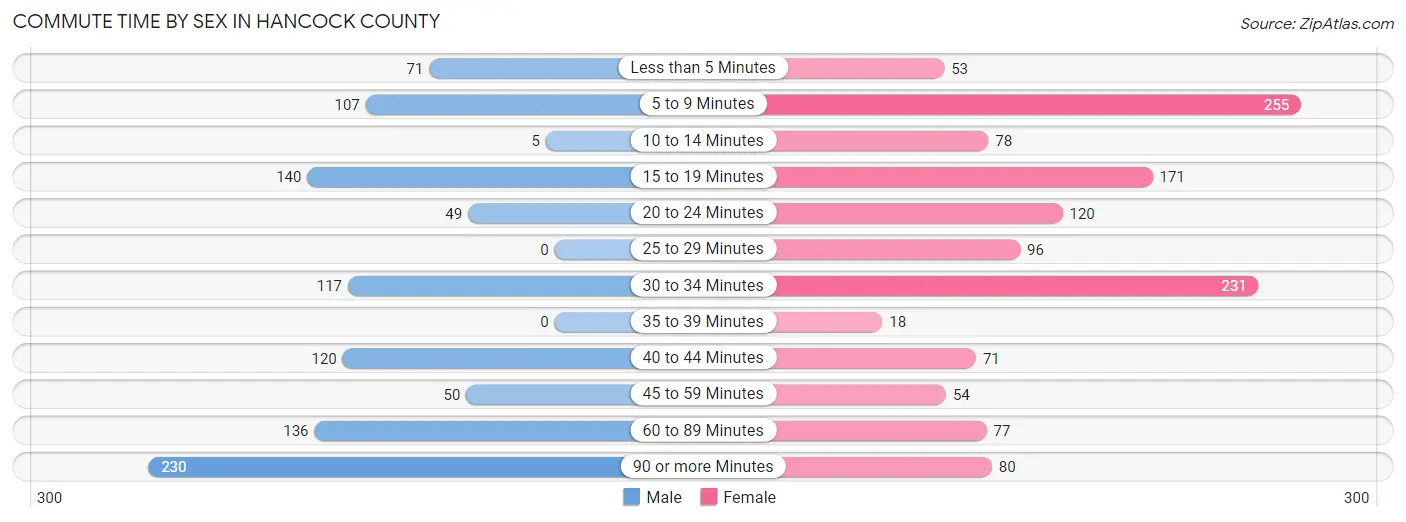
| Commute Time | Male | Female |
| Less than 5 Minutes | 71 (6.9%) | 53 (4.1%) |
| 5 to 9 Minutes | 107 (10.4%) | 255 (19.6%) |
| 10 to 14 Minutes | 5 (0.5%) | 78 (6.0%) |
| 15 to 19 Minutes | 140 (13.7%) | 171 (13.1%) |
| 20 to 24 Minutes | 49 (4.8%) | 120 (9.2%) |
| 25 to 29 Minutes | 0 (0.0%) | 96 (7.4%) |
| 30 to 34 Minutes | 117 (11.4%) | 231 (17.7%) |
| 35 to 39 Minutes | 0 (0.0%) | 18 (1.4%) |
| 40 to 44 Minutes | 120 (11.7%) | 71 (5.4%) |
| 45 to 59 Minutes | 50 (4.9%) | 54 (4.1%) |
| 60 to 89 Minutes | 136 (13.3%) | 77 (5.9%) |
| 90 or more Minutes | 230 (22.4%) | 80 (6.1%) |
Time of Departure to Work by Sex in Hancock County
The most frequent times of departure to work in Hancock County are 10:00 AM to 10:59 AM (154, 15.0%) for males and 8:00 AM to 8:29 AM (251, 19.3%) for females.
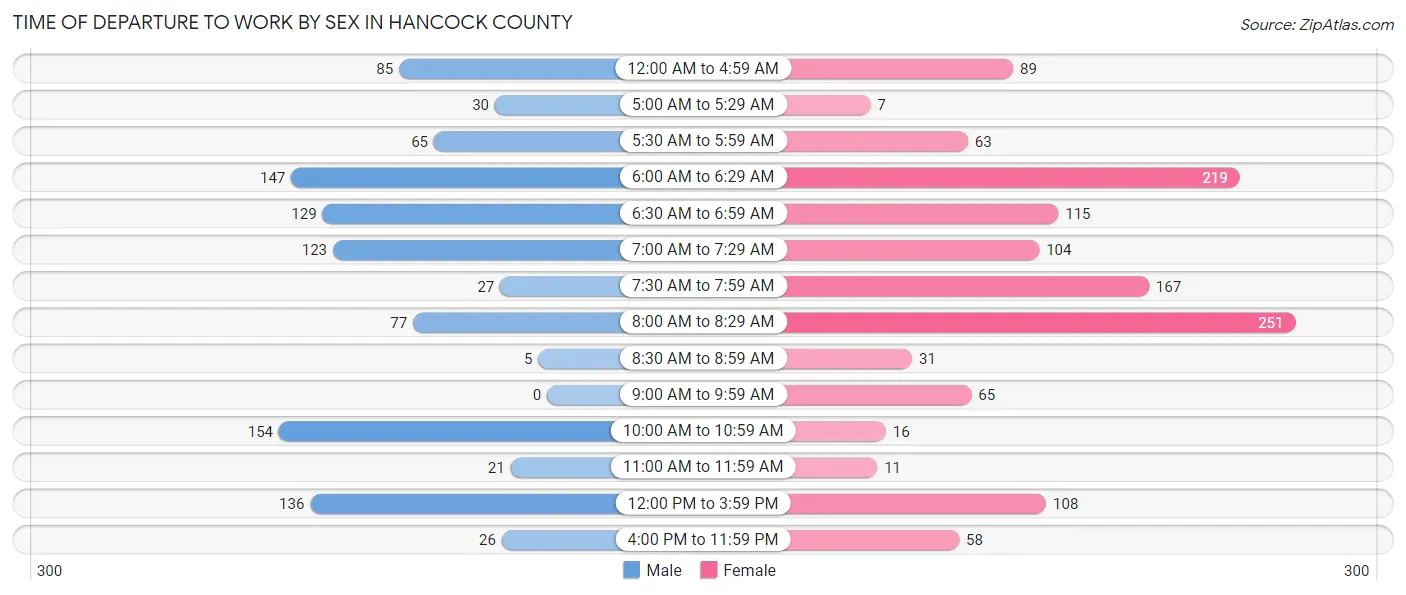
| Time of Departure | Male | Female |
| 12:00 AM to 4:59 AM | 85 (8.3%) | 89 (6.8%) |
| 5:00 AM to 5:29 AM | 30 (2.9%) | 7 (0.5%) |
| 5:30 AM to 5:59 AM | 65 (6.3%) | 63 (4.8%) |
| 6:00 AM to 6:29 AM | 147 (14.3%) | 219 (16.8%) |
| 6:30 AM to 6:59 AM | 129 (12.6%) | 115 (8.8%) |
| 7:00 AM to 7:29 AM | 123 (12.0%) | 104 (8.0%) |
| 7:30 AM to 7:59 AM | 27 (2.6%) | 167 (12.8%) |
| 8:00 AM to 8:29 AM | 77 (7.5%) | 251 (19.3%) |
| 8:30 AM to 8:59 AM | 5 (0.5%) | 31 (2.4%) |
| 9:00 AM to 9:59 AM | 0 (0.0%) | 65 (5.0%) |
| 10:00 AM to 10:59 AM | 154 (15.0%) | 16 (1.2%) |
| 11:00 AM to 11:59 AM | 21 (2.1%) | 11 (0.8%) |
| 12:00 PM to 3:59 PM | 136 (13.3%) | 108 (8.3%) |
| 4:00 PM to 11:59 PM | 26 (2.5%) | 58 (4.4%) |
| Total | 1,025 (100.0%) | 1,304 (100.0%) |
Housing Occupancy in Hancock County
Occupancy by Ownership in Hancock County
Of the total 2,785 dwellings in Hancock County, owner-occupied units account for 2,093 (75.1%), while renter-occupied units make up 692 (24.8%).
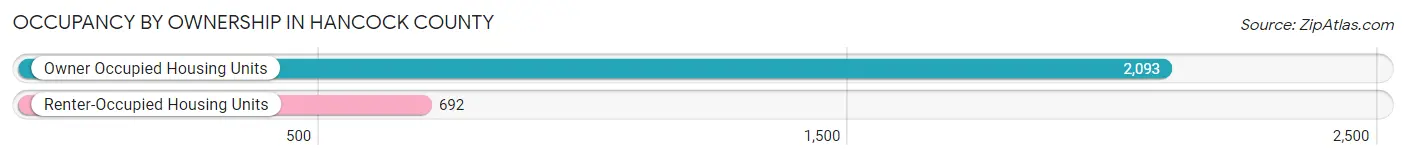
| Occupancy | # Housing Units | % Housing Units |
| Owner Occupied Housing Units | 2,093 | 75.1% |
| Renter-Occupied Housing Units | 692 | 24.8% |
| Total Occupied Housing Units | 2,785 | 100.0% |
Occupancy by Household Size in Hancock County
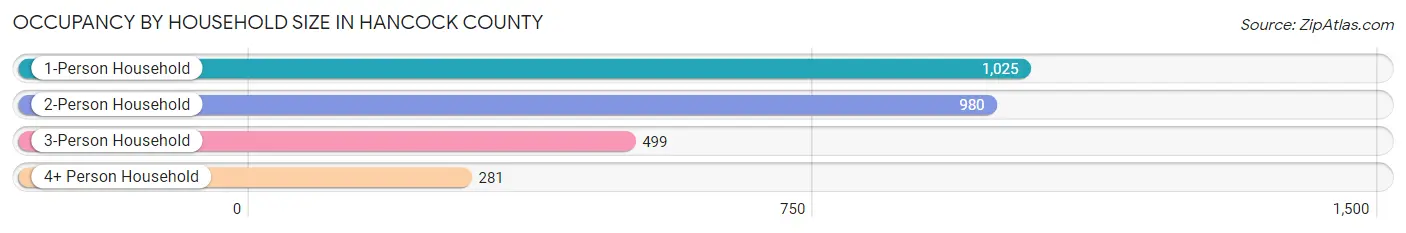
| Household Size | # Housing Units | % Housing Units |
| 1-Person Household | 1,025 | 36.8% |
| 2-Person Household | 980 | 35.2% |
| 3-Person Household | 499 | 17.9% |
| 4+ Person Household | 281 | 10.1% |
| Total Housing Units | 2,785 | 100.0% |
Occupancy by Ownership by Household Size in Hancock County
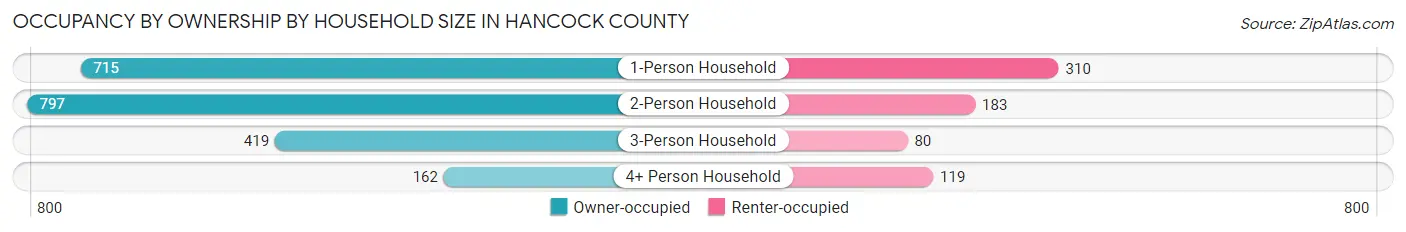
| Household Size | Owner-occupied | Renter-occupied |
| 1-Person Household | 715 (69.8%) | 310 (30.2%) |
| 2-Person Household | 797 (81.3%) | 183 (18.7%) |
| 3-Person Household | 419 (84.0%) | 80 (16.0%) |
| 4+ Person Household | 162 (57.7%) | 119 (42.3%) |
| Total Housing Units | 2,093 (75.1%) | 692 (24.8%) |
Occupancy by Educational Attainment in Hancock County
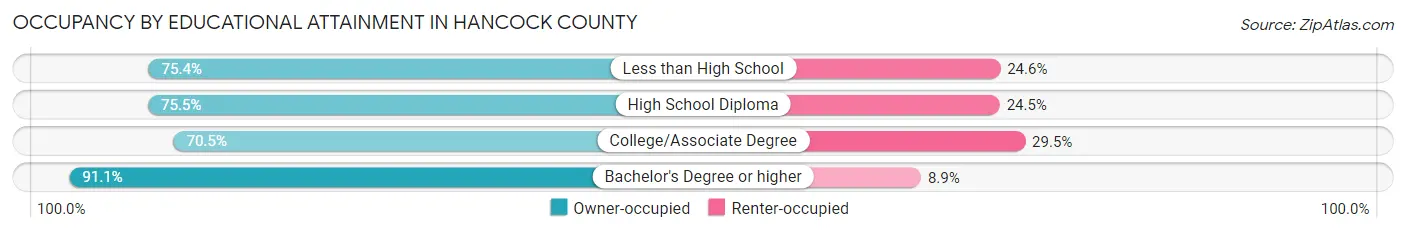
| Household Size | Owner-occupied | Renter-occupied |
| Less than High School | 469 (75.4%) | 153 (24.6%) |
| High School Diploma | 660 (75.5%) | 214 (24.5%) |
| College/Associate Degree | 718 (70.5%) | 301 (29.5%) |
| Bachelor's Degree or higher | 246 (91.1%) | 24 (8.9%) |
Occupancy by Age of Householder in Hancock County
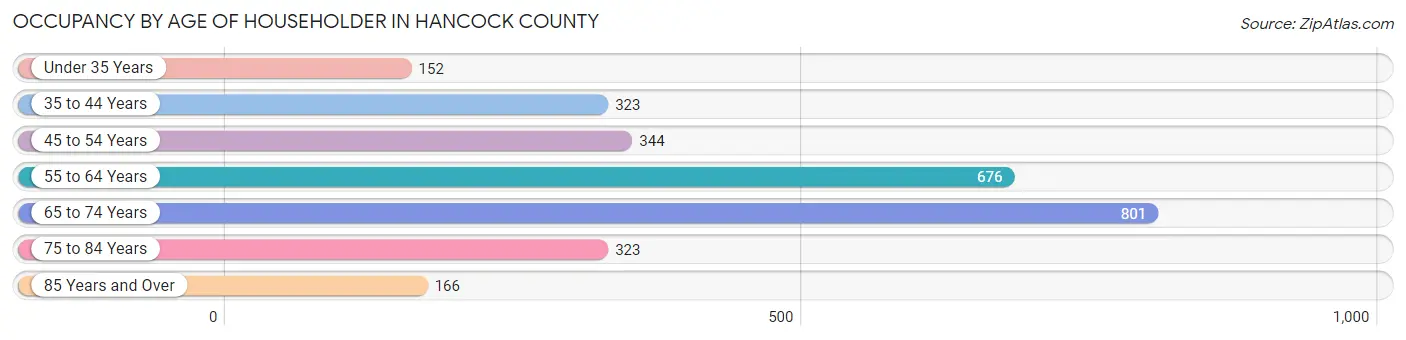
| Age Bracket | # Households | % Households |
| Under 35 Years | 152 | 5.5% |
| 35 to 44 Years | 323 | 11.6% |
| 45 to 54 Years | 344 | 12.3% |
| 55 to 64 Years | 676 | 24.3% |
| 65 to 74 Years | 801 | 28.8% |
| 75 to 84 Years | 323 | 11.6% |
| 85 Years and Over | 166 | 6.0% |
| Total | 2,785 | 100.0% |
Housing Finances in Hancock County
Median Income by Occupancy in Hancock County
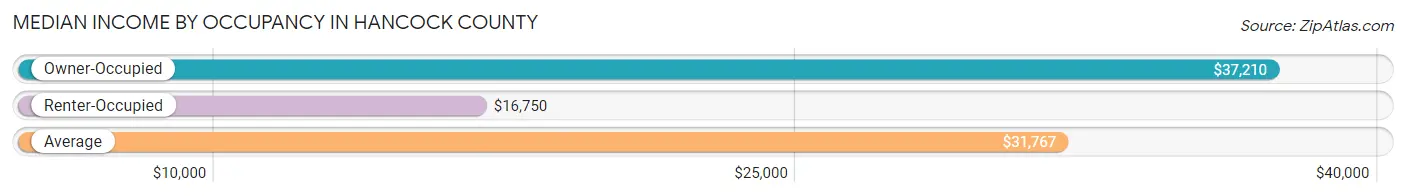
| Occupancy Type | # Households | Median Income |
| Owner-Occupied | 2,093 (75.1%) | $37,210 |
| Renter-Occupied | 692 (24.8%) | $16,750 |
| Average | 2,785 (100.0%) | $31,767 |
Occupancy by Householder Income Bracket in Hancock County
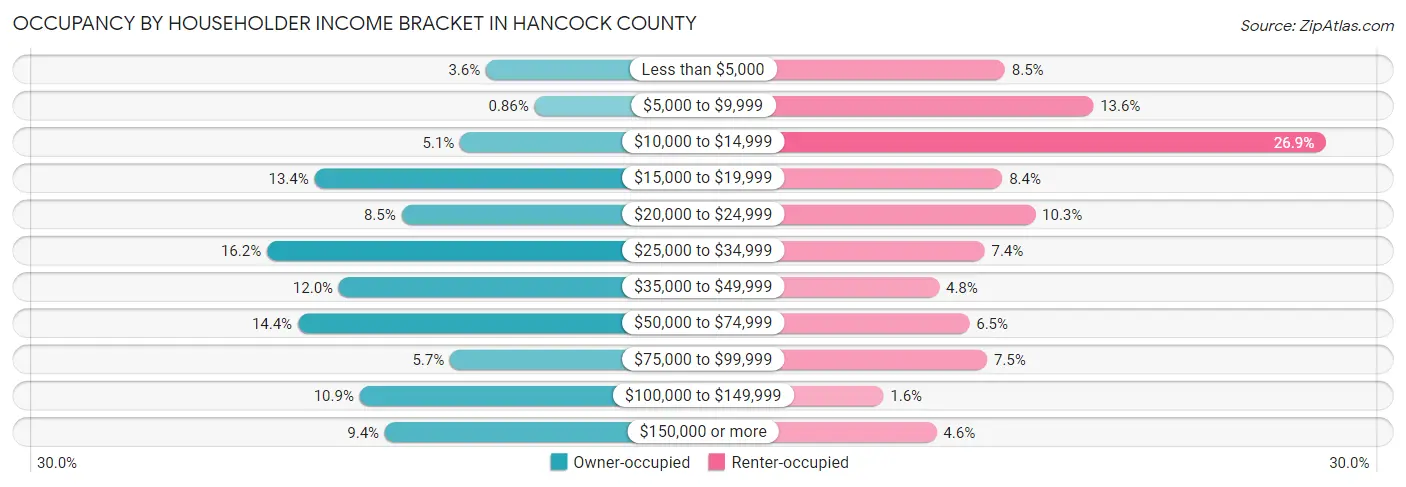
| Income Bracket | Owner-occupied | Renter-occupied |
| Less than $5,000 | 76 (3.6%) | 59 (8.5%) |
| $5,000 to $9,999 | 18 (0.9%) | 94 (13.6%) |
| $10,000 to $14,999 | 107 (5.1%) | 186 (26.9%) |
| $15,000 to $19,999 | 281 (13.4%) | 58 (8.4%) |
| $20,000 to $24,999 | 177 (8.5%) | 71 (10.3%) |
| $25,000 to $34,999 | 338 (16.2%) | 51 (7.4%) |
| $35,000 to $49,999 | 252 (12.0%) | 33 (4.8%) |
| $50,000 to $74,999 | 301 (14.4%) | 45 (6.5%) |
| $75,000 to $99,999 | 119 (5.7%) | 52 (7.5%) |
| $100,000 to $149,999 | 227 (10.8%) | 11 (1.6%) |
| $150,000 or more | 197 (9.4%) | 32 (4.6%) |
| Total | 2,093 (100.0%) | 692 (100.0%) |
Monthly Housing Cost Tiers in Hancock County
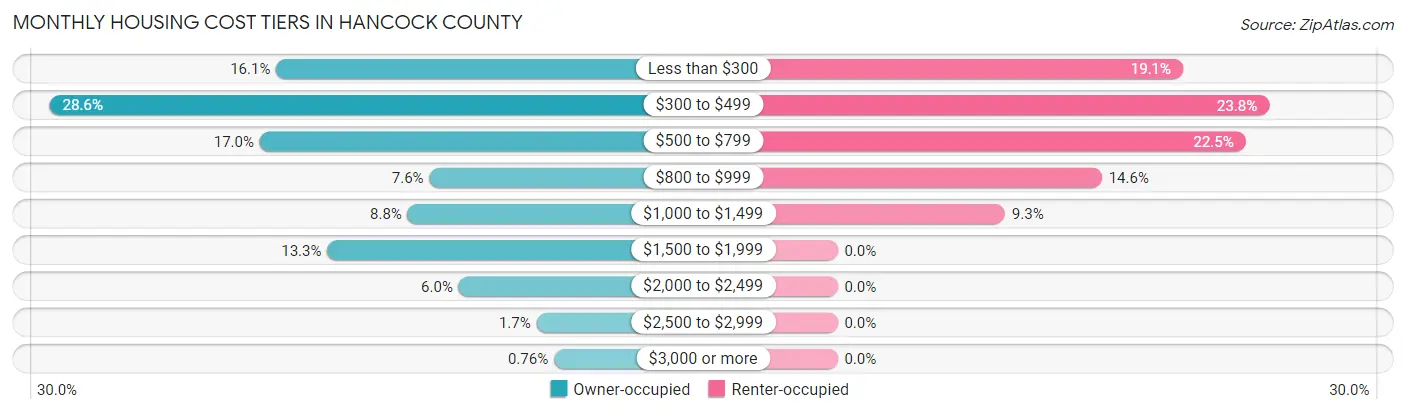
| Monthly Cost | Owner-occupied | Renter-occupied |
| Less than $300 | 337 (16.1%) | 132 (19.1%) |
| $300 to $499 | 599 (28.6%) | 165 (23.8%) |
| $500 to $799 | 356 (17.0%) | 156 (22.5%) |
| $800 to $999 | 160 (7.6%) | 101 (14.6%) |
| $1,000 to $1,499 | 185 (8.8%) | 64 (9.2%) |
| $1,500 to $1,999 | 278 (13.3%) | 0 (0.0%) |
| $2,000 to $2,499 | 126 (6.0%) | 0 (0.0%) |
| $2,500 to $2,999 | 36 (1.7%) | 0 (0.0%) |
| $3,000 or more | 16 (0.8%) | 0 (0.0%) |
| Total | 2,093 (100.0%) | 692 (100.0%) |
Physical Housing Characteristics in Hancock County
Housing Structures in Hancock County
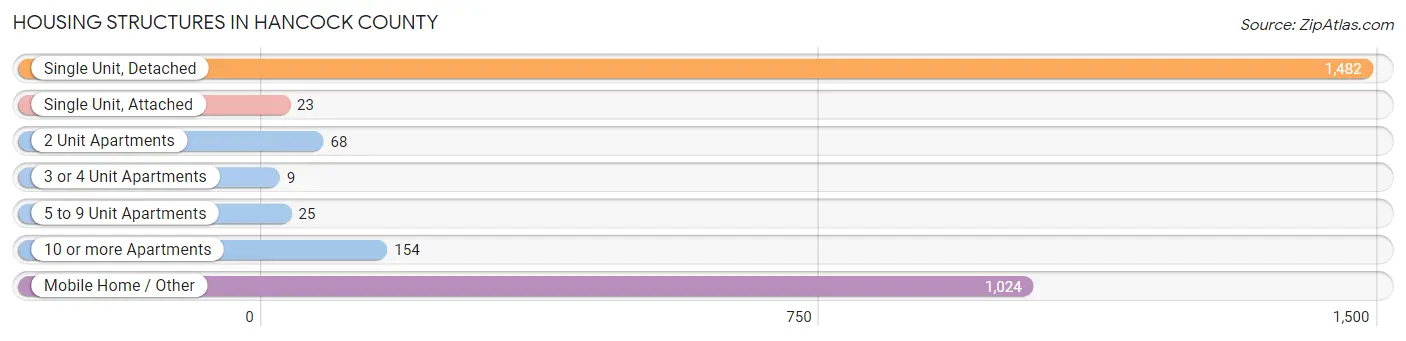
| Structure Type | # Housing Units | % Housing Units |
| Single Unit, Detached | 1,482 | 53.2% |
| Single Unit, Attached | 23 | 0.8% |
| 2 Unit Apartments | 68 | 2.4% |
| 3 or 4 Unit Apartments | 9 | 0.3% |
| 5 to 9 Unit Apartments | 25 | 0.9% |
| 10 or more Apartments | 154 | 5.5% |
| Mobile Home / Other | 1,024 | 36.8% |
| Total | 2,785 | 100.0% |
Housing Structures by Occupancy in Hancock County
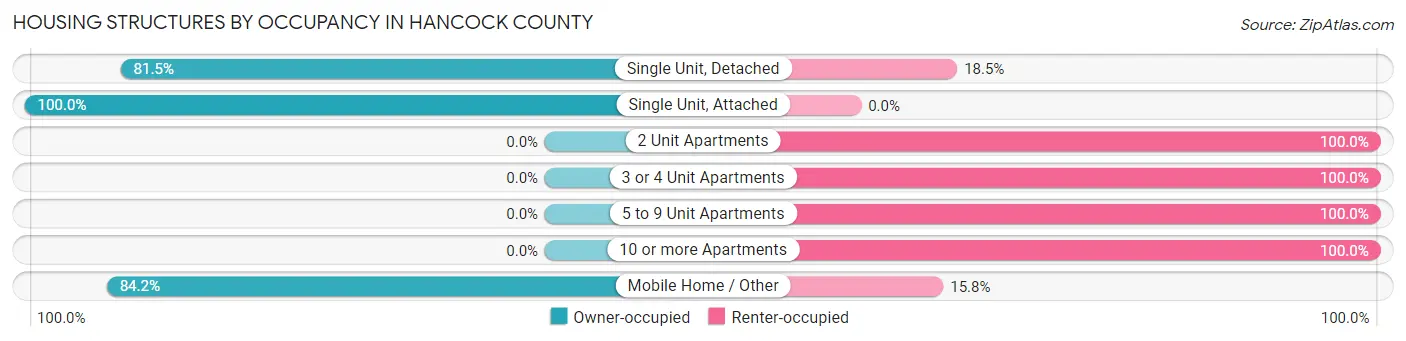
| Structure Type | Owner-occupied | Renter-occupied |
| Single Unit, Detached | 1,208 (81.5%) | 274 (18.5%) |
| Single Unit, Attached | 23 (100.0%) | 0 (0.0%) |
| 2 Unit Apartments | 0 (0.0%) | 68 (100.0%) |
| 3 or 4 Unit Apartments | 0 (0.0%) | 9 (100.0%) |
| 5 to 9 Unit Apartments | 0 (0.0%) | 25 (100.0%) |
| 10 or more Apartments | 0 (0.0%) | 154 (100.0%) |
| Mobile Home / Other | 862 (84.2%) | 162 (15.8%) |
| Total | 2,093 (75.1%) | 692 (24.8%) |
Housing Structures by Number of Rooms in Hancock County
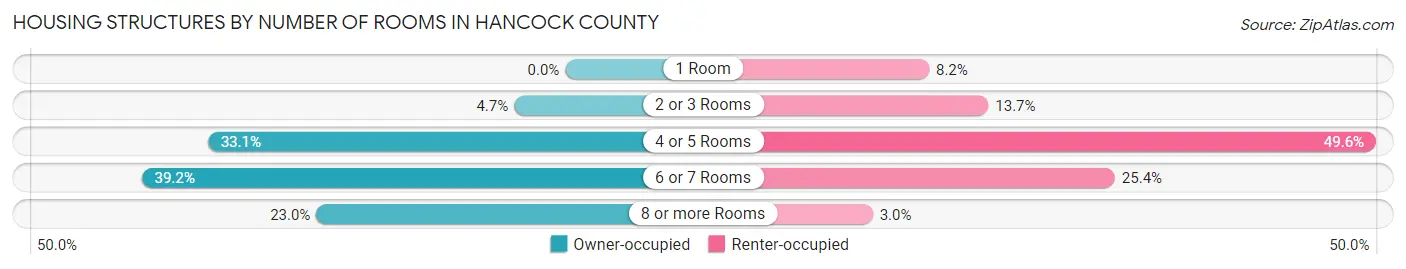
| Number of Rooms | Owner-occupied | Renter-occupied |
| 1 Room | 0 (0.0%) | 57 (8.2%) |
| 2 or 3 Rooms | 99 (4.7%) | 95 (13.7%) |
| 4 or 5 Rooms | 692 (33.1%) | 343 (49.6%) |
| 6 or 7 Rooms | 820 (39.2%) | 176 (25.4%) |
| 8 or more Rooms | 482 (23.0%) | 21 (3.0%) |
| Total | 2,093 (100.0%) | 692 (100.0%) |
Housing Structure by Heating Type in Hancock County
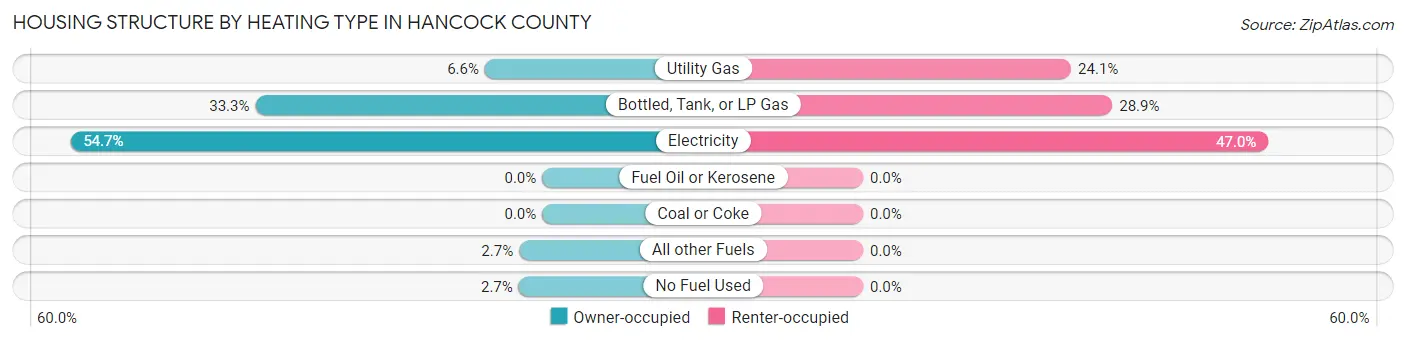
| Heating Type | Owner-occupied | Renter-occupied |
| Utility Gas | 139 (6.6%) | 167 (24.1%) |
| Bottled, Tank, or LP Gas | 696 (33.3%) | 200 (28.9%) |
| Electricity | 1,145 (54.7%) | 325 (47.0%) |
| Fuel Oil or Kerosene | 0 (0.0%) | 0 (0.0%) |
| Coal or Coke | 0 (0.0%) | 0 (0.0%) |
| All other Fuels | 56 (2.7%) | 0 (0.0%) |
| No Fuel Used | 57 (2.7%) | 0 (0.0%) |
| Total | 2,093 (100.0%) | 692 (100.0%) |
Household Vehicle Usage in Hancock County
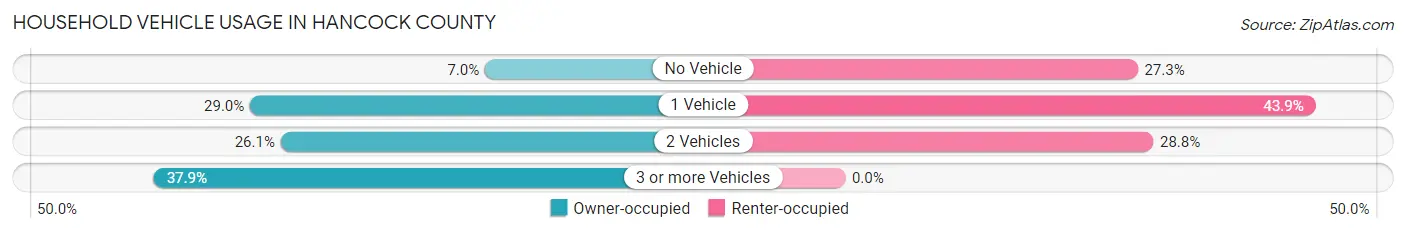
| Vehicles per Household | Owner-occupied | Renter-occupied |
| No Vehicle | 147 (7.0%) | 189 (27.3%) |
| 1 Vehicle | 606 (28.9%) | 304 (43.9%) |
| 2 Vehicles | 546 (26.1%) | 199 (28.8%) |
| 3 or more Vehicles | 794 (37.9%) | 0 (0.0%) |
| Total | 2,093 (100.0%) | 692 (100.0%) |
Real Estate & Mortgages in Hancock County
Real Estate and Mortgage Overview in Hancock County
| Characteristic | Without Mortgage | With Mortgage |
| Housing Units | 1,259 | 834 |
| Median Property Value | $81,600 | $180,100 |
| Median Household Income | $36,067 | $58 |
| Monthly Housing Costs | $394 | $16 |
| Real Estate Taxes | $909 | $0 |
Property Value by Mortgage Status in Hancock County
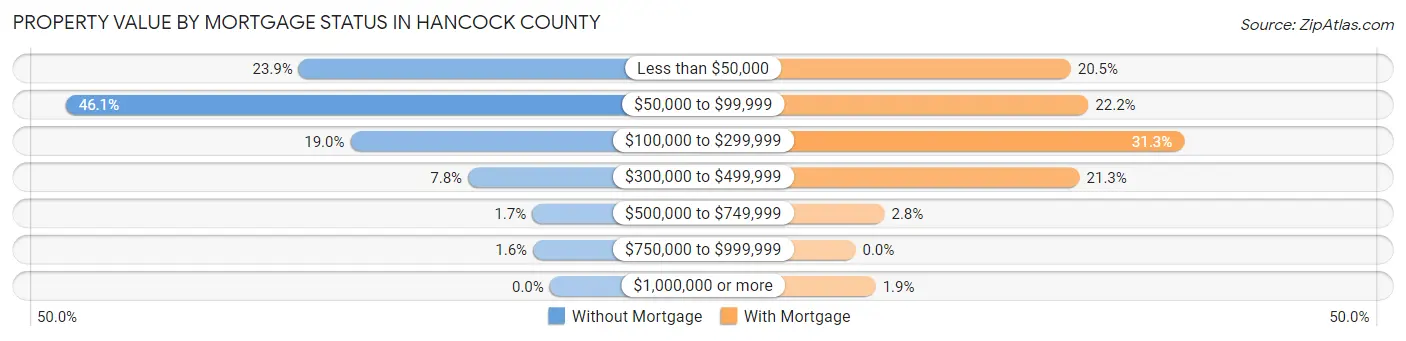
| Property Value | Without Mortgage | With Mortgage |
| Less than $50,000 | 301 (23.9%) | 171 (20.5%) |
| $50,000 to $99,999 | 580 (46.1%) | 185 (22.2%) |
| $100,000 to $299,999 | 239 (19.0%) | 261 (31.3%) |
| $300,000 to $499,999 | 98 (7.8%) | 178 (21.3%) |
| $500,000 to $749,999 | 21 (1.7%) | 23 (2.8%) |
| $750,000 to $999,999 | 20 (1.6%) | 0 (0.0%) |
| $1,000,000 or more | 0 (0.0%) | 16 (1.9%) |
| Total | 1,259 (100.0%) | 834 (100.0%) |
Household Income by Mortgage Status in Hancock County
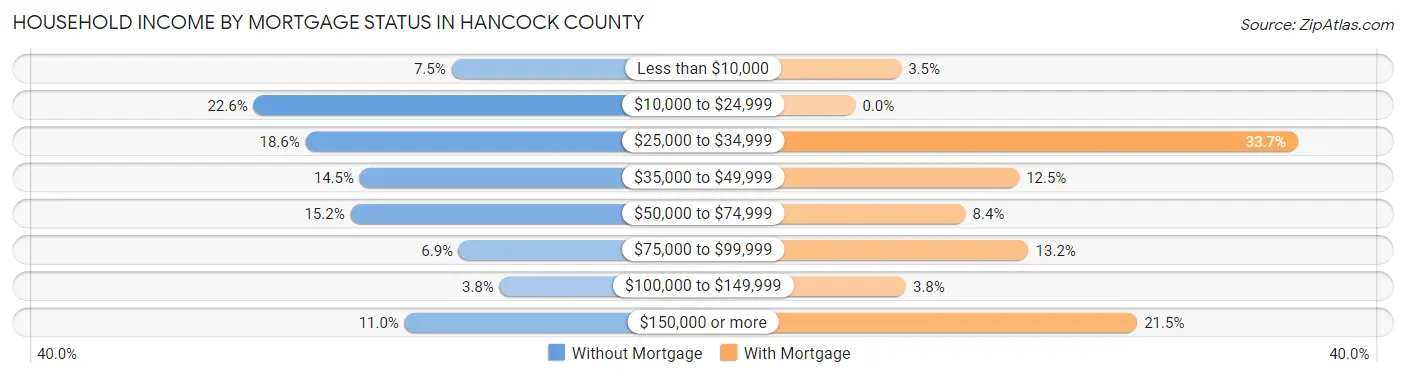
| Household Income | Without Mortgage | With Mortgage |
| Less than $10,000 | 94 (7.5%) | 29 (3.5%) |
| $10,000 to $24,999 | 284 (22.6%) | 0 (0.0%) |
| $25,000 to $34,999 | 234 (18.6%) | 281 (33.7%) |
| $35,000 to $49,999 | 182 (14.5%) | 104 (12.5%) |
| $50,000 to $74,999 | 191 (15.2%) | 70 (8.4%) |
| $75,000 to $99,999 | 87 (6.9%) | 110 (13.2%) |
| $100,000 to $149,999 | 48 (3.8%) | 32 (3.8%) |
| $150,000 or more | 139 (11.0%) | 179 (21.5%) |
| Total | 1,259 (100.0%) | 834 (100.0%) |
Property Value to Household Income Ratio in Hancock County
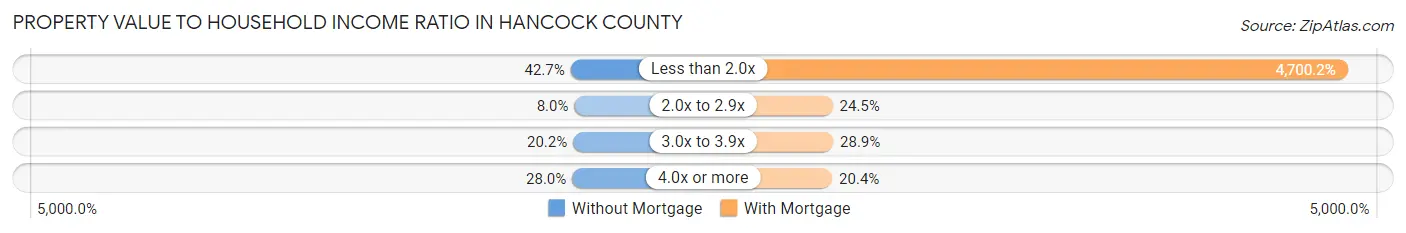
| Value-to-Income Ratio | Without Mortgage | With Mortgage |
| Less than 2.0x | 538 (42.7%) | 39,200 (4,700.2%) |
| 2.0x to 2.9x | 101 (8.0%) | 204 (24.5%) |
| 3.0x to 3.9x | 254 (20.2%) | 241 (28.9%) |
| 4.0x or more | 353 (28.0%) | 170 (20.4%) |
| Total | 1,259 (100.0%) | 834 (100.0%) |
Real Estate Taxes by Mortgage Status in Hancock County
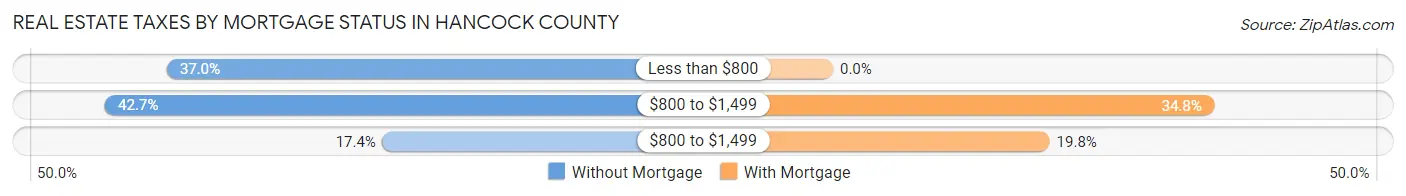
| Property Taxes | Without Mortgage | With Mortgage |
| Less than $800 | 466 (37.0%) | 0 (0.0%) |
| $800 to $1,499 | 537 (42.6%) | 290 (34.8%) |
| $800 to $1,499 | 219 (17.4%) | 165 (19.8%) |
| Total | 1,259 (100.0%) | 834 (100.0%) |
Health & Disability in Hancock County
Health Insurance Coverage by Age in Hancock County

| Age Bracket | With Coverage | Without Coverage |
| Under 6 Years | 223 (96.1%) | 9 (3.9%) |
| 6 to 18 Years | 1,008 (98.9%) | 11 (1.1%) |
| 19 to 25 Years | 485 (71.2%) | 196 (28.8%) |
| 26 to 34 Years | 402 (76.7%) | 122 (23.3%) |
| 35 to 44 Years | 582 (95.4%) | 28 (4.6%) |
| 45 to 54 Years | 587 (72.5%) | 223 (27.5%) |
| 55 to 64 Years | 1,046 (84.4%) | 193 (15.6%) |
| 65 to 74 Years | 1,226 (100.0%) | 0 (0.0%) |
| 75 Years and older | 732 (100.0%) | 0 (0.0%) |
| Total | 6,291 (88.9%) | 782 (11.1%) |
Health Insurance Coverage by Citizenship Status in Hancock County
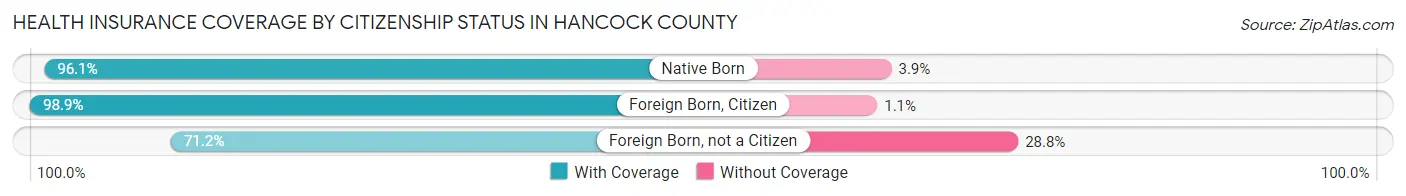
| Citizenship Status | With Coverage | Without Coverage |
| Native Born | 223 (96.1%) | 9 (3.9%) |
| Foreign Born, Citizen | 1,008 (98.9%) | 11 (1.1%) |
| Foreign Born, not a Citizen | 485 (71.2%) | 196 (28.8%) |
Health Insurance Coverage by Household Income in Hancock County
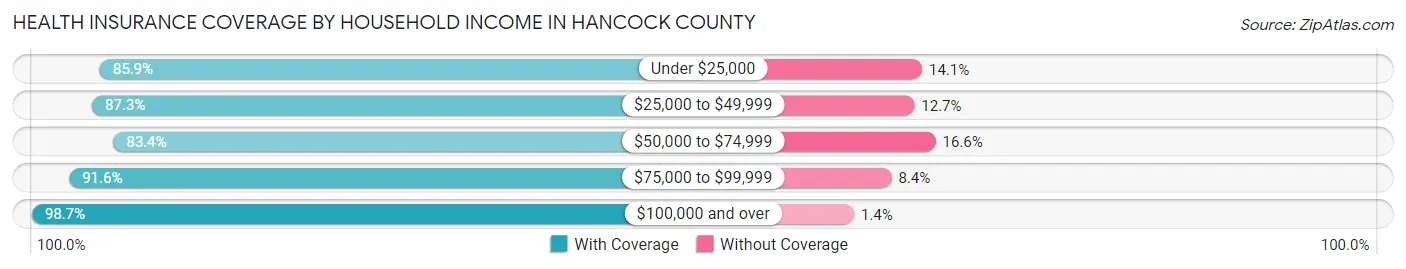
| Household Income | With Coverage | Without Coverage |
| Under $25,000 | 1,834 (85.9%) | 301 (14.1%) |
| $25,000 to $49,999 | 1,408 (87.3%) | 204 (12.7%) |
| $50,000 to $74,999 | 1,028 (83.4%) | 205 (16.6%) |
| $75,000 to $99,999 | 558 (91.6%) | 51 (8.4%) |
| $100,000 and over | 1,461 (98.7%) | 20 (1.3%) |
Public vs Private Health Insurance Coverage by Age in Hancock County
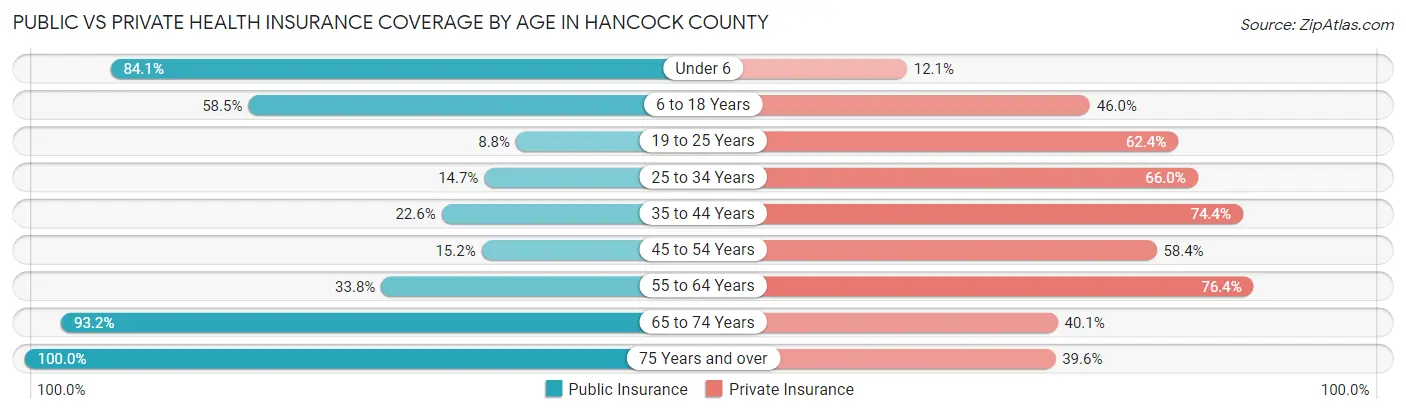
| Age Bracket | Public Insurance | Private Insurance |
| Under 6 | 195 (84.1%) | 28 (12.1%) |
| 6 to 18 Years | 596 (58.5%) | 469 (46.0%) |
| 19 to 25 Years | 60 (8.8%) | 425 (62.4%) |
| 25 to 34 Years | 77 (14.7%) | 346 (66.0%) |
| 35 to 44 Years | 138 (22.6%) | 454 (74.4%) |
| 45 to 54 Years | 123 (15.2%) | 473 (58.4%) |
| 55 to 64 Years | 419 (33.8%) | 947 (76.4%) |
| 65 to 74 Years | 1,143 (93.2%) | 491 (40.1%) |
| 75 Years and over | 732 (100.0%) | 290 (39.6%) |
| Total | 3,483 (49.2%) | 3,923 (55.5%) |
Disability Status by Sex by Age in Hancock County
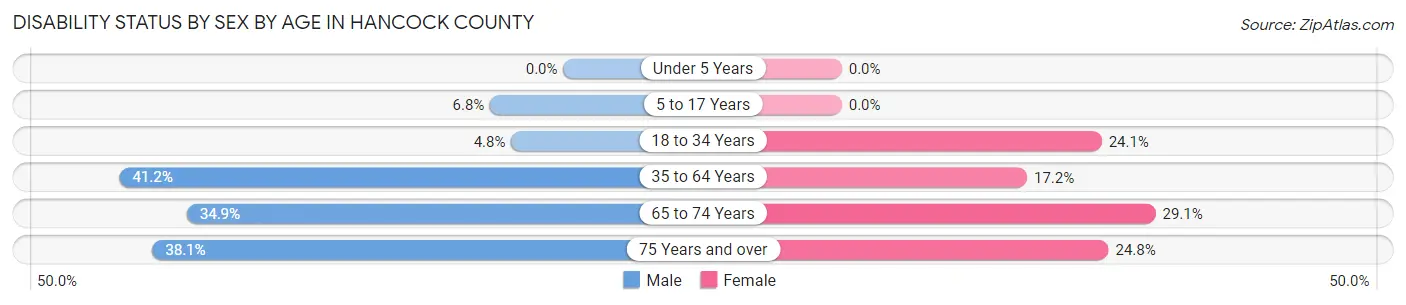
| Age Bracket | Male | Female |
| Under 5 Years | 0 (0.0%) | 0 (0.0%) |
| 5 to 17 Years | 15 (6.8%) | 0 (0.0%) |
| 18 to 34 Years | 38 (4.8%) | 123 (24.1%) |
| 35 to 64 Years | 465 (41.2%) | 263 (17.2%) |
| 65 to 74 Years | 210 (34.9%) | 182 (29.1%) |
| 75 Years and over | 119 (38.1%) | 104 (24.8%) |
Disability Class by Sex by Age in Hancock County
Disability Class: Hearing Difficulty
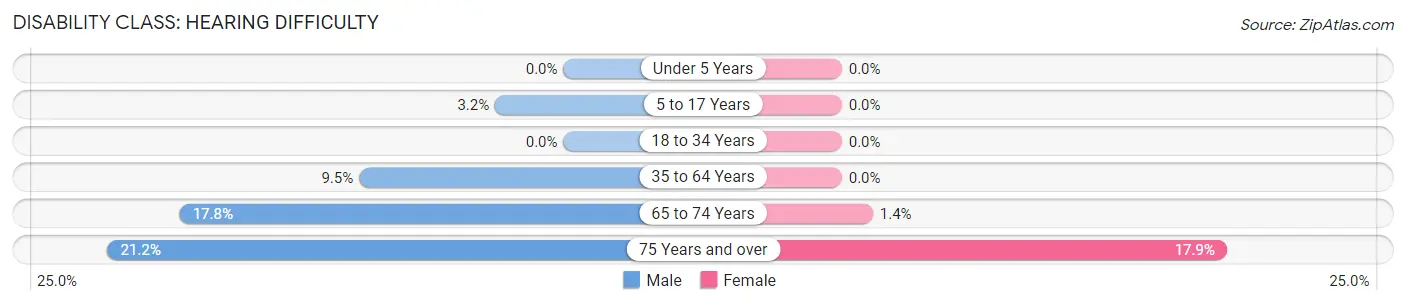
| Age Bracket | Male | Female |
| Under 5 Years | 0 (0.0%) | 0 (0.0%) |
| 5 to 17 Years | 7 (3.2%) | 0 (0.0%) |
| 18 to 34 Years | 0 (0.0%) | 0 (0.0%) |
| 35 to 64 Years | 107 (9.5%) | 0 (0.0%) |
| 65 to 74 Years | 107 (17.8%) | 9 (1.4%) |
| 75 Years and over | 66 (21.1%) | 75 (17.9%) |
Disability Class: Vision Difficulty
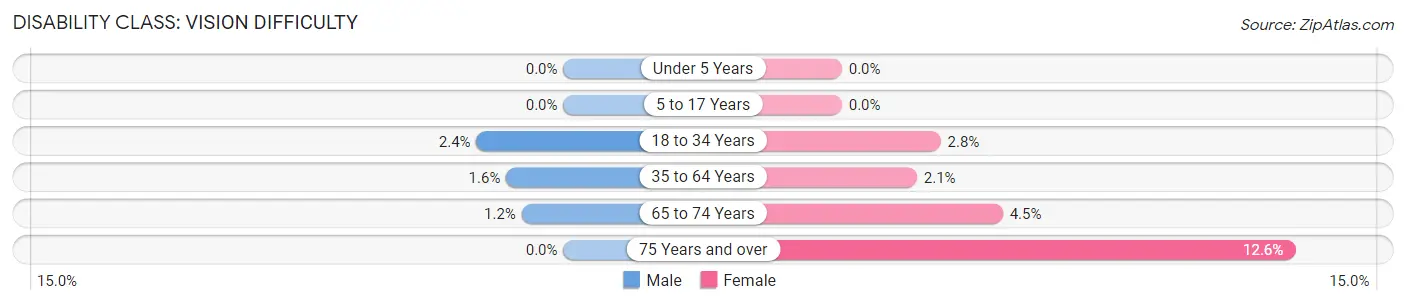
| Age Bracket | Male | Female |
| Under 5 Years | 0 (0.0%) | 0 (0.0%) |
| 5 to 17 Years | 0 (0.0%) | 0 (0.0%) |
| 18 to 34 Years | 19 (2.4%) | 14 (2.8%) |
| 35 to 64 Years | 18 (1.6%) | 32 (2.1%) |
| 65 to 74 Years | 7 (1.2%) | 28 (4.5%) |
| 75 Years and over | 0 (0.0%) | 53 (12.6%) |
Disability Class: Cognitive Difficulty
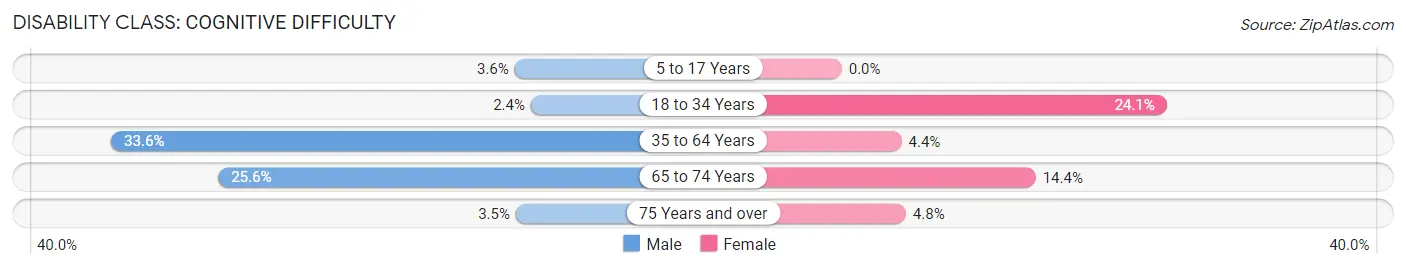
| Age Bracket | Male | Female |
| 5 to 17 Years | 8 (3.6%) | 0 (0.0%) |
| 18 to 34 Years | 19 (2.4%) | 123 (24.1%) |
| 35 to 64 Years | 379 (33.6%) | 68 (4.4%) |
| 65 to 74 Years | 154 (25.6%) | 90 (14.4%) |
| 75 Years and over | 11 (3.5%) | 20 (4.8%) |
Disability Class: Ambulatory Difficulty
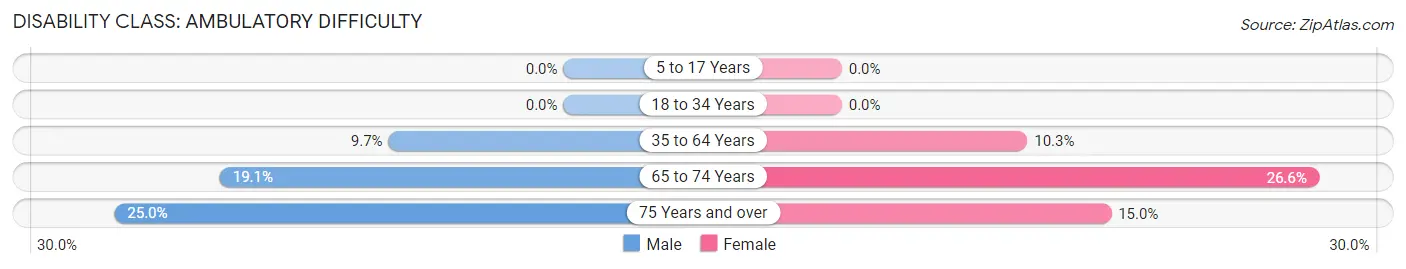
| Age Bracket | Male | Female |
| 5 to 17 Years | 0 (0.0%) | 0 (0.0%) |
| 18 to 34 Years | 0 (0.0%) | 0 (0.0%) |
| 35 to 64 Years | 110 (9.7%) | 158 (10.3%) |
| 65 to 74 Years | 115 (19.1%) | 166 (26.6%) |
| 75 Years and over | 78 (25.0%) | 63 (15.0%) |
Disability Class: Self-Care Difficulty
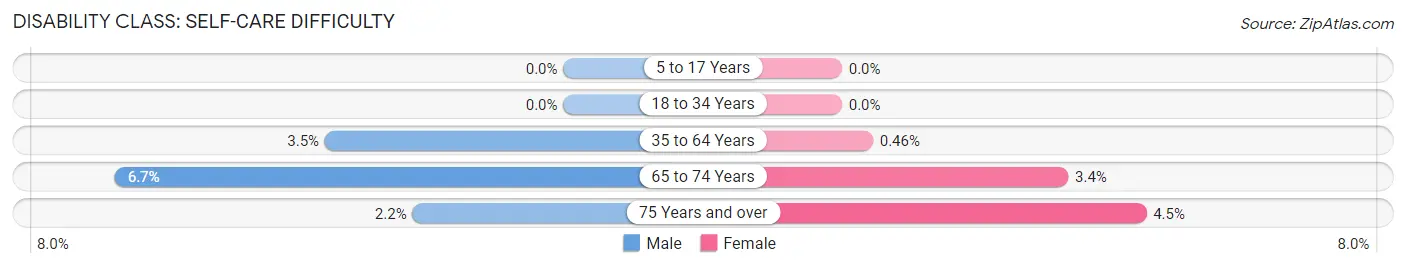
| Age Bracket | Male | Female |
| 5 to 17 Years | 0 (0.0%) | 0 (0.0%) |
| 18 to 34 Years | 0 (0.0%) | 0 (0.0%) |
| 35 to 64 Years | 40 (3.5%) | 7 (0.5%) |
| 65 to 74 Years | 40 (6.7%) | 21 (3.4%) |
| 75 Years and over | 7 (2.2%) | 19 (4.5%) |
Technology Access in Hancock County
Computing Device Access in Hancock County
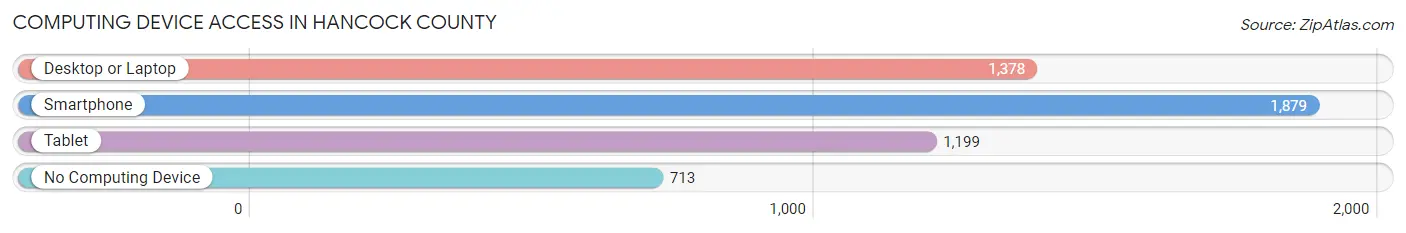
| Device Type | # Households | % Households |
| Desktop or Laptop | 1,378 | 49.5% |
| Smartphone | 1,879 | 67.5% |
| Tablet | 1,199 | 43.0% |
| No Computing Device | 713 | 25.6% |
| Total | 2,785 | 100.0% |
Internet Access in Hancock County
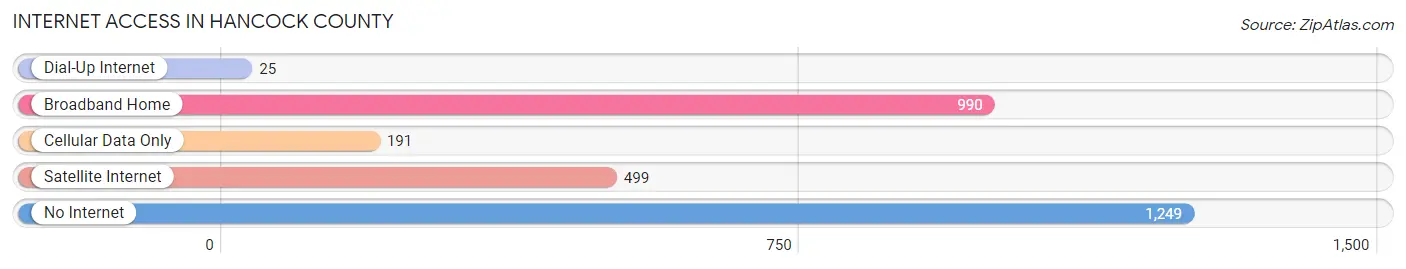
| Internet Type | # Households | % Households |
| Dial-Up Internet | 25 | 0.9% |
| Broadband Home | 990 | 35.5% |
| Cellular Data Only | 191 | 6.9% |
| Satellite Internet | 499 | 17.9% |
| No Internet | 1,249 | 44.9% |
| Total | 2,785 | 100.0% |
Hancock County Summary
Hancock County is located in the east-central part of the state of Georgia, in the United States. It is bordered by Baldwin, Putnam, Jasper, and Washington counties. The county seat is Sparta. The county was created in 1793 and named for John Hancock, the first signer of the Declaration of Independence.
Geography
Hancock County covers an area of 441 square miles, of which 437 square miles is land and 4 square miles is water. The county is located in the Piedmont region of Georgia, and is characterized by rolling hills and valleys. The Oconee River forms the western border of the county, and the Ogeechee River forms the eastern border. The county is home to several state parks, including Hard Labor Creek State Park, Indian Springs State Park, and Magnolia Springs State Park.
Demographics
As of the 2010 census, the population of Hancock County was 9,429, with a population density of 21.4 people per square mile. The racial makeup of the county was 79.2% White, 18.2% African American, 0.3% Native American, 0.3% Asian, 0.1% Pacific Islander, 0.7% from other races, and 1.3% from two or more races. Hispanic or Latino of any race were 1.9% of the population.
The median income for a household in the county was $35,945, and the median income for a family was $41,944. The per capita income for the county was $17,845. About 17.2% of families and 21.2% of the population were below the poverty line, including 28.2% of those under age 18 and 16.2% of those age 65 or over.
Economy
Hancock County is largely rural, and the economy is largely based on agriculture. The county is home to several large farms, including the Hancock County Farm Bureau, which produces cotton, corn, soybeans, and peanuts. Other agricultural products include hay, timber, and livestock.
The county is also home to several manufacturing companies, including the Hancock County Manufacturing Company, which produces furniture, and the Hancock County Textile Company, which produces textiles. The county is also home to several small businesses, including restaurants, retail stores, and service providers.
History
Hancock County was created in 1793 from parts of Greene and Washington counties. It was named for John Hancock, the first signer of the Declaration of Independence. The county seat was originally located in Sparta, but was moved to Sparta in 1803.
The county was largely agricultural in the 19th century, and the population grew steadily throughout the century. The county was home to several large plantations, and the economy was largely based on cotton production.
In the 20th century, the county's economy shifted away from agriculture and towards manufacturing. The county was home to several large manufacturing companies, including the Hancock County Manufacturing Company and the Hancock County Textile Company.
Today, Hancock County is largely rural, and the economy is largely based on agriculture. The county is home to several large farms, and the county is also home to several small businesses, including restaurants, retail stores, and service providers.
Common Questions
What is Per Capita Income in Hancock County?
Per Capita income in Hancock County is $19,730.
What is the Median Family Income in Hancock County?
Median Family Income in Hancock County is $57,070.
What is the Median Household income in Hancock County?
Median Household Income in Hancock County is $31,767.
What is Income or Wage Gap in Hancock County?
Income or Wage Gap in Hancock County is 36.9%.
Women in Hancock County earn 63.1 cents for every dollar earned by a man.
What is Inequality or Gini Index in Hancock County?
Inequality or Gini Index in Hancock County is 0.50.
What is the Total Population of Hancock County?
Total Population of Hancock County is 8,588.
What is the Total Male Population of Hancock County?
Total Male Population of Hancock County is 4,502.
What is the Total Female Population of Hancock County?
Total Female Population of Hancock County is 4,086.
What is the Ratio of Males per 100 Females in Hancock County?
There are 110.18 Males per 100 Females in Hancock County.
What is the Ratio of Females per 100 Males in Hancock County?
There are 90.76 Females per 100 Males in Hancock County.
What is the Median Population Age in Hancock County?
Median Population Age in Hancock County is 46.0 Years.
What is the Average Family Size in Hancock County
Average Family Size in Hancock County is 3.5 People.
What is the Average Household Size in Hancock County
Average Household Size in Hancock County is 2.5 People.
How Large is the Labor Force in Hancock County?
There are 2,698 People in the Labor Forcein in Hancock County.
What is the Percentage of People in the Labor Force in Hancock County?
35.6% of People are in the Labor Force in Hancock County.
What is the Unemployment Rate in Hancock County?
Unemployment Rate in Hancock County is 6.2%.