Elbert County, GA Map & Demographics
Elbert County Map
Elbert County Overview
$27,848
PER CAPITA INCOME
$62,043
AVG FAMILY INCOME
$48,190
AVG HOUSEHOLD INCOME
34.1%
WAGE / INCOME GAP [ % ]
65.9¢/ $1
WAGE / INCOME GAP [ $ ]
$11,840
FAMILY INCOME DEFICIT
0.44
INEQUALITY / GINI INDEX
19,570
TOTAL POPULATION
9,358
MALE POPULATION
10,212
FEMALE POPULATION
91.64
MALES / 100 FEMALES
109.13
FEMALES / 100 MALES
42.8
MEDIAN AGE
3.0
AVG FAMILY SIZE
2.5
AVG HOUSEHOLD SIZE
9,217
LABOR FORCE [ PEOPLE ]
58.3%
PERCENT IN LABOR FORCE
7.5%
UNEMPLOYMENT RATE
Elbert County Area Codes
Income in Elbert County
Income Overview in Elbert County
Per Capita Income in Elbert County is $27,848, while median incomes of families and households are $62,043 and $48,190 respectively.
| Characteristic | Number | Measure |
| Per Capita Income | 19,570 | $27,848 |
| Median Family Income | 5,187 | $62,043 |
| Mean Family Income | 5,187 | $78,713 |
| Median Household Income | 7,873 | $48,190 |
| Mean Household Income | 7,873 | $65,608 |
| Income Deficit | 5,187 | $11,840 |
| Wage / Income Gap (%) | 19,570 | 34.10% |
| Wage / Income Gap ($) | 19,570 | 65.90¢ per $1 |
| Gini / Inequality Index | 19,570 | 0.44 |
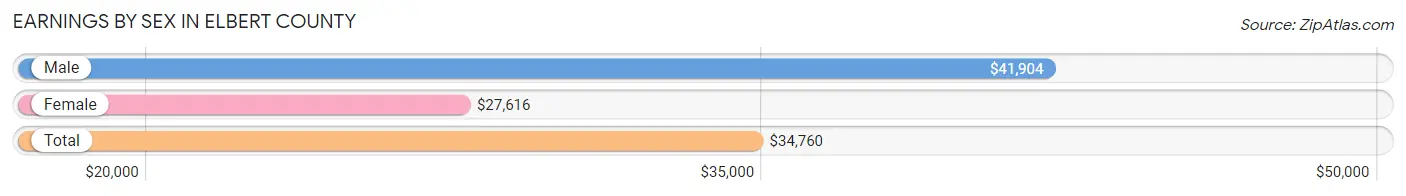
Earnings by Sex in Elbert County
Average Earnings in Elbert County are $34,760, $41,904 for men and $27,616 for women, a difference of 34.1%.
| Sex | Number | Average Earnings |
| Male | 4,926 (53.2%) | $41,904 |
| Female | 4,336 (46.8%) | $27,616 |
| Total | 9,262 (100.0%) | $34,760 |
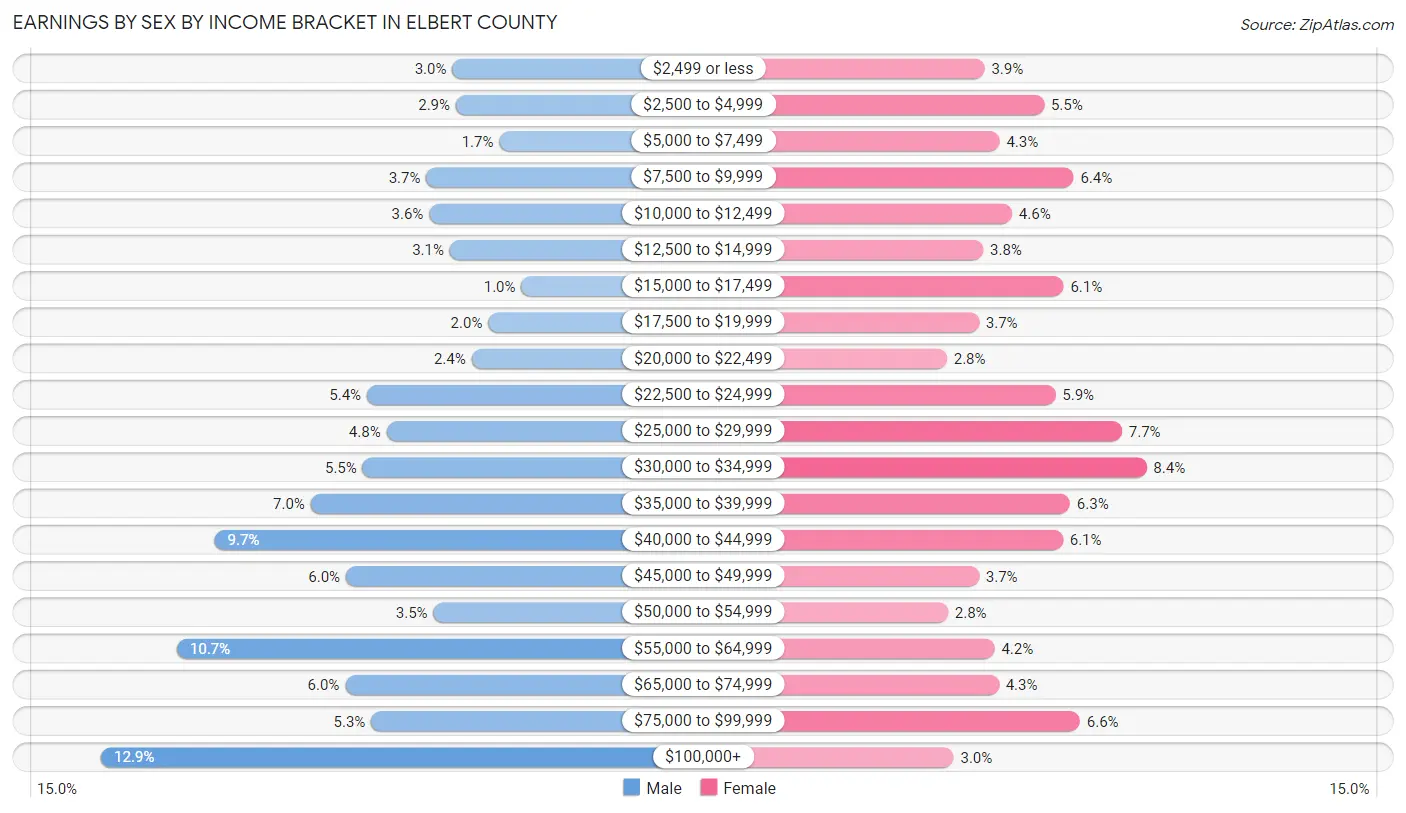
Earnings by Sex by Income Bracket in Elbert County
The most common earnings brackets in Elbert County are $100,000+ for men (633 | 12.9%) and $30,000 to $34,999 for women (365 | 8.4%).
| Income | Male | Female |
| $2,499 or less | 147 (3.0%) | 168 (3.9%) |
| $2,500 to $4,999 | 142 (2.9%) | 240 (5.5%) |
| $5,000 to $7,499 | 82 (1.7%) | 186 (4.3%) |
| $7,500 to $9,999 | 183 (3.7%) | 276 (6.4%) |
| $10,000 to $12,499 | 179 (3.6%) | 201 (4.6%) |
| $12,500 to $14,999 | 150 (3.0%) | 166 (3.8%) |
| $15,000 to $17,499 | 51 (1.0%) | 264 (6.1%) |
| $17,500 to $19,999 | 97 (2.0%) | 161 (3.7%) |
| $20,000 to $22,499 | 120 (2.4%) | 122 (2.8%) |
| $22,500 to $24,999 | 265 (5.4%) | 254 (5.9%) |
| $25,000 to $29,999 | 238 (4.8%) | 335 (7.7%) |
| $30,000 to $34,999 | 271 (5.5%) | 365 (8.4%) |
| $35,000 to $39,999 | 343 (7.0%) | 272 (6.3%) |
| $40,000 to $44,999 | 476 (9.7%) | 263 (6.1%) |
| $45,000 to $49,999 | 294 (6.0%) | 161 (3.7%) |
| $50,000 to $54,999 | 173 (3.5%) | 123 (2.8%) |
| $55,000 to $64,999 | 528 (10.7%) | 180 (4.2%) |
| $65,000 to $74,999 | 295 (6.0%) | 185 (4.3%) |
| $75,000 to $99,999 | 259 (5.3%) | 284 (6.6%) |
| $100,000+ | 633 (12.9%) | 130 (3.0%) |
| Total | 4,926 (100.0%) | 4,336 (100.0%) |
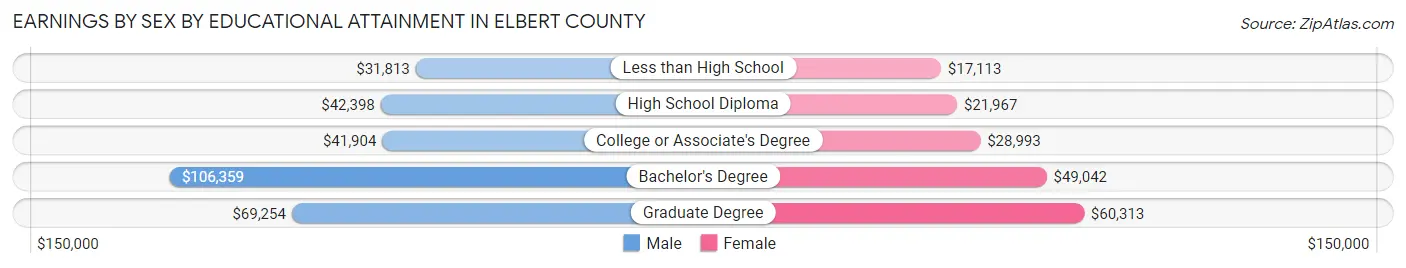
Earnings by Sex by Educational Attainment in Elbert County
Average earnings in Elbert County are $43,355 for men and $29,367 for women, a difference of 32.3%. Men with an educational attainment of bachelor's degree enjoy the highest average annual earnings of $106,359, while those with less than high school education earn the least with $31,813. Women with an educational attainment of graduate degree earn the most with the average annual earnings of $60,313, while those with less than high school education have the smallest earnings of $17,113.
| Educational Attainment | Male Income | Female Income |
| Less than High School | $31,813 | $17,113 |
| High School Diploma | $42,398 | $21,967 |
| College or Associate's Degree | $41,904 | $28,993 |
| Bachelor's Degree | $106,359 | $49,042 |
| Graduate Degree | $69,254 | $60,313 |
| Total | $43,355 | $29,367 |
Family Income in Elbert County
Family Income Brackets in Elbert County
According to the Elbert County family income data, there are 944 families falling into the $35,000 to $49,999 income range, which is the most common income bracket and makes up 18.2% of all families. Conversely, the $10,000 to $14,999 income bracket is the least frequent group with only 114 families (2.2%) belonging to this category.
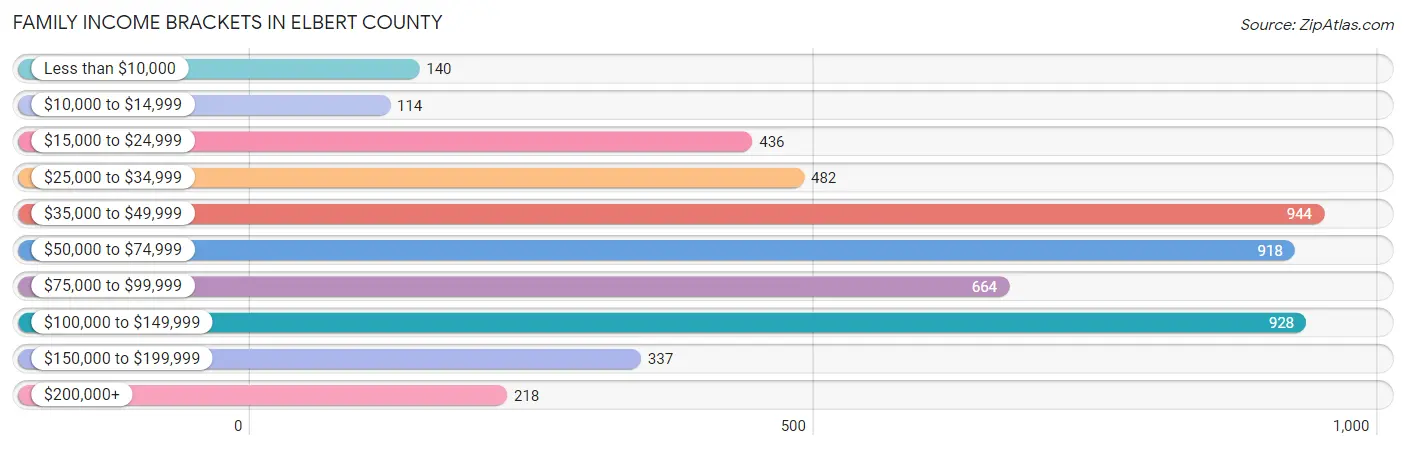
| Income Bracket | # Families | % Families |
| Less than $10,000 | 140 | 2.7% |
| $10,000 to $14,999 | 114 | 2.2% |
| $15,000 to $24,999 | 436 | 8.4% |
| $25,000 to $34,999 | 482 | 9.3% |
| $35,000 to $49,999 | 944 | 18.2% |
| $50,000 to $74,999 | 918 | 17.7% |
| $75,000 to $99,999 | 664 | 12.8% |
| $100,000 to $149,999 | 928 | 17.9% |
| $150,000 to $199,999 | 337 | 6.5% |
| $200,000+ | 218 | 4.2% |
Family Income by Famaliy Size in Elbert County
4-person families (711 | 13.7%) account for the highest median family income in Elbert County with $86,620 per family, while 2-person families (2,805 | 54.1%) have the highest median income of $28,912 per family member.
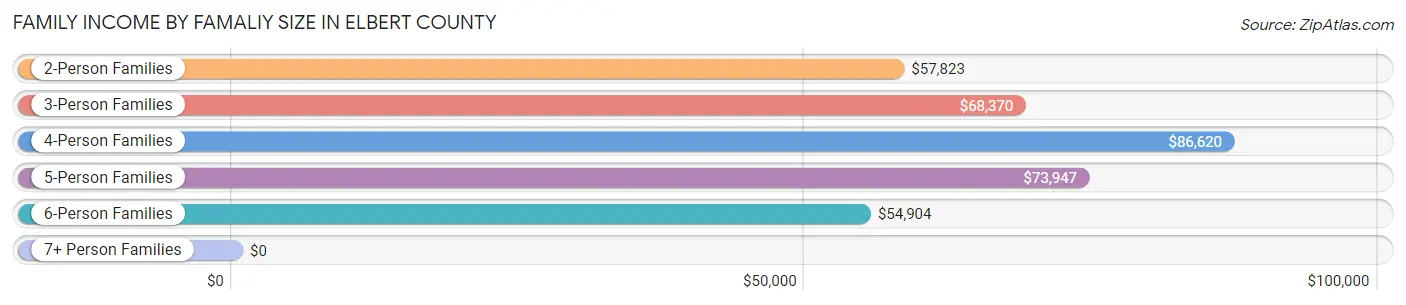
| Income Bracket | # Families | Median Income |
| 2-Person Families | 2,805 (54.1%) | $57,823 |
| 3-Person Families | 1,046 (20.2%) | $68,370 |
| 4-Person Families | 711 (13.7%) | $86,620 |
| 5-Person Families | 282 (5.4%) | $73,947 |
| 6-Person Families | 249 (4.8%) | $54,904 |
| 7+ Person Families | 94 (1.8%) | $0 |
| Total | 5,187 (100.0%) | $62,043 |
Family Income by Number of Earners in Elbert County
The median family income in Elbert County is $62,043, with families comprising 3+ earners (377) having the highest median family income of $109,617, while families with no earners (898) have the lowest median family income of $35,357, accounting for 7.3% and 17.3% of families, respectively.
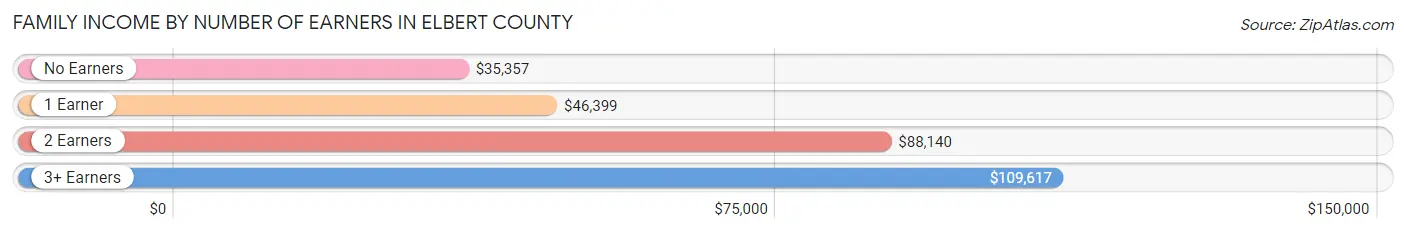
| Number of Earners | # Families | Median Income |
| No Earners | 898 (17.3%) | $35,357 |
| 1 Earner | 1,950 (37.6%) | $46,399 |
| 2 Earners | 1,962 (37.8%) | $88,140 |
| 3+ Earners | 377 (7.3%) | $109,617 |
| Total | 5,187 (100.0%) | $62,043 |
Household Income in Elbert County
Household Income Brackets in Elbert County
With 1,457 households falling in the category, the $35,000 to $49,999 income range is the most frequent in Elbert County, accounting for 18.5% of all households. In contrast, only 220 households (2.8%) fall into the $200,000+ income bracket, making it the least populous group.
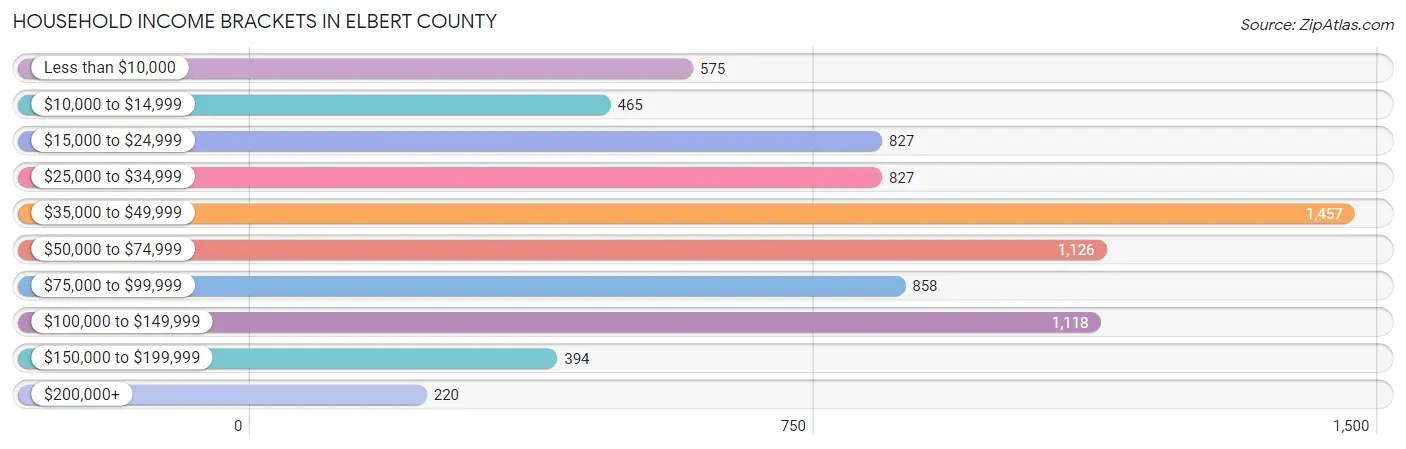
| Income Bracket | # Households | % Households |
| Less than $10,000 | 575 | 7.3% |
| $10,000 to $14,999 | 465 | 5.9% |
| $15,000 to $24,999 | 827 | 10.5% |
| $25,000 to $34,999 | 827 | 10.5% |
| $35,000 to $49,999 | 1,457 | 18.5% |
| $50,000 to $74,999 | 1,126 | 14.3% |
| $75,000 to $99,999 | 858 | 10.9% |
| $100,000 to $149,999 | 1,118 | 14.2% |
| $150,000 to $199,999 | 394 | 5.0% |
| $200,000+ | 220 | 2.8% |
Household Income by Householder Age in Elbert County
The median household income in Elbert County is $48,190, with the highest median household income of $85,637 found in the 15 to 24 years age bracket for the primary householder. A total of 296 households (3.8%) fall into this category. Meanwhile, the 65+ years age bracket for the primary householder has the lowest median household income of $38,379, with 2,603 households (33.1%) in this group.

| Income Bracket | # Households | Median Income |
| 15 to 24 Years | 296 (3.8%) | $85,637 |
| 25 to 44 Years | 1,943 (24.7%) | $59,085 |
| 45 to 64 Years | 3,031 (38.5%) | $54,019 |
| 65+ Years | 2,603 (33.1%) | $38,379 |
| Total | 7,873 (100.0%) | $48,190 |
Poverty in Elbert County
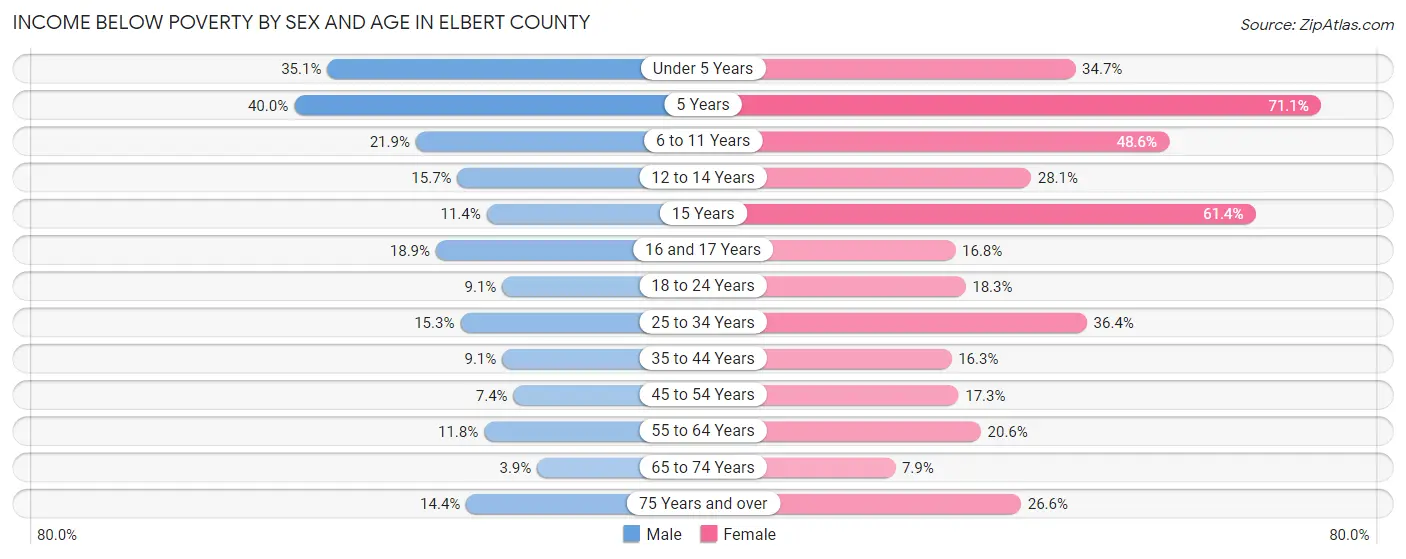
Income Below Poverty by Sex and Age in Elbert County
With 13.6% poverty level for males and 24.0% for females among the residents of Elbert County, 5 year old males and 5 year old females are the most vulnerable to poverty, with 68 males (40.0%) and 59 females (71.1%) in their respective age groups living below the poverty level.
| Age Bracket | Male | Female |
| Under 5 Years | 210 (35.1%) | 149 (34.6%) |
| 5 Years | 68 (40.0%) | 59 (71.1%) |
| 6 to 11 Years | 153 (21.9%) | 386 (48.5%) |
| 12 to 14 Years | 59 (15.7%) | 87 (28.1%) |
| 15 Years | 13 (11.4%) | 62 (61.4%) |
| 16 and 17 Years | 39 (18.9%) | 51 (16.8%) |
| 18 to 24 Years | 57 (9.1%) | 137 (18.3%) |
| 25 to 34 Years | 171 (15.3%) | 417 (36.4%) |
| 35 to 44 Years | 93 (9.1%) | 188 (16.3%) |
| 45 to 54 Years | 97 (7.4%) | 227 (17.3%) |
| 55 to 64 Years | 152 (11.8%) | 292 (20.6%) |
| 65 to 74 Years | 39 (3.9%) | 101 (7.9%) |
| 75 Years and over | 102 (14.4%) | 244 (26.6%) |
| Total | 1,253 (13.6%) | 2,400 (24.0%) |
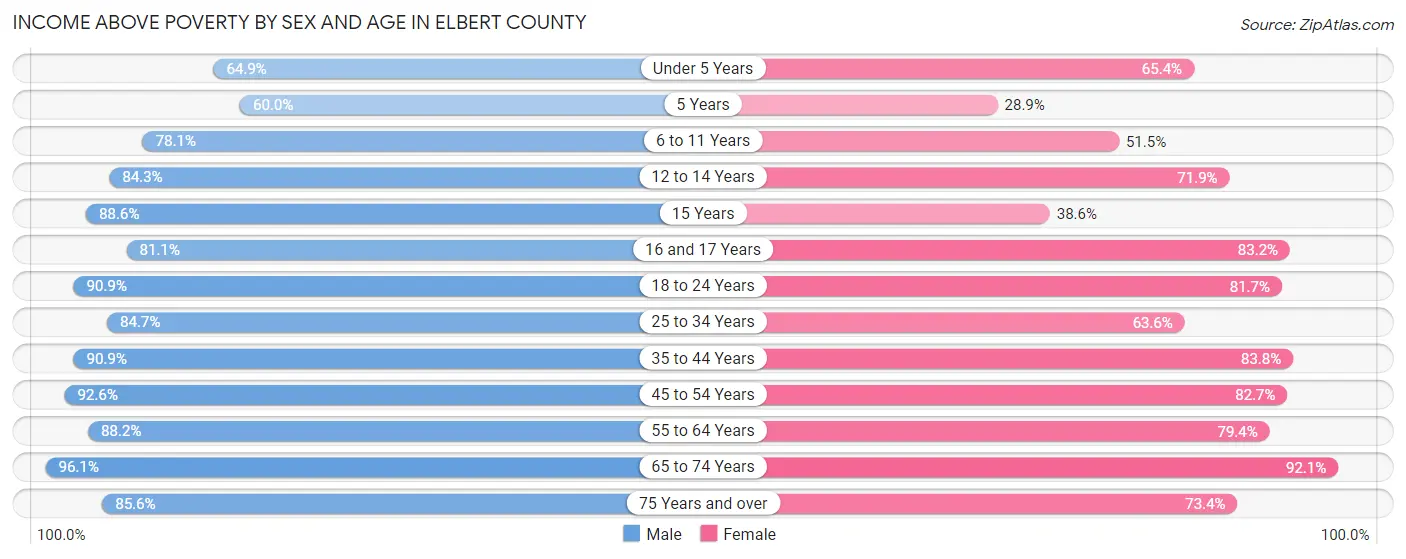
Income Above Poverty by Sex and Age in Elbert County
According to the poverty statistics in Elbert County, males aged 65 to 74 years and females aged 65 to 74 years are the age groups that are most secure financially, with 96.1% of males and 92.1% of females in these age groups living above the poverty line.
| Age Bracket | Male | Female |
| Under 5 Years | 389 (64.9%) | 281 (65.3%) |
| 5 Years | 102 (60.0%) | 24 (28.9%) |
| 6 to 11 Years | 545 (78.1%) | 409 (51.4%) |
| 12 to 14 Years | 316 (84.3%) | 223 (71.9%) |
| 15 Years | 101 (88.6%) | 39 (38.6%) |
| 16 and 17 Years | 167 (81.1%) | 252 (83.2%) |
| 18 to 24 Years | 571 (90.9%) | 610 (81.7%) |
| 25 to 34 Years | 946 (84.7%) | 730 (63.6%) |
| 35 to 44 Years | 930 (90.9%) | 969 (83.8%) |
| 45 to 54 Years | 1,212 (92.6%) | 1,085 (82.7%) |
| 55 to 64 Years | 1,139 (88.2%) | 1,125 (79.4%) |
| 65 to 74 Years | 962 (96.1%) | 1,178 (92.1%) |
| 75 Years and over | 605 (85.6%) | 674 (73.4%) |
| Total | 7,985 (86.4%) | 7,599 (76.0%) |
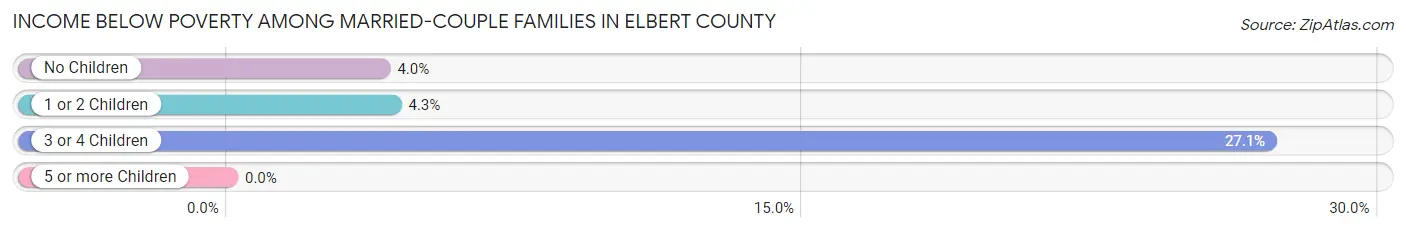
Income Below Poverty Among Married-Couple Families in Elbert County
The poverty statistics for married-couple families in Elbert County show that 6.0% or 227 of the total 3,786 families live below the poverty line. Families with 3 or 4 children have the highest poverty rate of 27.1%, comprising of 86 families. On the other hand, families with no children have the lowest poverty rate of 4.0%, which includes 98 families.
| Children | Above Poverty | Below Poverty |
| No Children | 2,365 (96.0%) | 98 (4.0%) |
| 1 or 2 Children | 963 (95.7%) | 43 (4.3%) |
| 3 or 4 Children | 231 (72.9%) | 86 (27.1%) |
| 5 or more Children | 0 (0.0%) | 0 (0.0%) |
| Total | 3,559 (94.0%) | 227 (6.0%) |
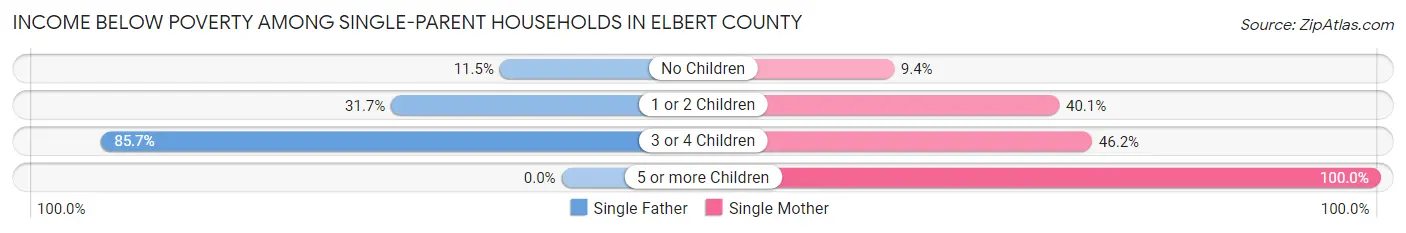
Income Below Poverty Among Single-Parent Households in Elbert County
According to the poverty data in Elbert County, 34.4% or 94 single-father households and 30.5% or 344 single-mother households are living below the poverty line. Among single-father households, those with 3 or 4 children have the highest poverty rate, with 48 households (85.7%) experiencing poverty. Likewise, among single-mother households, those with 5 or more children have the highest poverty rate, with 62 households (100.0%) falling below the poverty line.
| Children | Single Father | Single Mother |
| No Children | 13 (11.5%) | 46 (9.3%) |
| 1 or 2 Children | 33 (31.7%) | 193 (40.1%) |
| 3 or 4 Children | 48 (85.7%) | 43 (46.2%) |
| 5 or more Children | 0 (0.0%) | 62 (100.0%) |
| Total | 94 (34.4%) | 344 (30.5%) |
Income Below Poverty Among Married-Couple vs Single-Parent Households in Elbert County
The poverty data for Elbert County shows that 227 of the married-couple family households (6.0%) and 438 of the single-parent households (31.3%) are living below the poverty level. Within the married-couple family households, those with 3 or 4 children have the highest poverty rate, with 86 households (27.1%) falling below the poverty line. Among the single-parent households, those with 5 or more children have the highest poverty rate, with 62 household (100.0%) living below poverty.
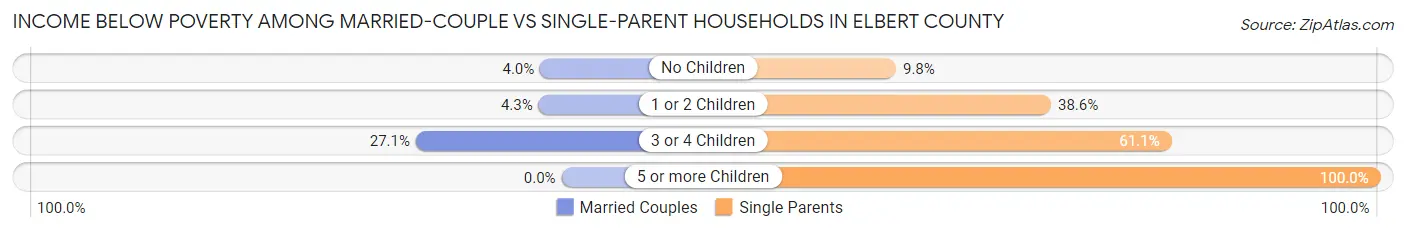
| Children | Married-Couple Families | Single-Parent Households |
| No Children | 98 (4.0%) | 59 (9.8%) |
| 1 or 2 Children | 43 (4.3%) | 226 (38.6%) |
| 3 or 4 Children | 86 (27.1%) | 91 (61.1%) |
| 5 or more Children | 0 (0.0%) | 62 (100.0%) |
| Total | 227 (6.0%) | 438 (31.3%) |
Race in Elbert County
The most populous races in Elbert County are White / Caucasian (12,965 | 66.2%), Black / African American (5,400 | 27.6%), and Hispanic or Latino (1,212 | 6.2%).
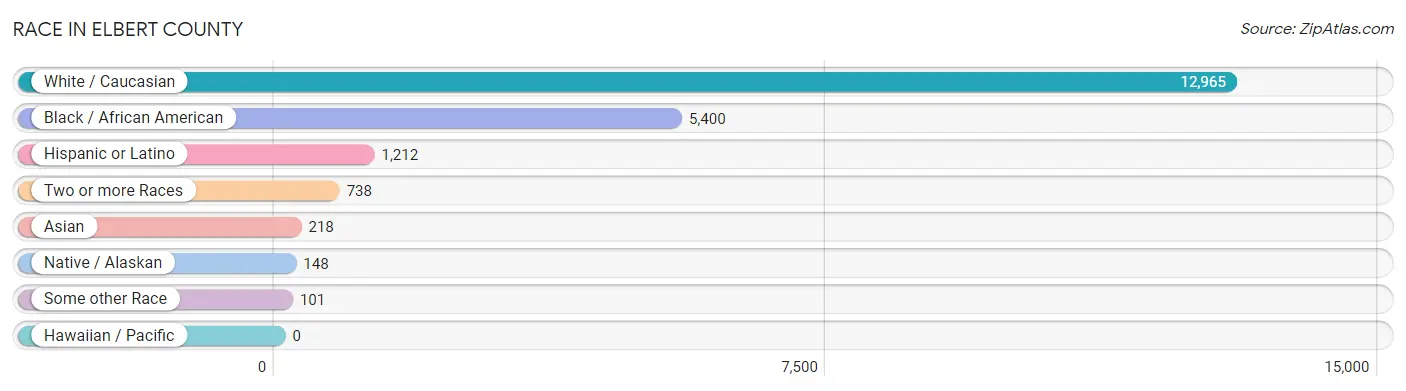
| Race | # Population | % Population |
| Asian | 218 | 1.1% |
| Black / African American | 5,400 | 27.6% |
| Hawaiian / Pacific | 0 | 0.0% |
| Hispanic or Latino | 1,212 | 6.2% |
| Native / Alaskan | 148 | 0.8% |
| White / Caucasian | 12,965 | 66.2% |
| Two or more Races | 738 | 3.8% |
| Some other Race | 101 | 0.5% |
| Total | 19,570 | 100.0% |
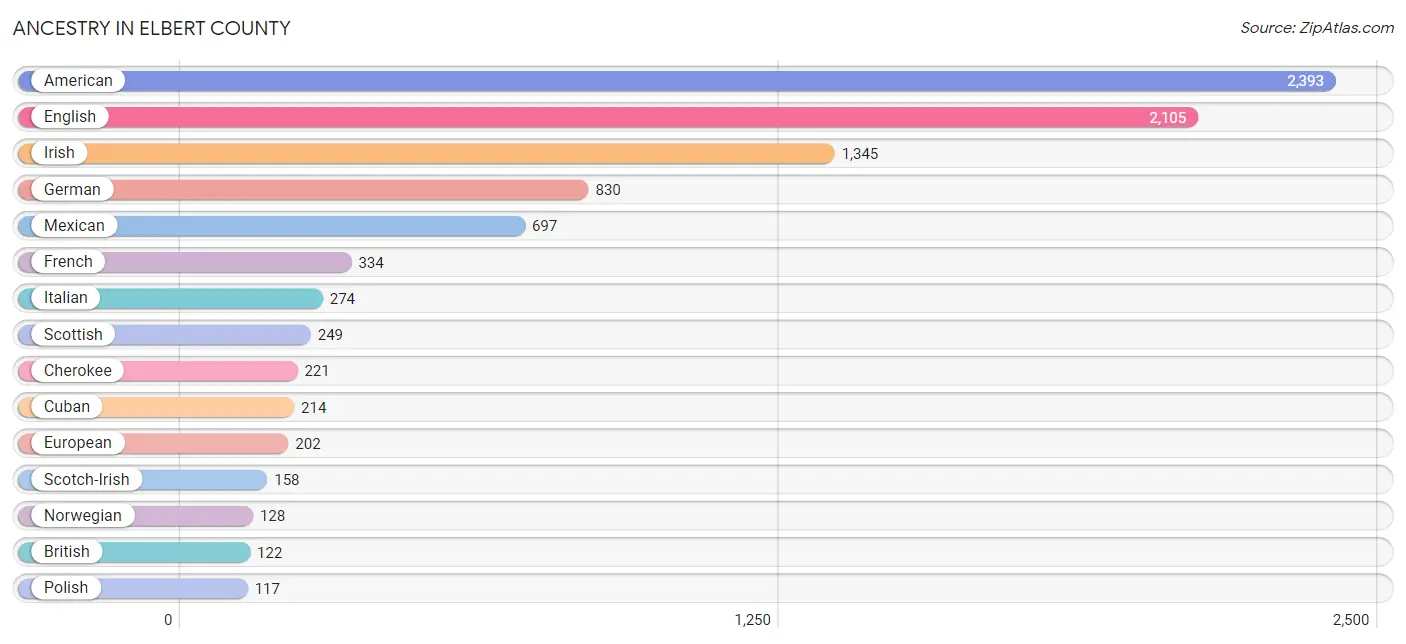
Ancestry in Elbert County
The most populous ancestries reported in Elbert County are American (2,393 | 12.2%), English (2,105 | 10.8%), Irish (1,345 | 6.9%), German (830 | 4.2%), and Mexican (697 | 3.6%), together accounting for 37.7% of all Elbert County residents.
| Ancestry | # Population | % Population |
| African | 59 | 0.3% |
| American | 2,393 | 12.2% |
| Argentinean | 44 | 0.2% |
| Austrian | 15 | 0.1% |
| Bhutanese | 15 | 0.1% |
| British | 122 | 0.6% |
| Burmese | 4 | 0.0% |
| Canadian | 3 | 0.0% |
| Central American | 51 | 0.3% |
| Central American Indian | 11 | 0.1% |
| Cherokee | 221 | 1.1% |
| Choctaw | 6 | 0.0% |
| Colombian | 29 | 0.2% |
| Cuban | 214 | 1.1% |
| Czechoslovakian | 13 | 0.1% |
| Danish | 7 | 0.0% |
| Dominican | 56 | 0.3% |
| Dutch | 4 | 0.0% |
| Eastern European | 49 | 0.3% |
| English | 2,105 | 10.8% |
| European | 202 | 1.0% |
| French | 334 | 1.7% |
| French Canadian | 18 | 0.1% |
| German | 830 | 4.2% |
| Greek | 44 | 0.2% |
| Hungarian | 15 | 0.1% |
| Iranian | 5 | 0.0% |
| Irish | 1,345 | 6.9% |
| Italian | 274 | 1.4% |
| Lithuanian | 7 | 0.0% |
| Lumbee | 43 | 0.2% |
| Mexican | 697 | 3.6% |
| Norwegian | 128 | 0.6% |
| Polish | 117 | 0.6% |
| Puerto Rican | 98 | 0.5% |
| Russian | 60 | 0.3% |
| Salvadoran | 51 | 0.3% |
| Scandinavian | 22 | 0.1% |
| Scotch-Irish | 158 | 0.8% |
| Scottish | 249 | 1.3% |
| Slovak | 9 | 0.1% |
| South American | 73 | 0.4% |
| Sri Lankan | 110 | 0.6% |
| Subsaharan African | 59 | 0.3% |
| Swedish | 86 | 0.4% |
| Thai | 24 | 0.1% |
| Welsh | 41 | 0.2% | View All 47 Rows |
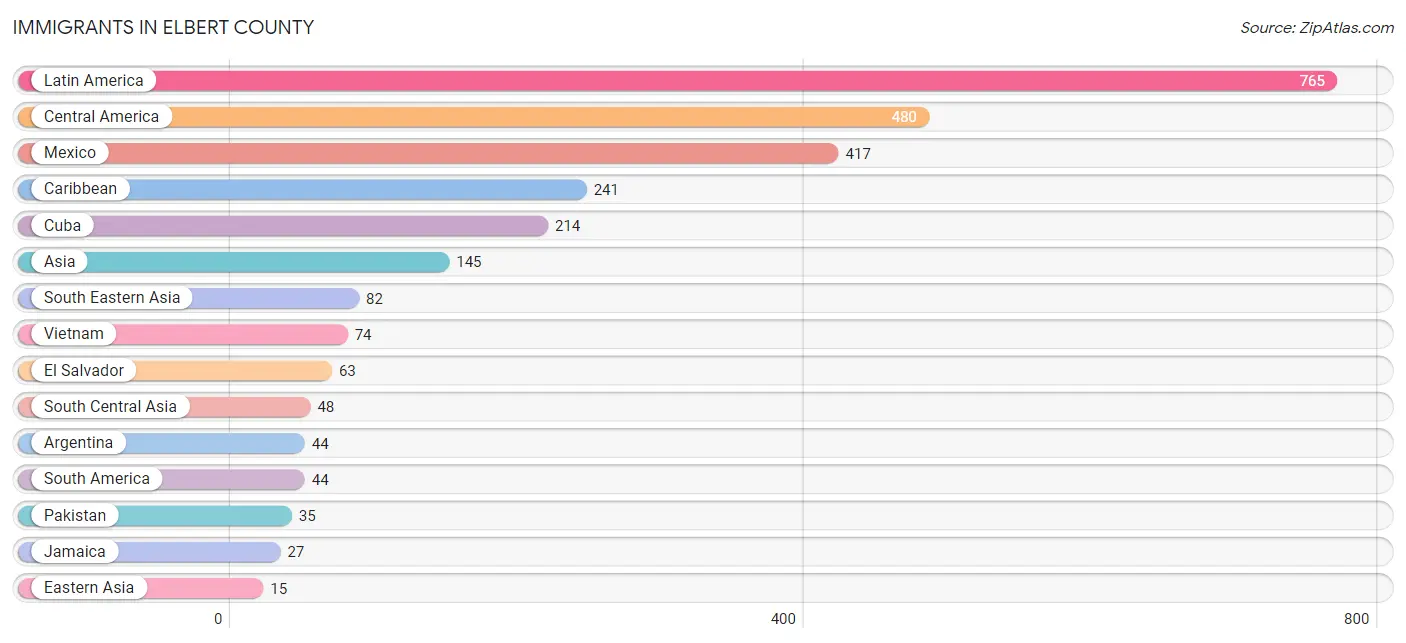
Immigrants in Elbert County
The most numerous immigrant groups reported in Elbert County came from Latin America (765 | 3.9%), Central America (480 | 2.5%), Mexico (417 | 2.1%), Caribbean (241 | 1.2%), and Cuba (214 | 1.1%), together accounting for 10.8% of all Elbert County residents.
| Immigration Origin | # Population | % Population |
| Argentina | 44 | 0.2% |
| Asia | 145 | 0.7% |
| Canada | 6 | 0.0% |
| Caribbean | 241 | 1.2% |
| Central America | 480 | 2.5% |
| Cuba | 214 | 1.1% |
| Eastern Asia | 15 | 0.1% |
| El Salvador | 63 | 0.3% |
| England | 9 | 0.1% |
| Europe | 9 | 0.1% |
| India | 8 | 0.0% |
| Iran | 5 | 0.0% |
| Jamaica | 27 | 0.1% |
| Japan | 15 | 0.1% |
| Latin America | 765 | 3.9% |
| Mexico | 417 | 2.1% |
| Northern Europe | 9 | 0.1% |
| Pakistan | 35 | 0.2% |
| Philippines | 8 | 0.0% |
| South America | 44 | 0.2% |
| South Central Asia | 48 | 0.3% |
| South Eastern Asia | 82 | 0.4% |
| Vietnam | 74 | 0.4% | View All 23 Rows |
Sex and Age in Elbert County
Sex and Age in Elbert County
The most populous age groups in Elbert County are 50 to 54 Years (826 | 8.8%) for men and 60 to 64 Years (876 | 8.6%) for women.
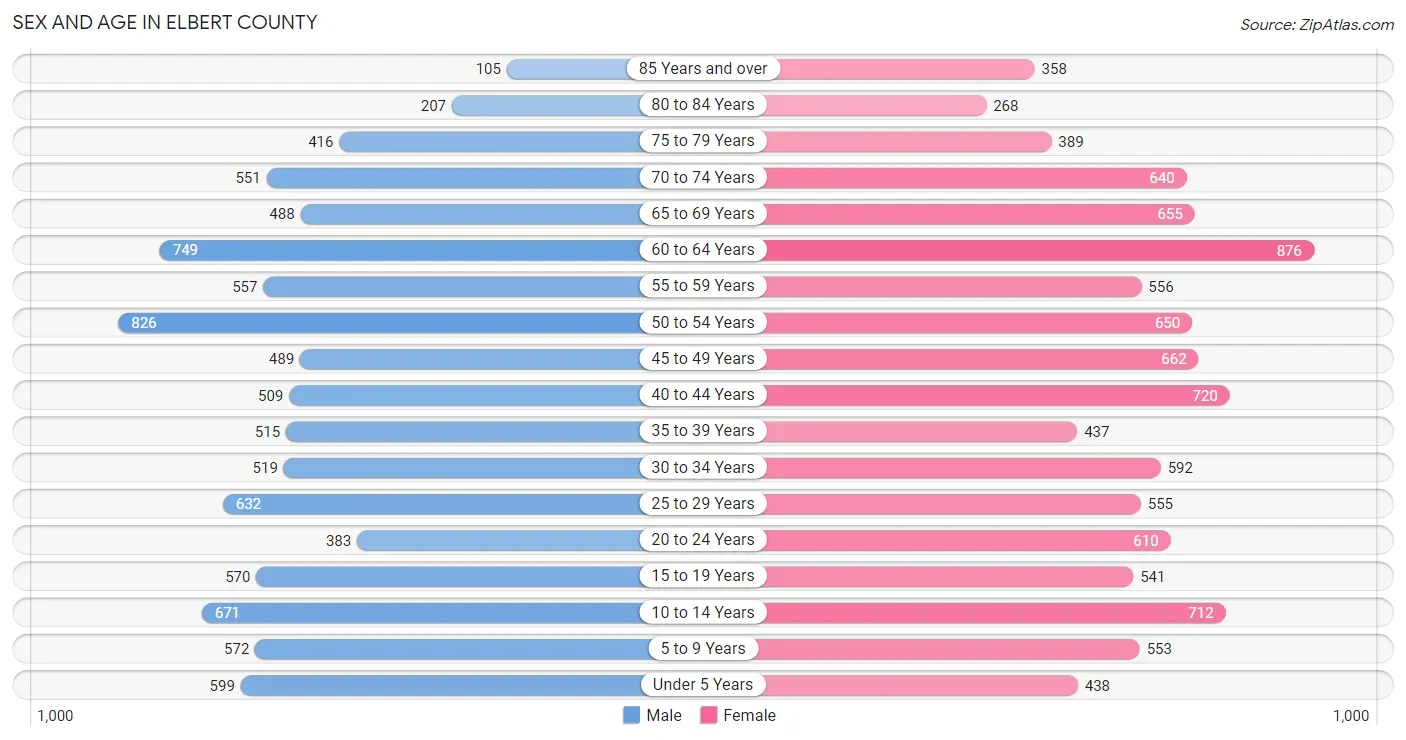
| Age Bracket | Male | Female |
| Under 5 Years | 599 (6.4%) | 438 (4.3%) |
| 5 to 9 Years | 572 (6.1%) | 553 (5.4%) |
| 10 to 14 Years | 671 (7.2%) | 712 (7.0%) |
| 15 to 19 Years | 570 (6.1%) | 541 (5.3%) |
| 20 to 24 Years | 383 (4.1%) | 610 (6.0%) |
| 25 to 29 Years | 632 (6.8%) | 555 (5.4%) |
| 30 to 34 Years | 519 (5.6%) | 592 (5.8%) |
| 35 to 39 Years | 515 (5.5%) | 437 (4.3%) |
| 40 to 44 Years | 509 (5.4%) | 720 (7.0%) |
| 45 to 49 Years | 489 (5.2%) | 662 (6.5%) |
| 50 to 54 Years | 826 (8.8%) | 650 (6.4%) |
| 55 to 59 Years | 557 (5.9%) | 556 (5.4%) |
| 60 to 64 Years | 749 (8.0%) | 876 (8.6%) |
| 65 to 69 Years | 488 (5.2%) | 655 (6.4%) |
| 70 to 74 Years | 551 (5.9%) | 640 (6.3%) |
| 75 to 79 Years | 416 (4.4%) | 389 (3.8%) |
| 80 to 84 Years | 207 (2.2%) | 268 (2.6%) |
| 85 Years and over | 105 (1.1%) | 358 (3.5%) |
| Total | 9,358 (100.0%) | 10,212 (100.0%) |
Families and Households in Elbert County
Median Family Size in Elbert County
The median family size in Elbert County is 3.04 persons per family, with single female/mother families (1,128 | 21.7%) accounting for the largest median family size of 3.32 persons per family. On the other hand, married-couple families (3,786 | 73.0%) represent the smallest median family size with 2.94 persons per family.
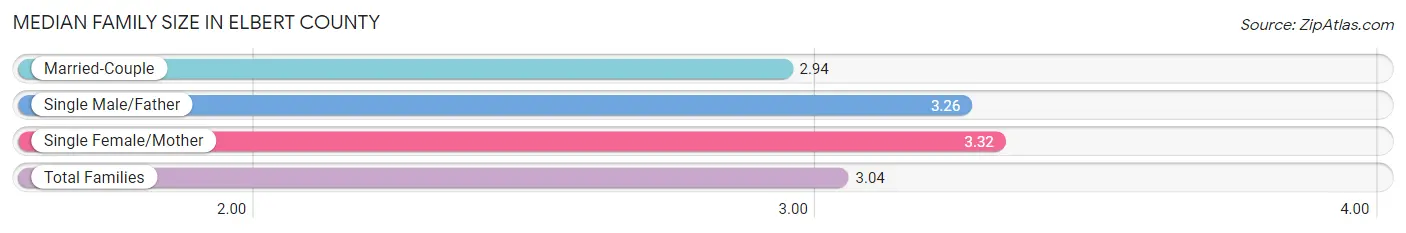
| Family Type | # Families | Family Size |
| Married-Couple | 3,786 (73.0%) | 2.94 |
| Single Male/Father | 273 (5.3%) | 3.26 |
| Single Female/Mother | 1,128 (21.7%) | 3.32 |
| Total Families | 5,187 (100.0%) | 3.04 |
Median Household Size in Elbert County
The median household size in Elbert County is 2.45 persons per household, with single male/father households (273 | 3.5%) accounting for the largest median household size of 3.8 persons per household. non-family households (2,686 | 34.1%) represent the smallest median household size with 1.19 persons per household.
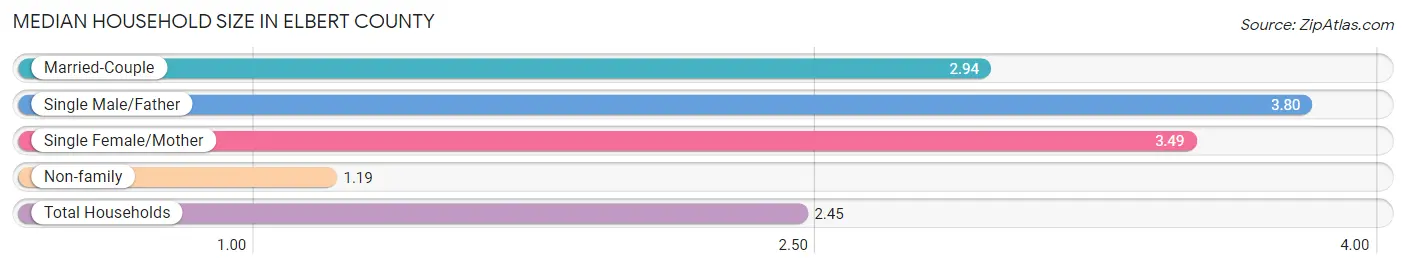
| Household Type | # Households | Household Size |
| Married-Couple | 3,786 (48.1%) | 2.94 |
| Single Male/Father | 273 (3.5%) | 3.80 |
| Single Female/Mother | 1,128 (14.3%) | 3.49 |
| Non-family | 2,686 (34.1%) | 1.19 |
| Total Households | 7,873 (100.0%) | 2.45 |
Household Size by Marriage Status in Elbert County
Out of a total of 7,873 households in Elbert County, 5,187 (65.9%) are family households, while 2,686 (34.1%) are nonfamily households. The most numerous type of family households are 2-person households, comprising 2,702, and the most common type of nonfamily households are 1-person households, comprising 2,263.
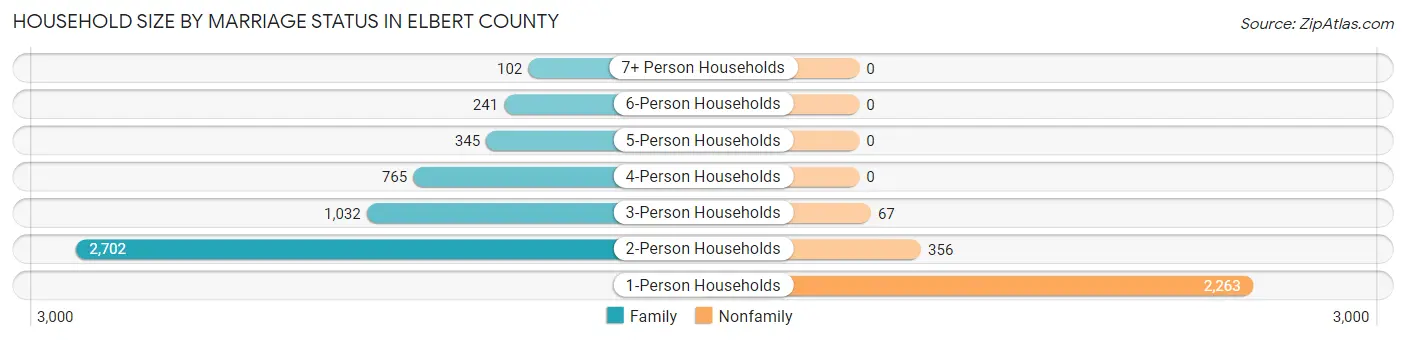
| Household Size | Family Households | Nonfamily Households |
| 1-Person Households | - | 2,263 (28.7%) |
| 2-Person Households | 2,702 (34.3%) | 356 (4.5%) |
| 3-Person Households | 1,032 (13.1%) | 67 (0.9%) |
| 4-Person Households | 765 (9.7%) | 0 (0.0%) |
| 5-Person Households | 345 (4.4%) | 0 (0.0%) |
| 6-Person Households | 241 (3.1%) | 0 (0.0%) |
| 7+ Person Households | 102 (1.3%) | 0 (0.0%) |
| Total | 5,187 (65.9%) | 2,686 (34.1%) |
Female Fertility in Elbert County
Fertility by Age in Elbert County
Average fertility rate in Elbert County is 46.0 births per 1,000 women. Women in the age bracket of 20 to 34 years have the highest fertility rate with 93.0 births per 1,000 women. Women in the age bracket of 20 to 34 years acount for 84.5% of all women with births.
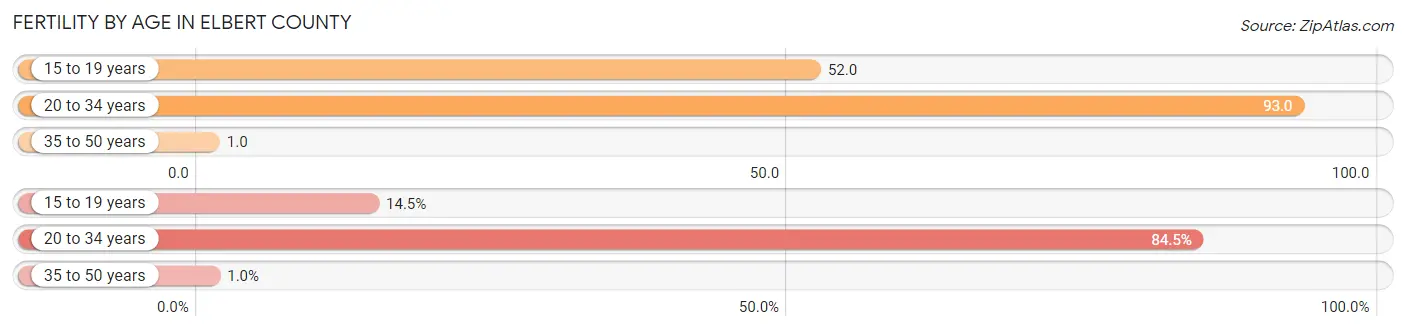
| Age Bracket | Women with Births | Births / 1,000 Women |
| 15 to 19 years | 28 (14.5%) | 52.0 |
| 20 to 34 years | 163 (84.5%) | 93.0 |
| 35 to 50 years | 2 (1.0%) | 1.0 |
| Total | 193 (100.0%) | 46.0 |
Fertility by Age by Marriage Status in Elbert County
61.1% of women with births (193) in Elbert County are married. The highest percentage of unmarried women with births falls into 15 to 19 years age bracket with 100.0% of them unmarried at the time of birth, while the lowest percentage of unmarried women with births belong to 35 to 50 years age bracket with 0.0% of them unmarried.
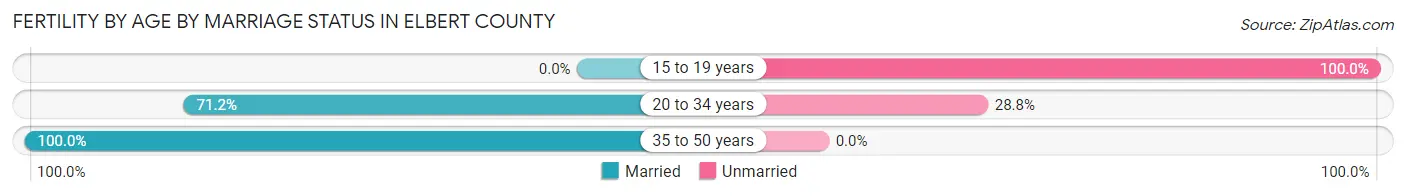
| Age Bracket | Married | Unmarried |
| 15 to 19 years | 0 (0.0%) | 28 (100.0%) |
| 20 to 34 years | 116 (71.2%) | 47 (28.8%) |
| 35 to 50 years | 2 (100.0%) | 0 (0.0%) |
| Total | 118 (61.1%) | 75 (38.9%) |
Fertility by Education in Elbert County
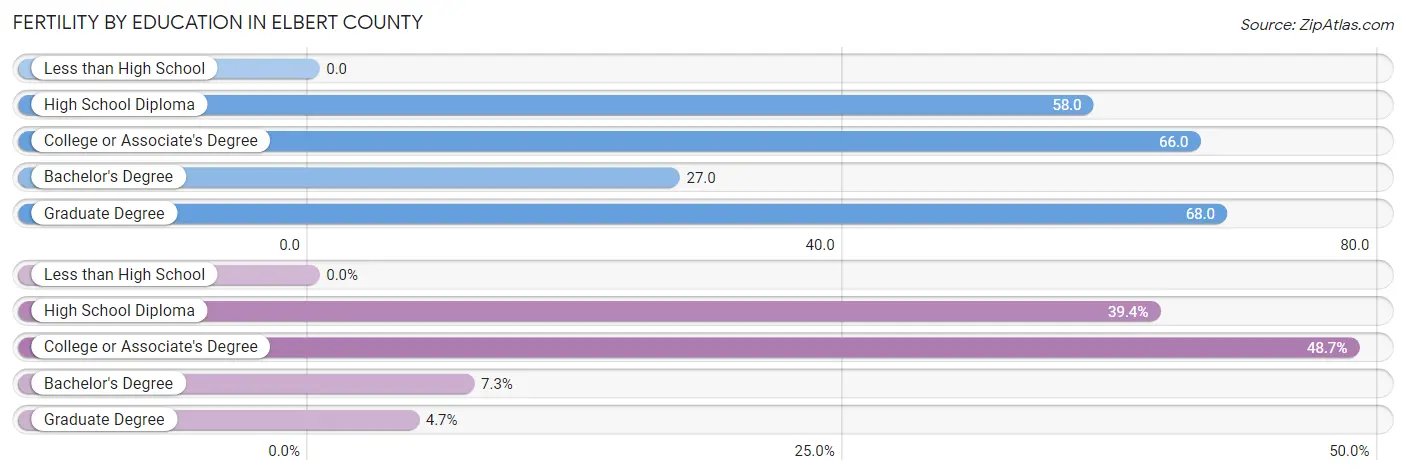
| Educational Attainment | Women with Births | Births / 1,000 Women |
| Less than High School | 0 (0.0%) | 0.0 |
| High School Diploma | 76 (39.4%) | 58.0 |
| College or Associate's Degree | 94 (48.7%) | 66.0 |
| Bachelor's Degree | 14 (7.2%) | 27.0 |
| Graduate Degree | 9 (4.7%) | 68.0 |
| Total | 193 (100.0%) | 46.0 |
Fertility by Education by Marriage Status in Elbert County
38.9% of women with births in Elbert County are unmarried. Women with the educational attainment of bachelor's degree are most likely to be married with 100.0% of them married at childbirth, while women with the educational attainment of high school diploma are least likely to be married with 63.2% of them unmarried at childbirth.
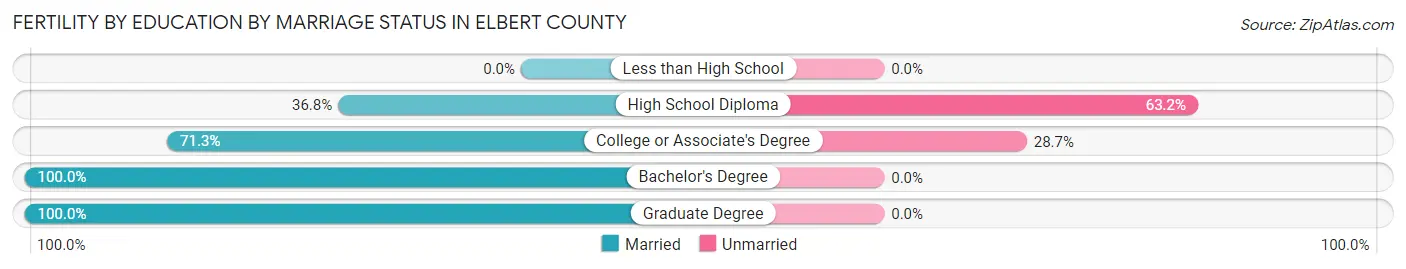
| Educational Attainment | Married | Unmarried |
| Less than High School | 0 (0.0%) | 0 (0.0%) |
| High School Diploma | 28 (36.8%) | 48 (63.2%) |
| College or Associate's Degree | 67 (71.3%) | 27 (28.7%) |
| Bachelor's Degree | 14 (100.0%) | 0 (0.0%) |
| Graduate Degree | 9 (100.0%) | 0 (0.0%) |
| Total | 118 (61.1%) | 75 (38.9%) |
Employment Characteristics in Elbert County
Employment by Class of Employer in Elbert County
Among the 8,440 employed individuals in Elbert County, private company employees (5,665 | 67.1%), local government employees (823 | 9.8%), and self-employed (not incorporated) (713 | 8.5%) make up the most common classes of employment.
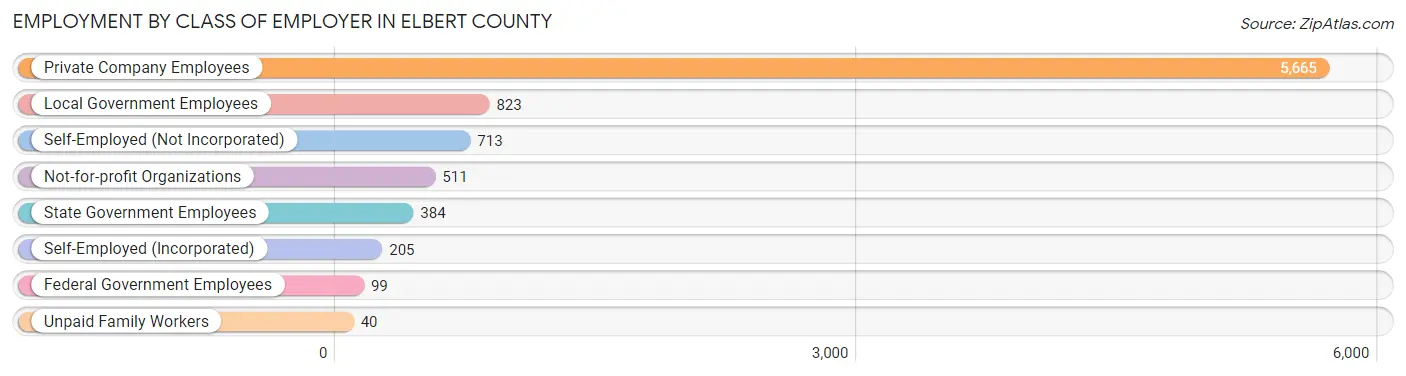
| Employer Class | # Employees | % Employees |
| Private Company Employees | 5,665 | 67.1% |
| Self-Employed (Incorporated) | 205 | 2.4% |
| Self-Employed (Not Incorporated) | 713 | 8.5% |
| Not-for-profit Organizations | 511 | 6.0% |
| Local Government Employees | 823 | 9.8% |
| State Government Employees | 384 | 4.5% |
| Federal Government Employees | 99 | 1.2% |
| Unpaid Family Workers | 40 | 0.5% |
| Total | 8,440 | 100.0% |
Employment Status by Age in Elbert County
According to the labor force statistics for Elbert County, out of the total population over 16 years of age (15,810), 58.3% or 9,217 individuals are in the labor force, with 7.5% or 691 of them unemployed. The age group with the highest labor force participation rate is 20 to 24 years, with 91.2% or 906 individuals in the labor force. Within the labor force, the 25 to 29 years age range has the highest percentage of unemployed individuals, with 24.8% or 250 of them being unemployed.
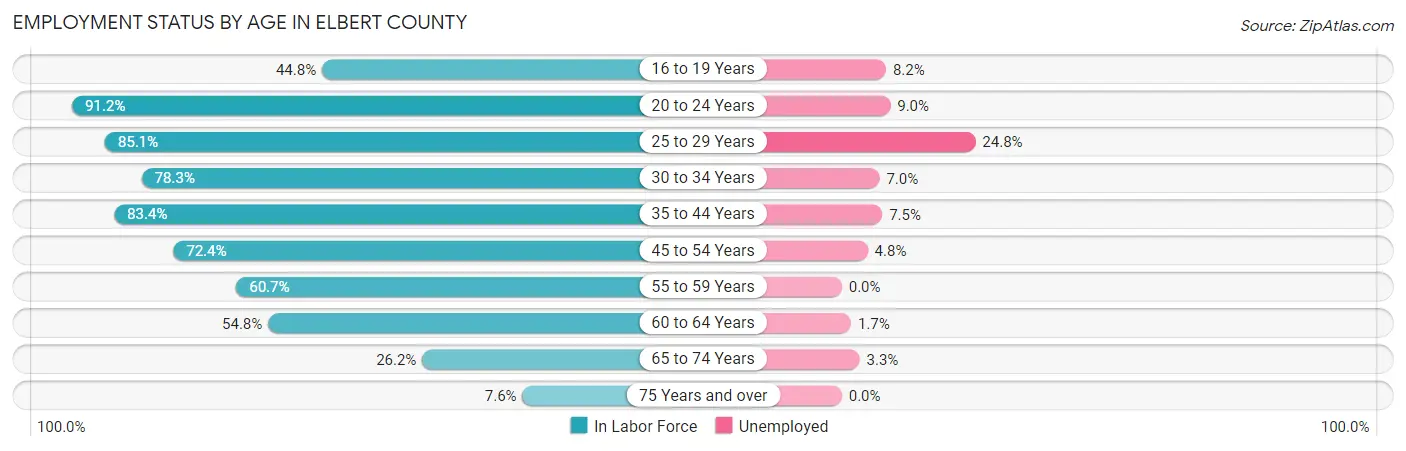
| Age Bracket | In Labor Force | Unemployed |
| 16 to 19 Years | 401 (44.8%) | 33 (8.2%) |
| 20 to 24 Years | 906 (91.2%) | 82 (9.0%) |
| 25 to 29 Years | 1,010 (85.1%) | 250 (24.8%) |
| 30 to 34 Years | 870 (78.3%) | 61 (7.0%) |
| 35 to 44 Years | 1,819 (83.4%) | 136 (7.5%) |
| 45 to 54 Years | 1,902 (72.4%) | 91 (4.8%) |
| 55 to 59 Years | 676 (60.7%) | 0 (0.0%) |
| 60 to 64 Years | 890 (54.8%) | 15 (1.7%) |
| 65 to 74 Years | 612 (26.2%) | 20 (3.3%) |
| 75 Years and over | 132 (7.6%) | 0 (0.0%) |
| Total | 9,217 (58.3%) | 691 (7.5%) |
Employment Status by Educational Attainment in Elbert County
According to labor force statistics for Elbert County, 72.8% of individuals (7,166) out of the total population between 25 and 64 years of age (9,844) are in the labor force, with 7.7% or 552 of them being unemployed. The group with the highest labor force participation rate are those with the educational attainment of bachelor's degree or higher, with 86.2% or 1,315 individuals in the labor force. Within the labor force, individuals with less than high school education have the highest percentage of unemployment, with 16.6% or 152 of them being unemployed.
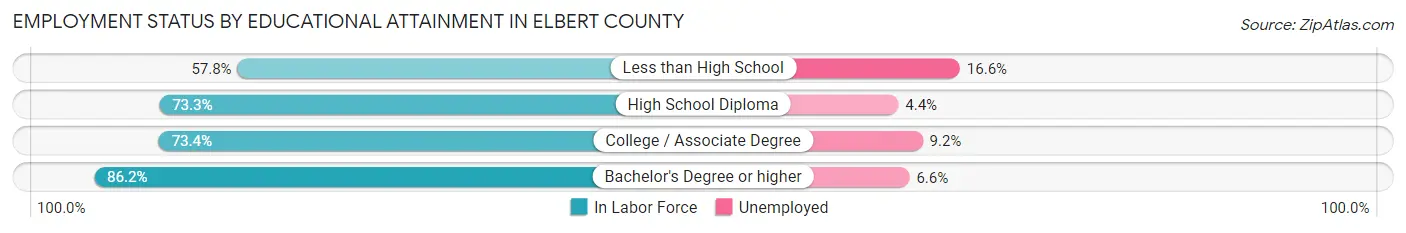
| Educational Attainment | In Labor Force | Unemployed |
| Less than High School | 917 (57.8%) | 263 (16.6%) |
| High School Diploma | 2,917 (73.3%) | 175 (4.4%) |
| College / Associate Degree | 2,021 (73.4%) | 253 (9.2%) |
| Bachelor's Degree or higher | 1,315 (86.2%) | 101 (6.6%) |
| Total | 7,166 (72.8%) | 758 (7.7%) |
Employment Occupations by Sex in Elbert County
Management, Business, Science and Arts Occupations
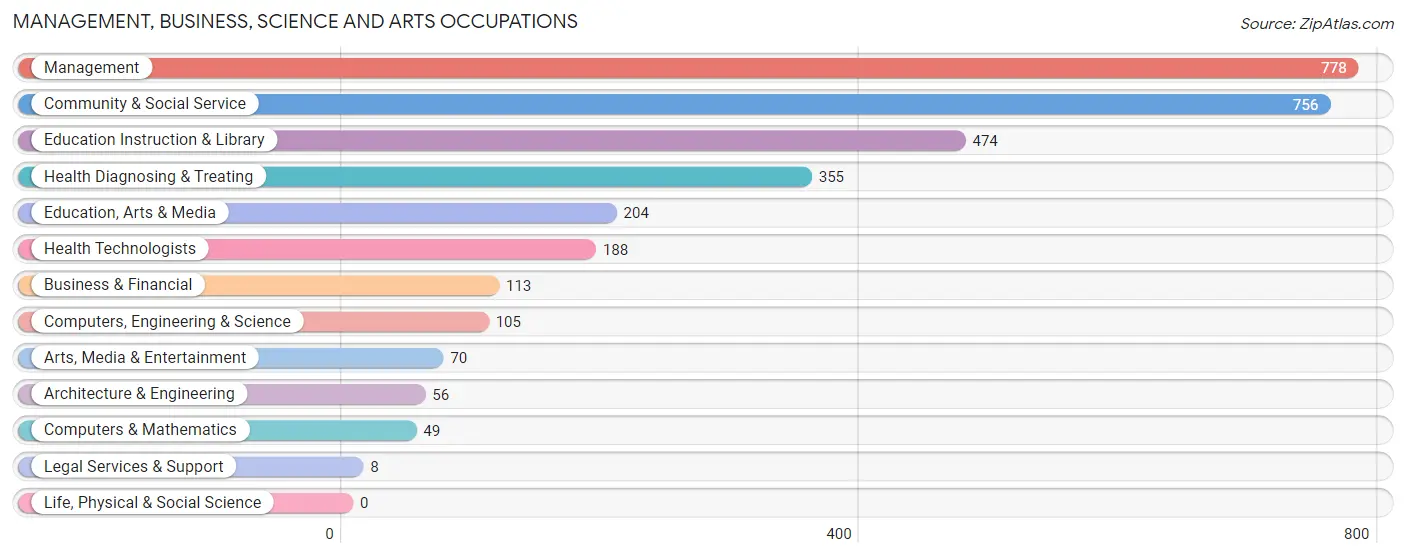
The most common Management, Business, Science and Arts occupations in Elbert County are Management (778 | 9.1%), Community & Social Service (756 | 8.9%), Education Instruction & Library (474 | 5.6%), Health Diagnosing & Treating (355 | 4.2%), and Education, Arts & Media (204 | 2.4%).
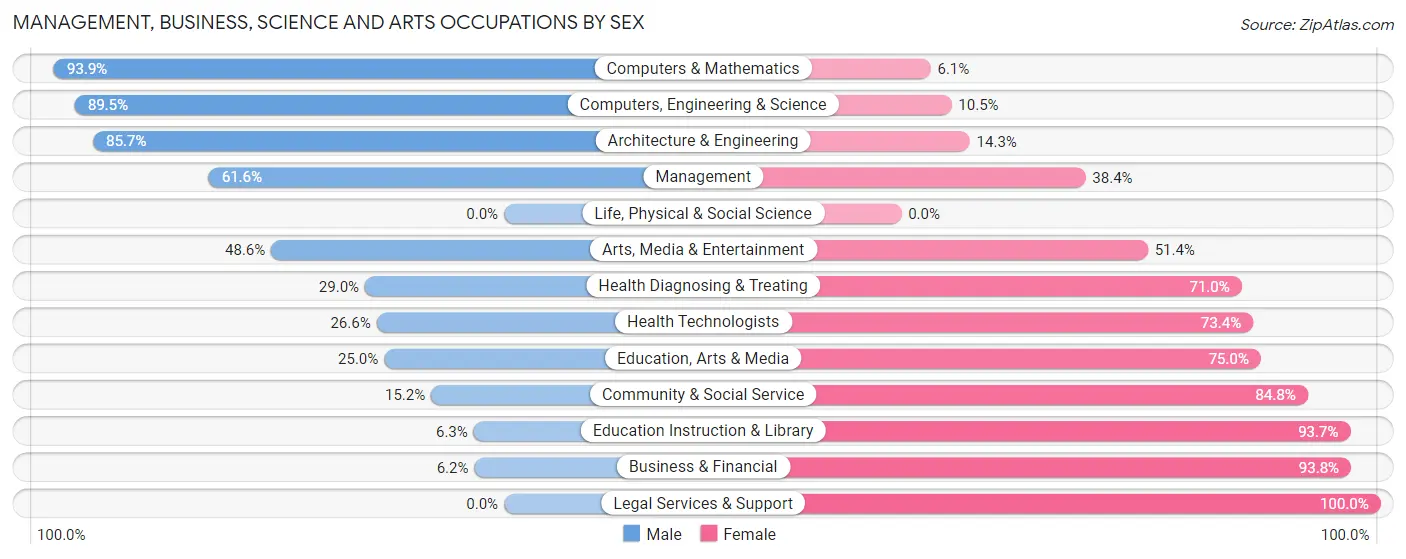
Management, Business, Science and Arts Occupations by Sex
Within the Management, Business, Science and Arts occupations in Elbert County, the most male-oriented occupations are Computers & Mathematics (93.9%), Computers, Engineering & Science (89.5%), and Architecture & Engineering (85.7%), while the most female-oriented occupations are Legal Services & Support (100.0%), Business & Financial (93.8%), and Education Instruction & Library (93.7%).
| Occupation | Male | Female |
| Management | 479 (61.6%) | 299 (38.4%) |
| Business & Financial | 7 (6.2%) | 106 (93.8%) |
| Computers, Engineering & Science | 94 (89.5%) | 11 (10.5%) |
| Computers & Mathematics | 46 (93.9%) | 3 (6.1%) |
| Architecture & Engineering | 48 (85.7%) | 8 (14.3%) |
| Life, Physical & Social Science | 0 (0.0%) | 0 (0.0%) |
| Community & Social Service | 115 (15.2%) | 641 (84.8%) |
| Education, Arts & Media | 51 (25.0%) | 153 (75.0%) |
| Legal Services & Support | 0 (0.0%) | 8 (100.0%) |
| Education Instruction & Library | 30 (6.3%) | 444 (93.7%) |
| Arts, Media & Entertainment | 34 (48.6%) | 36 (51.4%) |
| Health Diagnosing & Treating | 103 (29.0%) | 252 (71.0%) |
| Health Technologists | 50 (26.6%) | 138 (73.4%) |
| Total (Category) | 798 (37.9%) | 1,309 (62.1%) |
| Total (Overall) | 4,499 (52.8%) | 4,015 (47.2%) |
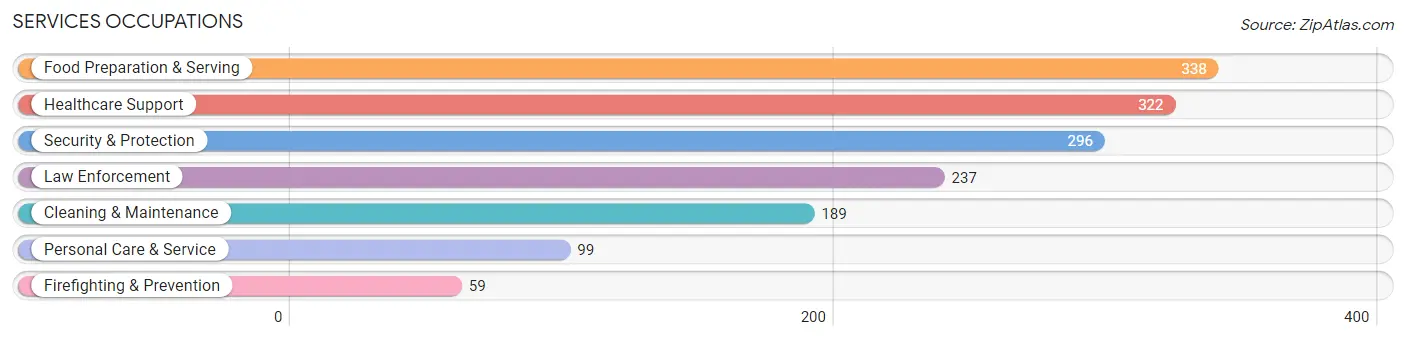
Services Occupations
The most common Services occupations in Elbert County are Food Preparation & Serving (338 | 4.0%), Healthcare Support (322 | 3.8%), Security & Protection (296 | 3.5%), Law Enforcement (237 | 2.8%), and Cleaning & Maintenance (189 | 2.2%).
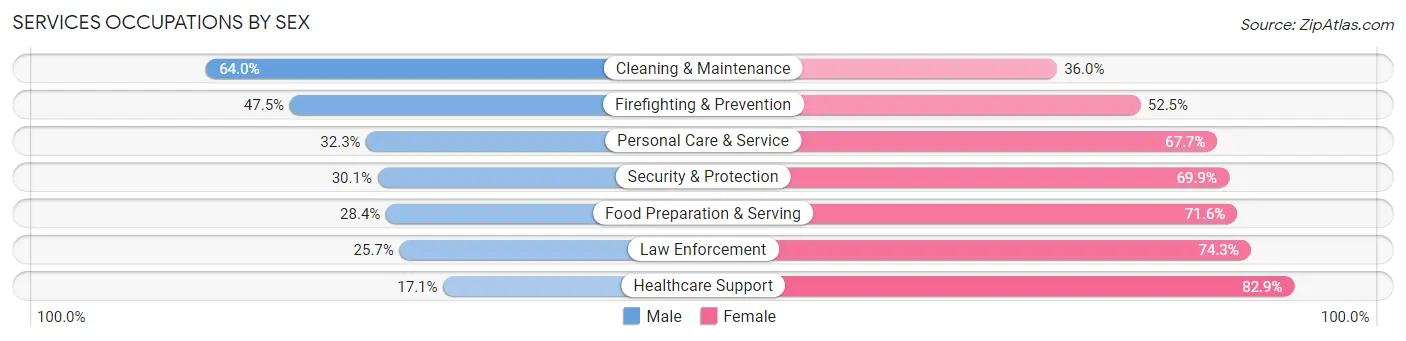
Services Occupations by Sex
Within the Services occupations in Elbert County, the most male-oriented occupations are Cleaning & Maintenance (64.0%), Firefighting & Prevention (47.5%), and Personal Care & Service (32.3%), while the most female-oriented occupations are Healthcare Support (82.9%), Law Enforcement (74.3%), and Food Preparation & Serving (71.6%).
| Occupation | Male | Female |
| Healthcare Support | 55 (17.1%) | 267 (82.9%) |
| Security & Protection | 89 (30.1%) | 207 (69.9%) |
| Firefighting & Prevention | 28 (47.5%) | 31 (52.5%) |
| Law Enforcement | 61 (25.7%) | 176 (74.3%) |
| Food Preparation & Serving | 96 (28.4%) | 242 (71.6%) |
| Cleaning & Maintenance | 121 (64.0%) | 68 (36.0%) |
| Personal Care & Service | 32 (32.3%) | 67 (67.7%) |
| Total (Category) | 393 (31.6%) | 851 (68.4%) |
| Total (Overall) | 4,499 (52.8%) | 4,015 (47.2%) |
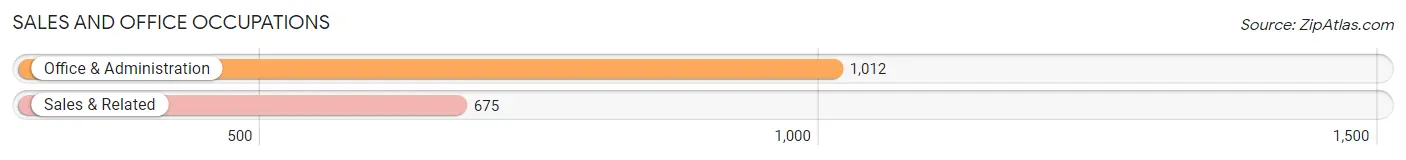
Sales and Office Occupations
The most common Sales and Office occupations in Elbert County are Office & Administration (1,012 | 11.9%), and Sales & Related (675 | 7.9%).
Sales and Office Occupations by Sex
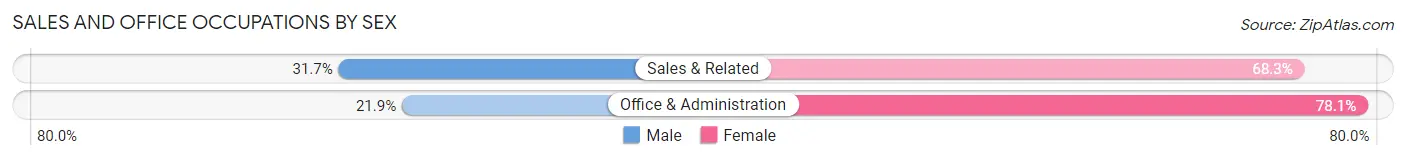
| Occupation | Male | Female |
| Sales & Related | 214 (31.7%) | 461 (68.3%) |
| Office & Administration | 222 (21.9%) | 790 (78.1%) |
| Total (Category) | 436 (25.8%) | 1,251 (74.2%) |
| Total (Overall) | 4,499 (52.8%) | 4,015 (47.2%) |
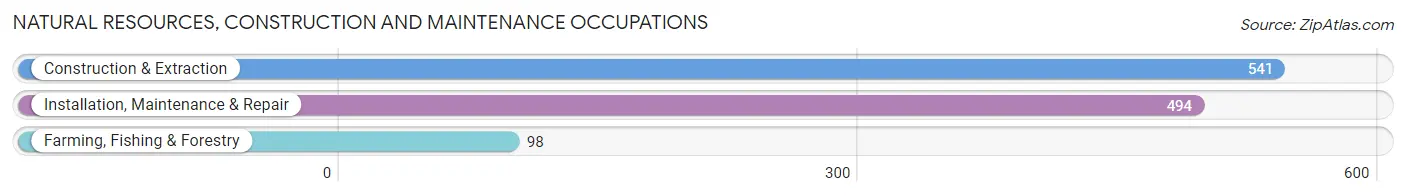
Natural Resources, Construction and Maintenance Occupations
The most common Natural Resources, Construction and Maintenance occupations in Elbert County are Construction & Extraction (541 | 6.4%), Installation, Maintenance & Repair (494 | 5.8%), and Farming, Fishing & Forestry (98 | 1.1%).
Natural Resources, Construction and Maintenance Occupations by Sex
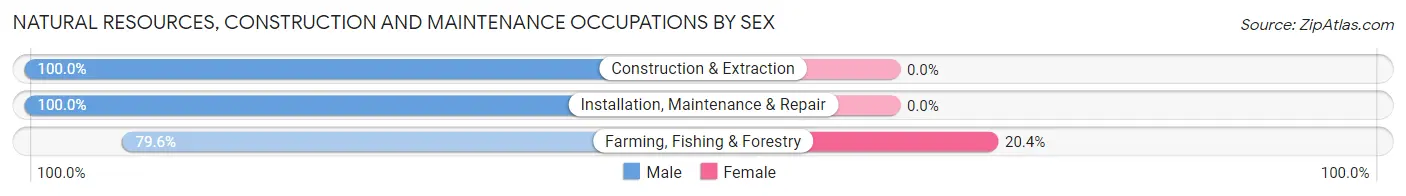
| Occupation | Male | Female |
| Farming, Fishing & Forestry | 78 (79.6%) | 20 (20.4%) |
| Construction & Extraction | 541 (100.0%) | 0 (0.0%) |
| Installation, Maintenance & Repair | 494 (100.0%) | 0 (0.0%) |
| Total (Category) | 1,113 (98.2%) | 20 (1.8%) |
| Total (Overall) | 4,499 (52.8%) | 4,015 (47.2%) |
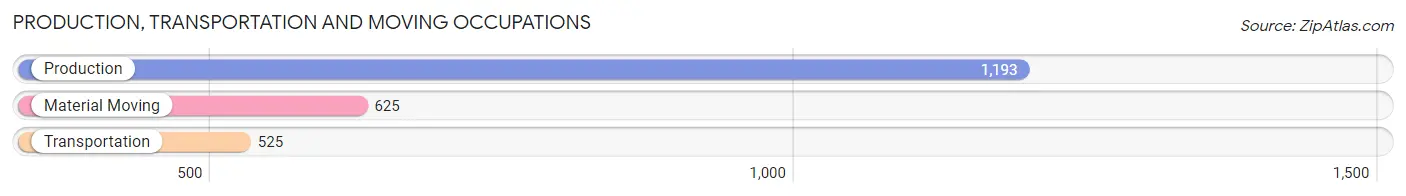
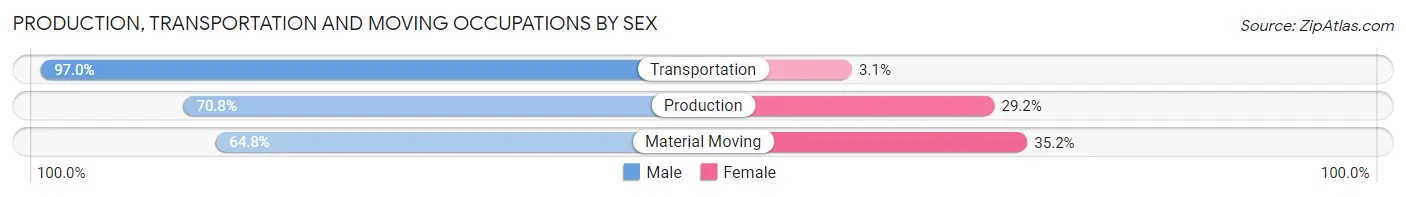
Production, Transportation and Moving Occupations
The most common Production, Transportation and Moving occupations in Elbert County are Production (1,193 | 14.0%), Material Moving (625 | 7.3%), and Transportation (525 | 6.2%).
Production, Transportation and Moving Occupations by Sex
| Occupation | Male | Female |
| Production | 845 (70.8%) | 348 (29.2%) |
| Transportation | 509 (97.0%) | 16 (3.0%) |
| Material Moving | 405 (64.8%) | 220 (35.2%) |
| Total (Category) | 1,759 (75.1%) | 584 (24.9%) |
| Total (Overall) | 4,499 (52.8%) | 4,015 (47.2%) |
Employment Industries by Sex in Elbert County
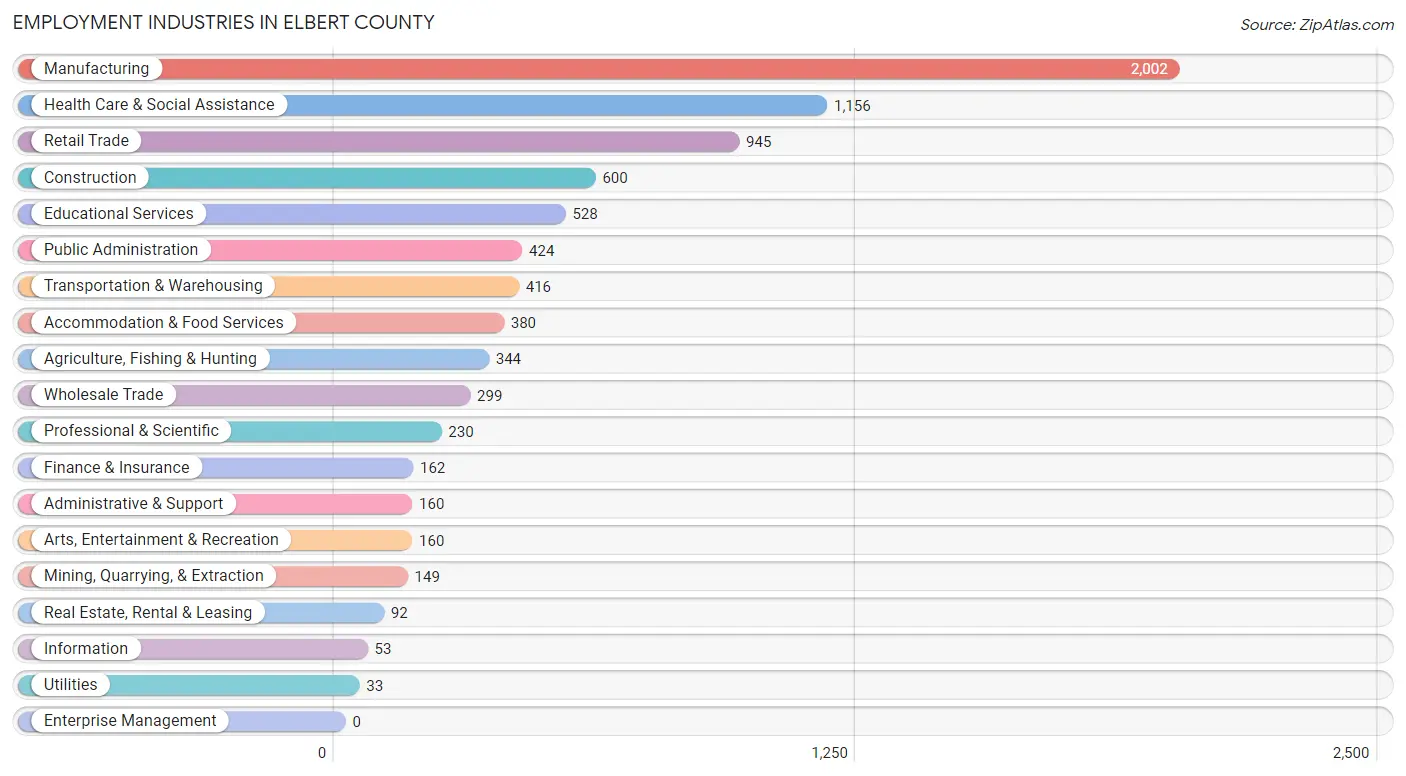
Employment Industries in Elbert County
The major employment industries in Elbert County include Manufacturing (2,002 | 23.5%), Health Care & Social Assistance (1,156 | 13.6%), Retail Trade (945 | 11.1%), Construction (600 | 7.0%), and Educational Services (528 | 6.2%).
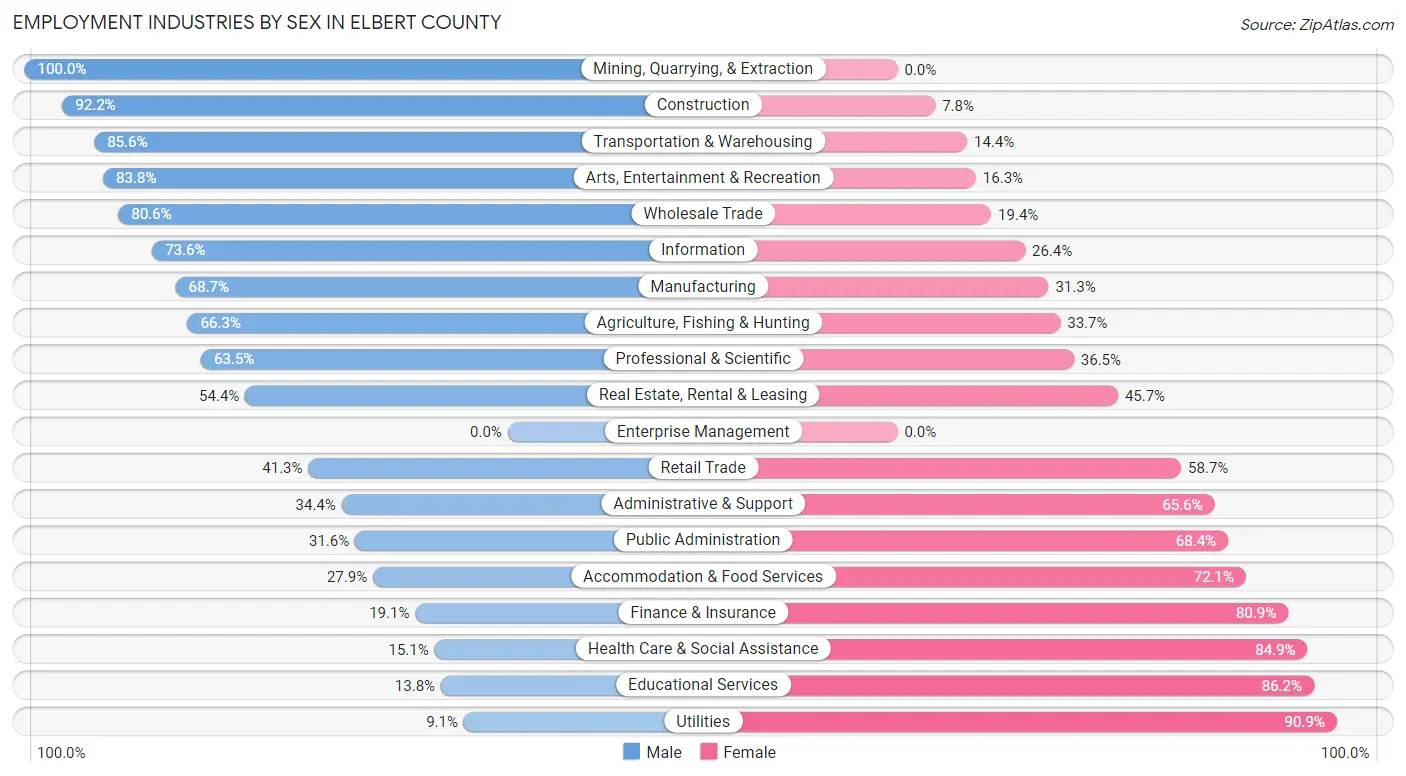
Employment Industries by Sex in Elbert County
The Elbert County industries that see more men than women are Mining, Quarrying, & Extraction (100.0%), Construction (92.2%), and Transportation & Warehousing (85.6%), whereas the industries that tend to have a higher number of women are Utilities (90.9%), Educational Services (86.2%), and Health Care & Social Assistance (84.9%).
| Industry | Male | Female |
| Agriculture, Fishing & Hunting | 228 (66.3%) | 116 (33.7%) |
| Mining, Quarrying, & Extraction | 149 (100.0%) | 0 (0.0%) |
| Construction | 553 (92.2%) | 47 (7.8%) |
| Manufacturing | 1,376 (68.7%) | 626 (31.3%) |
| Wholesale Trade | 241 (80.6%) | 58 (19.4%) |
| Retail Trade | 390 (41.3%) | 555 (58.7%) |
| Transportation & Warehousing | 356 (85.6%) | 60 (14.4%) |
| Utilities | 3 (9.1%) | 30 (90.9%) |
| Information | 39 (73.6%) | 14 (26.4%) |
| Finance & Insurance | 31 (19.1%) | 131 (80.9%) |
| Real Estate, Rental & Leasing | 50 (54.3%) | 42 (45.7%) |
| Professional & Scientific | 146 (63.5%) | 84 (36.5%) |
| Enterprise Management | 0 (0.0%) | 0 (0.0%) |
| Administrative & Support | 55 (34.4%) | 105 (65.6%) |
| Educational Services | 73 (13.8%) | 455 (86.2%) |
| Health Care & Social Assistance | 175 (15.1%) | 981 (84.9%) |
| Arts, Entertainment & Recreation | 134 (83.8%) | 26 (16.3%) |
| Accommodation & Food Services | 106 (27.9%) | 274 (72.1%) |
| Public Administration | 134 (31.6%) | 290 (68.4%) |
| Total | 4,499 (52.8%) | 4,015 (47.2%) |
Education in Elbert County
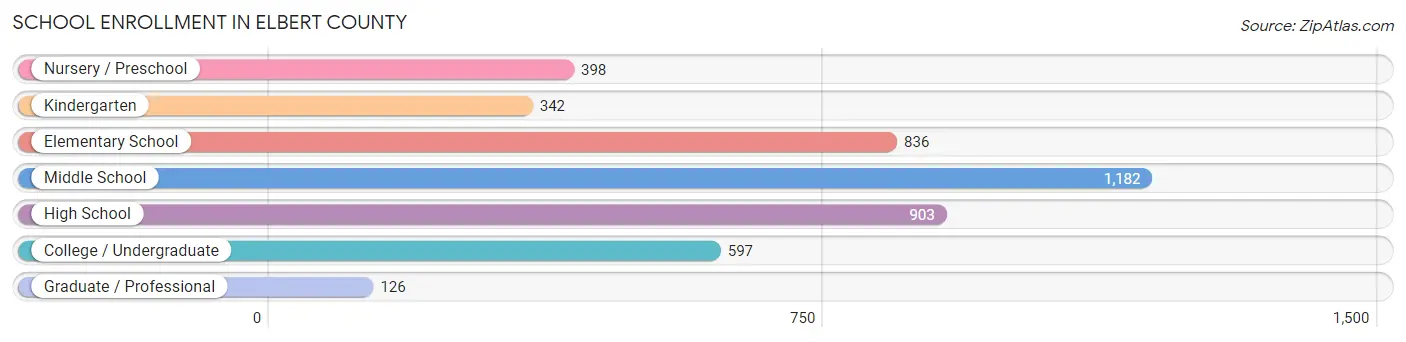
School Enrollment in Elbert County
The most common levels of schooling among the 4,384 students in Elbert County are middle school (1,182 | 27.0%), high school (903 | 20.6%), and elementary school (836 | 19.1%).
| School Level | # Students | % Students |
| Nursery / Preschool | 398 | 9.1% |
| Kindergarten | 342 | 7.8% |
| Elementary School | 836 | 19.1% |
| Middle School | 1,182 | 27.0% |
| High School | 903 | 20.6% |
| College / Undergraduate | 597 | 13.6% |
| Graduate / Professional | 126 | 2.9% |
| Total | 4,384 | 100.0% |
School Enrollment by Age by Funding Source in Elbert County
Out of a total of 4,384 students who are enrolled in schools in Elbert County, 412 (9.4%) attend a private institution, while the remaining 3,972 (90.6%) are enrolled in public schools. The age group of 20 to 24 year olds has the highest likelihood of being enrolled in private schools, with 48 (20.6% in the age bracket) enrolled. Conversely, the age group of 25 to 34 year olds has the lowest likelihood of being enrolled in a private school, with 265 (97.8% in the age bracket) attending a public institution.
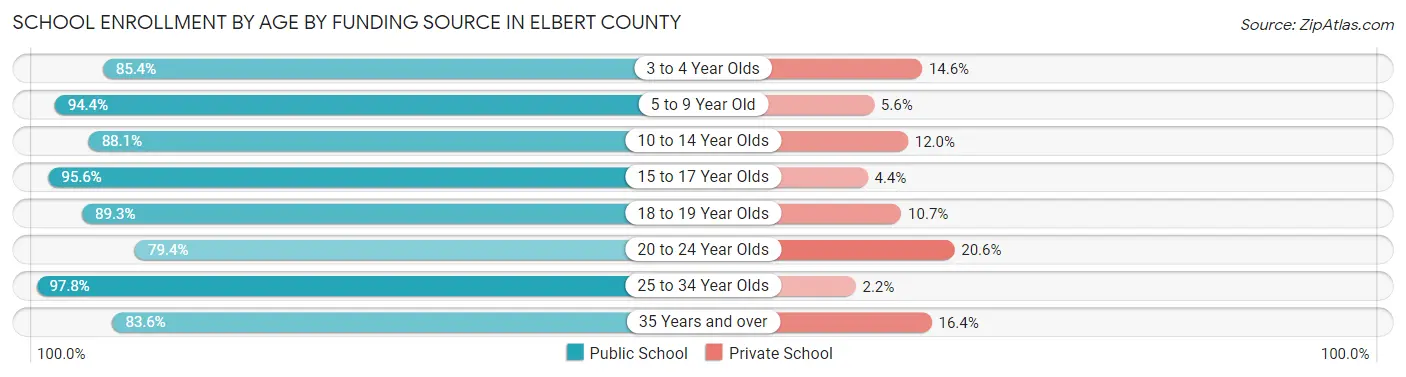
| Age Bracket | Public School | Private School |
| 3 to 4 Year Olds | 287 (85.4%) | 49 (14.6%) |
| 5 to 9 Year Old | 1,040 (94.4%) | 62 (5.6%) |
| 10 to 14 Year Olds | 1,208 (88.0%) | 164 (11.9%) |
| 15 to 17 Year Olds | 645 (95.6%) | 30 (4.4%) |
| 18 to 19 Year Olds | 200 (89.3%) | 24 (10.7%) |
| 20 to 24 Year Olds | 185 (79.4%) | 48 (20.6%) |
| 25 to 34 Year Olds | 265 (97.8%) | 6 (2.2%) |
| 35 Years and over | 143 (83.6%) | 28 (16.4%) |
| Total | 3,972 (90.6%) | 412 (9.4%) |
Educational Attainment by Field of Study in Elbert County
Education (495 | 24.3%), business (383 | 18.8%), science & technology (362 | 17.7%), arts & humanities (179 | 8.8%), and bio, nature & agricultural (109 | 5.3%) are the most common fields of study among 2,040 individuals in Elbert County who have obtained a bachelor's degree or higher.
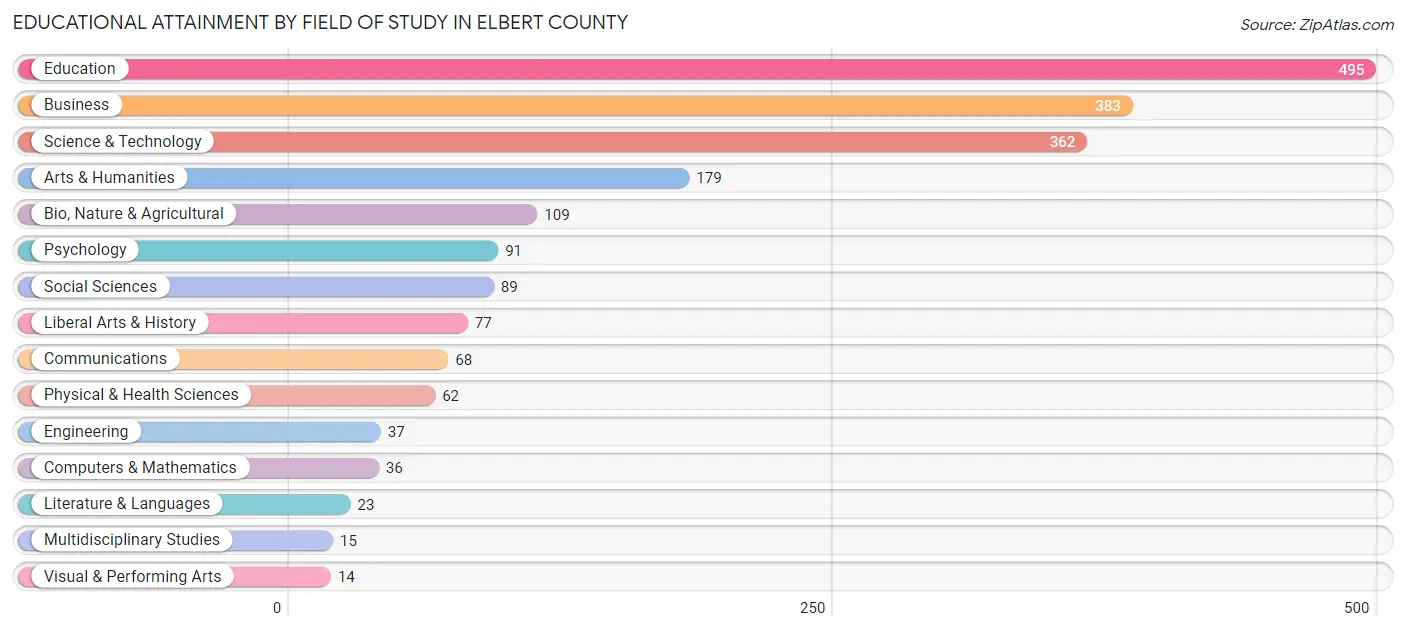
| Field of Study | # Graduates | % Graduates |
| Computers & Mathematics | 36 | 1.8% |
| Bio, Nature & Agricultural | 109 | 5.3% |
| Physical & Health Sciences | 62 | 3.0% |
| Psychology | 91 | 4.5% |
| Social Sciences | 89 | 4.4% |
| Engineering | 37 | 1.8% |
| Multidisciplinary Studies | 15 | 0.7% |
| Science & Technology | 362 | 17.7% |
| Business | 383 | 18.8% |
| Education | 495 | 24.3% |
| Literature & Languages | 23 | 1.1% |
| Liberal Arts & History | 77 | 3.8% |
| Visual & Performing Arts | 14 | 0.7% |
| Communications | 68 | 3.3% |
| Arts & Humanities | 179 | 8.8% |
| Total | 2,040 | 100.0% |
Transportation & Commute in Elbert County
Vehicle Availability by Sex in Elbert County
The most prevalent vehicle ownership categories in Elbert County are males with 2 vehicles (1,687, accounting for 37.8%) and females with 2 vehicles (1,182, making up 42.5%).
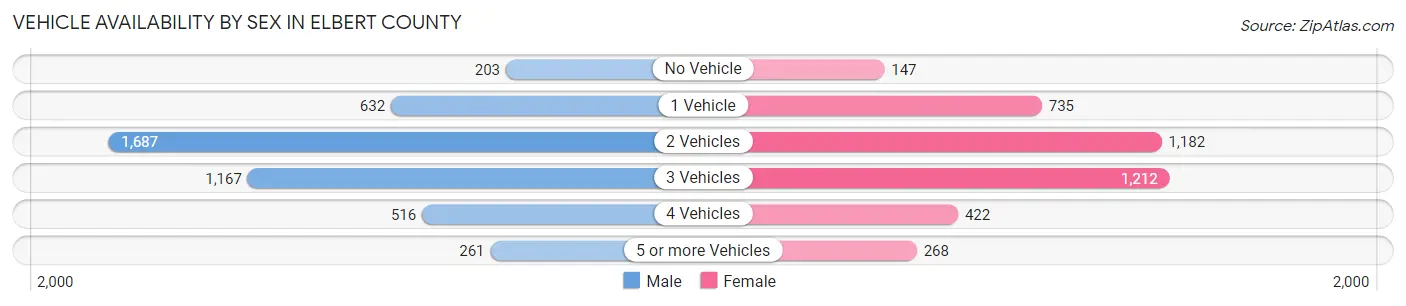
| Vehicles Available | Male | Female |
| No Vehicle | 203 (4.5%) | 147 (3.7%) |
| 1 Vehicle | 632 (14.1%) | 735 (18.5%) |
| 2 Vehicles | 1,687 (37.8%) | 1,182 (29.8%) |
| 3 Vehicles | 1,167 (26.1%) | 1,212 (30.6%) |
| 4 Vehicles | 516 (11.6%) | 422 (10.6%) |
| 5 or more Vehicles | 261 (5.8%) | 268 (6.8%) |
| Total | 4,466 (100.0%) | 3,966 (100.0%) |
Commute Time in Elbert County
The most frequently occuring commute durations in Elbert County are 10 to 14 minutes (1,469 commuters, 18.8%), 5 to 9 minutes (1,099 commuters, 14.1%), and 30 to 34 minutes (1,020 commuters, 13.1%).
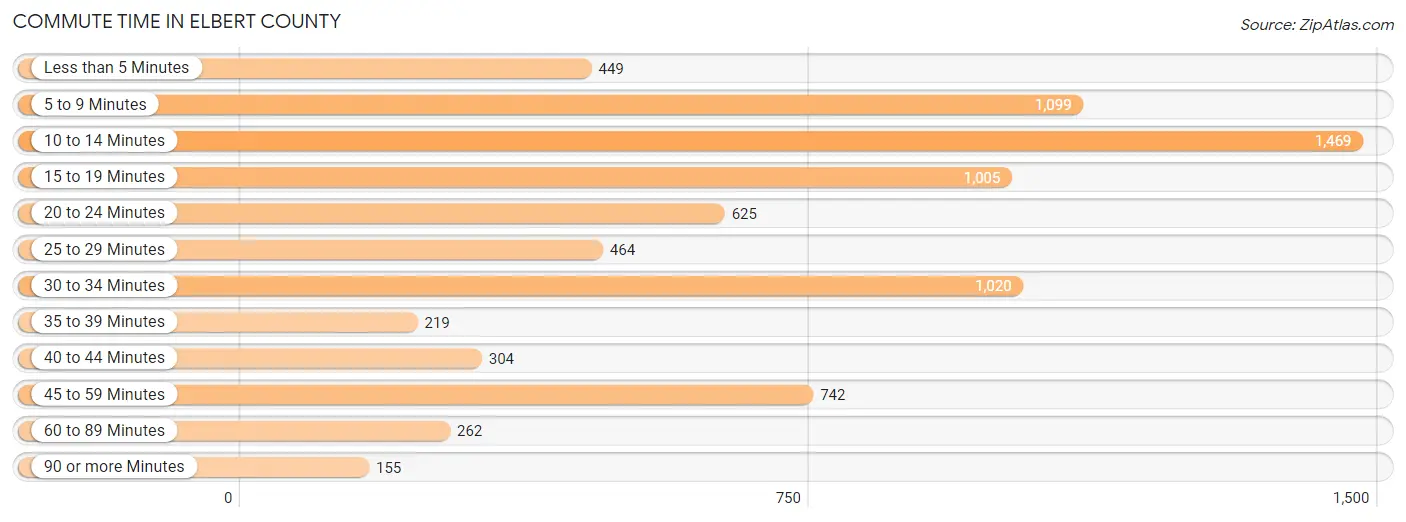
| Commute Time | # Commuters | % Commuters |
| Less than 5 Minutes | 449 | 5.8% |
| 5 to 9 Minutes | 1,099 | 14.1% |
| 10 to 14 Minutes | 1,469 | 18.8% |
| 15 to 19 Minutes | 1,005 | 12.9% |
| 20 to 24 Minutes | 625 | 8.0% |
| 25 to 29 Minutes | 464 | 5.9% |
| 30 to 34 Minutes | 1,020 | 13.1% |
| 35 to 39 Minutes | 219 | 2.8% |
| 40 to 44 Minutes | 304 | 3.9% |
| 45 to 59 Minutes | 742 | 9.5% |
| 60 to 89 Minutes | 262 | 3.4% |
| 90 or more Minutes | 155 | 2.0% |
Commute Time by Sex in Elbert County
The most common commute times in Elbert County are 10 to 14 minutes (851 commuters, 21.0%) for males and 10 to 14 minutes (618 commuters, 16.4%) for females.
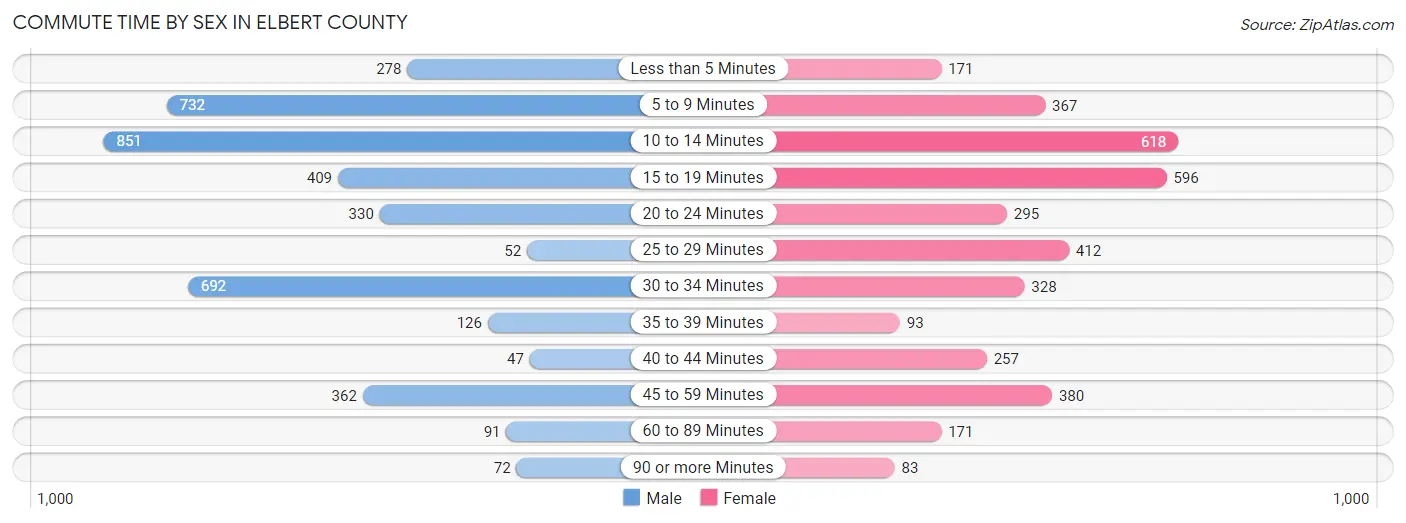
| Commute Time | Male | Female |
| Less than 5 Minutes | 278 (6.9%) | 171 (4.5%) |
| 5 to 9 Minutes | 732 (18.1%) | 367 (9.7%) |
| 10 to 14 Minutes | 851 (21.0%) | 618 (16.4%) |
| 15 to 19 Minutes | 409 (10.1%) | 596 (15.8%) |
| 20 to 24 Minutes | 330 (8.2%) | 295 (7.8%) |
| 25 to 29 Minutes | 52 (1.3%) | 412 (10.9%) |
| 30 to 34 Minutes | 692 (17.1%) | 328 (8.7%) |
| 35 to 39 Minutes | 126 (3.1%) | 93 (2.5%) |
| 40 to 44 Minutes | 47 (1.2%) | 257 (6.8%) |
| 45 to 59 Minutes | 362 (9.0%) | 380 (10.1%) |
| 60 to 89 Minutes | 91 (2.2%) | 171 (4.5%) |
| 90 or more Minutes | 72 (1.8%) | 83 (2.2%) |
Time of Departure to Work by Sex in Elbert County
The most frequent times of departure to work in Elbert County are 7:00 AM to 7:29 AM (907, 22.4%) for males and 7:00 AM to 7:29 AM (975, 25.9%) for females.
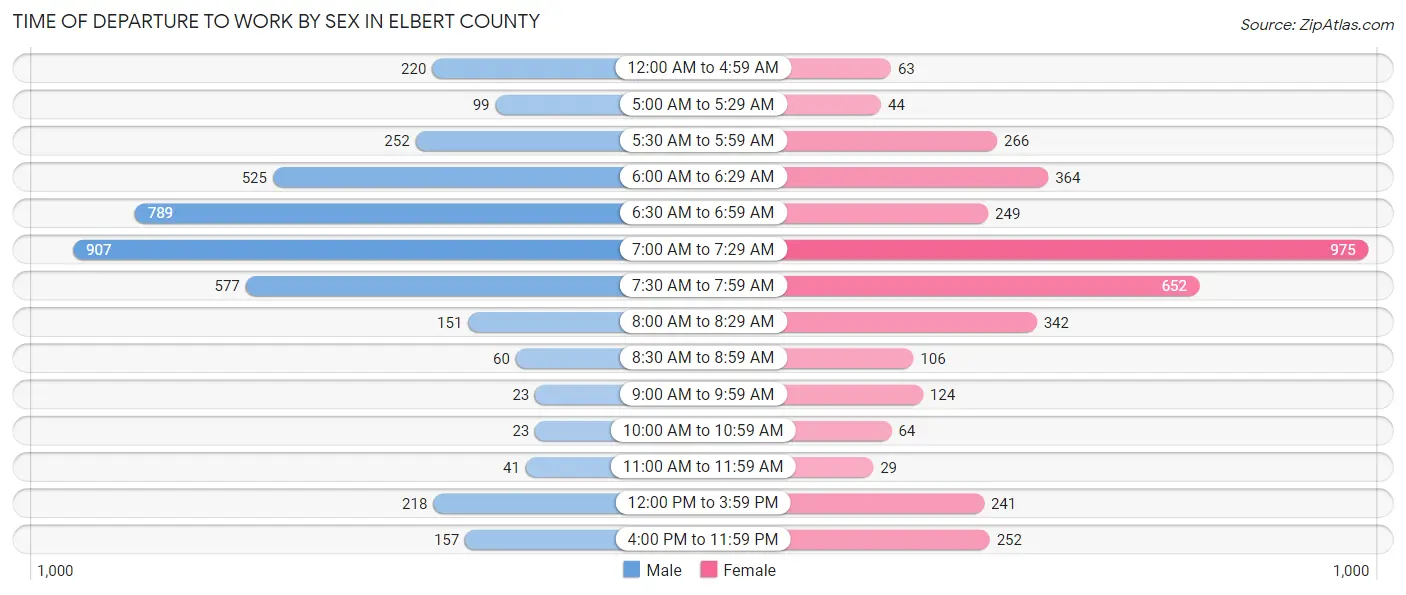
| Time of Departure | Male | Female |
| 12:00 AM to 4:59 AM | 220 (5.4%) | 63 (1.7%) |
| 5:00 AM to 5:29 AM | 99 (2.5%) | 44 (1.2%) |
| 5:30 AM to 5:59 AM | 252 (6.2%) | 266 (7.0%) |
| 6:00 AM to 6:29 AM | 525 (13.0%) | 364 (9.7%) |
| 6:30 AM to 6:59 AM | 789 (19.5%) | 249 (6.6%) |
| 7:00 AM to 7:29 AM | 907 (22.4%) | 975 (25.9%) |
| 7:30 AM to 7:59 AM | 577 (14.3%) | 652 (17.3%) |
| 8:00 AM to 8:29 AM | 151 (3.7%) | 342 (9.1%) |
| 8:30 AM to 8:59 AM | 60 (1.5%) | 106 (2.8%) |
| 9:00 AM to 9:59 AM | 23 (0.6%) | 124 (3.3%) |
| 10:00 AM to 10:59 AM | 23 (0.6%) | 64 (1.7%) |
| 11:00 AM to 11:59 AM | 41 (1.0%) | 29 (0.8%) |
| 12:00 PM to 3:59 PM | 218 (5.4%) | 241 (6.4%) |
| 4:00 PM to 11:59 PM | 157 (3.9%) | 252 (6.7%) |
| Total | 4,042 (100.0%) | 3,771 (100.0%) |
Housing Occupancy in Elbert County
Occupancy by Ownership in Elbert County
Of the total 7,873 dwellings in Elbert County, owner-occupied units account for 5,537 (70.3%), while renter-occupied units make up 2,336 (29.7%).
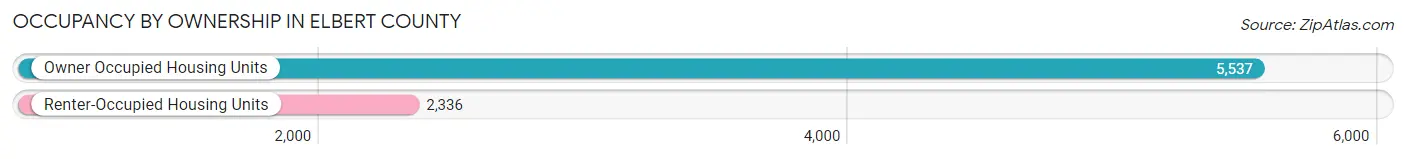
| Occupancy | # Housing Units | % Housing Units |
| Owner Occupied Housing Units | 5,537 | 70.3% |
| Renter-Occupied Housing Units | 2,336 | 29.7% |
| Total Occupied Housing Units | 7,873 | 100.0% |
Occupancy by Household Size in Elbert County
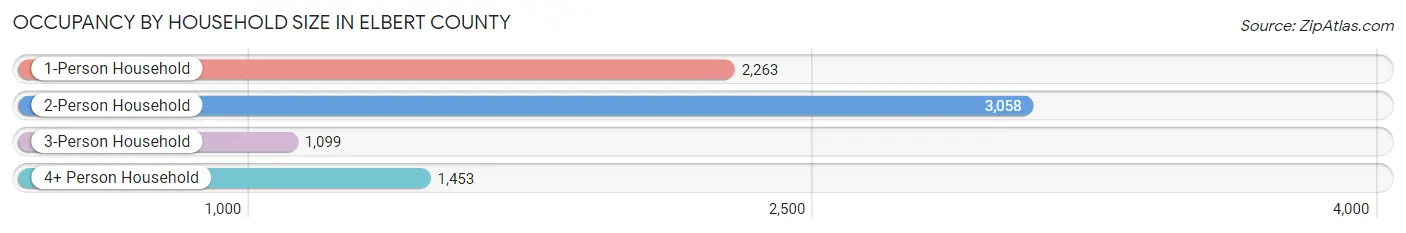
| Household Size | # Housing Units | % Housing Units |
| 1-Person Household | 2,263 | 28.7% |
| 2-Person Household | 3,058 | 38.8% |
| 3-Person Household | 1,099 | 14.0% |
| 4+ Person Household | 1,453 | 18.5% |
| Total Housing Units | 7,873 | 100.0% |
Occupancy by Ownership by Household Size in Elbert County
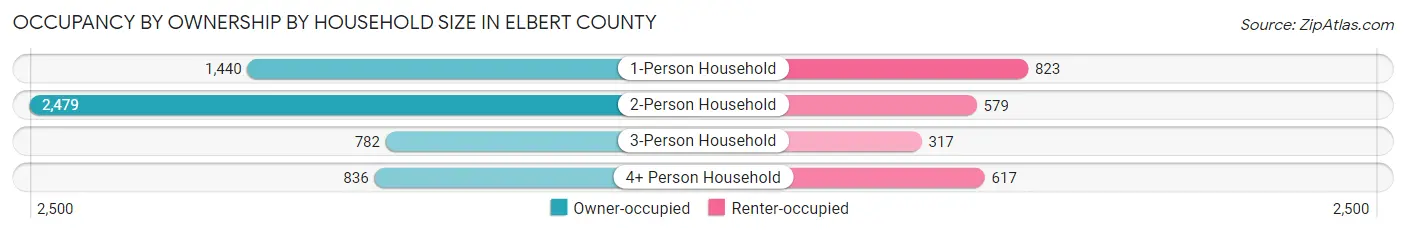
| Household Size | Owner-occupied | Renter-occupied |
| 1-Person Household | 1,440 (63.6%) | 823 (36.4%) |
| 2-Person Household | 2,479 (81.1%) | 579 (18.9%) |
| 3-Person Household | 782 (71.2%) | 317 (28.8%) |
| 4+ Person Household | 836 (57.5%) | 617 (42.5%) |
| Total Housing Units | 5,537 (70.3%) | 2,336 (29.7%) |
Occupancy by Educational Attainment in Elbert County
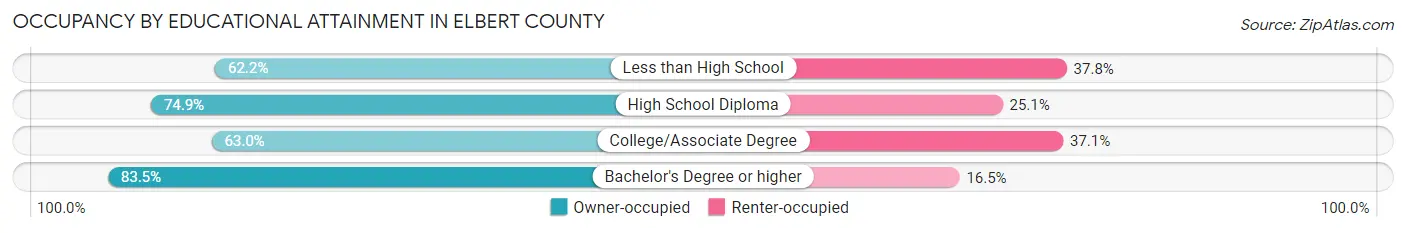
| Household Size | Owner-occupied | Renter-occupied |
| Less than High School | 687 (62.2%) | 417 (37.8%) |
| High School Diploma | 2,312 (74.9%) | 773 (25.1%) |
| College/Associate Degree | 1,648 (62.9%) | 970 (37.0%) |
| Bachelor's Degree or higher | 890 (83.5%) | 176 (16.5%) |
Occupancy by Age of Householder in Elbert County
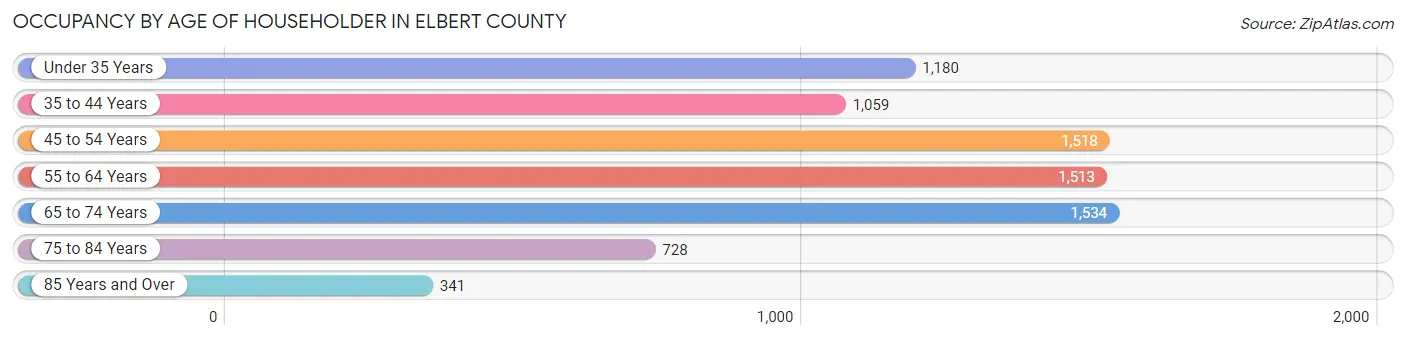
| Age Bracket | # Households | % Households |
| Under 35 Years | 1,180 | 15.0% |
| 35 to 44 Years | 1,059 | 13.5% |
| 45 to 54 Years | 1,518 | 19.3% |
| 55 to 64 Years | 1,513 | 19.2% |
| 65 to 74 Years | 1,534 | 19.5% |
| 75 to 84 Years | 728 | 9.2% |
| 85 Years and Over | 341 | 4.3% |
| Total | 7,873 | 100.0% |
Housing Finances in Elbert County
Median Income by Occupancy in Elbert County
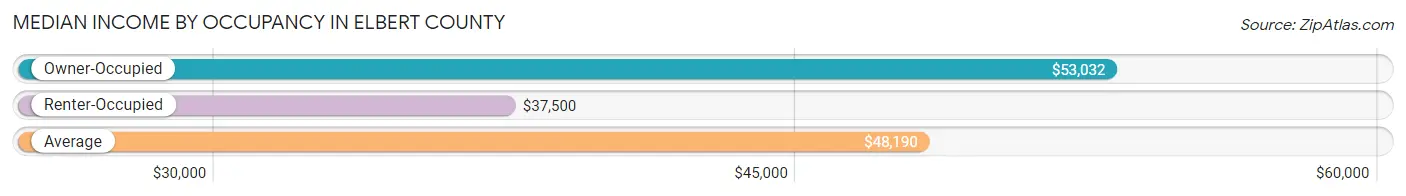
| Occupancy Type | # Households | Median Income |
| Owner-Occupied | 5,537 (70.3%) | $53,032 |
| Renter-Occupied | 2,336 (29.7%) | $37,500 |
| Average | 7,873 (100.0%) | $48,190 |
Occupancy by Householder Income Bracket in Elbert County
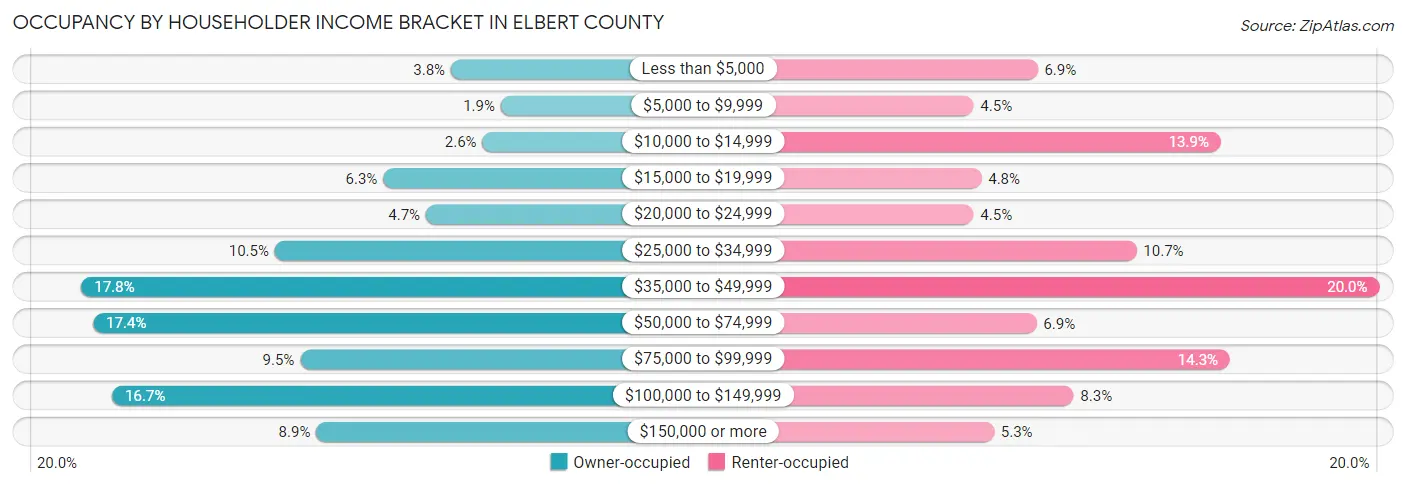
| Income Bracket | Owner-occupied | Renter-occupied |
| Less than $5,000 | 208 (3.8%) | 162 (6.9%) |
| $5,000 to $9,999 | 103 (1.9%) | 105 (4.5%) |
| $10,000 to $14,999 | 142 (2.6%) | 325 (13.9%) |
| $15,000 to $19,999 | 351 (6.3%) | 112 (4.8%) |
| $20,000 to $24,999 | 261 (4.7%) | 105 (4.5%) |
| $25,000 to $34,999 | 580 (10.5%) | 250 (10.7%) |
| $35,000 to $49,999 | 988 (17.8%) | 466 (20.0%) |
| $50,000 to $74,999 | 963 (17.4%) | 161 (6.9%) |
| $75,000 to $99,999 | 526 (9.5%) | 333 (14.3%) |
| $100,000 to $149,999 | 923 (16.7%) | 194 (8.3%) |
| $150,000 or more | 492 (8.9%) | 123 (5.3%) |
| Total | 5,537 (100.0%) | 2,336 (100.0%) |
Monthly Housing Cost Tiers in Elbert County
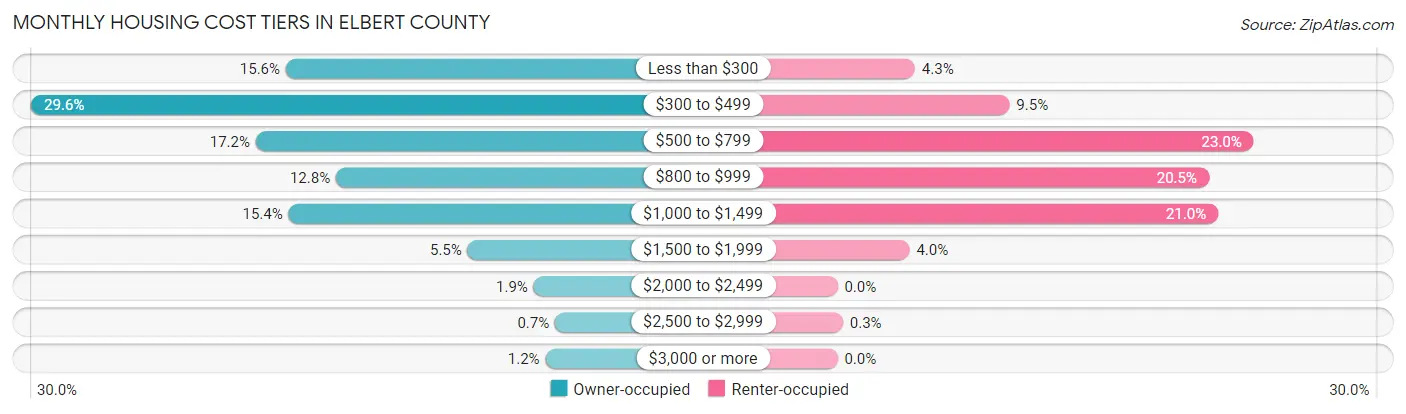
| Monthly Cost | Owner-occupied | Renter-occupied |
| Less than $300 | 862 (15.6%) | 100 (4.3%) |
| $300 to $499 | 1,641 (29.6%) | 222 (9.5%) |
| $500 to $799 | 954 (17.2%) | 537 (23.0%) |
| $800 to $999 | 709 (12.8%) | 479 (20.5%) |
| $1,000 to $1,499 | 854 (15.4%) | 491 (21.0%) |
| $1,500 to $1,999 | 306 (5.5%) | 93 (4.0%) |
| $2,000 to $2,499 | 104 (1.9%) | 0 (0.0%) |
| $2,500 to $2,999 | 39 (0.7%) | 7 (0.3%) |
| $3,000 or more | 68 (1.2%) | 0 (0.0%) |
| Total | 5,537 (100.0%) | 2,336 (100.0%) |
Physical Housing Characteristics in Elbert County
Housing Structures in Elbert County
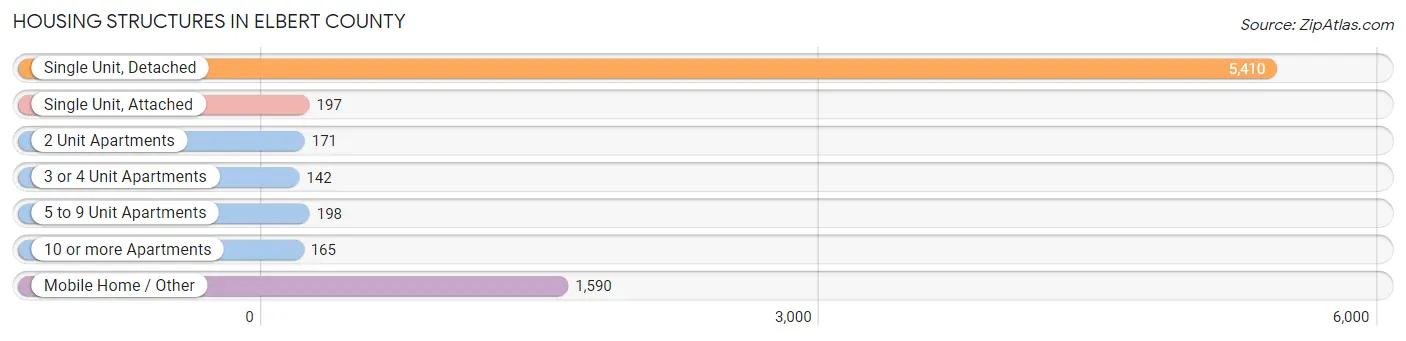
| Structure Type | # Housing Units | % Housing Units |
| Single Unit, Detached | 5,410 | 68.7% |
| Single Unit, Attached | 197 | 2.5% |
| 2 Unit Apartments | 171 | 2.2% |
| 3 or 4 Unit Apartments | 142 | 1.8% |
| 5 to 9 Unit Apartments | 198 | 2.5% |
| 10 or more Apartments | 165 | 2.1% |
| Mobile Home / Other | 1,590 | 20.2% |
| Total | 7,873 | 100.0% |
Housing Structures by Occupancy in Elbert County
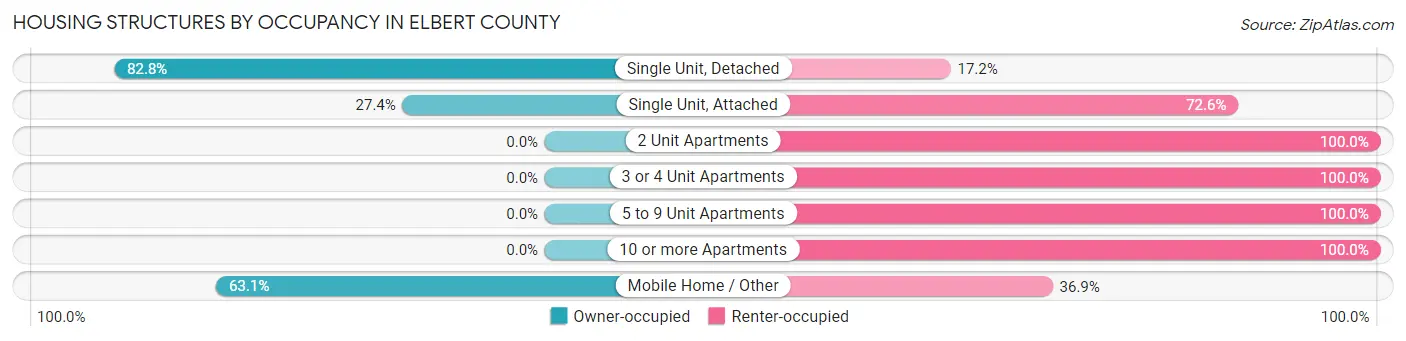
| Structure Type | Owner-occupied | Renter-occupied |
| Single Unit, Detached | 4,479 (82.8%) | 931 (17.2%) |
| Single Unit, Attached | 54 (27.4%) | 143 (72.6%) |
| 2 Unit Apartments | 0 (0.0%) | 171 (100.0%) |
| 3 or 4 Unit Apartments | 0 (0.0%) | 142 (100.0%) |
| 5 to 9 Unit Apartments | 0 (0.0%) | 198 (100.0%) |
| 10 or more Apartments | 0 (0.0%) | 165 (100.0%) |
| Mobile Home / Other | 1,004 (63.1%) | 586 (36.9%) |
| Total | 5,537 (70.3%) | 2,336 (29.7%) |
Housing Structures by Number of Rooms in Elbert County
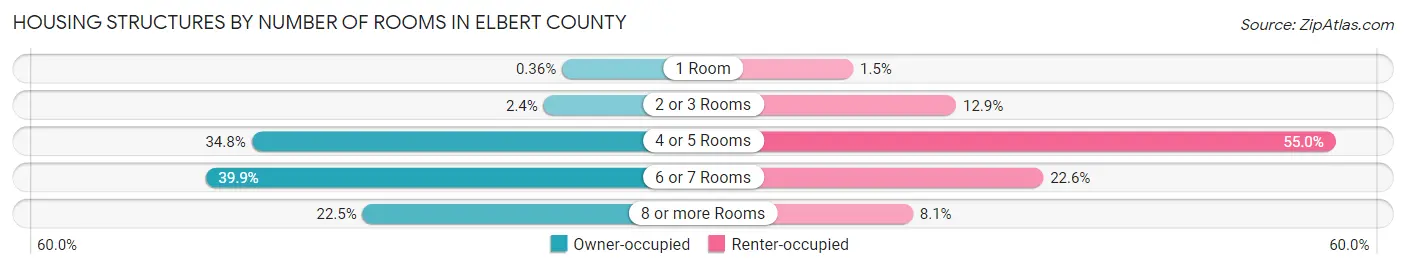
| Number of Rooms | Owner-occupied | Renter-occupied |
| 1 Room | 20 (0.4%) | 34 (1.5%) |
| 2 or 3 Rooms | 133 (2.4%) | 301 (12.9%) |
| 4 or 5 Rooms | 1,928 (34.8%) | 1,285 (55.0%) |
| 6 or 7 Rooms | 2,211 (39.9%) | 527 (22.6%) |
| 8 or more Rooms | 1,245 (22.5%) | 189 (8.1%) |
| Total | 5,537 (100.0%) | 2,336 (100.0%) |
Housing Structure by Heating Type in Elbert County
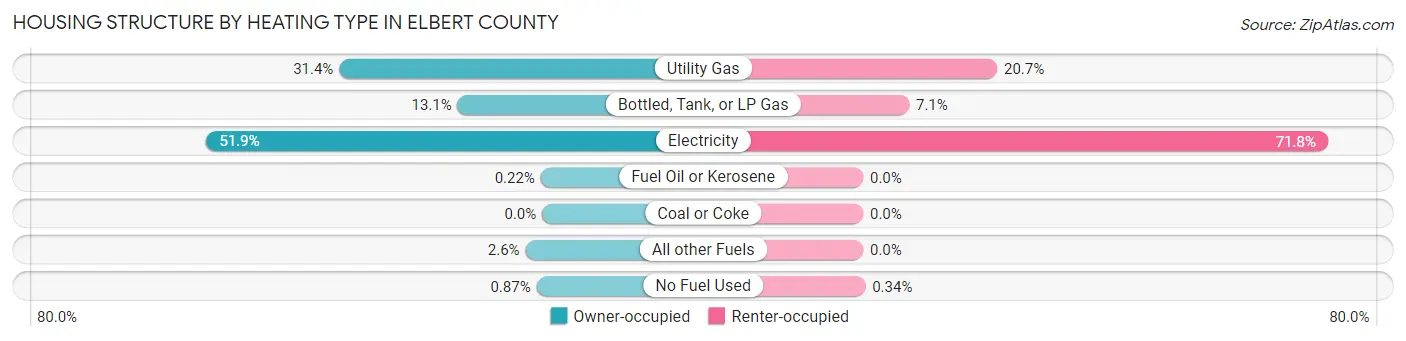
| Heating Type | Owner-occupied | Renter-occupied |
| Utility Gas | 1,737 (31.4%) | 484 (20.7%) |
| Bottled, Tank, or LP Gas | 723 (13.1%) | 166 (7.1%) |
| Electricity | 2,874 (51.9%) | 1,678 (71.8%) |
| Fuel Oil or Kerosene | 12 (0.2%) | 0 (0.0%) |
| Coal or Coke | 0 (0.0%) | 0 (0.0%) |
| All other Fuels | 143 (2.6%) | 0 (0.0%) |
| No Fuel Used | 48 (0.9%) | 8 (0.3%) |
| Total | 5,537 (100.0%) | 2,336 (100.0%) |
Household Vehicle Usage in Elbert County
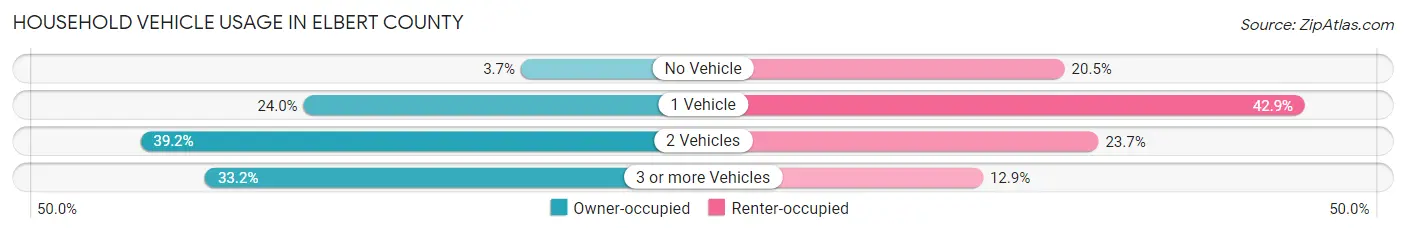
| Vehicles per Household | Owner-occupied | Renter-occupied |
| No Vehicle | 204 (3.7%) | 479 (20.5%) |
| 1 Vehicle | 1,327 (24.0%) | 1,003 (42.9%) |
| 2 Vehicles | 2,170 (39.2%) | 553 (23.7%) |
| 3 or more Vehicles | 1,836 (33.2%) | 301 (12.9%) |
| Total | 5,537 (100.0%) | 2,336 (100.0%) |
Real Estate & Mortgages in Elbert County
Real Estate and Mortgage Overview in Elbert County
| Characteristic | Without Mortgage | With Mortgage |
| Housing Units | 3,544 | 1,993 |
| Median Property Value | $93,700 | $125,500 |
| Median Household Income | $48,188 | $252 |
| Monthly Housing Costs | $427 | $58 |
| Real Estate Taxes | $835 | $43 |
Property Value by Mortgage Status in Elbert County
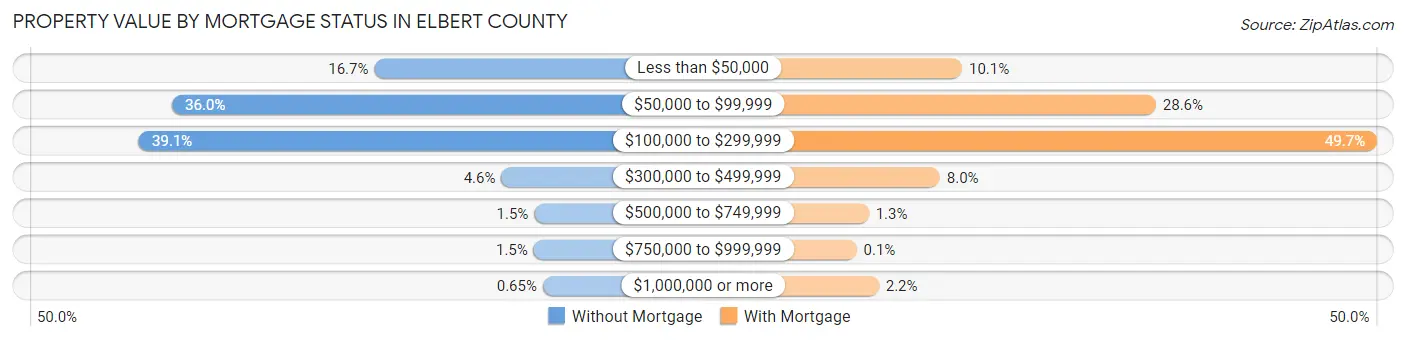
| Property Value | Without Mortgage | With Mortgage |
| Less than $50,000 | 592 (16.7%) | 202 (10.1%) |
| $50,000 to $99,999 | 1,274 (35.9%) | 570 (28.6%) |
| $100,000 to $299,999 | 1,386 (39.1%) | 990 (49.7%) |
| $300,000 to $499,999 | 163 (4.6%) | 160 (8.0%) |
| $500,000 to $749,999 | 52 (1.5%) | 25 (1.3%) |
| $750,000 to $999,999 | 54 (1.5%) | 2 (0.1%) |
| $1,000,000 or more | 23 (0.6%) | 44 (2.2%) |
| Total | 3,544 (100.0%) | 1,993 (100.0%) |
Household Income by Mortgage Status in Elbert County
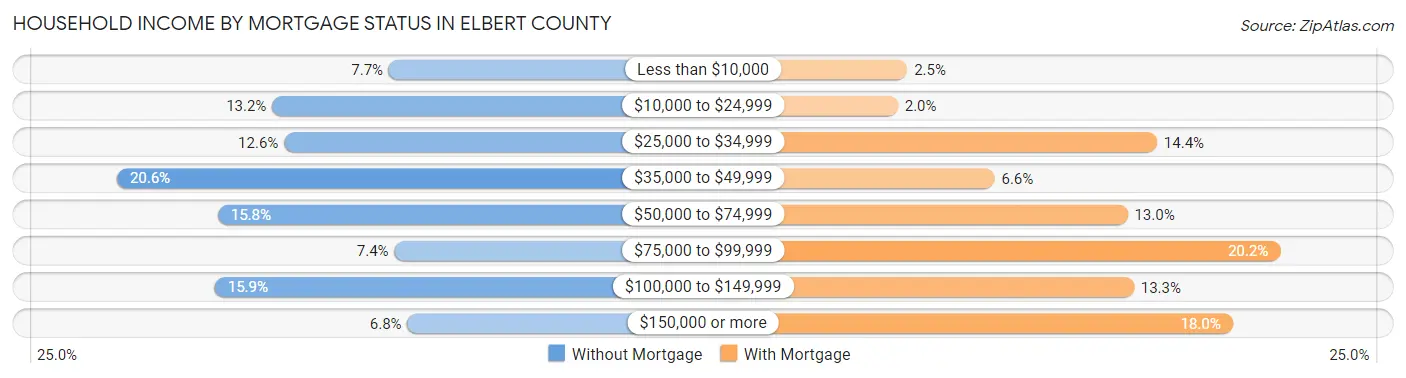
| Household Income | Without Mortgage | With Mortgage |
| Less than $10,000 | 271 (7.6%) | 49 (2.5%) |
| $10,000 to $24,999 | 468 (13.2%) | 40 (2.0%) |
| $25,000 to $34,999 | 448 (12.6%) | 286 (14.3%) |
| $35,000 to $49,999 | 730 (20.6%) | 132 (6.6%) |
| $50,000 to $74,999 | 560 (15.8%) | 258 (13.0%) |
| $75,000 to $99,999 | 262 (7.4%) | 403 (20.2%) |
| $100,000 to $149,999 | 565 (15.9%) | 264 (13.3%) |
| $150,000 or more | 240 (6.8%) | 358 (18.0%) |
| Total | 3,544 (100.0%) | 1,993 (100.0%) |
Property Value to Household Income Ratio in Elbert County
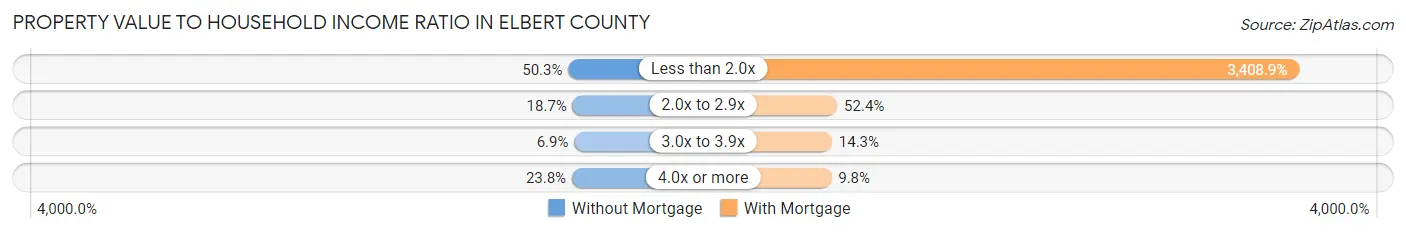
| Value-to-Income Ratio | Without Mortgage | With Mortgage |
| Less than 2.0x | 1,784 (50.3%) | 67,940 (3,408.9%) |
| 2.0x to 2.9x | 663 (18.7%) | 1,044 (52.4%) |
| 3.0x to 3.9x | 243 (6.9%) | 285 (14.3%) |
| 4.0x or more | 842 (23.8%) | 196 (9.8%) |
| Total | 3,544 (100.0%) | 1,993 (100.0%) |
Real Estate Taxes by Mortgage Status in Elbert County
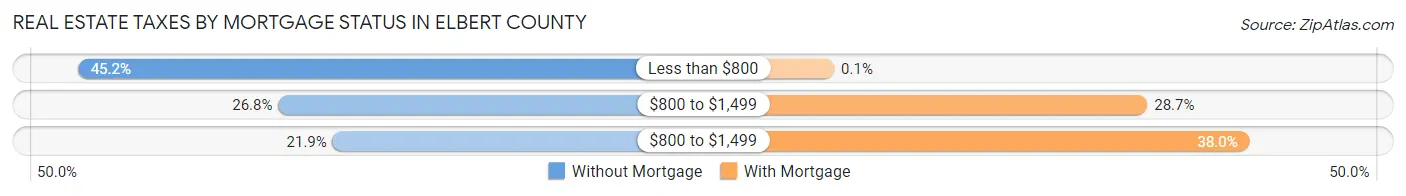
| Property Taxes | Without Mortgage | With Mortgage |
| Less than $800 | 1,600 (45.2%) | 2 (0.1%) |
| $800 to $1,499 | 951 (26.8%) | 572 (28.7%) |
| $800 to $1,499 | 775 (21.9%) | 758 (38.0%) |
| Total | 3,544 (100.0%) | 1,993 (100.0%) |
Health & Disability in Elbert County
Health Insurance Coverage by Age in Elbert County
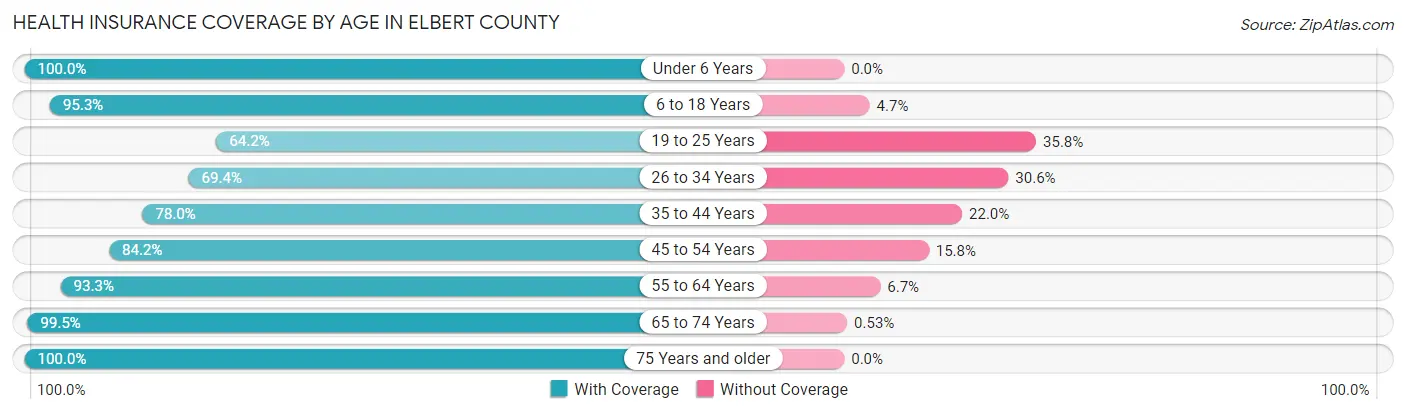
| Age Bracket | With Coverage | Without Coverage |
| Under 6 Years | 1,290 (100.0%) | 0 (0.0%) |
| 6 to 18 Years | 3,141 (95.3%) | 156 (4.7%) |
| 19 to 25 Years | 869 (64.2%) | 484 (35.8%) |
| 26 to 34 Years | 1,352 (69.4%) | 596 (30.6%) |
| 35 to 44 Years | 1,701 (78.0%) | 479 (22.0%) |
| 45 to 54 Years | 2,208 (84.2%) | 413 (15.8%) |
| 55 to 64 Years | 2,526 (93.3%) | 182 (6.7%) |
| 65 to 74 Years | 2,268 (99.5%) | 12 (0.5%) |
| 75 Years and older | 1,625 (100.0%) | 0 (0.0%) |
| Total | 16,980 (88.0%) | 2,322 (12.0%) |
Health Insurance Coverage by Citizenship Status in Elbert County
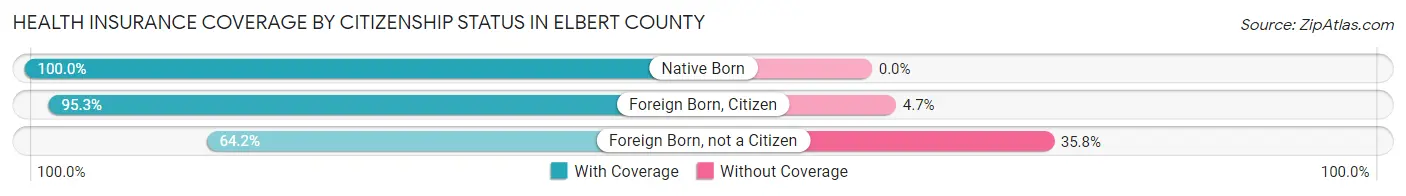
| Citizenship Status | With Coverage | Without Coverage |
| Native Born | 1,290 (100.0%) | 0 (0.0%) |
| Foreign Born, Citizen | 3,141 (95.3%) | 156 (4.7%) |
| Foreign Born, not a Citizen | 869 (64.2%) | 484 (35.8%) |
Health Insurance Coverage by Household Income in Elbert County
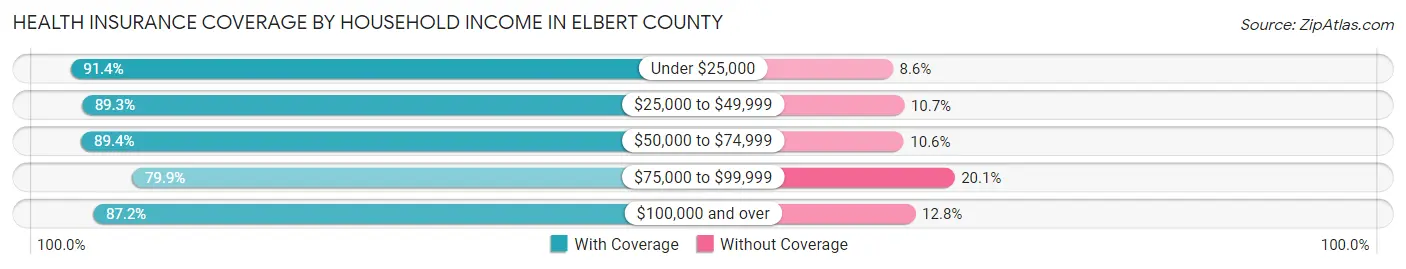
| Household Income | With Coverage | Without Coverage |
| Under $25,000 | 3,253 (91.4%) | 305 (8.6%) |
| $25,000 to $49,999 | 4,501 (89.3%) | 540 (10.7%) |
| $50,000 to $74,999 | 2,766 (89.4%) | 328 (10.6%) |
| $75,000 to $99,999 | 1,882 (79.9%) | 474 (20.1%) |
| $100,000 and over | 4,568 (87.2%) | 671 (12.8%) |
Public vs Private Health Insurance Coverage by Age in Elbert County
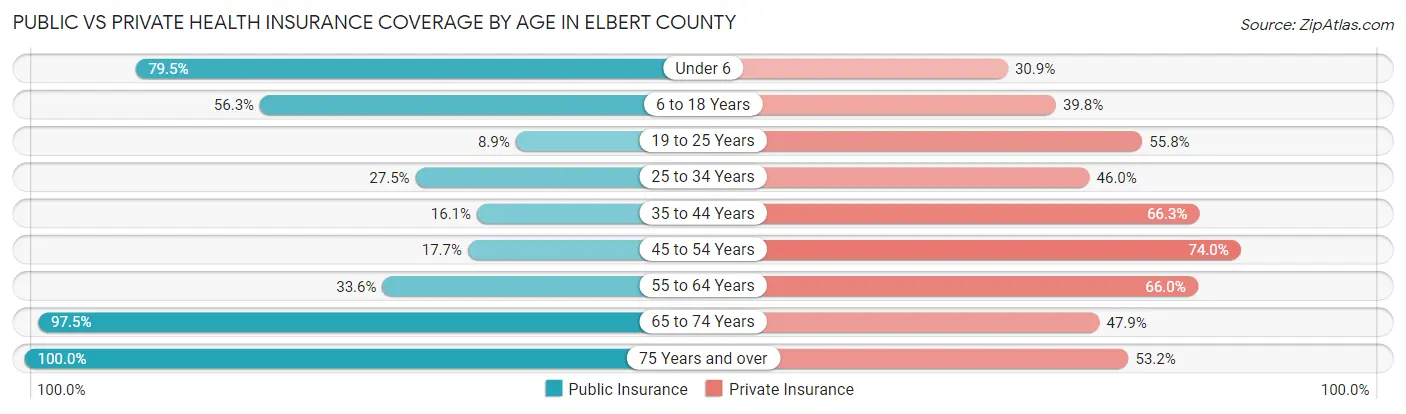
| Age Bracket | Public Insurance | Private Insurance |
| Under 6 | 1,025 (79.5%) | 398 (30.8%) |
| 6 to 18 Years | 1,857 (56.3%) | 1,311 (39.8%) |
| 19 to 25 Years | 120 (8.9%) | 755 (55.8%) |
| 25 to 34 Years | 535 (27.5%) | 896 (46.0%) |
| 35 to 44 Years | 350 (16.1%) | 1,446 (66.3%) |
| 45 to 54 Years | 465 (17.7%) | 1,940 (74.0%) |
| 55 to 64 Years | 910 (33.6%) | 1,788 (66.0%) |
| 65 to 74 Years | 2,223 (97.5%) | 1,091 (47.8%) |
| 75 Years and over | 1,625 (100.0%) | 865 (53.2%) |
| Total | 9,110 (47.2%) | 10,490 (54.3%) |
Disability Status by Sex by Age in Elbert County
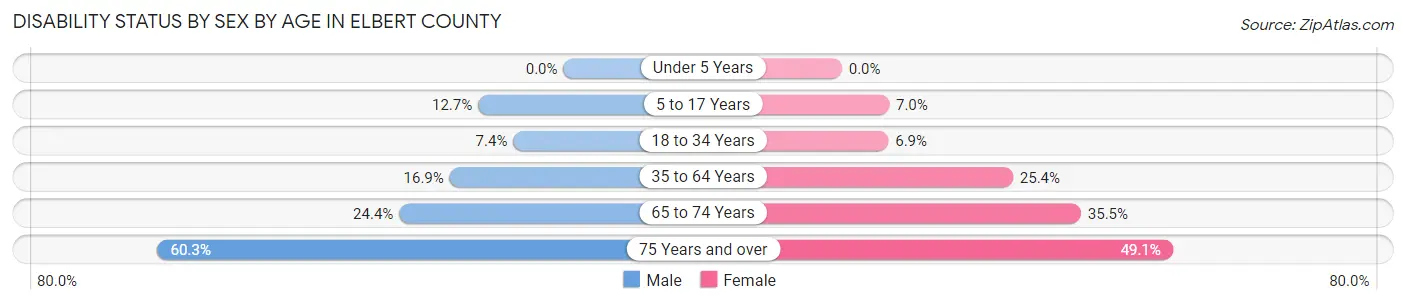
| Age Bracket | Male | Female |
| Under 5 Years | 0 (0.0%) | 0 (0.0%) |
| 5 to 17 Years | 198 (12.7%) | 117 (7.0%) |
| 18 to 34 Years | 129 (7.4%) | 130 (6.9%) |
| 35 to 64 Years | 612 (16.9%) | 987 (25.4%) |
| 65 to 74 Years | 244 (24.4%) | 454 (35.5%) |
| 75 Years and over | 426 (60.3%) | 451 (49.1%) |
Disability Class by Sex by Age in Elbert County
Disability Class: Hearing Difficulty
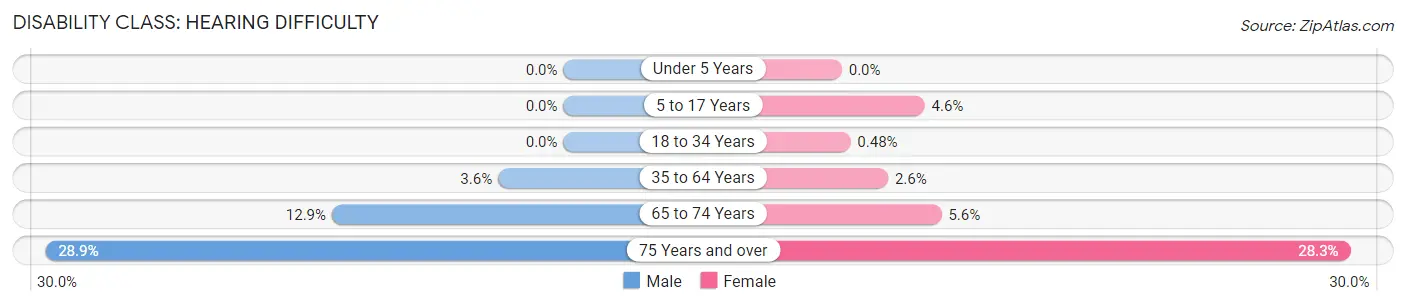
| Age Bracket | Male | Female |
| Under 5 Years | 0 (0.0%) | 0 (0.0%) |
| 5 to 17 Years | 0 (0.0%) | 77 (4.6%) |
| 18 to 34 Years | 0 (0.0%) | 9 (0.5%) |
| 35 to 64 Years | 132 (3.6%) | 100 (2.6%) |
| 65 to 74 Years | 129 (12.9%) | 71 (5.6%) |
| 75 Years and over | 204 (28.8%) | 260 (28.3%) |
Disability Class: Vision Difficulty
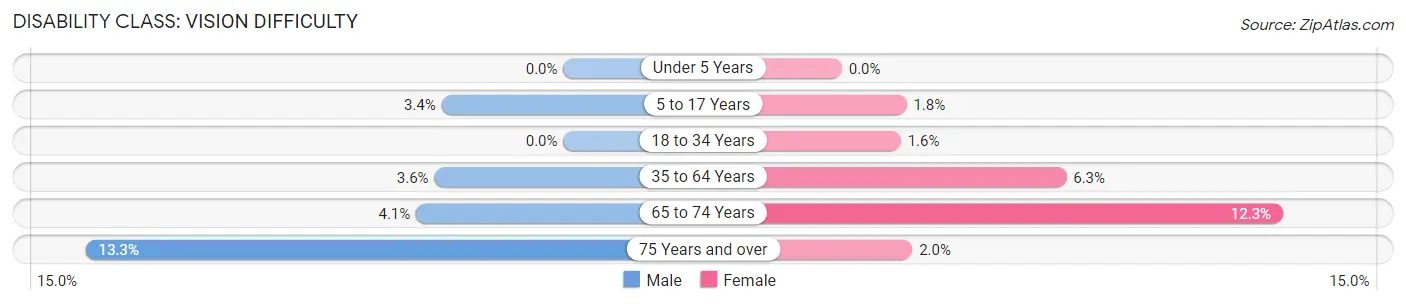
| Age Bracket | Male | Female |
| Under 5 Years | 0 (0.0%) | 0 (0.0%) |
| 5 to 17 Years | 53 (3.4%) | 30 (1.8%) |
| 18 to 34 Years | 0 (0.0%) | 31 (1.6%) |
| 35 to 64 Years | 130 (3.6%) | 243 (6.2%) |
| 65 to 74 Years | 41 (4.1%) | 157 (12.3%) |
| 75 Years and over | 94 (13.3%) | 18 (2.0%) |
Disability Class: Cognitive Difficulty
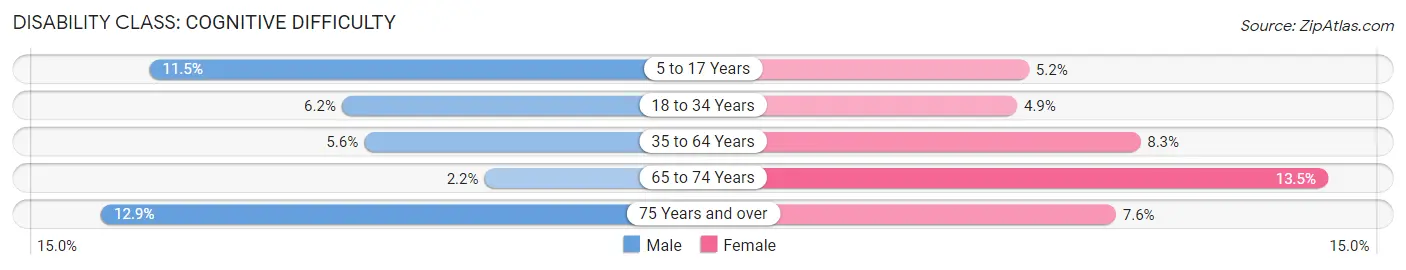
| Age Bracket | Male | Female |
| 5 to 17 Years | 180 (11.5%) | 87 (5.2%) |
| 18 to 34 Years | 107 (6.2%) | 92 (4.9%) |
| 35 to 64 Years | 201 (5.6%) | 323 (8.3%) |
| 65 to 74 Years | 22 (2.2%) | 173 (13.5%) |
| 75 Years and over | 91 (12.9%) | 70 (7.6%) |
Disability Class: Ambulatory Difficulty
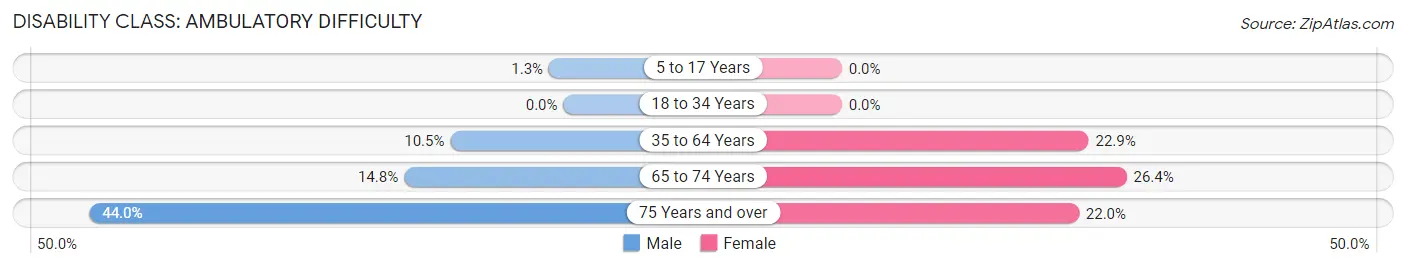
| Age Bracket | Male | Female |
| 5 to 17 Years | 21 (1.3%) | 0 (0.0%) |
| 18 to 34 Years | 0 (0.0%) | 0 (0.0%) |
| 35 to 64 Years | 380 (10.5%) | 890 (22.9%) |
| 65 to 74 Years | 148 (14.8%) | 338 (26.4%) |
| 75 Years and over | 311 (44.0%) | 202 (22.0%) |
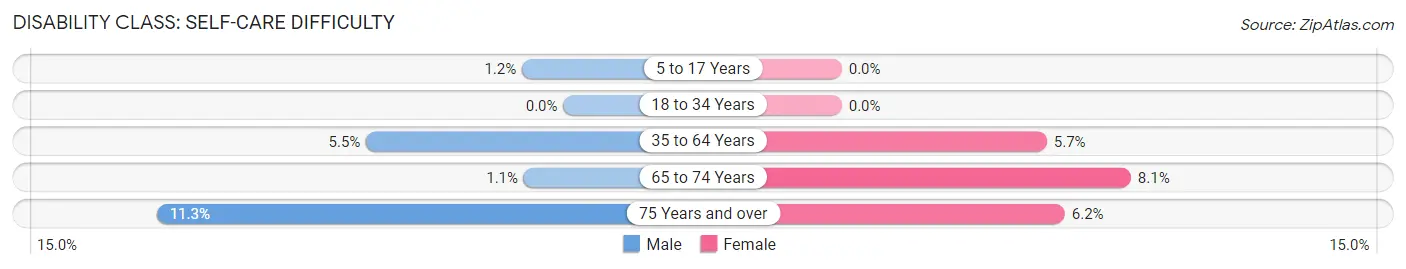
Disability Class: Self-Care Difficulty
| Age Bracket | Male | Female |
| 5 to 17 Years | 18 (1.1%) | 0 (0.0%) |
| 18 to 34 Years | 0 (0.0%) | 0 (0.0%) |
| 35 to 64 Years | 199 (5.5%) | 222 (5.7%) |
| 65 to 74 Years | 11 (1.1%) | 103 (8.1%) |
| 75 Years and over | 80 (11.3%) | 57 (6.2%) |
Technology Access in Elbert County
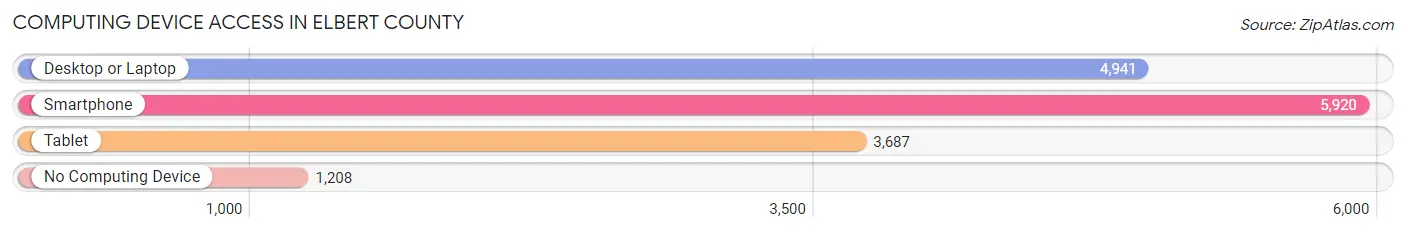
Computing Device Access in Elbert County
| Device Type | # Households | % Households |
| Desktop or Laptop | 4,941 | 62.8% |
| Smartphone | 5,920 | 75.2% |
| Tablet | 3,687 | 46.8% |
| No Computing Device | 1,208 | 15.3% |
| Total | 7,873 | 100.0% |
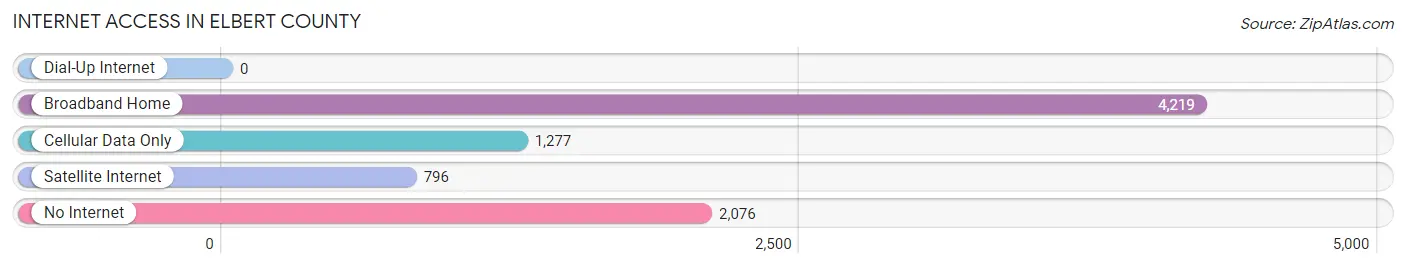
Internet Access in Elbert County
| Internet Type | # Households | % Households |
| Dial-Up Internet | 0 | 0.0% |
| Broadband Home | 4,219 | 53.6% |
| Cellular Data Only | 1,277 | 16.2% |
| Satellite Internet | 796 | 10.1% |
| No Internet | 2,076 | 26.4% |
| Total | 7,873 | 100.0% |
Elbert County Summary
Elbert County, Georgia is located in the northeastern part of the state, and is part of the Athens-Clarke County Metropolitan Statistical Area. It is bordered by Madison County to the north, Hart County to the east, Wilkes County to the south, and Oglethorpe County to the west. Elbert County is home to a population of approximately 20,000 people, and covers an area of 437 square miles.
History
Elbert County was created in 1790 from part of Wilkes County. It was named for Samuel Elbert, a Revolutionary War hero and the first governor of Georgia. The county seat is Elberton, which was established in 1803.
Elbert County was home to several Native American tribes, including the Creek, Cherokee, and Chickasaw. The area was also home to a number of early settlers, including the Rev. John Newton, who established a church in 1790.
In the early 19th century, Elbert County was a center of cotton production, and the county was home to several large plantations. The county was also home to a number of prominent families, including the Taliaferros, who owned a large plantation in the area.
During the Civil War, Elbert County was the site of several battles, including the Battle of Elberton in 1864. After the war, the county was home to a number of freedmen, who established their own communities in the area.
Geography
Elbert County is located in the northeastern part of the state, and is part of the Athens-Clarke County Metropolitan Statistical Area. It is bordered by Madison County to the north, Hart County to the east, Wilkes County to the south, and Oglethorpe County to the west.
The county is mostly rural, with the majority of the land being used for farming and timber production. The county is home to several small towns, including Elberton, Bowman, and Hartwell. The county is also home to several lakes, including Lake Russell, Lake Hartwell, and Lake Oconee.
Economy
The economy of Elbert County is largely based on agriculture and timber production. The county is home to several large farms, and is a major producer of cotton, corn, soybeans, and other crops. The county is also home to several timber companies, which harvest timber from the county’s forests.
In addition to agriculture and timber production, Elbert County is home to several manufacturing companies, including a number of textile mills. The county is also home to a number of small businesses, including restaurants, retail stores, and service providers.
Demographics
As of the 2010 census, Elbert County had a population of 20,000 people. The racial makeup of the county was 79.3% White, 17.2% African American, 0.5% Native American, 0.3% Asian, 0.1% Pacific Islander, 1.2% from other races, and 1.7% from two or more races. Hispanic or Latino of any race were 3.2% of the population.
The median income for a household in Elbert County was $35,000, and the median income for a family was $41,000. The per capita income for the county was $17,000. About 17.2% of the population was below the poverty line.
Common Questions
What is Per Capita Income in Elbert County?
Per Capita income in Elbert County is $27,848.
What is the Median Family Income in Elbert County?
Median Family Income in Elbert County is $62,043.
What is the Median Household income in Elbert County?
Median Household Income in Elbert County is $48,190.
What is Income or Wage Gap in Elbert County?
Income or Wage Gap in Elbert County is 34.1%.
Women in Elbert County earn 65.9 cents for every dollar earned by a man.
What is Family Income Deficit in Elbert County?
Family Income Deficit in Elbert County is $11,840.
Families that are below poverty line in Elbert County earn $11,840 less on average than the poverty threshold level.
What is Inequality or Gini Index in Elbert County?
Inequality or Gini Index in Elbert County is 0.44.
What is the Total Population of Elbert County?
Total Population of Elbert County is 19,570.
What is the Total Male Population of Elbert County?
Total Male Population of Elbert County is 9,358.
What is the Total Female Population of Elbert County?
Total Female Population of Elbert County is 10,212.
What is the Ratio of Males per 100 Females in Elbert County?
There are 91.64 Males per 100 Females in Elbert County.
What is the Ratio of Females per 100 Males in Elbert County?
There are 109.13 Females per 100 Males in Elbert County.
What is the Median Population Age in Elbert County?
Median Population Age in Elbert County is 42.8 Years.
What is the Average Family Size in Elbert County
Average Family Size in Elbert County is 3.0 People.
What is the Average Household Size in Elbert County
Average Household Size in Elbert County is 2.5 People.
How Large is the Labor Force in Elbert County?
There are 9,217 People in the Labor Forcein in Elbert County.
What is the Percentage of People in the Labor Force in Elbert County?
58.3% of People are in the Labor Force in Elbert County.
What is the Unemployment Rate in Elbert County?
Unemployment Rate in Elbert County is 7.5%.