Effingham County, GA Map & Demographics
Effingham County Map
Effingham County Overview
$36,506
PER CAPITA INCOME
$92,126
AVG FAMILY INCOME
$79,474
AVG HOUSEHOLD INCOME
37.9%
WAGE / INCOME GAP [ % ]
62.1¢/ $1
WAGE / INCOME GAP [ $ ]
$11,419
FAMILY INCOME DEFICIT
0.41
INEQUALITY / GINI INDEX
65,314
TOTAL POPULATION
32,382
MALE POPULATION
32,932
FEMALE POPULATION
98.33
MALES / 100 FEMALES
101.70
FEMALES / 100 MALES
36.4
MEDIAN AGE
3.3
AVG FAMILY SIZE
2.9
AVG HOUSEHOLD SIZE
32,966
LABOR FORCE [ PEOPLE ]
65.9%
PERCENT IN LABOR FORCE
5.3%
UNEMPLOYMENT RATE
Effingham County Area Codes
Income in Effingham County
Income Overview in Effingham County
Per Capita Income in Effingham County is $36,506, while median incomes of families and households are $92,126 and $79,474 respectively.
| Characteristic | Number | Measure |
| Per Capita Income | 65,314 | $36,506 |
| Median Family Income | 17,014 | $92,126 |
| Mean Family Income | 17,014 | $111,733 |
| Median Household Income | 22,820 | $79,474 |
| Mean Household Income | 22,820 | $98,830 |
| Income Deficit | 17,014 | $11,419 |
| Wage / Income Gap (%) | 65,314 | 37.94% |
| Wage / Income Gap ($) | 65,314 | 62.06¢ per $1 |
| Gini / Inequality Index | 65,314 | 0.41 |
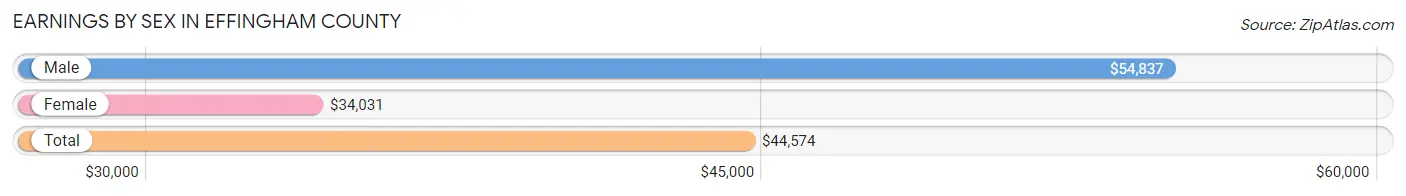
Earnings by Sex in Effingham County
Average Earnings in Effingham County are $44,574, $54,837 for men and $34,031 for women, a difference of 37.9%.
| Sex | Number | Average Earnings |
| Male | 18,142 (52.6%) | $54,837 |
| Female | 16,376 (47.4%) | $34,031 |
| Total | 34,518 (100.0%) | $44,574 |
Earnings by Sex by Income Bracket in Effingham County
The most common earnings brackets in Effingham County are $100,000+ for men (3,342 | 18.4%) and $55,000 to $64,999 for women (1,464 | 8.9%).
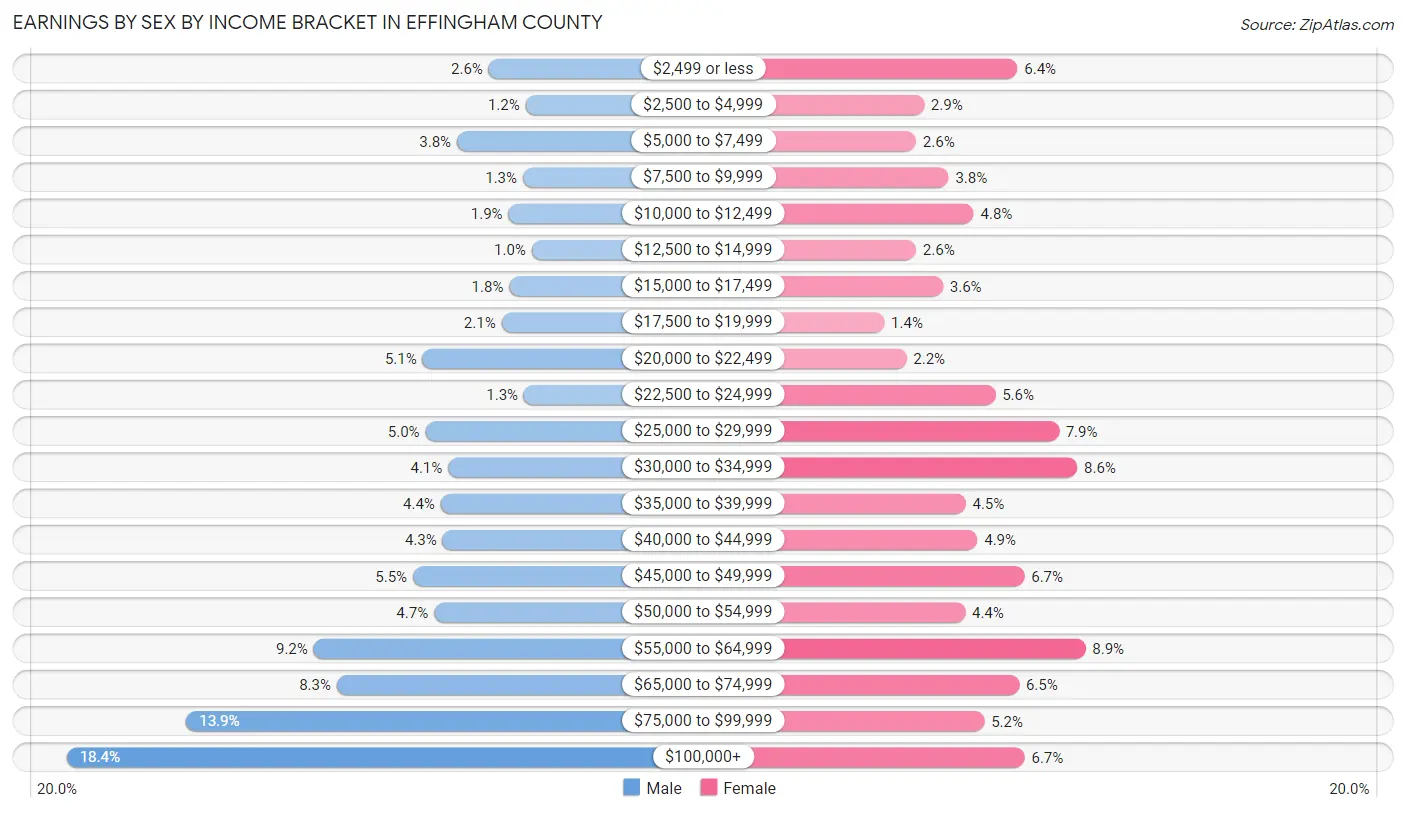
| Income | Male | Female |
| $2,499 or less | 473 (2.6%) | 1,046 (6.4%) |
| $2,500 to $4,999 | 224 (1.2%) | 473 (2.9%) |
| $5,000 to $7,499 | 689 (3.8%) | 424 (2.6%) |
| $7,500 to $9,999 | 242 (1.3%) | 624 (3.8%) |
| $10,000 to $12,499 | 340 (1.9%) | 778 (4.8%) |
| $12,500 to $14,999 | 182 (1.0%) | 424 (2.6%) |
| $15,000 to $17,499 | 333 (1.8%) | 589 (3.6%) |
| $17,500 to $19,999 | 387 (2.1%) | 229 (1.4%) |
| $20,000 to $22,499 | 923 (5.1%) | 366 (2.2%) |
| $22,500 to $24,999 | 234 (1.3%) | 910 (5.6%) |
| $25,000 to $29,999 | 904 (5.0%) | 1,301 (7.9%) |
| $30,000 to $34,999 | 749 (4.1%) | 1,414 (8.6%) |
| $35,000 to $39,999 | 800 (4.4%) | 729 (4.4%) |
| $40,000 to $44,999 | 787 (4.3%) | 800 (4.9%) |
| $45,000 to $49,999 | 989 (5.4%) | 1,089 (6.7%) |
| $50,000 to $54,999 | 846 (4.7%) | 725 (4.4%) |
| $55,000 to $64,999 | 1,664 (9.2%) | 1,464 (8.9%) |
| $65,000 to $74,999 | 1,505 (8.3%) | 1,056 (6.5%) |
| $75,000 to $99,999 | 2,529 (13.9%) | 844 (5.1%) |
| $100,000+ | 3,342 (18.4%) | 1,091 (6.7%) |
| Total | 18,142 (100.0%) | 16,376 (100.0%) |
Earnings by Sex by Educational Attainment in Effingham County
Average earnings in Effingham County are $60,315 for men and $40,332 for women, a difference of 33.1%. Men with an educational attainment of graduate degree enjoy the highest average annual earnings of $96,987, while those with less than high school education earn the least with $42,697. Women with an educational attainment of bachelor's degree earn the most with the average annual earnings of $59,864, while those with less than high school education have the smallest earnings of $20,679.
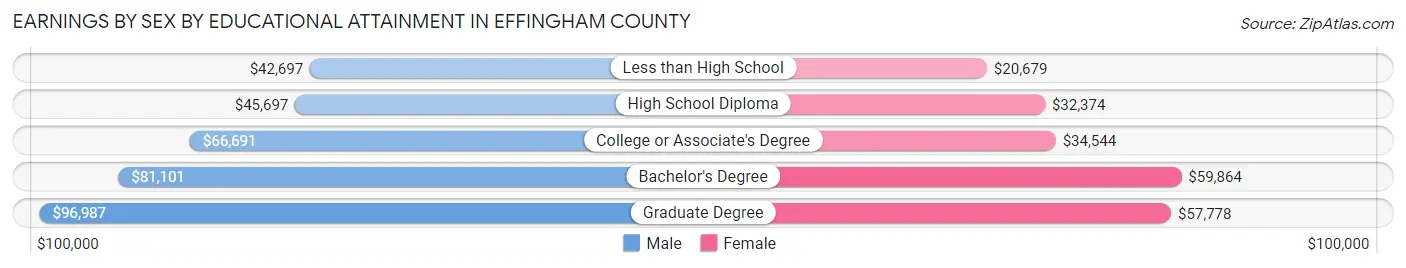
| Educational Attainment | Male Income | Female Income |
| Less than High School | $42,697 | $20,679 |
| High School Diploma | $45,697 | $32,374 |
| College or Associate's Degree | $66,691 | $34,544 |
| Bachelor's Degree | $81,101 | $59,864 |
| Graduate Degree | $96,987 | $57,778 |
| Total | $60,315 | $40,332 |
Family Income in Effingham County
Family Income Brackets in Effingham County
According to the Effingham County family income data, there are 4,168 families falling into the $100,000 to $149,999 income range, which is the most common income bracket and makes up 24.5% of all families. Conversely, the $10,000 to $14,999 income bracket is the least frequent group with only 153 families (0.9%) belonging to this category.
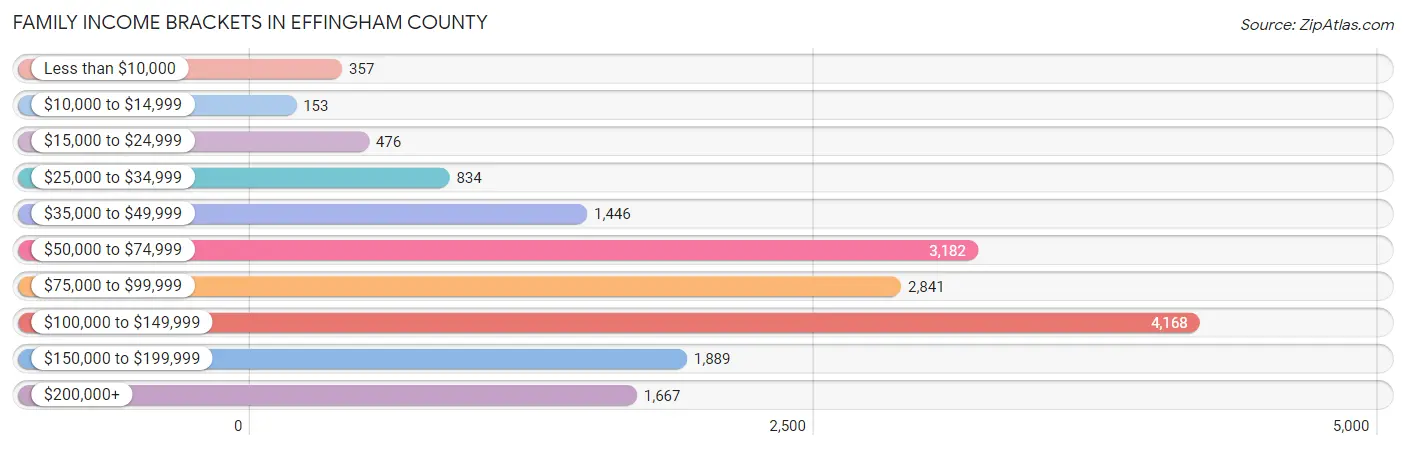
| Income Bracket | # Families | % Families |
| Less than $10,000 | 357 | 2.1% |
| $10,000 to $14,999 | 153 | 0.9% |
| $15,000 to $24,999 | 476 | 2.8% |
| $25,000 to $34,999 | 834 | 4.9% |
| $35,000 to $49,999 | 1,446 | 8.5% |
| $50,000 to $74,999 | 3,182 | 18.7% |
| $75,000 to $99,999 | 2,841 | 16.7% |
| $100,000 to $149,999 | 4,168 | 24.5% |
| $150,000 to $199,999 | 1,889 | 11.1% |
| $200,000+ | 1,667 | 9.8% |
Family Income by Famaliy Size in Effingham County
7+ person families (298 | 1.8%) account for the highest median family income in Effingham County with $127,125 per family, while 2-person families (8,335 | 49.0%) have the highest median income of $37,258 per family member.
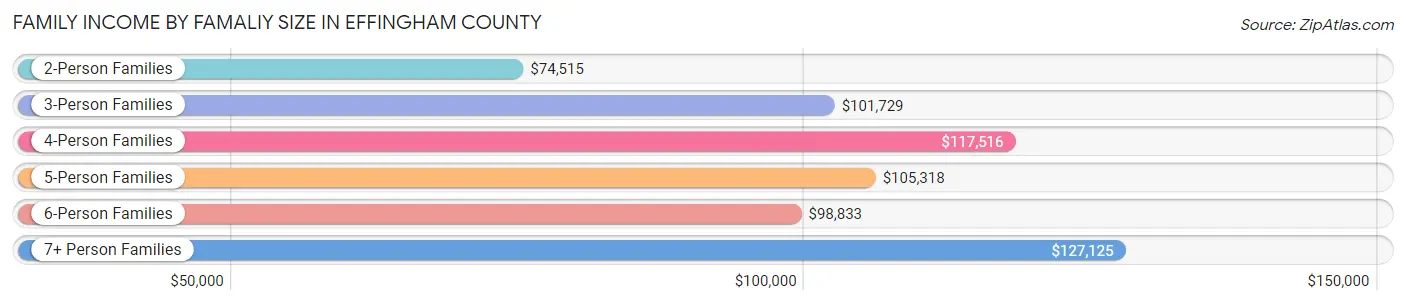
| Income Bracket | # Families | Median Income |
| 2-Person Families | 8,335 (49.0%) | $74,515 |
| 3-Person Families | 3,461 (20.3%) | $101,729 |
| 4-Person Families | 3,106 (18.3%) | $117,516 |
| 5-Person Families | 1,396 (8.2%) | $105,318 |
| 6-Person Families | 418 (2.5%) | $98,833 |
| 7+ Person Families | 298 (1.8%) | $127,125 |
| Total | 17,014 (100.0%) | $92,126 |
Family Income by Number of Earners in Effingham County
The median family income in Effingham County is $92,126, with families comprising 3+ earners (1,502) having the highest median family income of $158,452, while families with no earners (1,942) have the lowest median family income of $48,704, accounting for 8.8% and 11.4% of families, respectively.
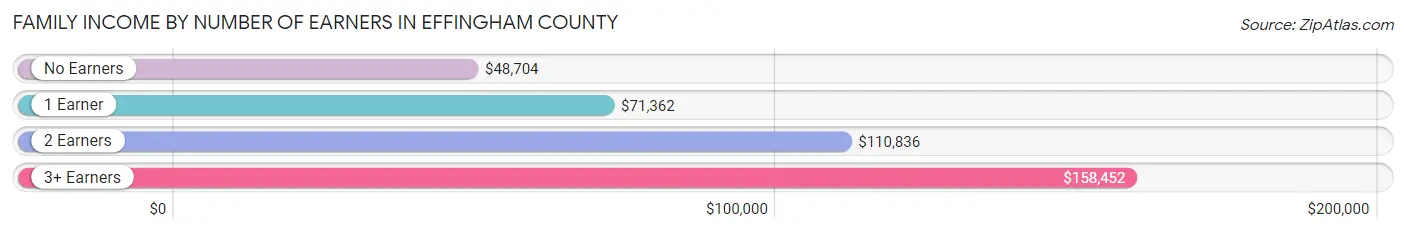
| Number of Earners | # Families | Median Income |
| No Earners | 1,942 (11.4%) | $48,704 |
| 1 Earner | 5,699 (33.5%) | $71,362 |
| 2 Earners | 7,871 (46.3%) | $110,836 |
| 3+ Earners | 1,502 (8.8%) | $158,452 |
| Total | 17,014 (100.0%) | $92,126 |
Household Income in Effingham County
Household Income Brackets in Effingham County
With 4,815 households falling in the category, the $100,000 to $149,999 income range is the most frequent in Effingham County, accounting for 21.1% of all households. In contrast, only 570 households (2.5%) fall into the $10,000 to $14,999 income bracket, making it the least populous group.
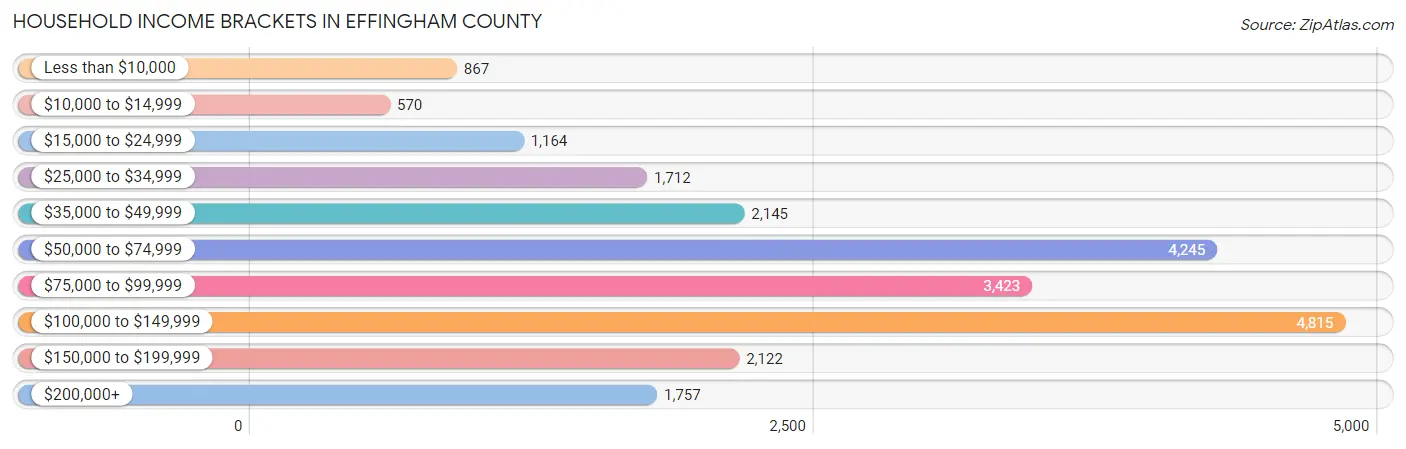
| Income Bracket | # Households | % Households |
| Less than $10,000 | 867 | 3.8% |
| $10,000 to $14,999 | 570 | 2.5% |
| $15,000 to $24,999 | 1,164 | 5.1% |
| $25,000 to $34,999 | 1,712 | 7.5% |
| $35,000 to $49,999 | 2,145 | 9.4% |
| $50,000 to $74,999 | 4,245 | 18.6% |
| $75,000 to $99,999 | 3,423 | 15.0% |
| $100,000 to $149,999 | 4,815 | 21.1% |
| $150,000 to $199,999 | 2,122 | 9.3% |
| $200,000+ | 1,757 | 7.7% |
Household Income by Householder Age in Effingham County
The median household income in Effingham County is $79,474, with the highest median household income of $90,638 found in the 25 to 44 years age bracket for the primary householder. A total of 8,887 households (38.9%) fall into this category. Meanwhile, the 15 to 24 years age bracket for the primary householder has the lowest median household income of $33,818, with 720 households (3.2%) in this group.
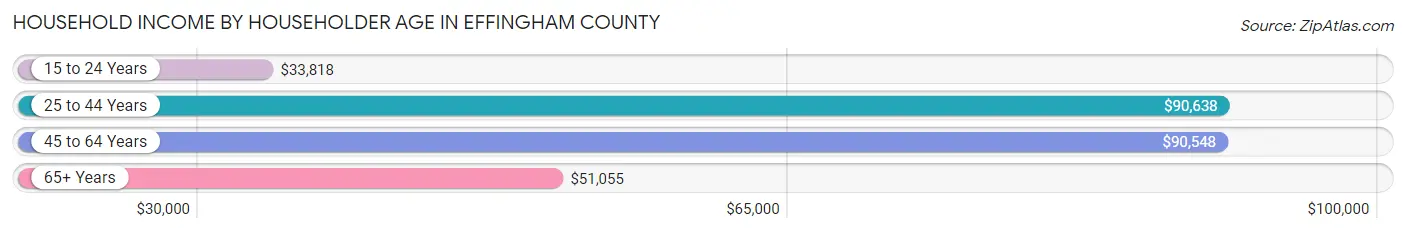
| Income Bracket | # Households | Median Income |
| 15 to 24 Years | 720 (3.2%) | $33,818 |
| 25 to 44 Years | 8,887 (38.9%) | $90,638 |
| 45 to 64 Years | 8,972 (39.3%) | $90,548 |
| 65+ Years | 4,241 (18.6%) | $51,055 |
| Total | 22,820 (100.0%) | $79,474 |
Poverty in Effingham County
Income Below Poverty by Sex and Age in Effingham County
With 6.4% poverty level for males and 6.8% for females among the residents of Effingham County, 16 and 17 year old males and 55 to 64 year old females are the most vulnerable to poverty, with 201 males (21.8%) and 511 females (12.6%) in their respective age groups living below the poverty level.

| Age Bracket | Male | Female |
| Under 5 Years | 143 (6.6%) | 153 (8.0%) |
| 5 Years | 0 (0.0%) | 0 (0.0%) |
| 6 to 11 Years | 151 (4.6%) | 87 (2.9%) |
| 12 to 14 Years | 78 (5.8%) | 76 (4.9%) |
| 15 Years | 114 (15.2%) | 13 (3.8%) |
| 16 and 17 Years | 201 (21.8%) | 90 (8.6%) |
| 18 to 24 Years | 332 (12.3%) | 93 (3.5%) |
| 25 to 34 Years | 112 (2.7%) | 265 (6.0%) |
| 35 to 44 Years | 23 (0.5%) | 317 (6.6%) |
| 45 to 54 Years | 87 (2.1%) | 206 (4.8%) |
| 55 to 64 Years | 328 (8.3%) | 511 (12.6%) |
| 65 to 74 Years | 355 (15.2%) | 279 (10.5%) |
| 75 Years and over | 139 (12.3%) | 137 (8.8%) |
| Total | 2,063 (6.4%) | 2,227 (6.8%) |
Income Above Poverty by Sex and Age in Effingham County
According to the poverty statistics in Effingham County, males aged 5 years and females aged 5 years are the age groups that are most secure financially, with 100.0% of males and 100.0% of females in these age groups living above the poverty line.
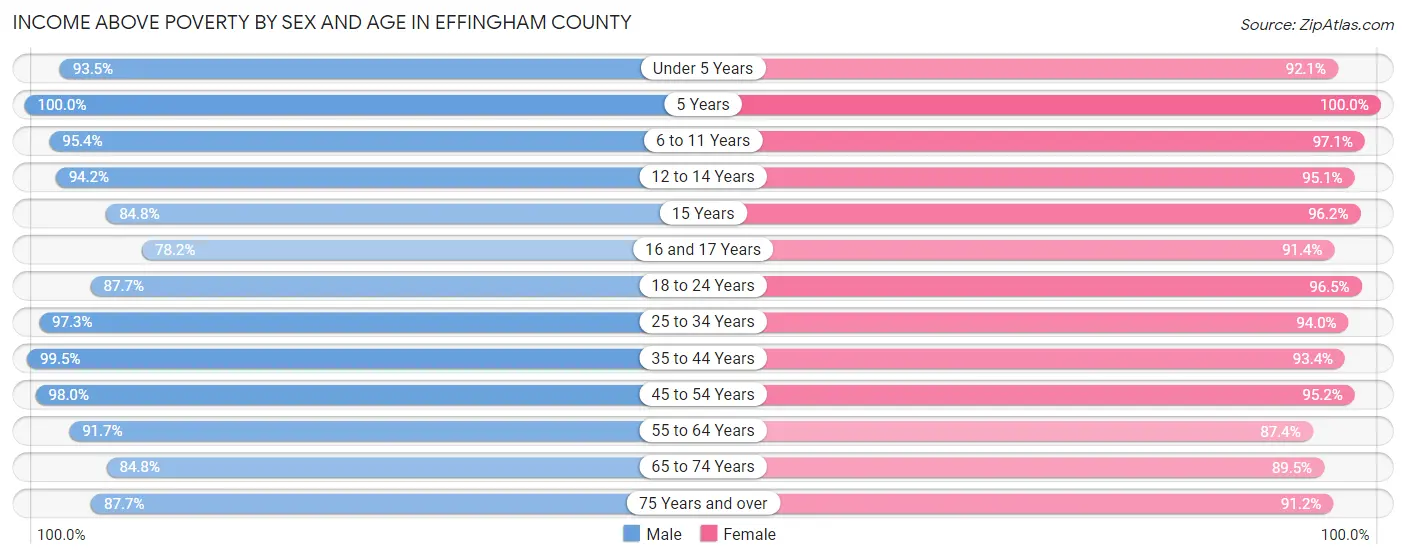
| Age Bracket | Male | Female |
| Under 5 Years | 2,041 (93.4%) | 1,771 (92.0%) |
| 5 Years | 264 (100.0%) | 472 (100.0%) |
| 6 to 11 Years | 3,140 (95.4%) | 2,875 (97.1%) |
| 12 to 14 Years | 1,271 (94.2%) | 1,487 (95.1%) |
| 15 Years | 638 (84.8%) | 331 (96.2%) |
| 16 and 17 Years | 720 (78.2%) | 955 (91.4%) |
| 18 to 24 Years | 2,376 (87.7%) | 2,530 (96.5%) |
| 25 to 34 Years | 4,036 (97.3%) | 4,185 (94.0%) |
| 35 to 44 Years | 4,814 (99.5%) | 4,474 (93.4%) |
| 45 to 54 Years | 4,152 (98.0%) | 4,080 (95.2%) |
| 55 to 64 Years | 3,627 (91.7%) | 3,533 (87.4%) |
| 65 to 74 Years | 1,977 (84.8%) | 2,376 (89.5%) |
| 75 Years and over | 987 (87.7%) | 1,419 (91.2%) |
| Total | 30,043 (93.6%) | 30,488 (93.2%) |
Income Below Poverty Among Married-Couple Families in Effingham County
The poverty statistics for married-couple families in Effingham County show that 3.1% or 416 of the total 13,298 families live below the poverty line. Families with 3 or 4 children have the highest poverty rate of 5.8%, comprising of 75 families. On the other hand, families with 5 or more children have the lowest poverty rate of 0.0%, which includes 0 families.
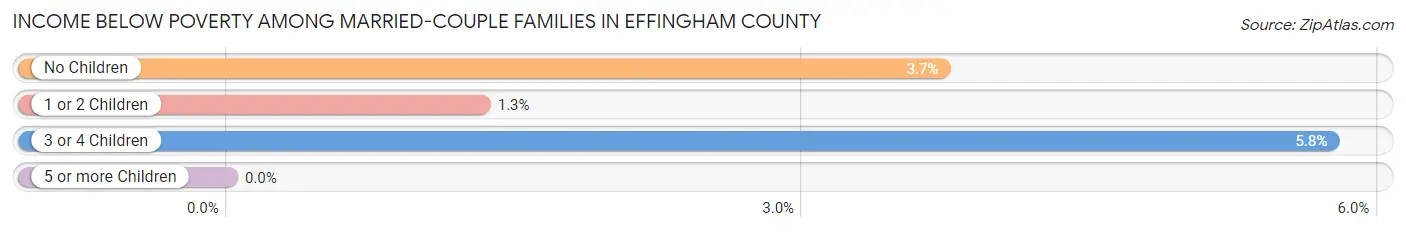
| Children | Above Poverty | Below Poverty |
| No Children | 7,360 (96.3%) | 284 (3.7%) |
| 1 or 2 Children | 4,264 (98.7%) | 57 (1.3%) |
| 3 or 4 Children | 1,229 (94.3%) | 75 (5.8%) |
| 5 or more Children | 29 (100.0%) | 0 (0.0%) |
| Total | 12,882 (96.9%) | 416 (3.1%) |
Income Below Poverty Among Single-Parent Households in Effingham County
According to the poverty data in Effingham County, 5.2% or 55 single-father households and 11.9% or 317 single-mother households are living below the poverty line. Among single-father households, those with 1 or 2 children have the highest poverty rate, with 37 households (7.3%) experiencing poverty. Likewise, among single-mother households, those with 3 or 4 children have the highest poverty rate, with 79 households (35.3%) falling below the poverty line.
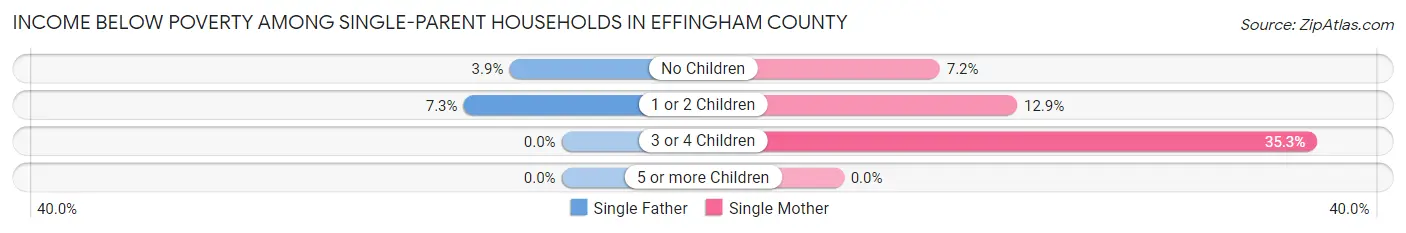
| Children | Single Father | Single Mother |
| No Children | 18 (3.9%) | 95 (7.2%) |
| 1 or 2 Children | 37 (7.3%) | 143 (12.9%) |
| 3 or 4 Children | 0 (0.0%) | 79 (35.3%) |
| 5 or more Children | 0 (0.0%) | 0 (0.0%) |
| Total | 55 (5.2%) | 317 (11.9%) |
Income Below Poverty Among Married-Couple vs Single-Parent Households in Effingham County
The poverty data for Effingham County shows that 416 of the married-couple family households (3.1%) and 372 of the single-parent households (10.0%) are living below the poverty level. Within the married-couple family households, those with 3 or 4 children have the highest poverty rate, with 75 households (5.8%) falling below the poverty line. Among the single-parent households, those with 3 or 4 children have the highest poverty rate, with 79 household (26.2%) living below poverty.
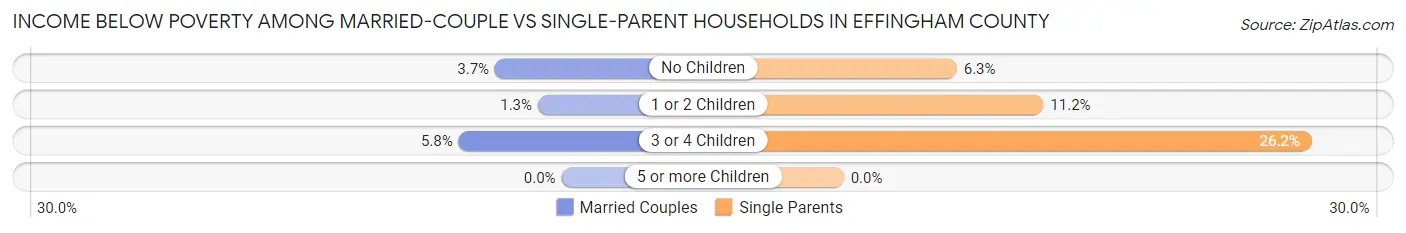
| Children | Married-Couple Families | Single-Parent Households |
| No Children | 284 (3.7%) | 113 (6.3%) |
| 1 or 2 Children | 57 (1.3%) | 180 (11.2%) |
| 3 or 4 Children | 75 (5.8%) | 79 (26.2%) |
| 5 or more Children | 0 (0.0%) | 0 (0.0%) |
| Total | 416 (3.1%) | 372 (10.0%) |
Race in Effingham County
The most populous races in Effingham County are White / Caucasian (50,603 | 77.5%), Black / African American (8,968 | 13.7%), and Two or more Races (3,827 | 5.9%).
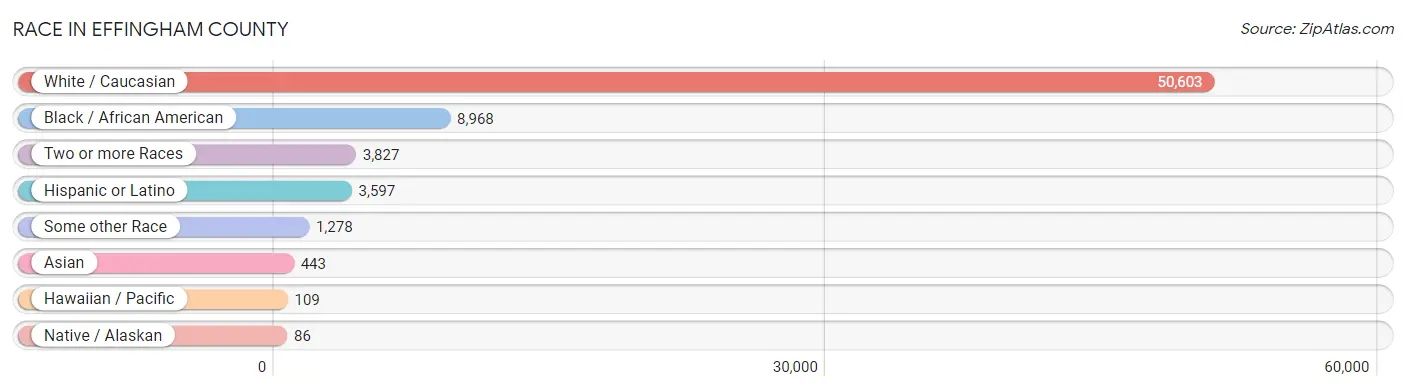
| Race | # Population | % Population |
| Asian | 443 | 0.7% |
| Black / African American | 8,968 | 13.7% |
| Hawaiian / Pacific | 109 | 0.2% |
| Hispanic or Latino | 3,597 | 5.5% |
| Native / Alaskan | 86 | 0.1% |
| White / Caucasian | 50,603 | 77.5% |
| Two or more Races | 3,827 | 5.9% |
| Some other Race | 1,278 | 2.0% |
| Total | 65,314 | 100.0% |
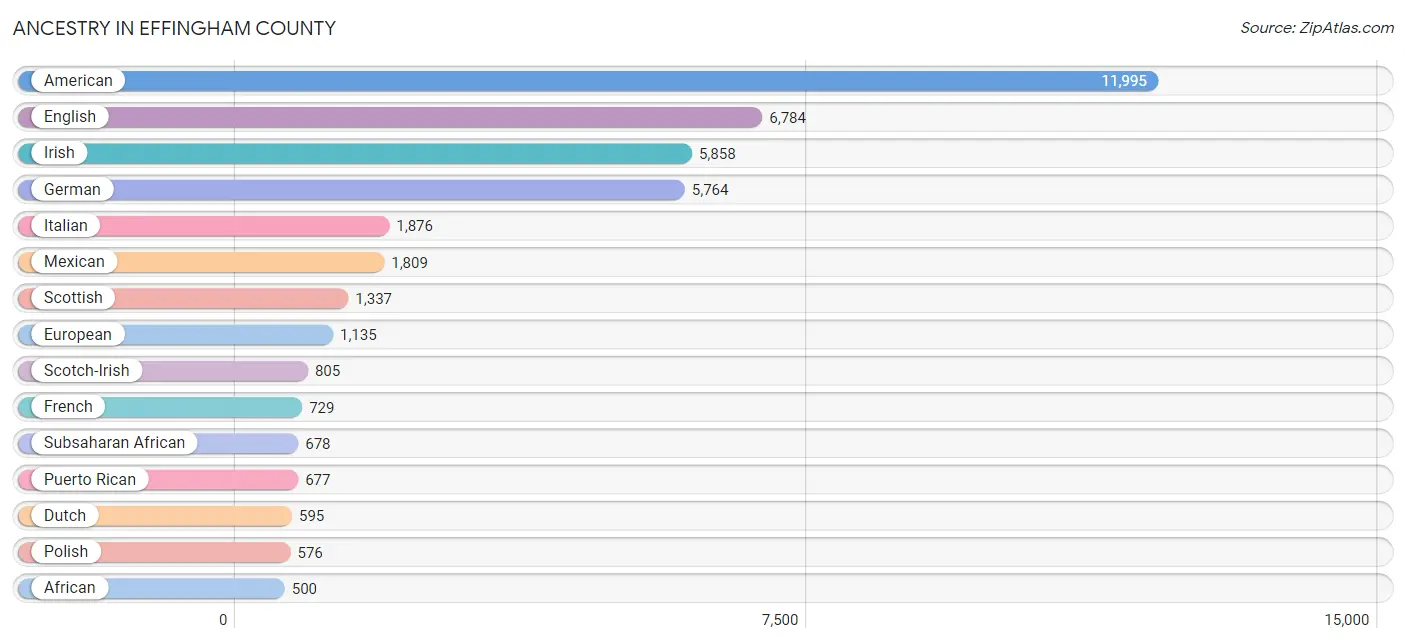
Ancestry in Effingham County
The most populous ancestries reported in Effingham County are American (11,995 | 18.4%), English (6,784 | 10.4%), Irish (5,858 | 9.0%), German (5,764 | 8.8%), and Italian (1,876 | 2.9%), together accounting for 49.4% of all Effingham County residents.
| Ancestry | # Population | % Population |
| African | 500 | 0.8% |
| American | 11,995 | 18.4% |
| Apache | 144 | 0.2% |
| Arab | 40 | 0.1% |
| Argentinean | 48 | 0.1% |
| Armenian | 11 | 0.0% |
| Australian | 40 | 0.1% |
| Austrian | 251 | 0.4% |
| Bahamian | 68 | 0.1% |
| Belgian | 80 | 0.1% |
| Bhutanese | 114 | 0.2% |
| Brazilian | 54 | 0.1% |
| British | 252 | 0.4% |
| British West Indian | 15 | 0.0% |
| Burmese | 117 | 0.2% |
| Cajun | 44 | 0.1% |
| Cambodian | 15 | 0.0% |
| Canadian | 65 | 0.1% |
| Cape Verdean | 166 | 0.3% |
| Celtic | 43 | 0.1% |
| Central American | 100 | 0.2% |
| Cherokee | 379 | 0.6% |
| Chippewa | 20 | 0.0% |
| Colombian | 135 | 0.2% |
| Costa Rican | 41 | 0.1% |
| Creek | 6 | 0.0% |
| Croatian | 3 | 0.0% |
| Cuban | 442 | 0.7% |
| Czech | 37 | 0.1% |
| Czechoslovakian | 33 | 0.1% |
| Danish | 44 | 0.1% |
| Dominican | 141 | 0.2% |
| Dutch | 595 | 0.9% |
| Eastern European | 43 | 0.1% |
| Ecuadorian | 9 | 0.0% |
| English | 6,784 | 10.4% |
| European | 1,135 | 1.7% |
| Finnish | 82 | 0.1% |
| French | 729 | 1.1% |
| French Canadian | 202 | 0.3% |
| German | 5,764 | 8.8% |
| Greek | 199 | 0.3% |
| Guatemalan | 59 | 0.1% |
| Guyanese | 14 | 0.0% |
| Hungarian | 67 | 0.1% |
| Indian (Asian) | 256 | 0.4% |
| Iranian | 4 | 0.0% |
| Irish | 5,858 | 9.0% |
| Iroquois | 29 | 0.0% |
| Israeli | 19 | 0.0% |
| Italian | 1,876 | 2.9% |
| Jamaican | 191 | 0.3% |
| Korean | 428 | 0.7% |
| Laotian | 6 | 0.0% |
| Latvian | 19 | 0.0% |
| Lebanese | 15 | 0.0% |
| Lithuanian | 10 | 0.0% |
| Lumbee | 47 | 0.1% |
| Mexican | 1,809 | 2.8% |
| Native Hawaiian | 54 | 0.1% |
| Navajo | 144 | 0.2% |
| Nigerian | 6 | 0.0% |
| Northern European | 43 | 0.1% |
| Norwegian | 240 | 0.4% |
| Pakistani | 309 | 0.5% |
| Pennsylvania German | 51 | 0.1% |
| Polish | 576 | 0.9% |
| Portuguese | 110 | 0.2% |
| Puerto Rican | 677 | 1.0% |
| Romanian | 33 | 0.1% |
| Russian | 154 | 0.2% |
| Scandinavian | 103 | 0.2% |
| Scotch-Irish | 805 | 1.2% |
| Scottish | 1,337 | 2.1% |
| Slovak | 16 | 0.0% |
| Slovene | 7 | 0.0% |
| South African | 6 | 0.0% |
| South American | 228 | 0.4% |
| South American Indian | 27 | 0.0% |
| Spaniard | 69 | 0.1% |
| Spanish | 22 | 0.0% |
| Sri Lankan | 156 | 0.2% |
| Subsaharan African | 678 | 1.0% |
| Swedish | 233 | 0.4% |
| Swiss | 27 | 0.0% |
| Syrian | 25 | 0.0% |
| Thai | 197 | 0.3% |
| Trinidadian and Tobagonian | 41 | 0.1% |
| Ukrainian | 32 | 0.1% |
| Venezuelan | 9 | 0.0% |
| Welsh | 268 | 0.4% | View All 91 Rows |
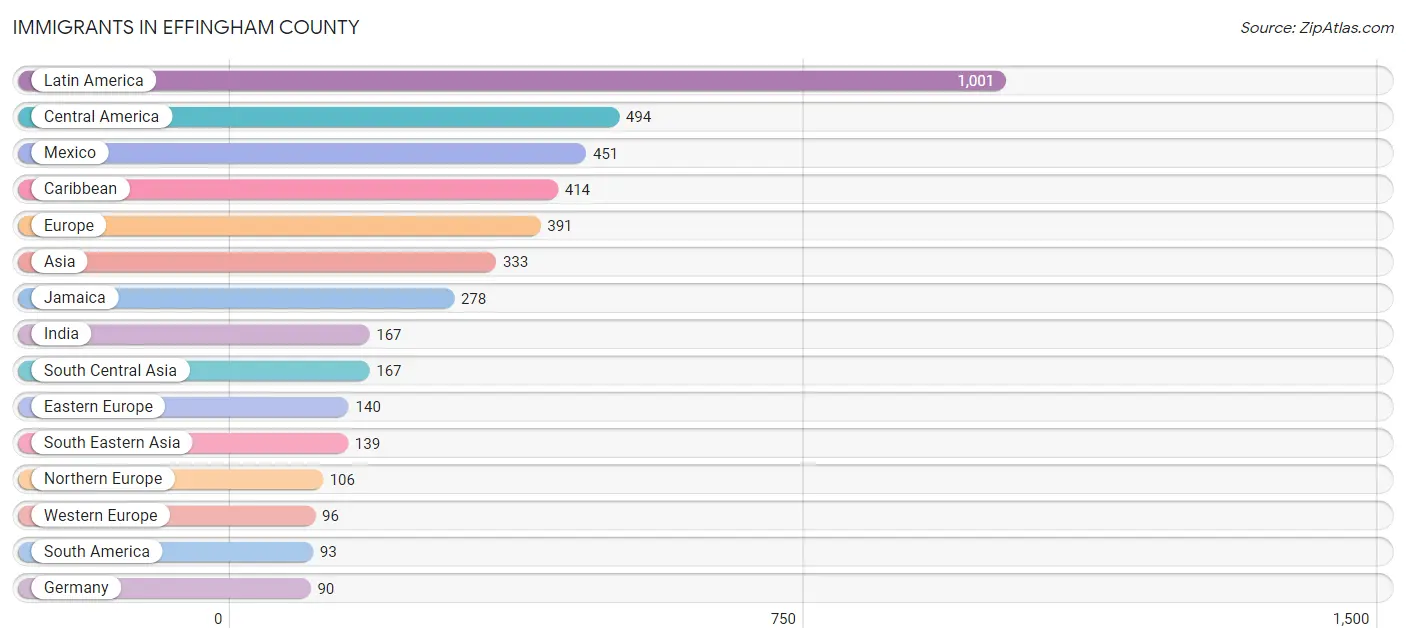
Immigrants in Effingham County
The most numerous immigrant groups reported in Effingham County came from Latin America (1,001 | 1.5%), Central America (494 | 0.8%), Mexico (451 | 0.7%), Caribbean (414 | 0.6%), and Europe (391 | 0.6%), together accounting for 4.2% of all Effingham County residents.
| Immigration Origin | # Population | % Population |
| Africa | 7 | 0.0% |
| Asia | 333 | 0.5% |
| Australia | 21 | 0.0% |
| Bahamas | 68 | 0.1% |
| Brazil | 39 | 0.1% |
| Canada | 18 | 0.0% |
| Caribbean | 414 | 0.6% |
| Central America | 494 | 0.8% |
| Colombia | 27 | 0.0% |
| Costa Rica | 32 | 0.1% |
| Cuba | 23 | 0.0% |
| Dominican Republic | 22 | 0.0% |
| Eastern Africa | 7 | 0.0% |
| Eastern Asia | 27 | 0.0% |
| Eastern Europe | 140 | 0.2% |
| Ecuador | 27 | 0.0% |
| England | 50 | 0.1% |
| Europe | 391 | 0.6% |
| Fiji | 5 | 0.0% |
| France | 6 | 0.0% |
| Germany | 90 | 0.1% |
| Greece | 19 | 0.0% |
| Guatemala | 11 | 0.0% |
| India | 167 | 0.3% |
| Indonesia | 6 | 0.0% |
| Ireland | 46 | 0.1% |
| Jamaica | 278 | 0.4% |
| Korea | 27 | 0.0% |
| Latin America | 1,001 | 1.5% |
| Latvia | 19 | 0.0% |
| Mexico | 451 | 0.7% |
| Northern Europe | 106 | 0.2% |
| Norway | 10 | 0.0% |
| Oceania | 26 | 0.0% |
| Philippines | 56 | 0.1% |
| Poland | 86 | 0.1% |
| Portugal | 8 | 0.0% |
| Romania | 16 | 0.0% |
| Russia | 19 | 0.0% |
| South America | 93 | 0.1% |
| South Central Asia | 167 | 0.3% |
| South Eastern Asia | 139 | 0.2% |
| Southern Europe | 49 | 0.1% |
| Spain | 22 | 0.0% |
| Thailand | 16 | 0.0% |
| Trinidad and Tobago | 8 | 0.0% |
| Vietnam | 61 | 0.1% |
| Western Europe | 96 | 0.2% | View All 48 Rows |
Sex and Age in Effingham County
Sex and Age in Effingham County
The most populous age groups in Effingham County are 40 to 44 Years (2,717 | 8.4%) for men and 35 to 39 Years (2,575 | 7.8%) for women.
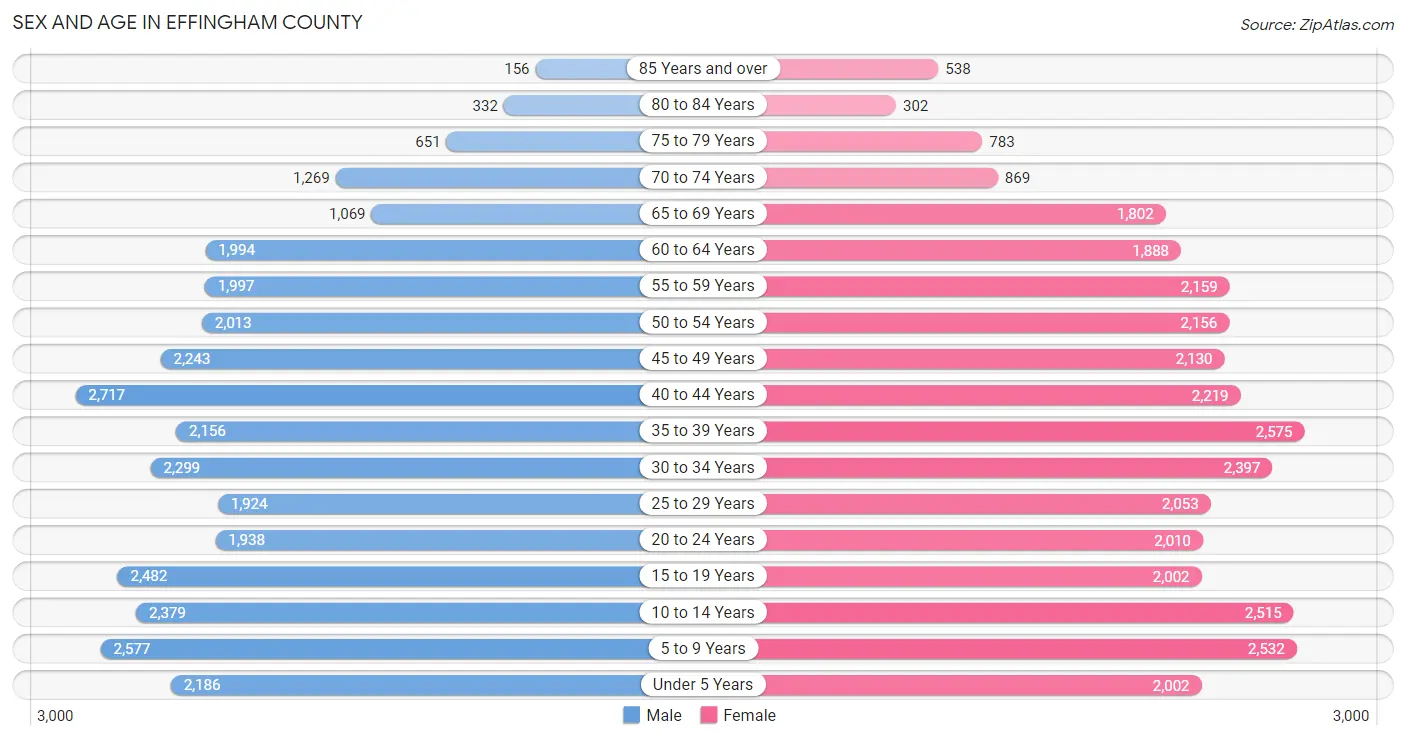
| Age Bracket | Male | Female |
| Under 5 Years | 2,186 (6.8%) | 2,002 (6.1%) |
| 5 to 9 Years | 2,577 (8.0%) | 2,532 (7.7%) |
| 10 to 14 Years | 2,379 (7.3%) | 2,515 (7.6%) |
| 15 to 19 Years | 2,482 (7.7%) | 2,002 (6.1%) |
| 20 to 24 Years | 1,938 (6.0%) | 2,010 (6.1%) |
| 25 to 29 Years | 1,924 (5.9%) | 2,053 (6.2%) |
| 30 to 34 Years | 2,299 (7.1%) | 2,397 (7.3%) |
| 35 to 39 Years | 2,156 (6.7%) | 2,575 (7.8%) |
| 40 to 44 Years | 2,717 (8.4%) | 2,219 (6.7%) |
| 45 to 49 Years | 2,243 (6.9%) | 2,130 (6.5%) |
| 50 to 54 Years | 2,013 (6.2%) | 2,156 (6.6%) |
| 55 to 59 Years | 1,997 (6.2%) | 2,159 (6.6%) |
| 60 to 64 Years | 1,994 (6.2%) | 1,888 (5.7%) |
| 65 to 69 Years | 1,069 (3.3%) | 1,802 (5.5%) |
| 70 to 74 Years | 1,269 (3.9%) | 869 (2.6%) |
| 75 to 79 Years | 651 (2.0%) | 783 (2.4%) |
| 80 to 84 Years | 332 (1.0%) | 302 (0.9%) |
| 85 Years and over | 156 (0.5%) | 538 (1.6%) |
| Total | 32,382 (100.0%) | 32,932 (100.0%) |
Families and Households in Effingham County
Median Family Size in Effingham County
The median family size in Effingham County is 3.34 persons per family, with married-couple families (13,298 | 78.2%) accounting for the largest median family size of 3.41 persons per family. On the other hand, single male/father families (1,059 | 6.2%) represent the smallest median family size with 2.92 persons per family.
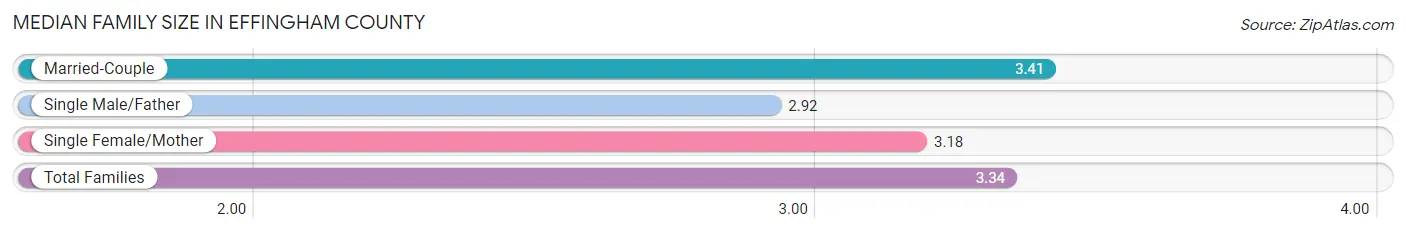
| Family Type | # Families | Family Size |
| Married-Couple | 13,298 (78.2%) | 3.41 |
| Single Male/Father | 1,059 (6.2%) | 2.92 |
| Single Female/Mother | 2,657 (15.6%) | 3.18 |
| Total Families | 17,014 (100.0%) | 3.34 |
Median Household Size in Effingham County
The median household size in Effingham County is 2.85 persons per household, with married-couple households (13,298 | 58.3%) accounting for the largest median household size of 3.43 persons per household. non-family households (5,806 | 25.4%) represent the smallest median household size with 1.18 persons per household.
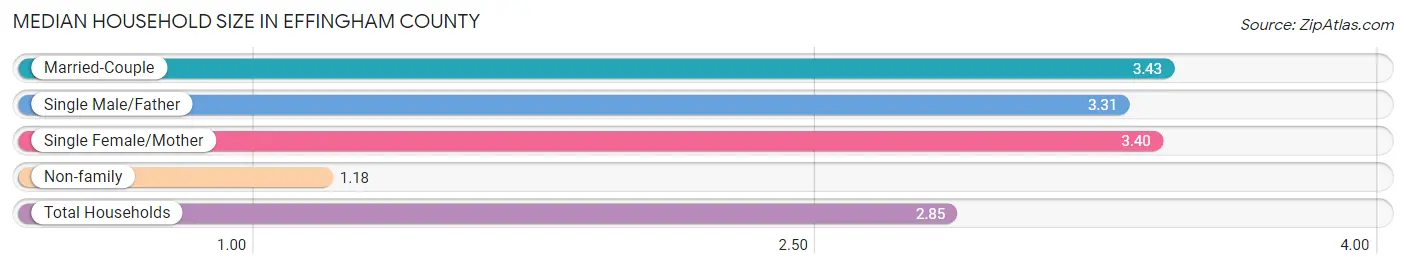
| Household Type | # Households | Household Size |
| Married-Couple | 13,298 (58.3%) | 3.43 |
| Single Male/Father | 1,059 (4.6%) | 3.31 |
| Single Female/Mother | 2,657 (11.6%) | 3.40 |
| Non-family | 5,806 (25.4%) | 1.18 |
| Total Households | 22,820 (100.0%) | 2.85 |
Household Size by Marriage Status in Effingham County
Out of a total of 22,820 households in Effingham County, 17,014 (74.6%) are family households, while 5,806 (25.4%) are nonfamily households. The most numerous type of family households are 2-person households, comprising 7,648, and the most common type of nonfamily households are 1-person households, comprising 5,173.
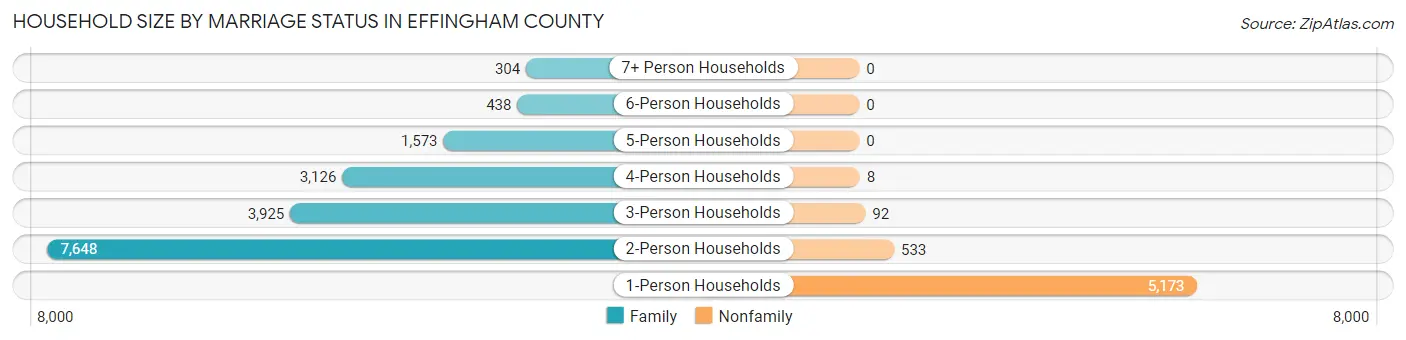
| Household Size | Family Households | Nonfamily Households |
| 1-Person Households | - | 5,173 (22.7%) |
| 2-Person Households | 7,648 (33.5%) | 533 (2.3%) |
| 3-Person Households | 3,925 (17.2%) | 92 (0.4%) |
| 4-Person Households | 3,126 (13.7%) | 8 (0.0%) |
| 5-Person Households | 1,573 (6.9%) | 0 (0.0%) |
| 6-Person Households | 438 (1.9%) | 0 (0.0%) |
| 7+ Person Households | 304 (1.3%) | 0 (0.0%) |
| Total | 17,014 (74.6%) | 5,806 (25.4%) |
Female Fertility in Effingham County
Fertility by Age in Effingham County
Average fertility rate in Effingham County is 88.0 births per 1,000 women. Women in the age bracket of 20 to 34 years have the highest fertility rate with 138.0 births per 1,000 women. Women in the age bracket of 20 to 34 years acount for 64.2% of all women with births.
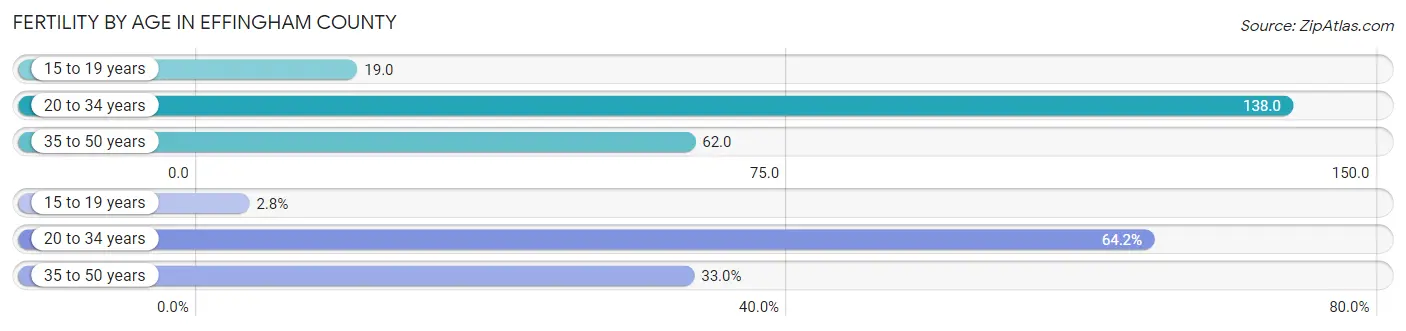
| Age Bracket | Women with Births | Births / 1,000 Women |
| 15 to 19 years | 39 (2.8%) | 19.0 |
| 20 to 34 years | 891 (64.2%) | 138.0 |
| 35 to 50 years | 458 (33.0%) | 62.0 |
| Total | 1,388 (100.0%) | 88.0 |
Fertility by Age by Marriage Status in Effingham County
78.6% of women with births (1,388) in Effingham County are married. The highest percentage of unmarried women with births falls into 35 to 50 years age bracket with 28.8% of them unmarried at the time of birth, while the lowest percentage of unmarried women with births belong to 15 to 19 years age bracket with 15.4% of them unmarried.
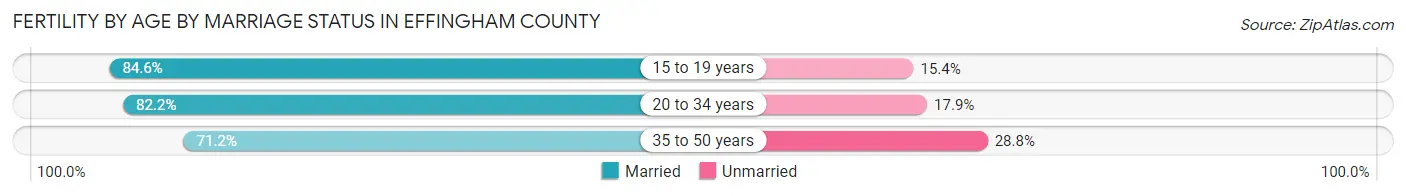
| Age Bracket | Married | Unmarried |
| 15 to 19 years | 33 (84.6%) | 6 (15.4%) |
| 20 to 34 years | 732 (82.2%) | 159 (17.8%) |
| 35 to 50 years | 326 (71.2%) | 132 (28.8%) |
| Total | 1,091 (78.6%) | 297 (21.4%) |
Fertility by Education in Effingham County
Average fertility rate in Effingham County is 88.0 births per 1,000 women. Women with the education attainment of college or associate's degree have the highest fertility rate of 106.0 births per 1,000 women, while women with the education attainment of less than high school have the lowest fertility at 31.0 births per 1,000 women. Women with the education attainment of college or associate's degree represent 38.9% of all women with births.
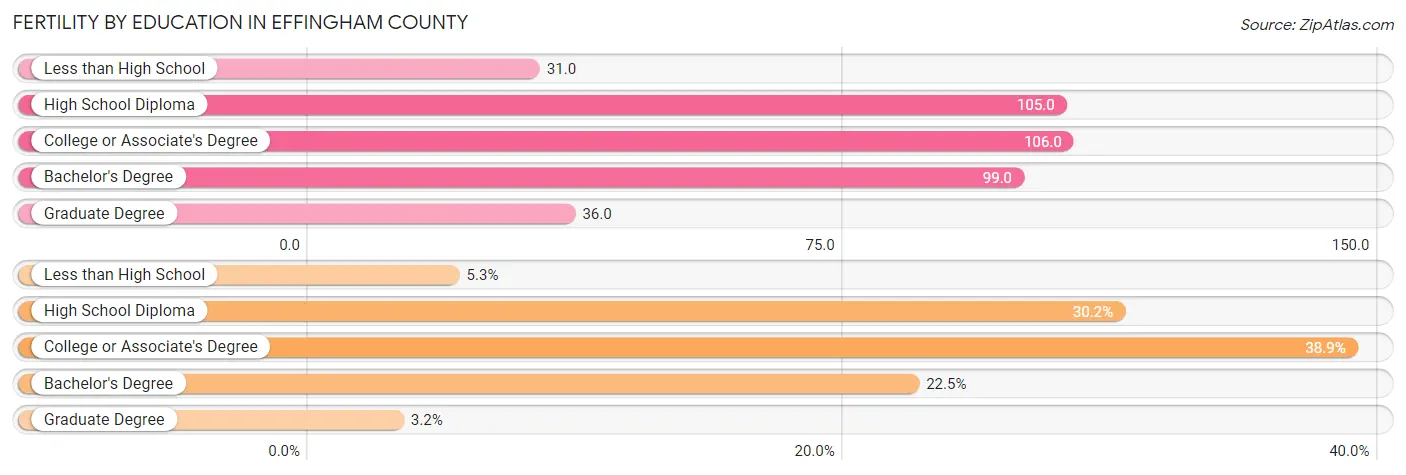
| Educational Attainment | Women with Births | Births / 1,000 Women |
| Less than High School | 73 (5.3%) | 31.0 |
| High School Diploma | 419 (30.2%) | 105.0 |
| College or Associate's Degree | 540 (38.9%) | 106.0 |
| Bachelor's Degree | 312 (22.5%) | 99.0 |
| Graduate Degree | 44 (3.2%) | 36.0 |
| Total | 1,388 (100.0%) | 88.0 |
Fertility by Education by Marriage Status in Effingham County
21.4% of women with births in Effingham County are unmarried. Women with the educational attainment of graduate degree are most likely to be married with 100.0% of them married at childbirth, while women with the educational attainment of less than high school are least likely to be married with 28.8% of them unmarried at childbirth.
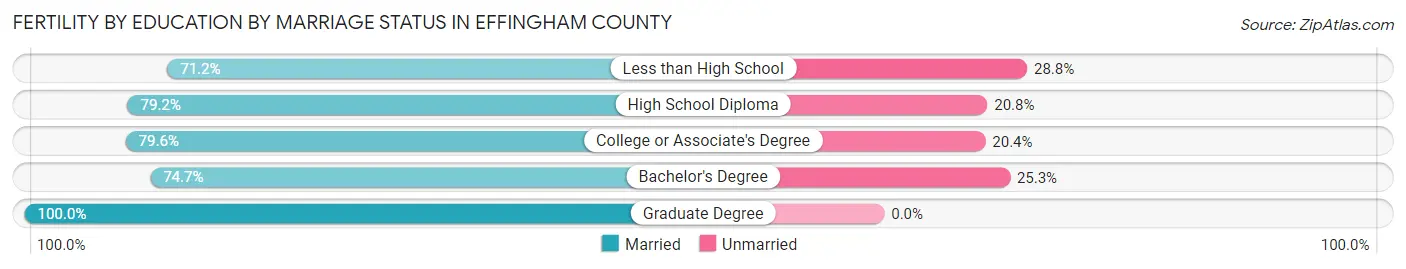
| Educational Attainment | Married | Unmarried |
| Less than High School | 52 (71.2%) | 21 (28.8%) |
| High School Diploma | 332 (79.2%) | 87 (20.8%) |
| College or Associate's Degree | 430 (79.6%) | 110 (20.4%) |
| Bachelor's Degree | 233 (74.7%) | 79 (25.3%) |
| Graduate Degree | 44 (100.0%) | 0 (0.0%) |
| Total | 1,091 (78.6%) | 297 (21.4%) |
Employment Characteristics in Effingham County
Employment by Class of Employer in Effingham County
Among the 30,689 employed individuals in Effingham County, private company employees (22,423 | 73.1%), local government employees (2,159 | 7.0%), and state government employees (1,417 | 4.6%) make up the most common classes of employment.
| Employer Class | # Employees | % Employees |
| Private Company Employees | 22,423 | 73.1% |
| Self-Employed (Incorporated) | 784 | 2.5% |
| Self-Employed (Not Incorporated) | 1,360 | 4.4% |
| Not-for-profit Organizations | 1,286 | 4.2% |
| Local Government Employees | 2,159 | 7.0% |
| State Government Employees | 1,417 | 4.6% |
| Federal Government Employees | 1,212 | 4.0% |
| Unpaid Family Workers | 48 | 0.2% |
| Total | 30,689 | 100.0% |
Employment Status by Age in Effingham County
According to the labor force statistics for Effingham County, out of the total population over 16 years of age (50,024), 65.9% or 32,966 individuals are in the labor force, with 5.3% or 1,747 of them unemployed. The age group with the highest labor force participation rate is 35 to 44 years, with 87.5% or 8,459 individuals in the labor force. Within the labor force, the 16 to 19 years age range has the highest percentage of unemployed individuals, with 9.9% or 132 of them being unemployed.
| Age Bracket | In Labor Force | Unemployed |
| 16 to 19 Years | 1,334 (39.4%) | 132 (9.9%) |
| 20 to 24 Years | 3,056 (77.4%) | 241 (7.9%) |
| 25 to 29 Years | 3,273 (82.3%) | 200 (6.1%) |
| 30 to 34 Years | 3,738 (79.6%) | 164 (4.4%) |
| 35 to 44 Years | 8,459 (87.5%) | 575 (6.8%) |
| 45 to 54 Years | 7,167 (83.9%) | 122 (1.7%) |
| 55 to 59 Years | 3,013 (72.5%) | 229 (7.6%) |
| 60 to 64 Years | 1,894 (48.8%) | 68 (3.6%) |
| 65 to 74 Years | 927 (18.5%) | 0 (0.0%) |
| 75 Years and over | 99 (3.6%) | 9 (9.1%) |
| Total | 32,966 (65.9%) | 1,747 (5.3%) |
Employment Status by Educational Attainment in Effingham County
According to labor force statistics for Effingham County, 78.9% of individuals (27,552) out of the total population between 25 and 64 years of age (34,920) are in the labor force, with 4.9% or 1,350 of them being unemployed. The group with the highest labor force participation rate are those with the educational attainment of bachelor's degree or higher, with 88.2% or 8,184 individuals in the labor force. Within the labor force, individuals with less than high school education have the highest percentage of unemployment, with 18.9% or 339 of them being unemployed.
| Educational Attainment | In Labor Force | Unemployed |
| Less than High School | 1,796 (61.5%) | 552 (18.9%) |
| High School Diploma | 8,470 (75.9%) | 926 (8.3%) |
| College / Associate Degree | 9,098 (78.7%) | 266 (2.3%) |
| Bachelor's Degree or higher | 8,184 (88.2%) | 111 (1.2%) |
| Total | 27,552 (78.9%) | 1,711 (4.9%) |
Employment Occupations by Sex in Effingham County
Management, Business, Science and Arts Occupations
The most common Management, Business, Science and Arts occupations in Effingham County are Community & Social Service (3,167 | 10.2%), Management (2,681 | 8.7%), Health Diagnosing & Treating (2,087 | 6.8%), Education Instruction & Library (2,014 | 6.5%), and Business & Financial (1,665 | 5.4%).
Management, Business, Science and Arts Occupations by Sex
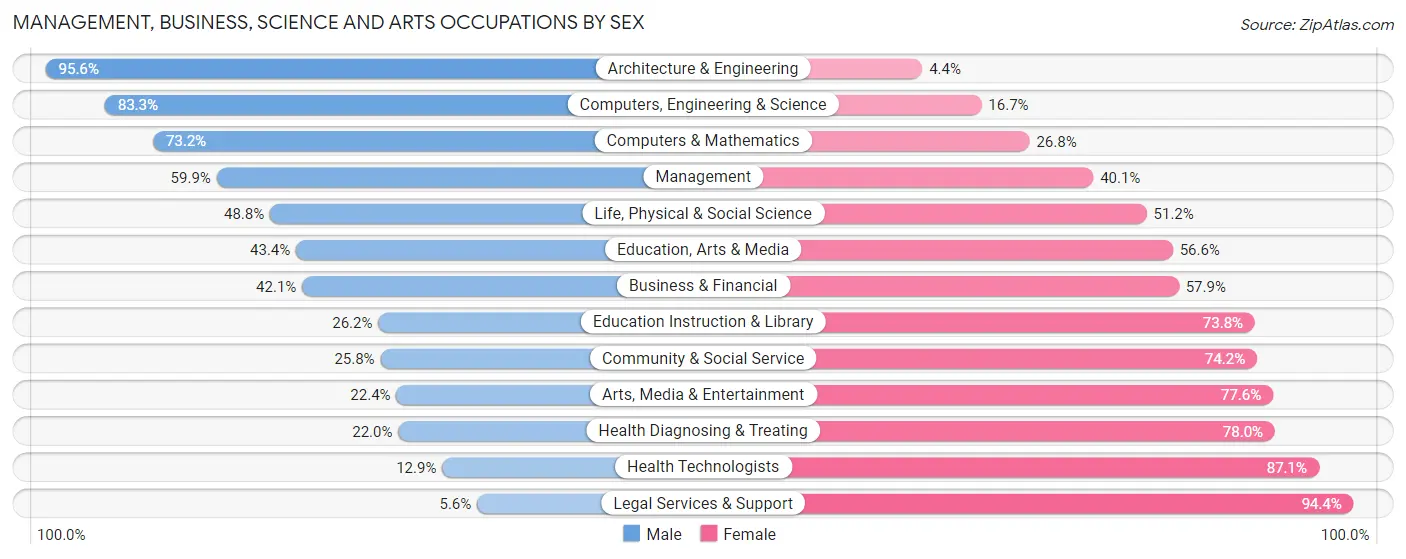
Within the Management, Business, Science and Arts occupations in Effingham County, the most male-oriented occupations are Architecture & Engineering (95.6%), Computers, Engineering & Science (83.3%), and Computers & Mathematics (73.2%), while the most female-oriented occupations are Legal Services & Support (94.4%), Health Technologists (87.1%), and Health Diagnosing & Treating (78.0%).
| Occupation | Male | Female |
| Management | 1,607 (59.9%) | 1,074 (40.1%) |
| Business & Financial | 701 (42.1%) | 964 (57.9%) |
| Computers, Engineering & Science | 1,353 (83.3%) | 272 (16.7%) |
| Computers & Mathematics | 465 (73.2%) | 170 (26.8%) |
| Architecture & Engineering | 827 (95.6%) | 38 (4.4%) |
| Life, Physical & Social Science | 61 (48.8%) | 64 (51.2%) |
| Community & Social Service | 816 (25.8%) | 2,351 (74.2%) |
| Education, Arts & Media | 160 (43.4%) | 209 (56.6%) |
| Legal Services & Support | 16 (5.6%) | 269 (94.4%) |
| Education Instruction & Library | 528 (26.2%) | 1,486 (73.8%) |
| Arts, Media & Entertainment | 112 (22.4%) | 387 (77.6%) |
| Health Diagnosing & Treating | 460 (22.0%) | 1,627 (78.0%) |
| Health Technologists | 145 (12.9%) | 981 (87.1%) |
| Total (Category) | 4,937 (44.0%) | 6,288 (56.0%) |
| Total (Overall) | 16,303 (52.8%) | 14,585 (47.2%) |
Services Occupations
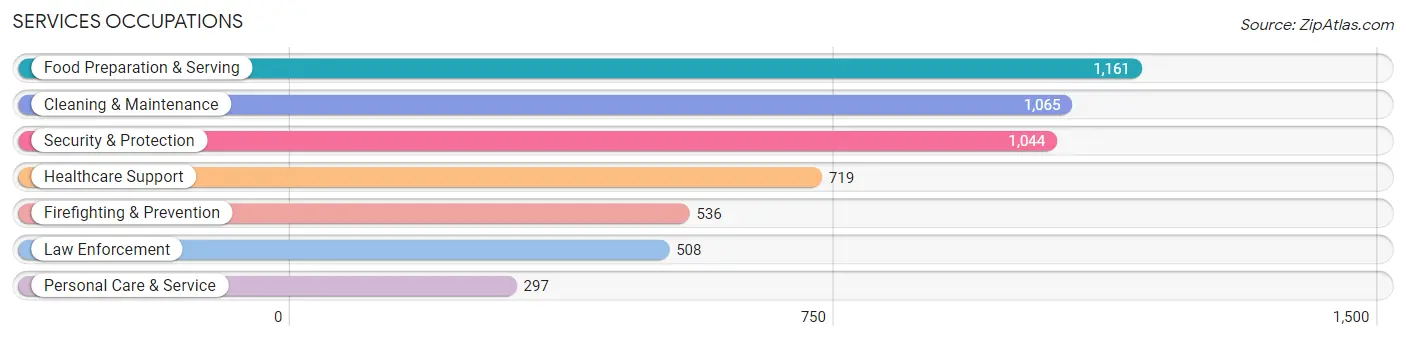
The most common Services occupations in Effingham County are Food Preparation & Serving (1,161 | 3.8%), Cleaning & Maintenance (1,065 | 3.5%), Security & Protection (1,044 | 3.4%), Healthcare Support (719 | 2.3%), and Firefighting & Prevention (536 | 1.7%).
Services Occupations by Sex
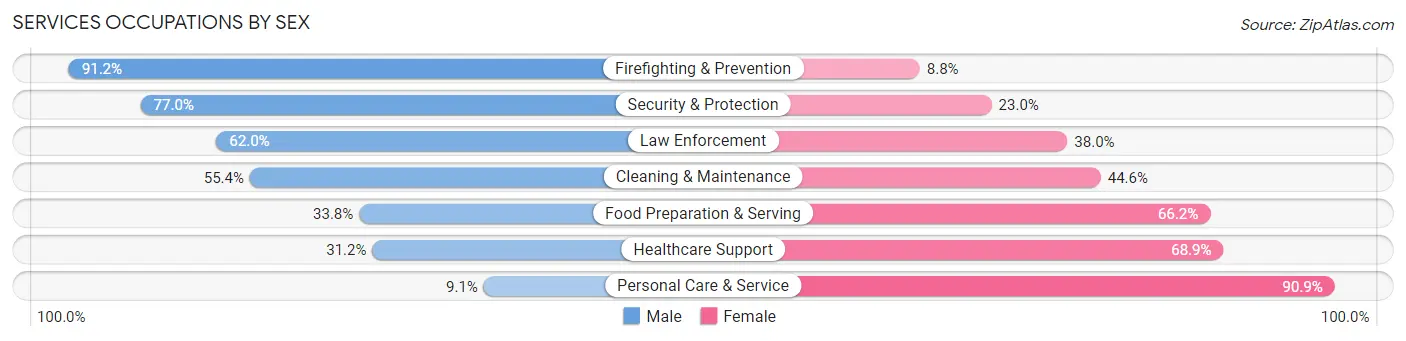
Within the Services occupations in Effingham County, the most male-oriented occupations are Firefighting & Prevention (91.2%), Security & Protection (77.0%), and Law Enforcement (62.0%), while the most female-oriented occupations are Personal Care & Service (90.9%), Healthcare Support (68.9%), and Food Preparation & Serving (66.2%).
| Occupation | Male | Female |
| Healthcare Support | 224 (31.1%) | 495 (68.9%) |
| Security & Protection | 804 (77.0%) | 240 (23.0%) |
| Firefighting & Prevention | 489 (91.2%) | 47 (8.8%) |
| Law Enforcement | 315 (62.0%) | 193 (38.0%) |
| Food Preparation & Serving | 392 (33.8%) | 769 (66.2%) |
| Cleaning & Maintenance | 590 (55.4%) | 475 (44.6%) |
| Personal Care & Service | 27 (9.1%) | 270 (90.9%) |
| Total (Category) | 2,037 (47.5%) | 2,249 (52.5%) |
| Total (Overall) | 16,303 (52.8%) | 14,585 (47.2%) |
Sales and Office Occupations
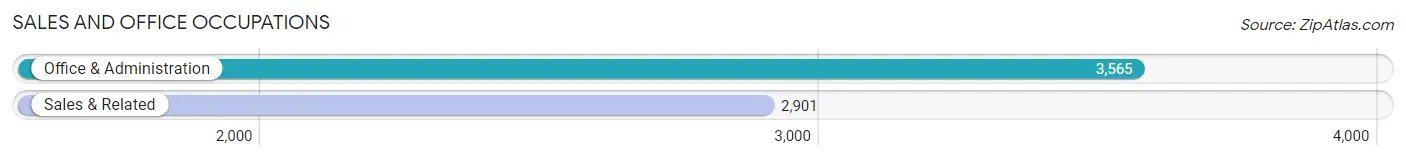
The most common Sales and Office occupations in Effingham County are Office & Administration (3,565 | 11.5%), and Sales & Related (2,901 | 9.4%).
Sales and Office Occupations by Sex
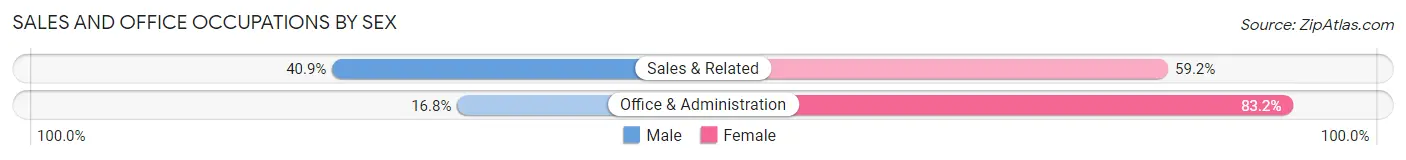
| Occupation | Male | Female |
| Sales & Related | 1,185 (40.8%) | 1,716 (59.2%) |
| Office & Administration | 599 (16.8%) | 2,966 (83.2%) |
| Total (Category) | 1,784 (27.6%) | 4,682 (72.4%) |
| Total (Overall) | 16,303 (52.8%) | 14,585 (47.2%) |
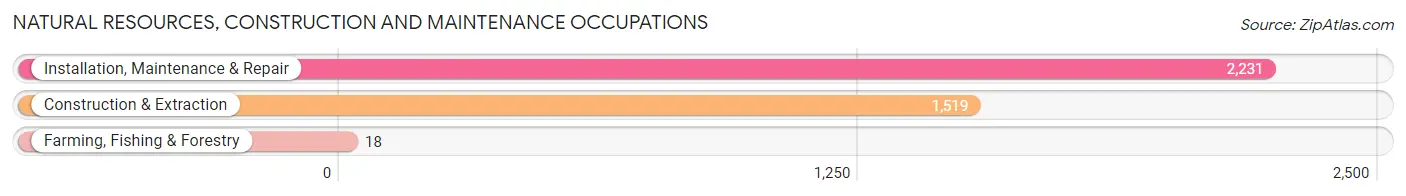
Natural Resources, Construction and Maintenance Occupations
The most common Natural Resources, Construction and Maintenance occupations in Effingham County are Installation, Maintenance & Repair (2,231 | 7.2%), Construction & Extraction (1,519 | 4.9%), and Farming, Fishing & Forestry (18 | 0.1%).
Natural Resources, Construction and Maintenance Occupations by Sex
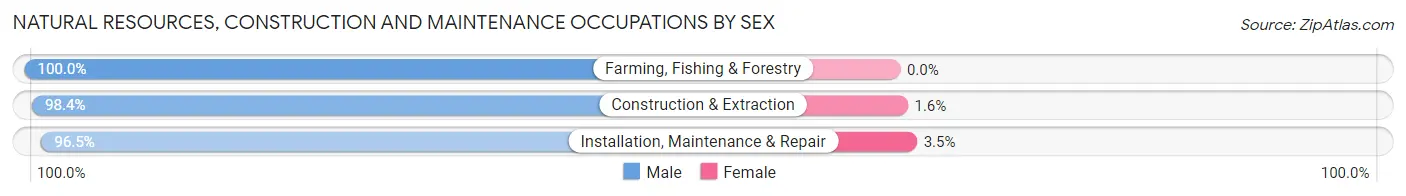
| Occupation | Male | Female |
| Farming, Fishing & Forestry | 18 (100.0%) | 0 (0.0%) |
| Construction & Extraction | 1,495 (98.4%) | 24 (1.6%) |
| Installation, Maintenance & Repair | 2,153 (96.5%) | 78 (3.5%) |
| Total (Category) | 3,666 (97.3%) | 102 (2.7%) |
| Total (Overall) | 16,303 (52.8%) | 14,585 (47.2%) |
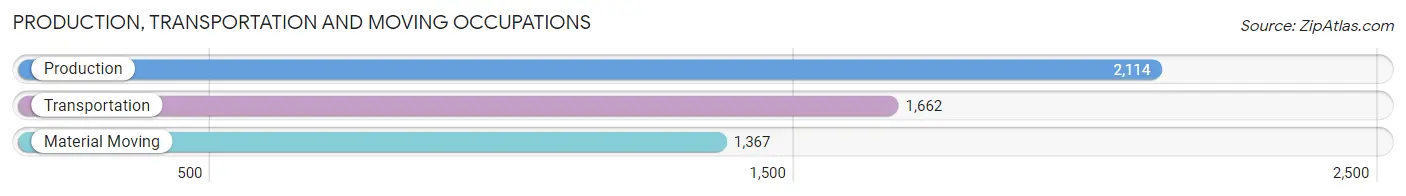
Production, Transportation and Moving Occupations
The most common Production, Transportation and Moving occupations in Effingham County are Production (2,114 | 6.8%), Transportation (1,662 | 5.4%), and Material Moving (1,367 | 4.4%).
Production, Transportation and Moving Occupations by Sex
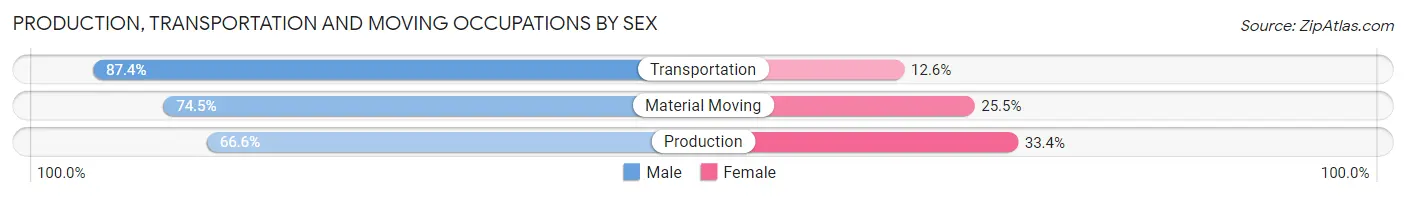
| Occupation | Male | Female |
| Production | 1,407 (66.6%) | 707 (33.4%) |
| Transportation | 1,453 (87.4%) | 209 (12.6%) |
| Material Moving | 1,019 (74.5%) | 348 (25.5%) |
| Total (Category) | 3,879 (75.4%) | 1,264 (24.6%) |
| Total (Overall) | 16,303 (52.8%) | 14,585 (47.2%) |
Employment Industries by Sex in Effingham County
Employment Industries in Effingham County
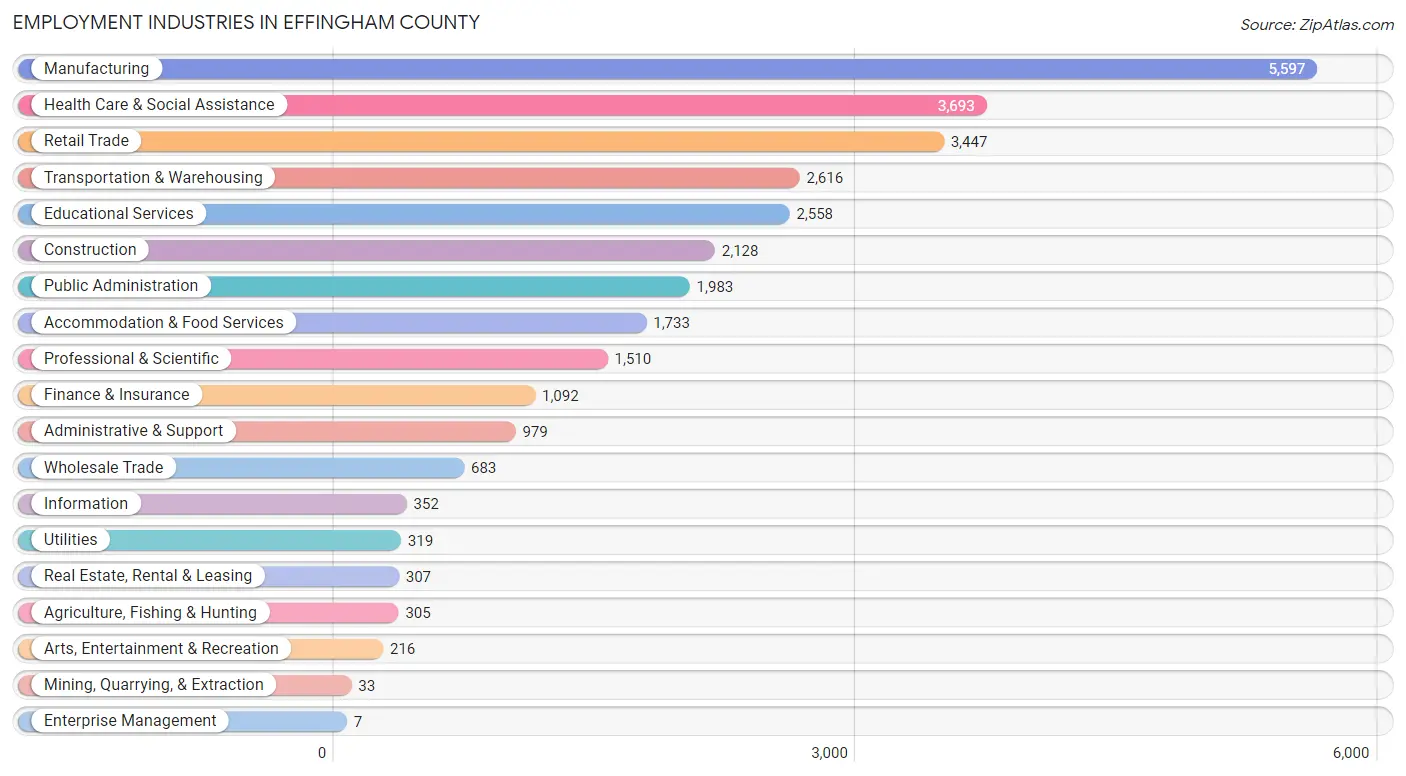
The major employment industries in Effingham County include Manufacturing (5,597 | 18.1%), Health Care & Social Assistance (3,693 | 12.0%), Retail Trade (3,447 | 11.2%), Transportation & Warehousing (2,616 | 8.5%), and Educational Services (2,558 | 8.3%).
Employment Industries by Sex in Effingham County
The Effingham County industries that see more men than women are Mining, Quarrying, & Extraction (100.0%), Construction (94.9%), and Utilities (85.0%), whereas the industries that tend to have a higher number of women are Enterprise Management (100.0%), Health Care & Social Assistance (86.5%), and Educational Services (76.3%).
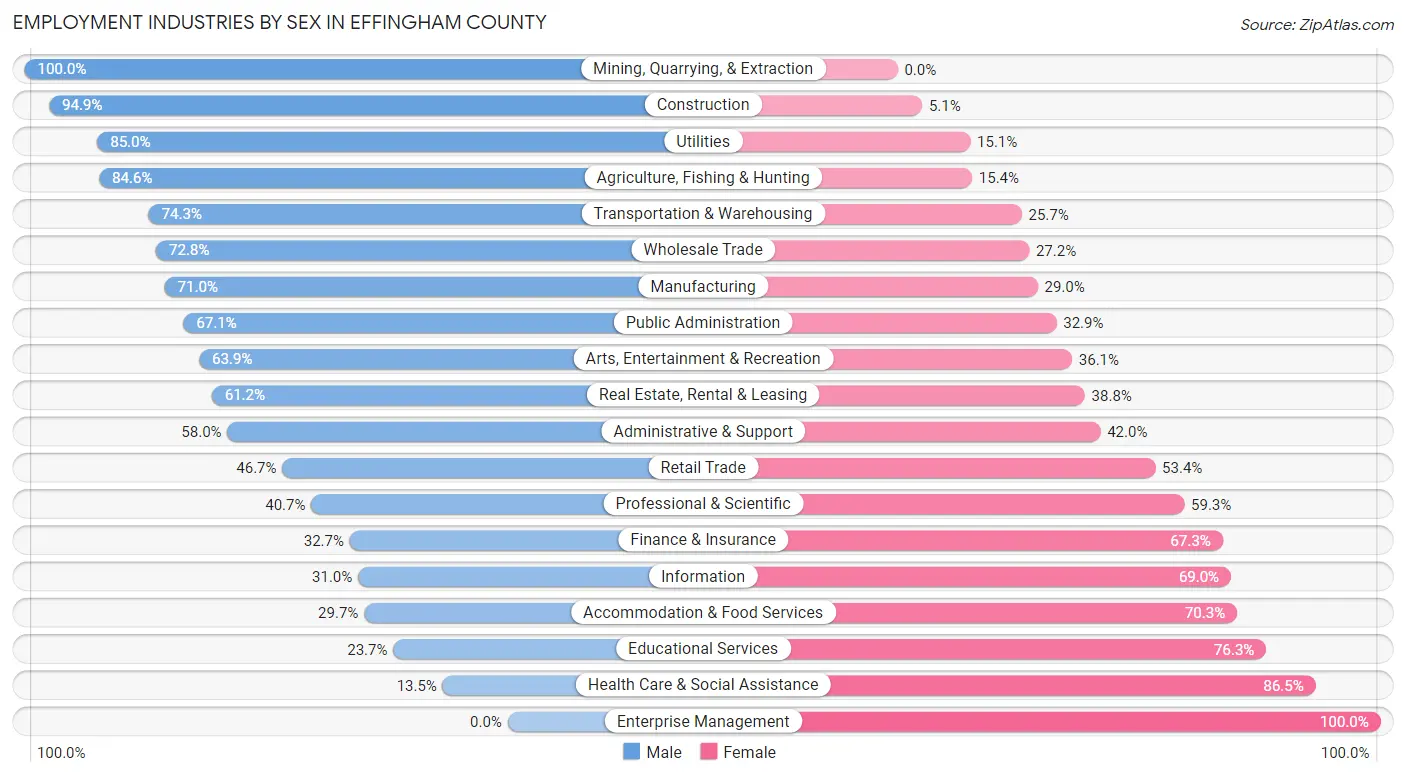
| Industry | Male | Female |
| Agriculture, Fishing & Hunting | 258 (84.6%) | 47 (15.4%) |
| Mining, Quarrying, & Extraction | 33 (100.0%) | 0 (0.0%) |
| Construction | 2,020 (94.9%) | 108 (5.1%) |
| Manufacturing | 3,974 (71.0%) | 1,623 (29.0%) |
| Wholesale Trade | 497 (72.8%) | 186 (27.2%) |
| Retail Trade | 1,608 (46.7%) | 1,839 (53.3%) |
| Transportation & Warehousing | 1,944 (74.3%) | 672 (25.7%) |
| Utilities | 271 (85.0%) | 48 (15.0%) |
| Information | 109 (31.0%) | 243 (69.0%) |
| Finance & Insurance | 357 (32.7%) | 735 (67.3%) |
| Real Estate, Rental & Leasing | 188 (61.2%) | 119 (38.8%) |
| Professional & Scientific | 614 (40.7%) | 896 (59.3%) |
| Enterprise Management | 0 (0.0%) | 7 (100.0%) |
| Administrative & Support | 568 (58.0%) | 411 (42.0%) |
| Educational Services | 606 (23.7%) | 1,952 (76.3%) |
| Health Care & Social Assistance | 497 (13.5%) | 3,196 (86.5%) |
| Arts, Entertainment & Recreation | 138 (63.9%) | 78 (36.1%) |
| Accommodation & Food Services | 515 (29.7%) | 1,218 (70.3%) |
| Public Administration | 1,331 (67.1%) | 652 (32.9%) |
| Total | 16,303 (52.8%) | 14,585 (47.2%) |
Education in Effingham County
School Enrollment in Effingham County
The most common levels of schooling among the 16,587 students in Effingham County are middle school (4,262 | 25.7%), elementary school (4,052 | 24.4%), and high school (3,746 | 22.6%).
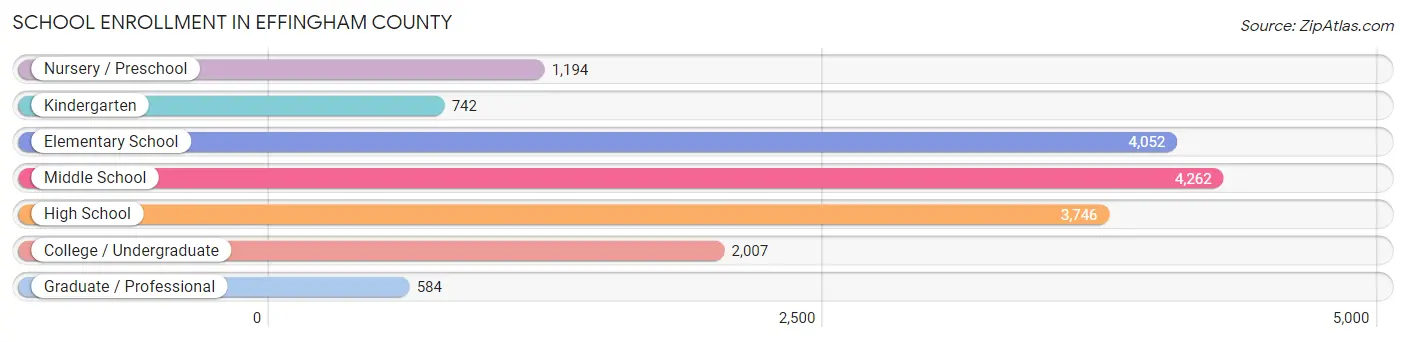
| School Level | # Students | % Students |
| Nursery / Preschool | 1,194 | 7.2% |
| Kindergarten | 742 | 4.5% |
| Elementary School | 4,052 | 24.4% |
| Middle School | 4,262 | 25.7% |
| High School | 3,746 | 22.6% |
| College / Undergraduate | 2,007 | 12.1% |
| Graduate / Professional | 584 | 3.5% |
| Total | 16,587 | 100.0% |
School Enrollment by Age by Funding Source in Effingham County
Out of a total of 16,587 students who are enrolled in schools in Effingham County, 2,073 (12.5%) attend a private institution, while the remaining 14,514 (87.5%) are enrolled in public schools. The age group of 35 years and over has the highest likelihood of being enrolled in private schools, with 294 (46.9% in the age bracket) enrolled. Conversely, the age group of 20 to 24 year olds has the lowest likelihood of being enrolled in a private school, with 1,049 (98.7% in the age bracket) attending a public institution.
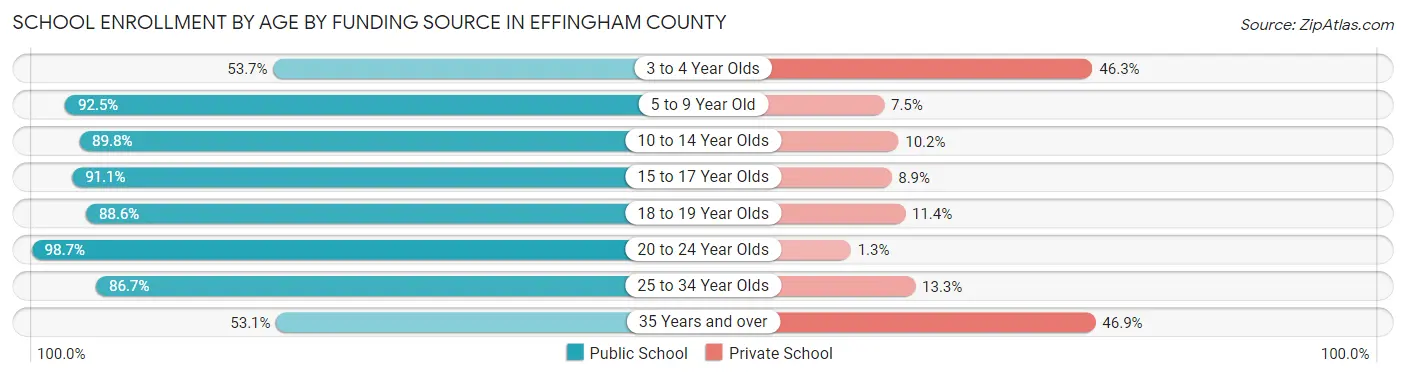
| Age Bracket | Public School | Private School |
| 3 to 4 Year Olds | 578 (53.7%) | 499 (46.3%) |
| 5 to 9 Year Old | 4,315 (92.5%) | 351 (7.5%) |
| 10 to 14 Year Olds | 4,382 (89.8%) | 496 (10.2%) |
| 15 to 17 Year Olds | 2,743 (91.1%) | 267 (8.9%) |
| 18 to 19 Year Olds | 589 (88.6%) | 76 (11.4%) |
| 20 to 24 Year Olds | 1,049 (98.7%) | 14 (1.3%) |
| 25 to 34 Year Olds | 521 (86.7%) | 80 (13.3%) |
| 35 Years and over | 333 (53.1%) | 294 (46.9%) |
| Total | 14,514 (87.5%) | 2,073 (12.5%) |
Educational Attainment by Field of Study in Effingham County
Business (2,179 | 19.3%), education (2,127 | 18.8%), science & technology (1,361 | 12.0%), arts & humanities (885 | 7.8%), and engineering (870 | 7.7%) are the most common fields of study among 11,311 individuals in Effingham County who have obtained a bachelor's degree or higher.
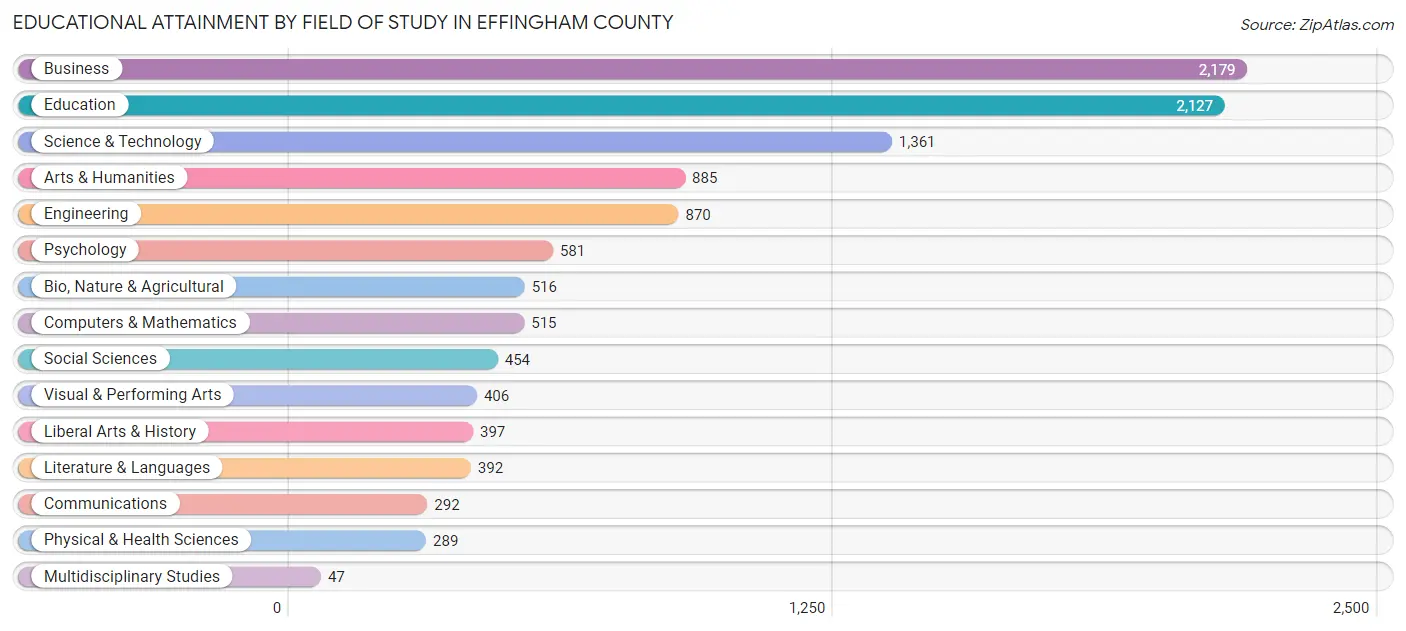
| Field of Study | # Graduates | % Graduates |
| Computers & Mathematics | 515 | 4.5% |
| Bio, Nature & Agricultural | 516 | 4.6% |
| Physical & Health Sciences | 289 | 2.6% |
| Psychology | 581 | 5.1% |
| Social Sciences | 454 | 4.0% |
| Engineering | 870 | 7.7% |
| Multidisciplinary Studies | 47 | 0.4% |
| Science & Technology | 1,361 | 12.0% |
| Business | 2,179 | 19.3% |
| Education | 2,127 | 18.8% |
| Literature & Languages | 392 | 3.5% |
| Liberal Arts & History | 397 | 3.5% |
| Visual & Performing Arts | 406 | 3.6% |
| Communications | 292 | 2.6% |
| Arts & Humanities | 885 | 7.8% |
| Total | 11,311 | 100.0% |
Transportation & Commute in Effingham County
Vehicle Availability by Sex in Effingham County
The most prevalent vehicle ownership categories in Effingham County are males with 2 vehicles (7,954, accounting for 48.8%) and females with 2 vehicles (7,116, making up 55.2%).
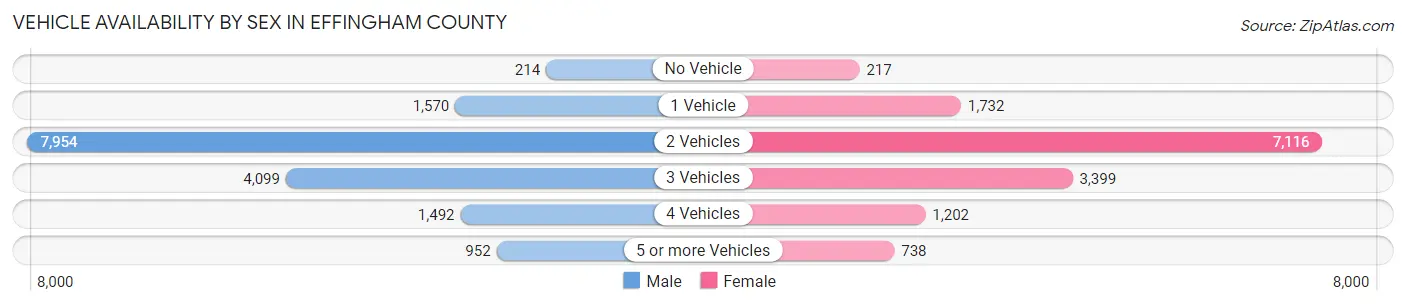
| Vehicles Available | Male | Female |
| No Vehicle | 214 (1.3%) | 217 (1.5%) |
| 1 Vehicle | 1,570 (9.6%) | 1,732 (12.0%) |
| 2 Vehicles | 7,954 (48.8%) | 7,116 (49.4%) |
| 3 Vehicles | 4,099 (25.2%) | 3,399 (23.6%) |
| 4 Vehicles | 1,492 (9.2%) | 1,202 (8.3%) |
| 5 or more Vehicles | 952 (5.9%) | 738 (5.1%) |
| Total | 16,281 (100.0%) | 14,404 (100.0%) |
Commute Time in Effingham County
The most frequently occuring commute durations in Effingham County are 30 to 34 minutes (6,045 commuters, 20.5%), 20 to 24 minutes (4,731 commuters, 16.1%), and 45 to 59 minutes (4,189 commuters, 14.2%).
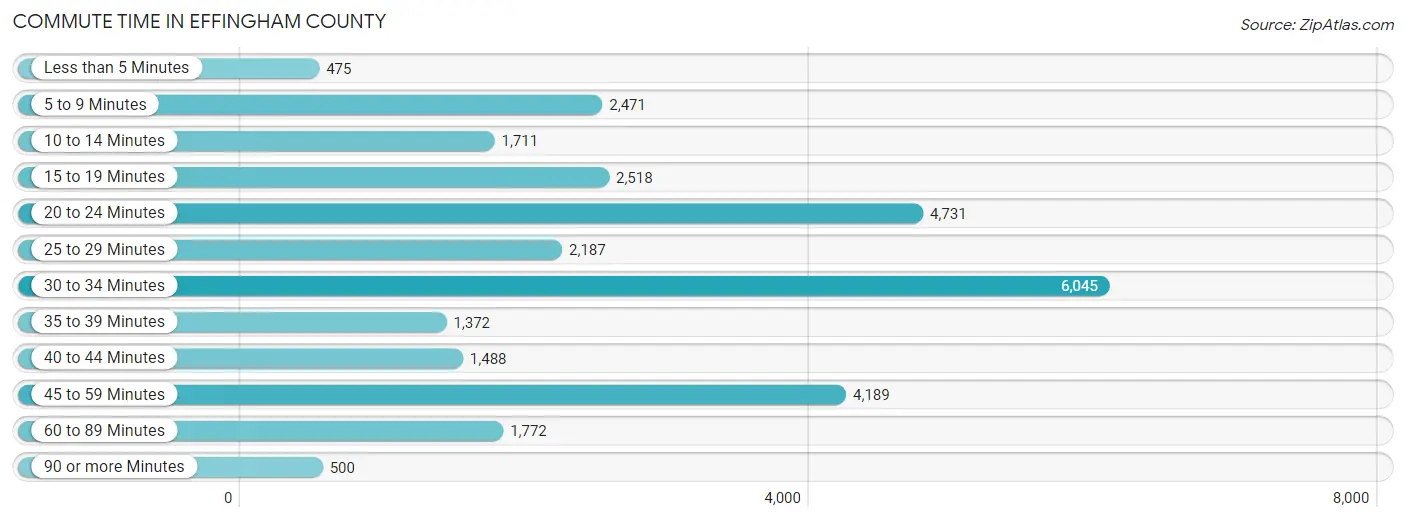
| Commute Time | # Commuters | % Commuters |
| Less than 5 Minutes | 475 | 1.6% |
| 5 to 9 Minutes | 2,471 | 8.4% |
| 10 to 14 Minutes | 1,711 | 5.8% |
| 15 to 19 Minutes | 2,518 | 8.6% |
| 20 to 24 Minutes | 4,731 | 16.1% |
| 25 to 29 Minutes | 2,187 | 7.4% |
| 30 to 34 Minutes | 6,045 | 20.5% |
| 35 to 39 Minutes | 1,372 | 4.7% |
| 40 to 44 Minutes | 1,488 | 5.1% |
| 45 to 59 Minutes | 4,189 | 14.2% |
| 60 to 89 Minutes | 1,772 | 6.0% |
| 90 or more Minutes | 500 | 1.7% |
Commute Time by Sex in Effingham County
The most common commute times in Effingham County are 30 to 34 minutes (3,843 commuters, 24.1%) for males and 30 to 34 minutes (2,202 commuters, 16.3%) for females.
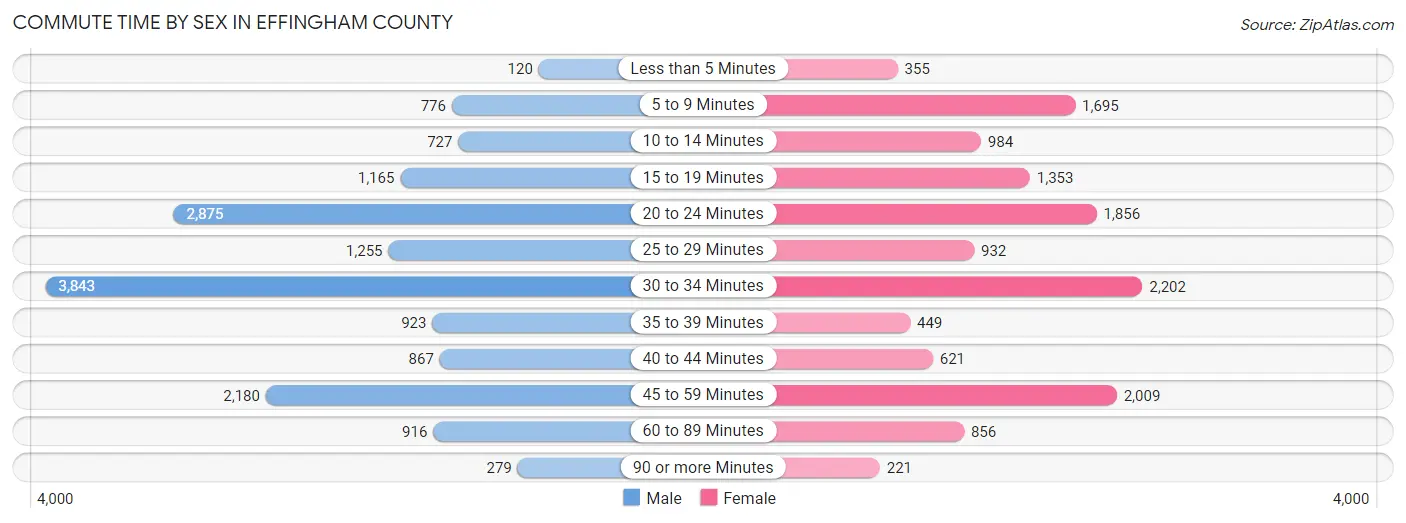
| Commute Time | Male | Female |
| Less than 5 Minutes | 120 (0.7%) | 355 (2.6%) |
| 5 to 9 Minutes | 776 (4.9%) | 1,695 (12.5%) |
| 10 to 14 Minutes | 727 (4.6%) | 984 (7.3%) |
| 15 to 19 Minutes | 1,165 (7.3%) | 1,353 (10.0%) |
| 20 to 24 Minutes | 2,875 (18.0%) | 1,856 (13.7%) |
| 25 to 29 Minutes | 1,255 (7.9%) | 932 (6.9%) |
| 30 to 34 Minutes | 3,843 (24.1%) | 2,202 (16.3%) |
| 35 to 39 Minutes | 923 (5.8%) | 449 (3.3%) |
| 40 to 44 Minutes | 867 (5.4%) | 621 (4.6%) |
| 45 to 59 Minutes | 2,180 (13.7%) | 2,009 (14.8%) |
| 60 to 89 Minutes | 916 (5.8%) | 856 (6.3%) |
| 90 or more Minutes | 279 (1.8%) | 221 (1.6%) |
Time of Departure to Work by Sex in Effingham County
The most frequent times of departure to work in Effingham County are 7:00 AM to 7:29 AM (2,375, 14.9%) for males and 7:00 AM to 7:29 AM (2,042, 15.1%) for females.
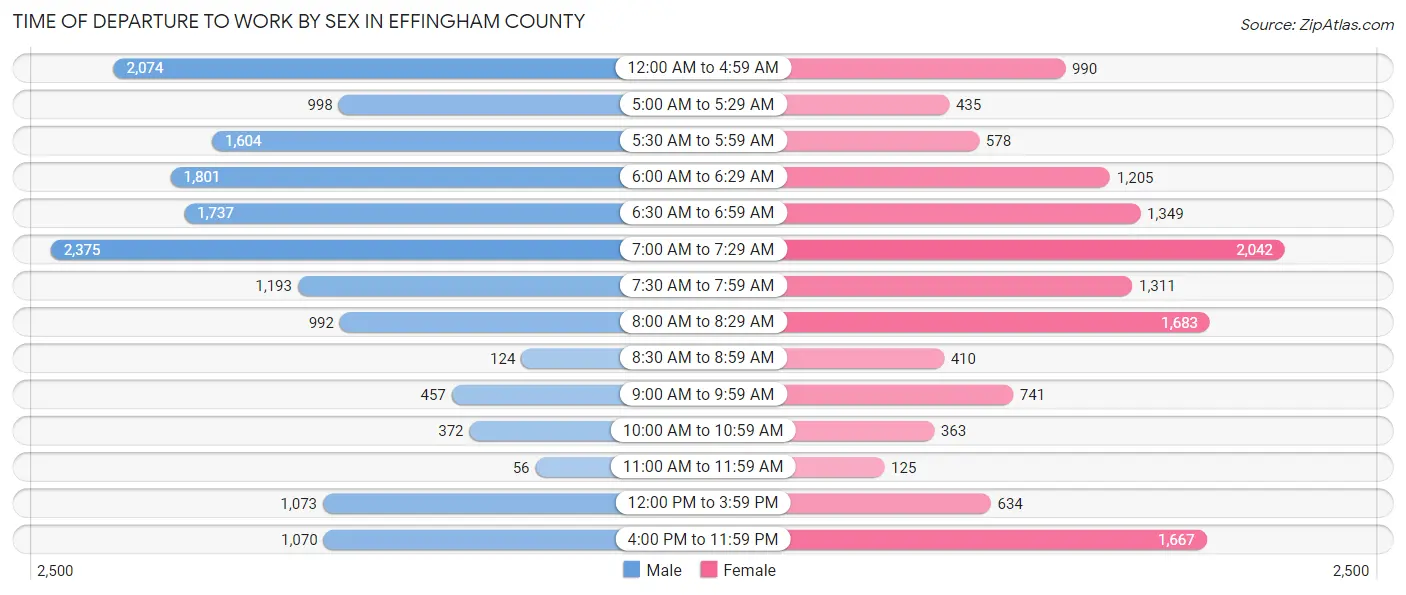
| Time of Departure | Male | Female |
| 12:00 AM to 4:59 AM | 2,074 (13.0%) | 990 (7.3%) |
| 5:00 AM to 5:29 AM | 998 (6.3%) | 435 (3.2%) |
| 5:30 AM to 5:59 AM | 1,604 (10.1%) | 578 (4.3%) |
| 6:00 AM to 6:29 AM | 1,801 (11.3%) | 1,205 (8.9%) |
| 6:30 AM to 6:59 AM | 1,737 (10.9%) | 1,349 (10.0%) |
| 7:00 AM to 7:29 AM | 2,375 (14.9%) | 2,042 (15.1%) |
| 7:30 AM to 7:59 AM | 1,193 (7.5%) | 1,311 (9.7%) |
| 8:00 AM to 8:29 AM | 992 (6.2%) | 1,683 (12.4%) |
| 8:30 AM to 8:59 AM | 124 (0.8%) | 410 (3.0%) |
| 9:00 AM to 9:59 AM | 457 (2.9%) | 741 (5.5%) |
| 10:00 AM to 10:59 AM | 372 (2.3%) | 363 (2.7%) |
| 11:00 AM to 11:59 AM | 56 (0.4%) | 125 (0.9%) |
| 12:00 PM to 3:59 PM | 1,073 (6.7%) | 634 (4.7%) |
| 4:00 PM to 11:59 PM | 1,070 (6.7%) | 1,667 (12.3%) |
| Total | 15,926 (100.0%) | 13,533 (100.0%) |
Housing Occupancy in Effingham County
Occupancy by Ownership in Effingham County
Of the total 22,820 dwellings in Effingham County, owner-occupied units account for 17,578 (77.0%), while renter-occupied units make up 5,242 (23.0%).
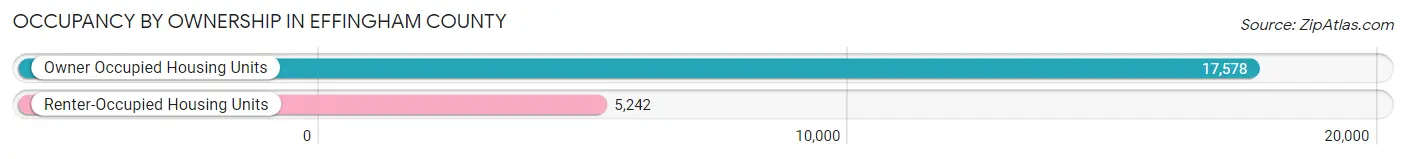
| Occupancy | # Housing Units | % Housing Units |
| Owner Occupied Housing Units | 17,578 | 77.0% |
| Renter-Occupied Housing Units | 5,242 | 23.0% |
| Total Occupied Housing Units | 22,820 | 100.0% |
Occupancy by Household Size in Effingham County
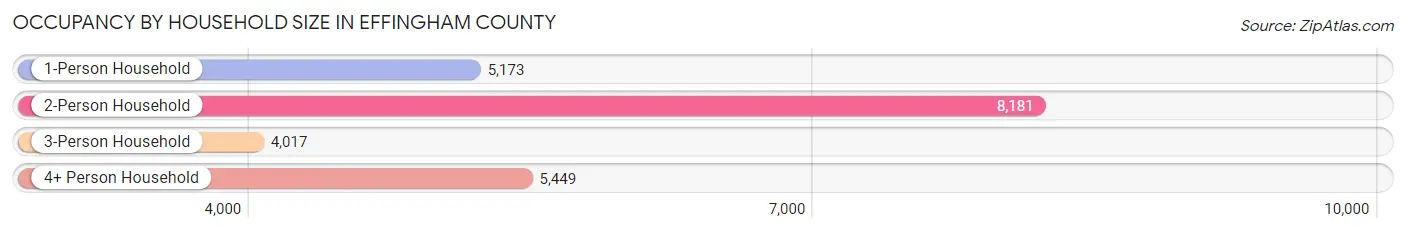
| Household Size | # Housing Units | % Housing Units |
| 1-Person Household | 5,173 | 22.7% |
| 2-Person Household | 8,181 | 35.8% |
| 3-Person Household | 4,017 | 17.6% |
| 4+ Person Household | 5,449 | 23.9% |
| Total Housing Units | 22,820 | 100.0% |
Occupancy by Ownership by Household Size in Effingham County
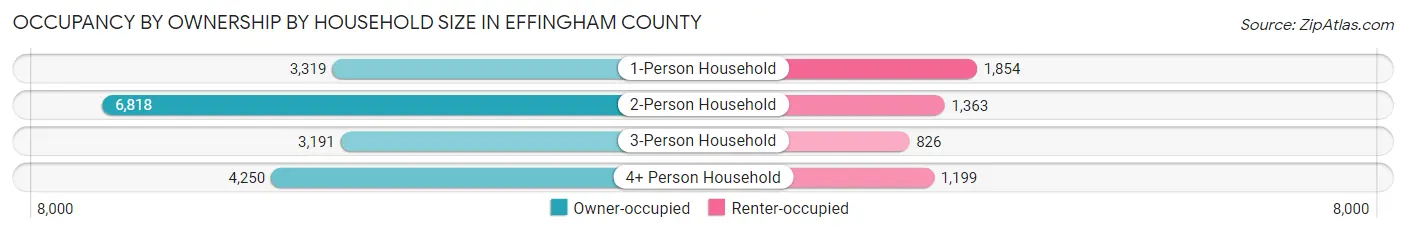
| Household Size | Owner-occupied | Renter-occupied |
| 1-Person Household | 3,319 (64.2%) | 1,854 (35.8%) |
| 2-Person Household | 6,818 (83.3%) | 1,363 (16.7%) |
| 3-Person Household | 3,191 (79.4%) | 826 (20.6%) |
| 4+ Person Household | 4,250 (78.0%) | 1,199 (22.0%) |
| Total Housing Units | 17,578 (77.0%) | 5,242 (23.0%) |
Occupancy by Educational Attainment in Effingham County
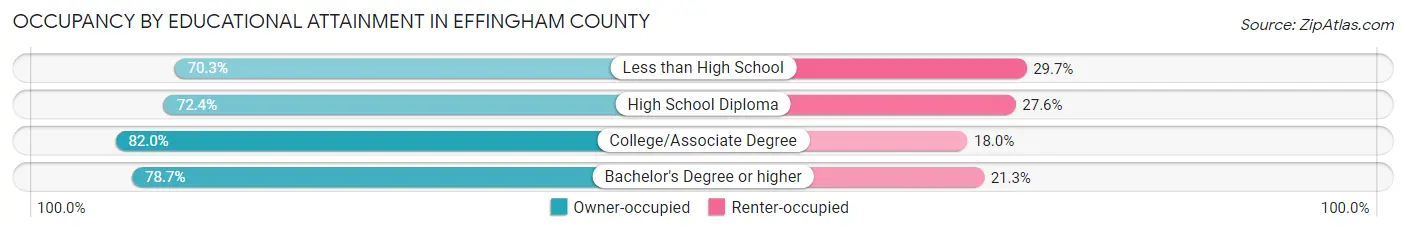
| Household Size | Owner-occupied | Renter-occupied |
| Less than High School | 1,354 (70.3%) | 573 (29.7%) |
| High School Diploma | 5,250 (72.4%) | 2,001 (27.6%) |
| College/Associate Degree | 5,966 (82.0%) | 1,311 (18.0%) |
| Bachelor's Degree or higher | 5,008 (78.7%) | 1,357 (21.3%) |
Occupancy by Age of Householder in Effingham County
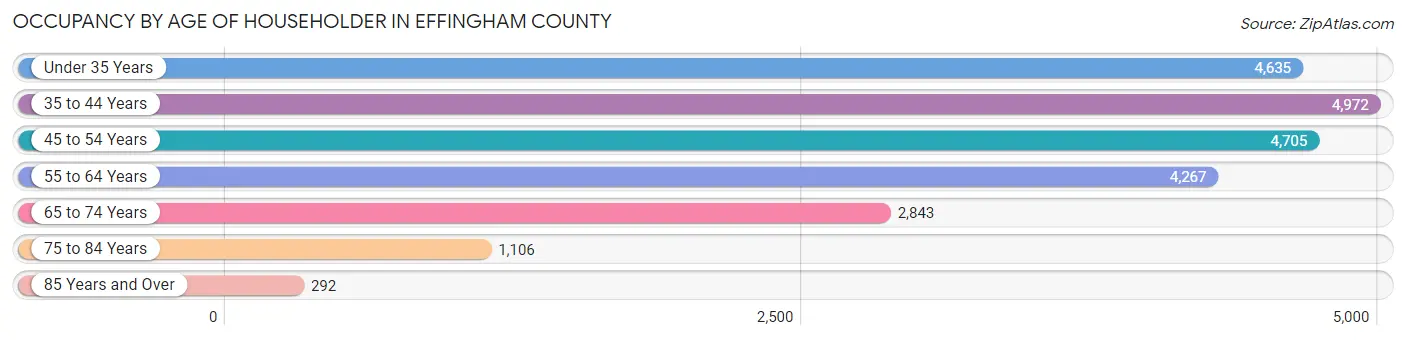
| Age Bracket | # Households | % Households |
| Under 35 Years | 4,635 | 20.3% |
| 35 to 44 Years | 4,972 | 21.8% |
| 45 to 54 Years | 4,705 | 20.6% |
| 55 to 64 Years | 4,267 | 18.7% |
| 65 to 74 Years | 2,843 | 12.5% |
| 75 to 84 Years | 1,106 | 4.9% |
| 85 Years and Over | 292 | 1.3% |
| Total | 22,820 | 100.0% |
Housing Finances in Effingham County
Median Income by Occupancy in Effingham County
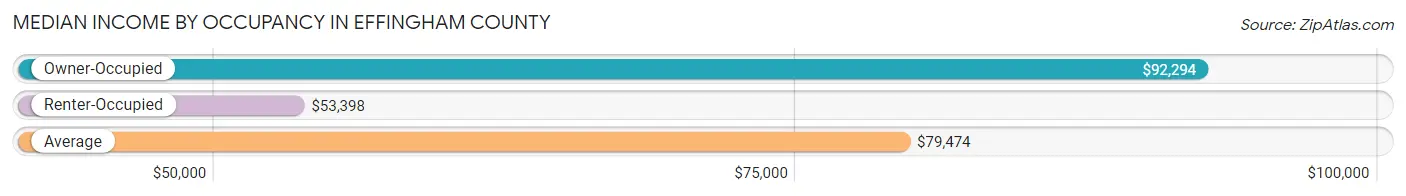
| Occupancy Type | # Households | Median Income |
| Owner-Occupied | 17,578 (77.0%) | $92,294 |
| Renter-Occupied | 5,242 (23.0%) | $53,398 |
| Average | 22,820 (100.0%) | $79,474 |
Occupancy by Householder Income Bracket in Effingham County
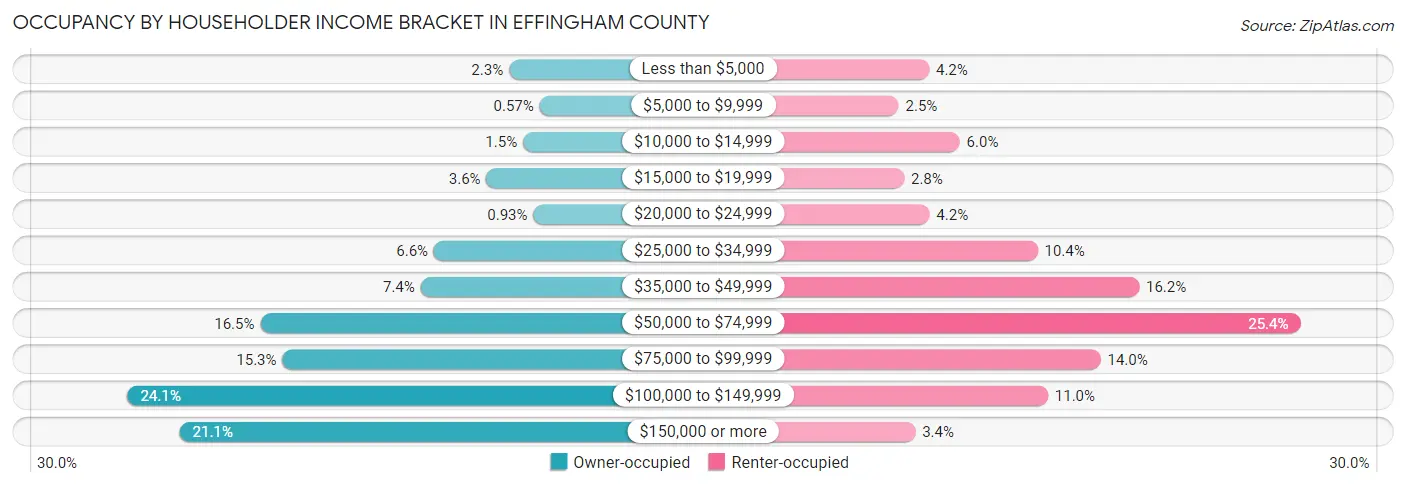
| Income Bracket | Owner-occupied | Renter-occupied |
| Less than $5,000 | 408 (2.3%) | 220 (4.2%) |
| $5,000 to $9,999 | 101 (0.6%) | 129 (2.5%) |
| $10,000 to $14,999 | 268 (1.5%) | 312 (5.9%) |
| $15,000 to $19,999 | 634 (3.6%) | 145 (2.8%) |
| $20,000 to $24,999 | 164 (0.9%) | 221 (4.2%) |
| $25,000 to $34,999 | 1,162 (6.6%) | 545 (10.4%) |
| $35,000 to $49,999 | 1,296 (7.4%) | 849 (16.2%) |
| $50,000 to $74,999 | 2,905 (16.5%) | 1,332 (25.4%) |
| $75,000 to $99,999 | 2,685 (15.3%) | 734 (14.0%) |
| $100,000 to $149,999 | 4,239 (24.1%) | 576 (11.0%) |
| $150,000 or more | 3,716 (21.1%) | 179 (3.4%) |
| Total | 17,578 (100.0%) | 5,242 (100.0%) |
Monthly Housing Cost Tiers in Effingham County
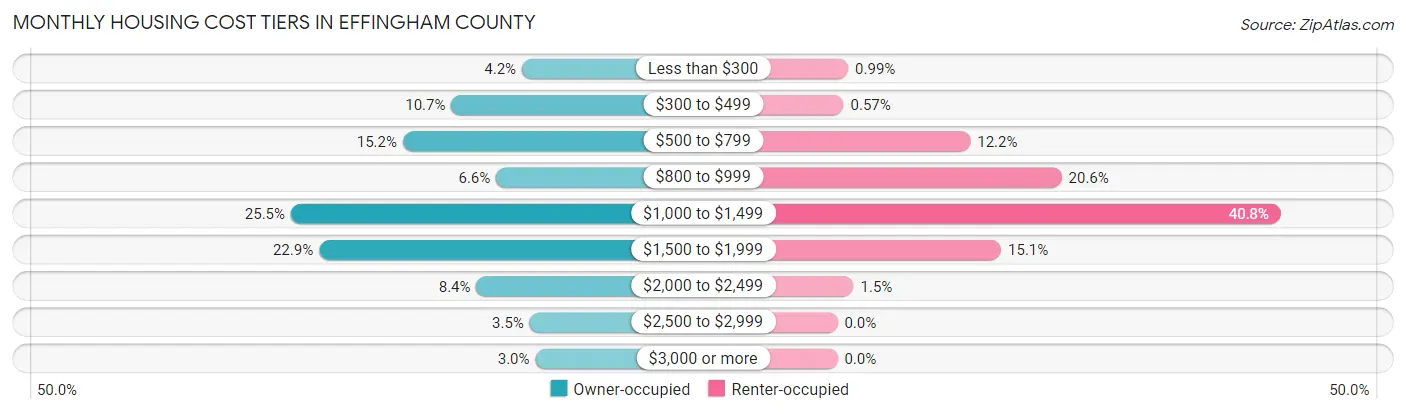
| Monthly Cost | Owner-occupied | Renter-occupied |
| Less than $300 | 741 (4.2%) | 52 (1.0%) |
| $300 to $499 | 1,884 (10.7%) | 30 (0.6%) |
| $500 to $799 | 2,669 (15.2%) | 641 (12.2%) |
| $800 to $999 | 1,159 (6.6%) | 1,082 (20.6%) |
| $1,000 to $1,499 | 4,481 (25.5%) | 2,140 (40.8%) |
| $1,500 to $1,999 | 4,026 (22.9%) | 790 (15.1%) |
| $2,000 to $2,499 | 1,479 (8.4%) | 78 (1.5%) |
| $2,500 to $2,999 | 615 (3.5%) | 0 (0.0%) |
| $3,000 or more | 524 (3.0%) | 0 (0.0%) |
| Total | 17,578 (100.0%) | 5,242 (100.0%) |
Physical Housing Characteristics in Effingham County
Housing Structures in Effingham County
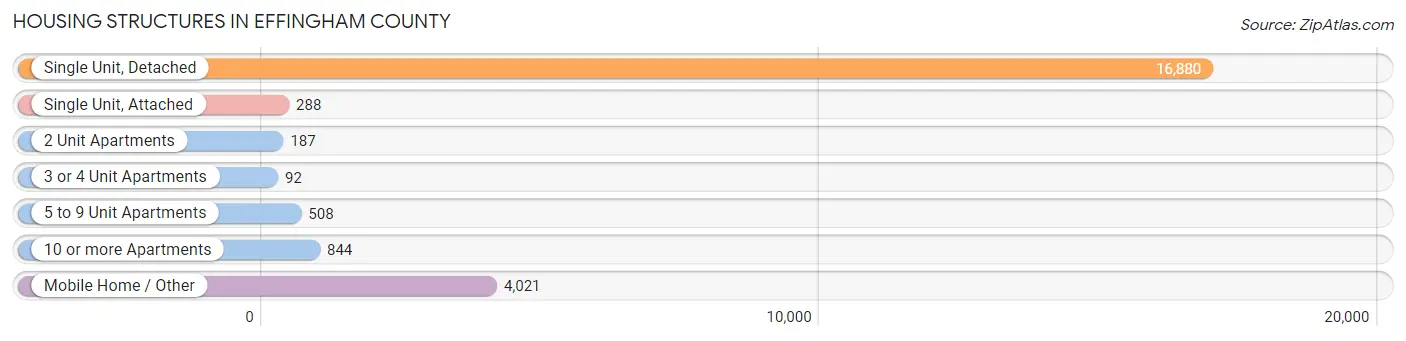
| Structure Type | # Housing Units | % Housing Units |
| Single Unit, Detached | 16,880 | 74.0% |
| Single Unit, Attached | 288 | 1.3% |
| 2 Unit Apartments | 187 | 0.8% |
| 3 or 4 Unit Apartments | 92 | 0.4% |
| 5 to 9 Unit Apartments | 508 | 2.2% |
| 10 or more Apartments | 844 | 3.7% |
| Mobile Home / Other | 4,021 | 17.6% |
| Total | 22,820 | 100.0% |
Housing Structures by Occupancy in Effingham County
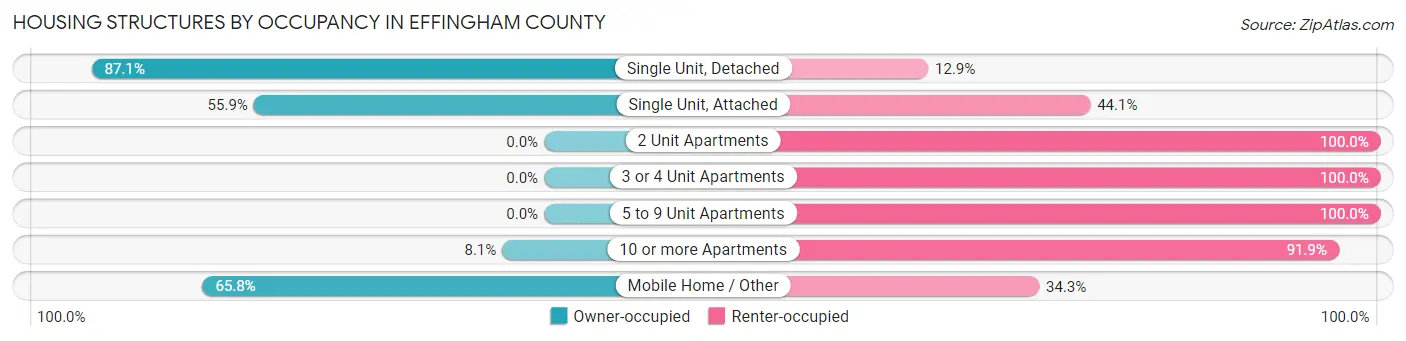
| Structure Type | Owner-occupied | Renter-occupied |
| Single Unit, Detached | 14,705 (87.1%) | 2,175 (12.9%) |
| Single Unit, Attached | 161 (55.9%) | 127 (44.1%) |
| 2 Unit Apartments | 0 (0.0%) | 187 (100.0%) |
| 3 or 4 Unit Apartments | 0 (0.0%) | 92 (100.0%) |
| 5 to 9 Unit Apartments | 0 (0.0%) | 508 (100.0%) |
| 10 or more Apartments | 68 (8.1%) | 776 (91.9%) |
| Mobile Home / Other | 2,644 (65.7%) | 1,377 (34.3%) |
| Total | 17,578 (77.0%) | 5,242 (23.0%) |
Housing Structures by Number of Rooms in Effingham County
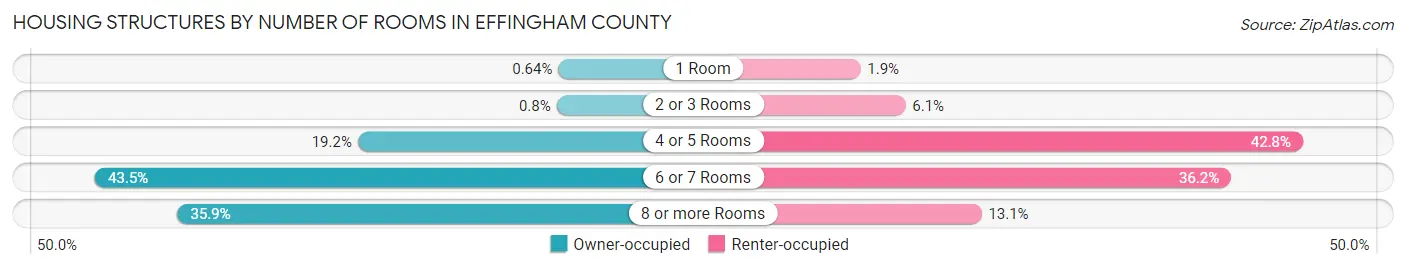
| Number of Rooms | Owner-occupied | Renter-occupied |
| 1 Room | 112 (0.6%) | 99 (1.9%) |
| 2 or 3 Rooms | 141 (0.8%) | 317 (6.0%) |
| 4 or 5 Rooms | 3,374 (19.2%) | 2,244 (42.8%) |
| 6 or 7 Rooms | 7,645 (43.5%) | 1,896 (36.2%) |
| 8 or more Rooms | 6,306 (35.9%) | 686 (13.1%) |
| Total | 17,578 (100.0%) | 5,242 (100.0%) |
Housing Structure by Heating Type in Effingham County
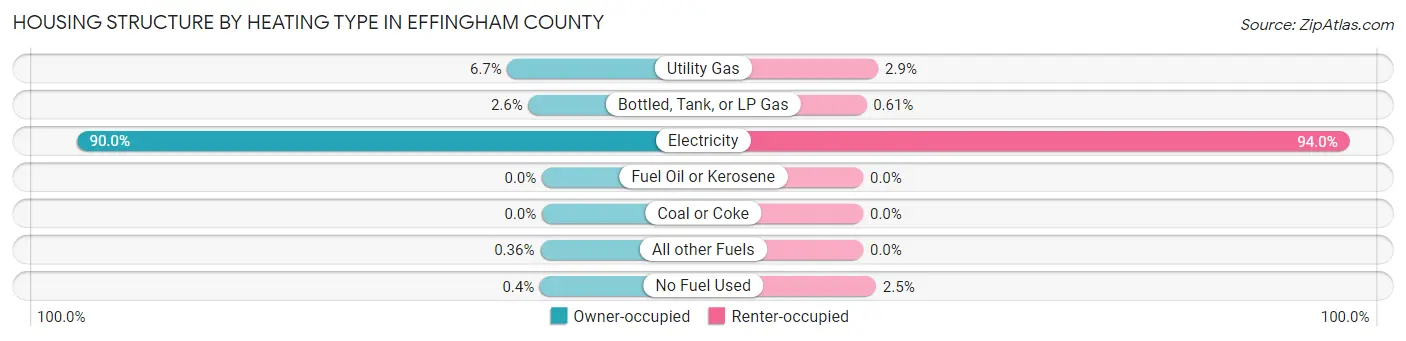
| Heating Type | Owner-occupied | Renter-occupied |
| Utility Gas | 1,171 (6.7%) | 153 (2.9%) |
| Bottled, Tank, or LP Gas | 460 (2.6%) | 32 (0.6%) |
| Electricity | 15,814 (90.0%) | 4,927 (94.0%) |
| Fuel Oil or Kerosene | 0 (0.0%) | 0 (0.0%) |
| Coal or Coke | 0 (0.0%) | 0 (0.0%) |
| All other Fuels | 63 (0.4%) | 0 (0.0%) |
| No Fuel Used | 70 (0.4%) | 130 (2.5%) |
| Total | 17,578 (100.0%) | 5,242 (100.0%) |
Household Vehicle Usage in Effingham County
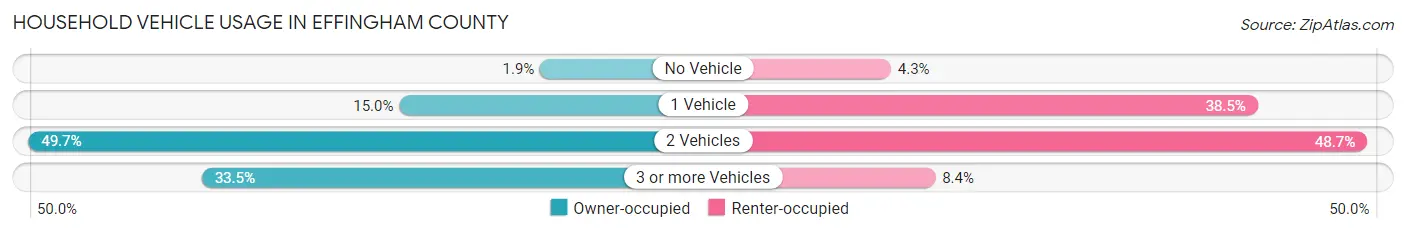
| Vehicles per Household | Owner-occupied | Renter-occupied |
| No Vehicle | 328 (1.9%) | 225 (4.3%) |
| 1 Vehicle | 2,641 (15.0%) | 2,020 (38.5%) |
| 2 Vehicles | 8,727 (49.6%) | 2,555 (48.7%) |
| 3 or more Vehicles | 5,882 (33.5%) | 442 (8.4%) |
| Total | 17,578 (100.0%) | 5,242 (100.0%) |
Real Estate & Mortgages in Effingham County
Real Estate and Mortgage Overview in Effingham County
| Characteristic | Without Mortgage | With Mortgage |
| Housing Units | 5,479 | 12,099 |
| Median Property Value | $166,200 | $240,600 |
| Median Household Income | $61,343 | $2,862 |
| Monthly Housing Costs | $525 | $524 |
| Real Estate Taxes | $1,752 | $382 |
Property Value by Mortgage Status in Effingham County
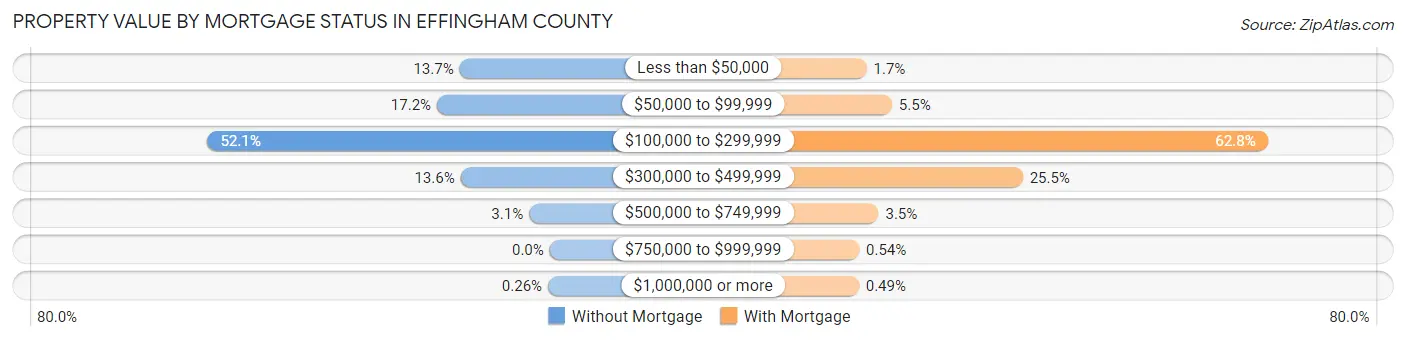
| Property Value | Without Mortgage | With Mortgage |
| Less than $50,000 | 752 (13.7%) | 204 (1.7%) |
| $50,000 to $99,999 | 941 (17.2%) | 670 (5.5%) |
| $100,000 to $299,999 | 2,856 (52.1%) | 7,596 (62.8%) |
| $300,000 to $499,999 | 744 (13.6%) | 3,082 (25.5%) |
| $500,000 to $749,999 | 172 (3.1%) | 423 (3.5%) |
| $750,000 to $999,999 | 0 (0.0%) | 65 (0.5%) |
| $1,000,000 or more | 14 (0.3%) | 59 (0.5%) |
| Total | 5,479 (100.0%) | 12,099 (100.0%) |
Household Income by Mortgage Status in Effingham County
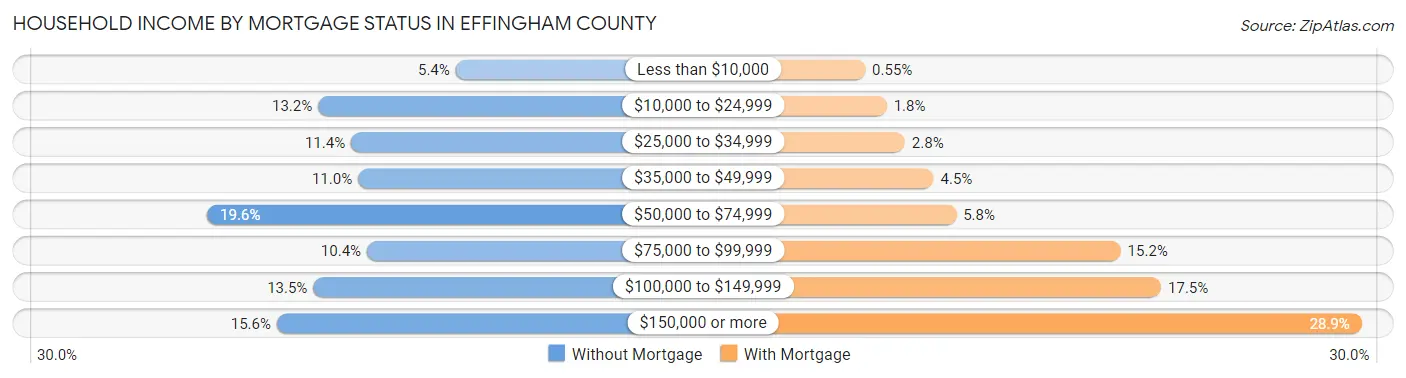
| Household Income | Without Mortgage | With Mortgage |
| Less than $10,000 | 294 (5.4%) | 66 (0.5%) |
| $10,000 to $24,999 | 725 (13.2%) | 215 (1.8%) |
| $25,000 to $34,999 | 622 (11.4%) | 341 (2.8%) |
| $35,000 to $49,999 | 600 (11.0%) | 540 (4.5%) |
| $50,000 to $74,999 | 1,072 (19.6%) | 696 (5.8%) |
| $75,000 to $99,999 | 572 (10.4%) | 1,833 (15.1%) |
| $100,000 to $149,999 | 740 (13.5%) | 2,113 (17.5%) |
| $150,000 or more | 854 (15.6%) | 3,499 (28.9%) |
| Total | 5,479 (100.0%) | 12,099 (100.0%) |
Property Value to Household Income Ratio in Effingham County
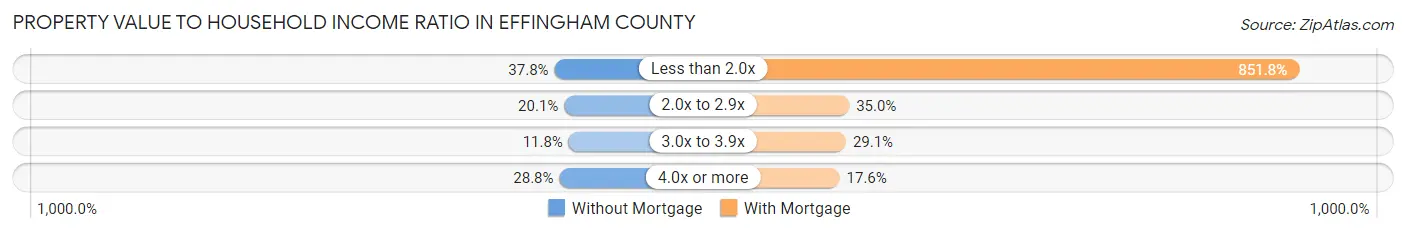
| Value-to-Income Ratio | Without Mortgage | With Mortgage |
| Less than 2.0x | 2,073 (37.8%) | 103,059 (851.8%) |
| 2.0x to 2.9x | 1,100 (20.1%) | 4,233 (35.0%) |
| 3.0x to 3.9x | 648 (11.8%) | 3,523 (29.1%) |
| 4.0x or more | 1,578 (28.8%) | 2,126 (17.6%) |
| Total | 5,479 (100.0%) | 12,099 (100.0%) |
Real Estate Taxes by Mortgage Status in Effingham County
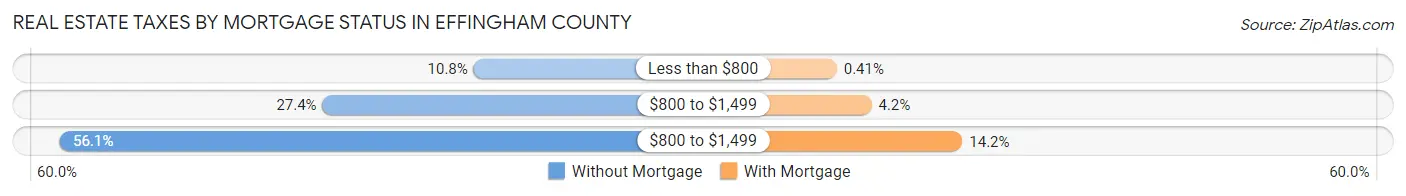
| Property Taxes | Without Mortgage | With Mortgage |
| Less than $800 | 591 (10.8%) | 50 (0.4%) |
| $800 to $1,499 | 1,499 (27.4%) | 510 (4.2%) |
| $800 to $1,499 | 3,074 (56.1%) | 1,714 (14.2%) |
| Total | 5,479 (100.0%) | 12,099 (100.0%) |
Health & Disability in Effingham County
Health Insurance Coverage by Age in Effingham County
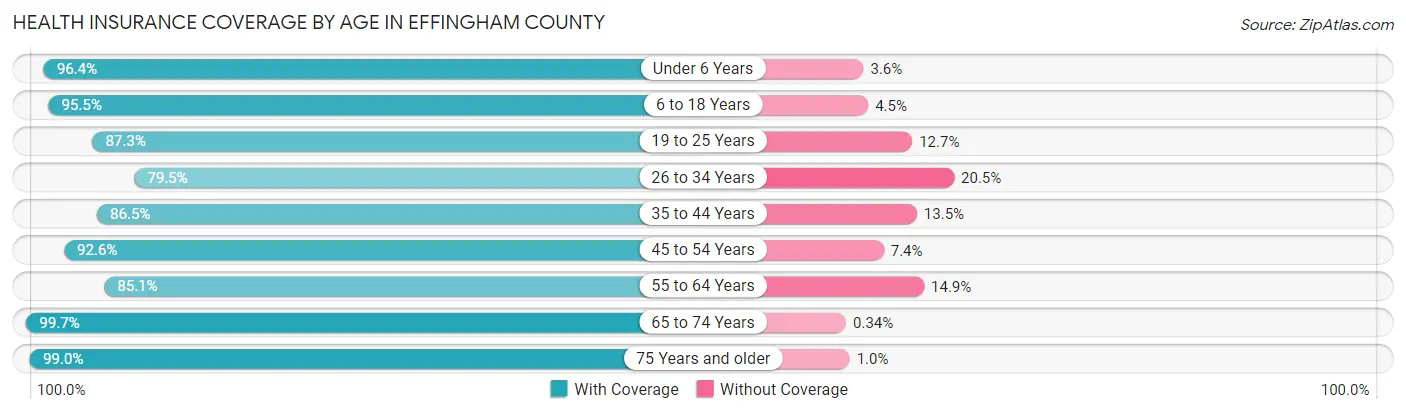
| Age Bracket | With Coverage | Without Coverage |
| Under 6 Years | 4,751 (96.4%) | 177 (3.6%) |
| 6 to 18 Years | 12,471 (95.5%) | 582 (4.5%) |
| 19 to 25 Years | 4,611 (87.3%) | 669 (12.7%) |
| 26 to 34 Years | 6,201 (79.5%) | 1,597 (20.5%) |
| 35 to 44 Years | 8,156 (86.5%) | 1,277 (13.5%) |
| 45 to 54 Years | 7,862 (92.6%) | 625 (7.4%) |
| 55 to 64 Years | 6,809 (85.1%) | 1,190 (14.9%) |
| 65 to 74 Years | 4,970 (99.7%) | 17 (0.3%) |
| 75 Years and older | 2,655 (99.0%) | 27 (1.0%) |
| Total | 58,486 (90.5%) | 6,161 (9.5%) |
Health Insurance Coverage by Citizenship Status in Effingham County
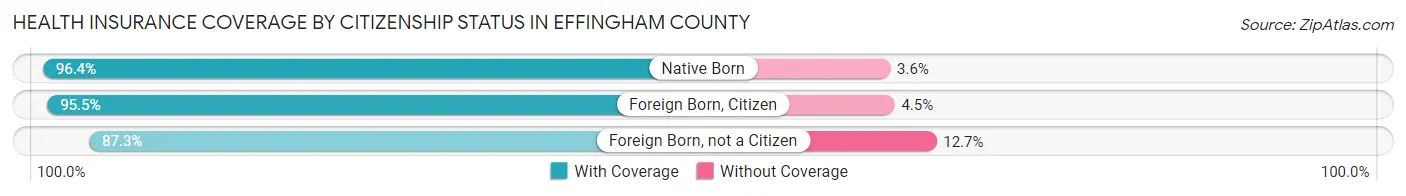
| Citizenship Status | With Coverage | Without Coverage |
| Native Born | 4,751 (96.4%) | 177 (3.6%) |
| Foreign Born, Citizen | 12,471 (95.5%) | 582 (4.5%) |
| Foreign Born, not a Citizen | 4,611 (87.3%) | 669 (12.7%) |
Health Insurance Coverage by Household Income in Effingham County
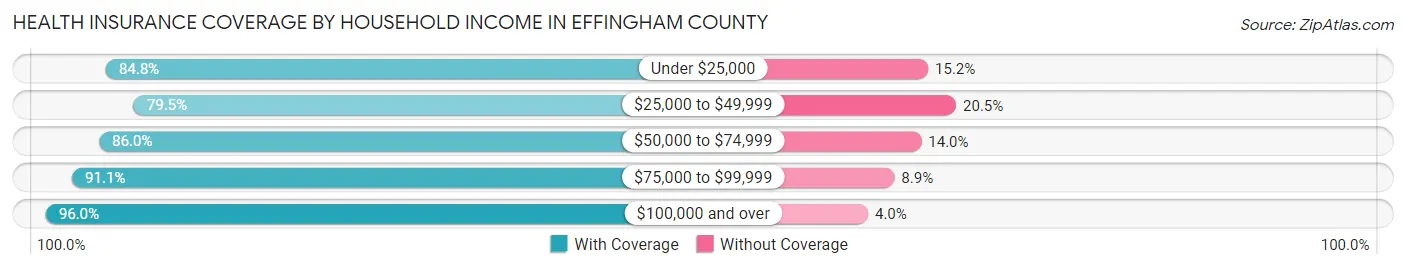
| Household Income | With Coverage | Without Coverage |
| Under $25,000 | 3,966 (84.8%) | 713 (15.2%) |
| $25,000 to $49,999 | 7,222 (79.5%) | 1,860 (20.5%) |
| $50,000 to $74,999 | 9,104 (86.0%) | 1,478 (14.0%) |
| $75,000 to $99,999 | 9,230 (91.1%) | 904 (8.9%) |
| $100,000 and over | 28,957 (96.0%) | 1,200 (4.0%) |
Public vs Private Health Insurance Coverage by Age in Effingham County
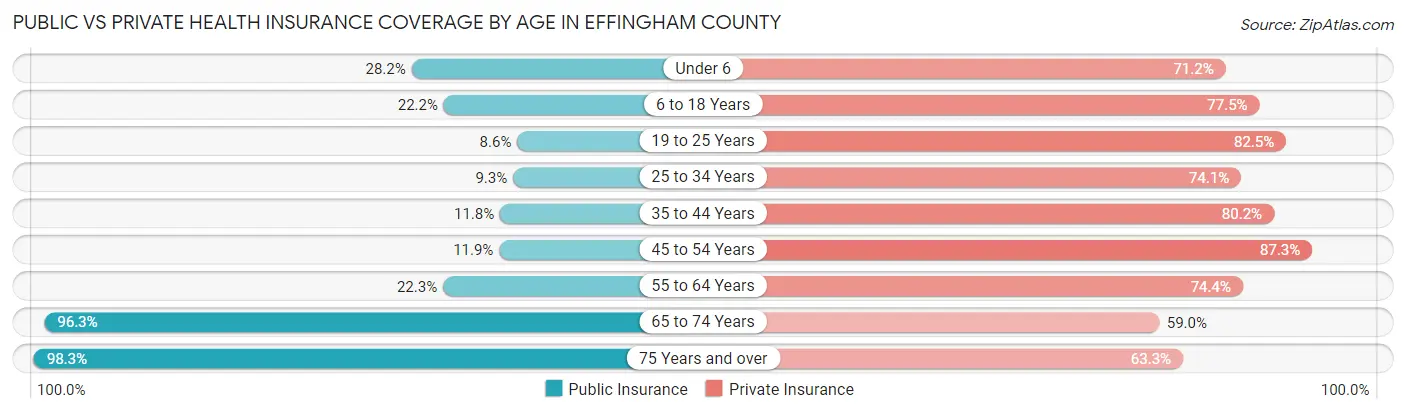
| Age Bracket | Public Insurance | Private Insurance |
| Under 6 | 1,388 (28.2%) | 3,509 (71.2%) |
| 6 to 18 Years | 2,896 (22.2%) | 10,118 (77.5%) |
| 19 to 25 Years | 452 (8.6%) | 4,354 (82.5%) |
| 25 to 34 Years | 728 (9.3%) | 5,780 (74.1%) |
| 35 to 44 Years | 1,108 (11.7%) | 7,565 (80.2%) |
| 45 to 54 Years | 1,011 (11.9%) | 7,408 (87.3%) |
| 55 to 64 Years | 1,787 (22.3%) | 5,952 (74.4%) |
| 65 to 74 Years | 4,804 (96.3%) | 2,944 (59.0%) |
| 75 Years and over | 2,636 (98.3%) | 1,698 (63.3%) |
| Total | 16,810 (26.0%) | 49,328 (76.3%) |
Disability Status by Sex by Age in Effingham County
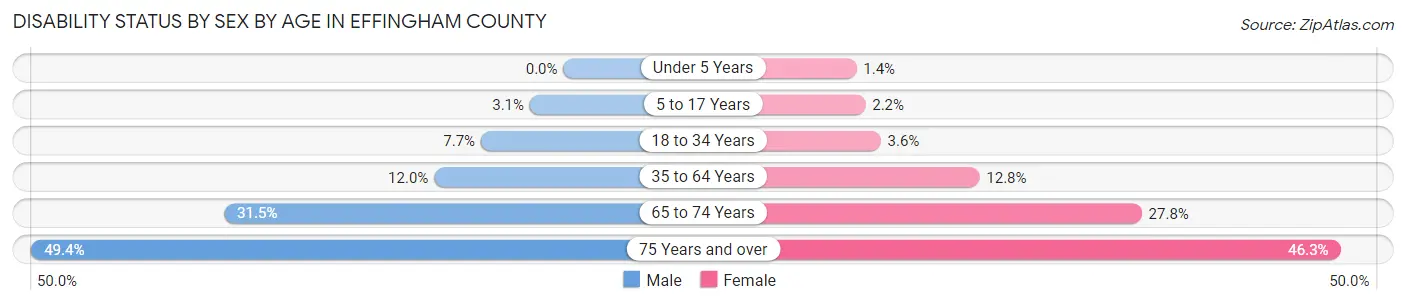
| Age Bracket | Male | Female |
| Under 5 Years | 0 (0.0%) | 27 (1.3%) |
| 5 to 17 Years | 206 (3.1%) | 140 (2.2%) |
| 18 to 34 Years | 519 (7.6%) | 253 (3.6%) |
| 35 to 64 Years | 1,535 (12.0%) | 1,676 (12.8%) |
| 65 to 74 Years | 734 (31.5%) | 739 (27.8%) |
| 75 Years and over | 556 (49.4%) | 720 (46.3%) |
Disability Class by Sex by Age in Effingham County
Disability Class: Hearing Difficulty
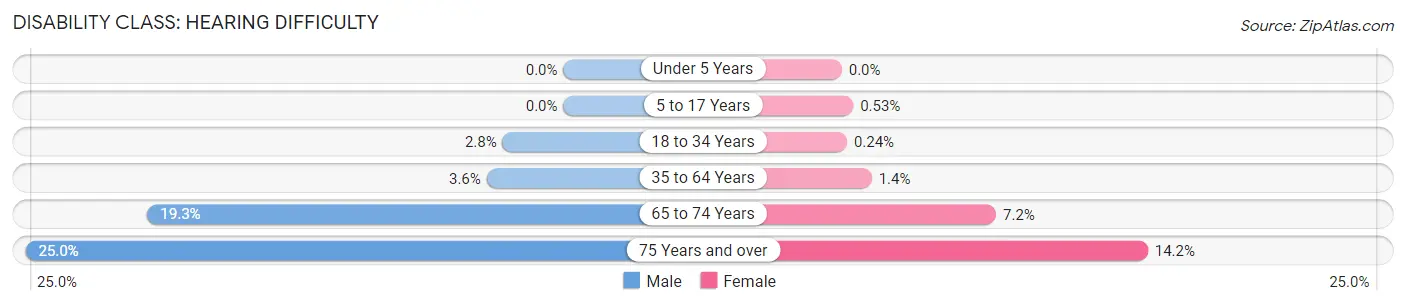
| Age Bracket | Male | Female |
| Under 5 Years | 0 (0.0%) | 0 (0.0%) |
| 5 to 17 Years | 0 (0.0%) | 34 (0.5%) |
| 18 to 34 Years | 191 (2.8%) | 17 (0.2%) |
| 35 to 64 Years | 456 (3.6%) | 182 (1.4%) |
| 65 to 74 Years | 450 (19.3%) | 190 (7.2%) |
| 75 Years and over | 281 (25.0%) | 221 (14.2%) |
Disability Class: Vision Difficulty
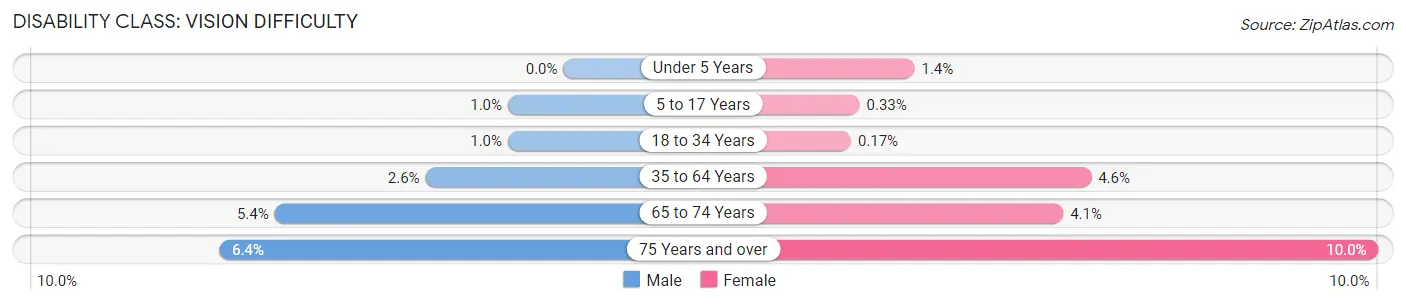
| Age Bracket | Male | Female |
| Under 5 Years | 0 (0.0%) | 27 (1.3%) |
| 5 to 17 Years | 68 (1.0%) | 21 (0.3%) |
| 18 to 34 Years | 70 (1.0%) | 12 (0.2%) |
| 35 to 64 Years | 327 (2.6%) | 607 (4.6%) |
| 65 to 74 Years | 125 (5.4%) | 109 (4.1%) |
| 75 Years and over | 72 (6.4%) | 155 (10.0%) |
Disability Class: Cognitive Difficulty
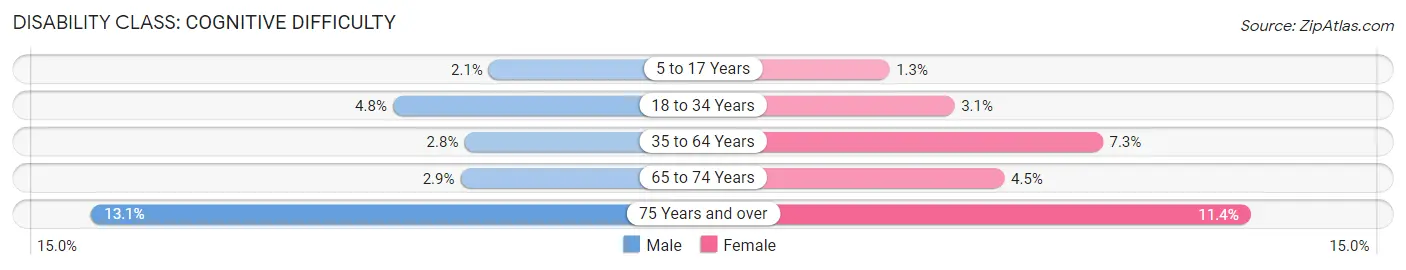
| Age Bracket | Male | Female |
| 5 to 17 Years | 138 (2.1%) | 85 (1.3%) |
| 18 to 34 Years | 322 (4.8%) | 220 (3.1%) |
| 35 to 64 Years | 353 (2.8%) | 953 (7.3%) |
| 65 to 74 Years | 67 (2.9%) | 120 (4.5%) |
| 75 Years and over | 148 (13.1%) | 177 (11.4%) |
Disability Class: Ambulatory Difficulty
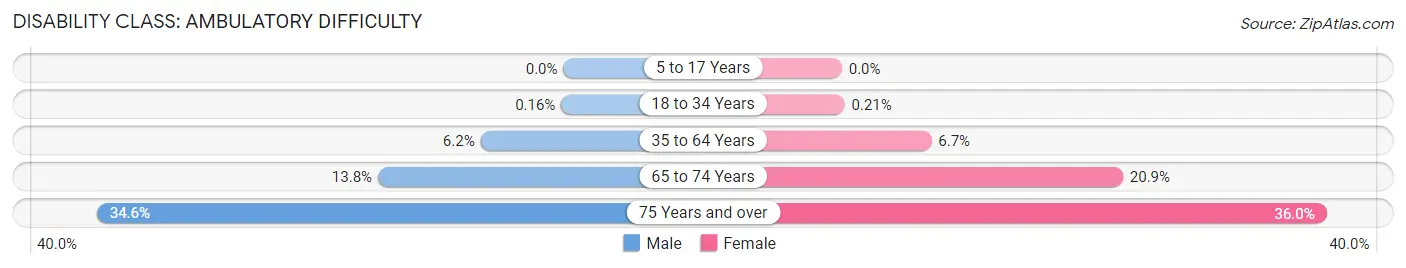
| Age Bracket | Male | Female |
| 5 to 17 Years | 0 (0.0%) | 0 (0.0%) |
| 18 to 34 Years | 11 (0.2%) | 15 (0.2%) |
| 35 to 64 Years | 787 (6.1%) | 873 (6.7%) |
| 65 to 74 Years | 321 (13.8%) | 554 (20.9%) |
| 75 Years and over | 390 (34.6%) | 560 (36.0%) |
Disability Class: Self-Care Difficulty
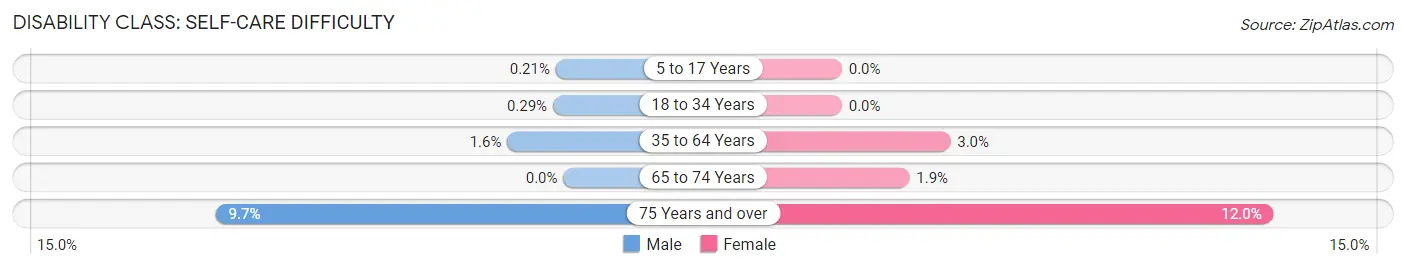
| Age Bracket | Male | Female |
| 5 to 17 Years | 14 (0.2%) | 0 (0.0%) |
| 18 to 34 Years | 20 (0.3%) | 0 (0.0%) |
| 35 to 64 Years | 200 (1.6%) | 396 (3.0%) |
| 65 to 74 Years | 0 (0.0%) | 50 (1.9%) |
| 75 Years and over | 109 (9.7%) | 187 (12.0%) |
Technology Access in Effingham County
Computing Device Access in Effingham County
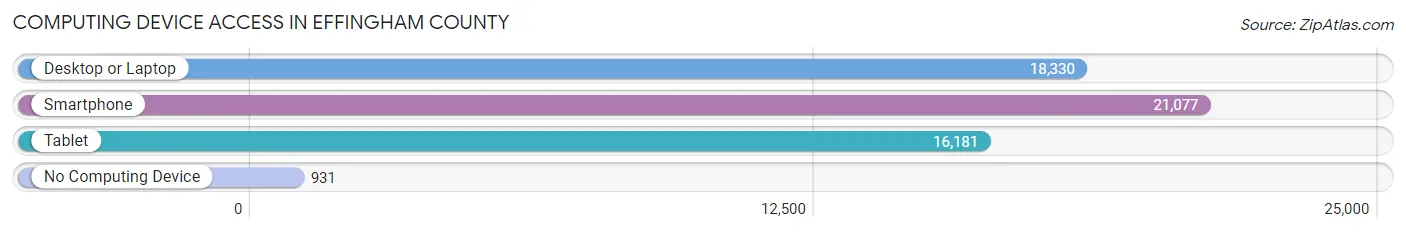
| Device Type | # Households | % Households |
| Desktop or Laptop | 18,330 | 80.3% |
| Smartphone | 21,077 | 92.4% |
| Tablet | 16,181 | 70.9% |
| No Computing Device | 931 | 4.1% |
| Total | 22,820 | 100.0% |
Internet Access in Effingham County
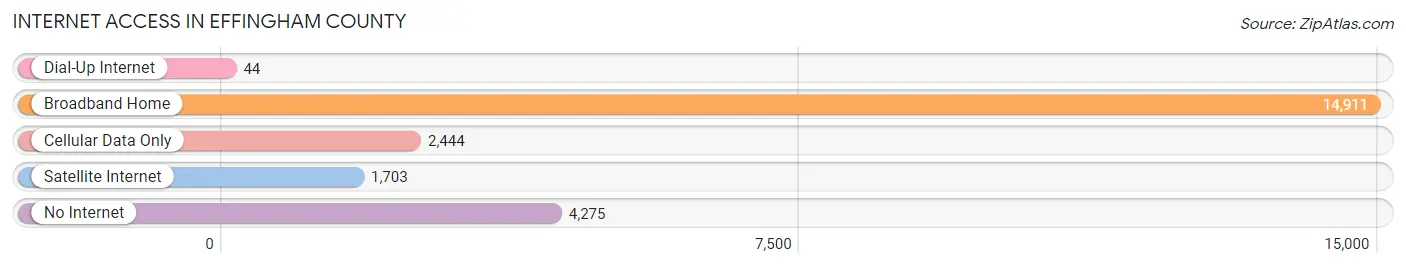
| Internet Type | # Households | % Households |
| Dial-Up Internet | 44 | 0.2% |
| Broadband Home | 14,911 | 65.3% |
| Cellular Data Only | 2,444 | 10.7% |
| Satellite Internet | 1,703 | 7.5% |
| No Internet | 4,275 | 18.7% |
| Total | 22,820 | 100.0% |
Effingham County Summary
Effingham County is a county located in the southeastern part of the U.S. state of Georgia. As of the 2010 census, the population was 52,250. The county seat is Springfield. The county was created February 5, 1777 and is named for Lord Effingham, a British nobleman who opposed the Stamp Act of 1765.
Geography
Effingham County is located in the southeastern part of Georgia, about 40 miles west of Savannah. It is bordered by Chatham County to the north, Bryan County to the east, Bulloch County to the south, and Screven County to the west. The county has a total area of 545 square miles, of which 541 square miles is land and 4.2 square miles (0.8%) is water.
The county is located in the Lower Coastal Plain region of Georgia, and is characterized by flat terrain with sandy soils. The Ogeechee River forms the western boundary of the county, and the Canoochee River forms the eastern boundary.
Demographics
As of the 2010 United States Census, there were 52,250 people, 19,845 households, and 14,717 families residing in the county. The population density was 96.3 inhabitants per square mile (37.2/km2). There were 21,845 housing units at an average density of 40.4 per square mile (15.6/km2). The racial makeup of the county was 84.2% white, 11.3% black or African American, 0.7% Asian, 0.3% American Indian, 2.2% from other races, and 1.5% from two or more races. Those of Hispanic or Latino origin made up 4.7% of the population.
In terms of ancestry, 15.2% were American, 11.2% were Irish, 10.2% were German, and 8.2% were English. Of the 19,845 households, 36.3% had children under the age of 18 living with them, 57.2% were married couples living together, 11.9% had a female householder with no husband present, 25.7% were non-families, and 21.3% of all households were made up of individuals. The average household size was 2.62 and the average family size was 3.04.
The median age in the county was 38.3 years. 25.2% of residents were under the age of 18; 8.2% were between the ages of 18 and 24; 25.2% were from 25 to 44; 27.2% were from 45 to 64; and 14.2% were 65 years of age or older. The gender makeup of the county was 48.7% male and 51.3% female.
Economy
Effingham County is home to a variety of industries, including manufacturing, agriculture, and tourism. The county is home to several large manufacturing companies, including Gulfstream Aerospace, which produces business jets, and Great Dane Trailers, which produces semi-trailers. The county is also home to several agricultural operations, including poultry, beef, and dairy farms.
Tourism is an important part of the county's economy, with several attractions, including the Effingham County Fair, the Effingham County Museum, and the Effingham County Historical Society. The county is also home to several golf courses, parks, and recreational areas.
Conclusion
Effingham County is a county located in the southeastern part of the U.S. state of Georgia. As of the 2010 census, the population was 52,250. The county is characterized by flat terrain with sandy soils, and is bordered by Chatham County to the north, Bryan County to the east, Bulloch County to the south, and Screven County to the west. The county is home to a variety of industries, including manufacturing, agriculture, and tourism. Tourism is an important part of the county's economy, with several attractions, including the Effingham County Fair, the Effingham County Museum, and the Effingham County Historical Society.
Common Questions
What is Per Capita Income in Effingham County?
Per Capita income in Effingham County is $36,506.
What is the Median Family Income in Effingham County?
Median Family Income in Effingham County is $92,126.
What is the Median Household income in Effingham County?
Median Household Income in Effingham County is $79,474.
What is Income or Wage Gap in Effingham County?
Income or Wage Gap in Effingham County is 37.9%.
Women in Effingham County earn 62.1 cents for every dollar earned by a man.
What is Family Income Deficit in Effingham County?
Family Income Deficit in Effingham County is $11,419.
Families that are below poverty line in Effingham County earn $11,419 less on average than the poverty threshold level.
What is Inequality or Gini Index in Effingham County?
Inequality or Gini Index in Effingham County is 0.41.
What is the Total Population of Effingham County?
Total Population of Effingham County is 65,314.
What is the Total Male Population of Effingham County?
Total Male Population of Effingham County is 32,382.
What is the Total Female Population of Effingham County?
Total Female Population of Effingham County is 32,932.
What is the Ratio of Males per 100 Females in Effingham County?
There are 98.33 Males per 100 Females in Effingham County.
What is the Ratio of Females per 100 Males in Effingham County?
There are 101.70 Females per 100 Males in Effingham County.
What is the Median Population Age in Effingham County?
Median Population Age in Effingham County is 36.4 Years.
What is the Average Family Size in Effingham County
Average Family Size in Effingham County is 3.3 People.
What is the Average Household Size in Effingham County
Average Household Size in Effingham County is 2.9 People.
How Large is the Labor Force in Effingham County?
There are 32,966 People in the Labor Forcein in Effingham County.
What is the Percentage of People in the Labor Force in Effingham County?
65.9% of People are in the Labor Force in Effingham County.
What is the Unemployment Rate in Effingham County?
Unemployment Rate in Effingham County is 5.3%.