Dawson County, GA Map & Demographics
Dawson County Map
Dawson County Overview
$41,096
PER CAPITA INCOME
$101,924
AVG FAMILY INCOME
$84,516
AVG HOUSEHOLD INCOME
26.6%
WAGE / INCOME GAP [ % ]
73.4¢/ $1
WAGE / INCOME GAP [ $ ]
0.41
INEQUALITY / GINI INDEX
27,355
TOTAL POPULATION
14,023
MALE POPULATION
13,332
FEMALE POPULATION
105.18
MALES / 100 FEMALES
95.07
FEMALES / 100 MALES
43.9
MEDIAN AGE
3.1
AVG FAMILY SIZE
2.6
AVG HOUSEHOLD SIZE
14,361
LABOR FORCE [ PEOPLE ]
63.3%
PERCENT IN LABOR FORCE
4.6%
UNEMPLOYMENT RATE
Dawson County Area Codes
Income in Dawson County
Income Overview in Dawson County
Per Capita Income in Dawson County is $41,096, while median incomes of families and households are $101,924 and $84,516 respectively.
| Characteristic | Number | Measure |
| Per Capita Income | 27,355 | $41,096 |
| Median Family Income | 7,425 | $101,924 |
| Mean Family Income | 7,425 | $121,745 |
| Median Household Income | 10,343 | $84,516 |
| Mean Household Income | 10,343 | $107,051 |
| Income Deficit | 7,425 | $0 |
| Wage / Income Gap (%) | 27,355 | 26.64% |
| Wage / Income Gap ($) | 27,355 | 73.36¢ per $1 |
| Gini / Inequality Index | 27,355 | 0.41 |
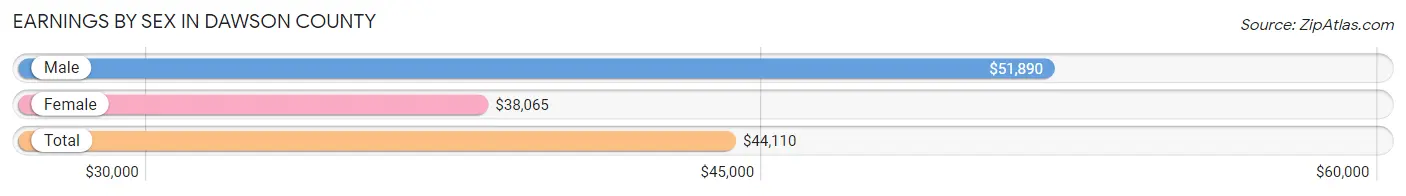
Earnings by Sex in Dawson County
Average Earnings in Dawson County are $44,110, $51,890 for men and $38,065 for women, a difference of 26.6%.
| Sex | Number | Average Earnings |
| Male | 8,152 (55.7%) | $51,890 |
| Female | 6,487 (44.3%) | $38,065 |
| Total | 14,639 (100.0%) | $44,110 |
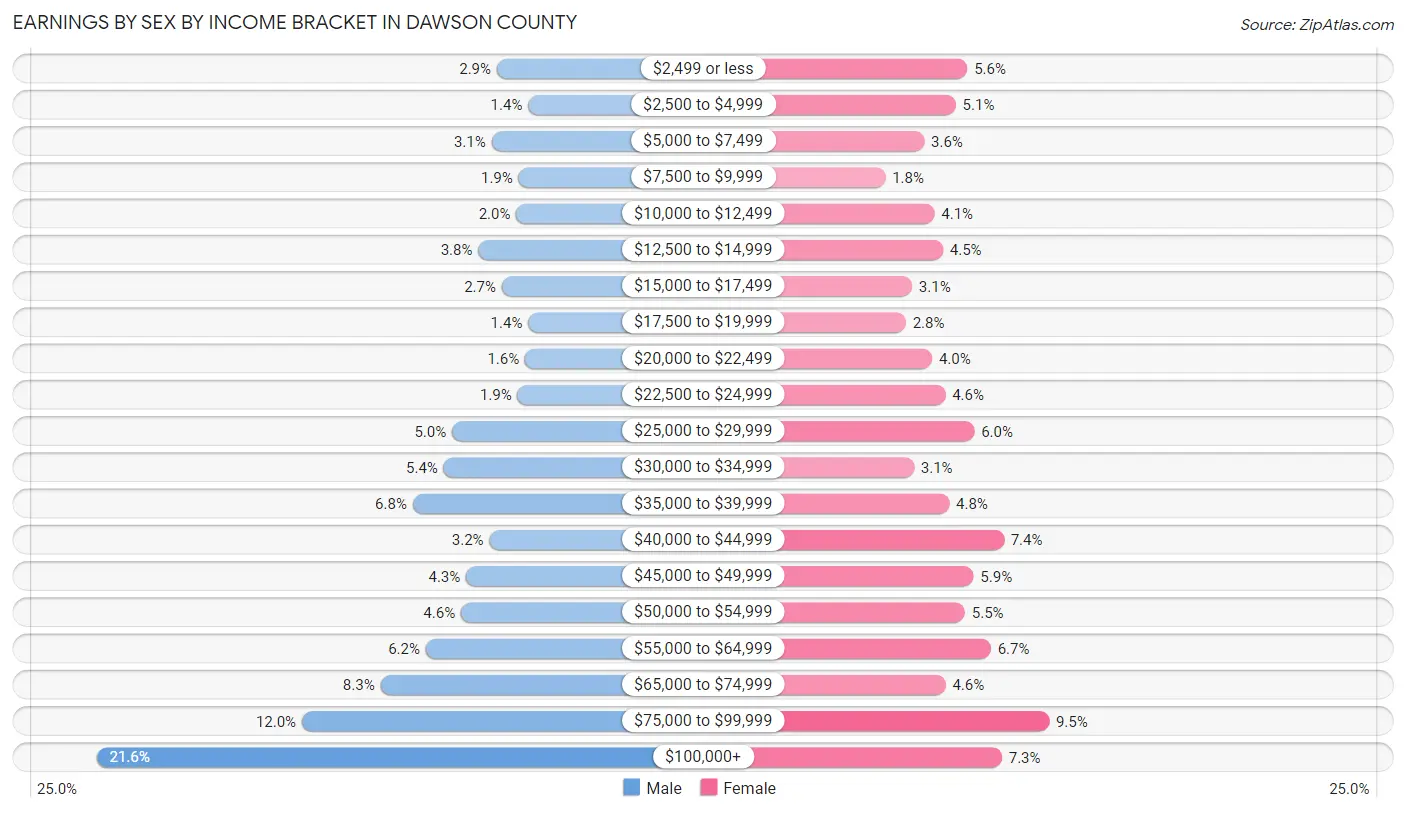
Earnings by Sex by Income Bracket in Dawson County
The most common earnings brackets in Dawson County are $100,000+ for men (1,763 | 21.6%) and $75,000 to $99,999 for women (614 | 9.5%).
| Income | Male | Female |
| $2,499 or less | 235 (2.9%) | 366 (5.6%) |
| $2,500 to $4,999 | 115 (1.4%) | 331 (5.1%) |
| $5,000 to $7,499 | 255 (3.1%) | 235 (3.6%) |
| $7,500 to $9,999 | 152 (1.9%) | 117 (1.8%) |
| $10,000 to $12,499 | 161 (2.0%) | 266 (4.1%) |
| $12,500 to $14,999 | 306 (3.7%) | 292 (4.5%) |
| $15,000 to $17,499 | 216 (2.6%) | 198 (3.0%) |
| $17,500 to $19,999 | 115 (1.4%) | 179 (2.8%) |
| $20,000 to $22,499 | 127 (1.6%) | 259 (4.0%) |
| $22,500 to $24,999 | 156 (1.9%) | 299 (4.6%) |
| $25,000 to $29,999 | 406 (5.0%) | 387 (6.0%) |
| $30,000 to $34,999 | 438 (5.4%) | 204 (3.1%) |
| $35,000 to $39,999 | 556 (6.8%) | 311 (4.8%) |
| $40,000 to $44,999 | 263 (3.2%) | 477 (7.3%) |
| $45,000 to $49,999 | 352 (4.3%) | 385 (5.9%) |
| $50,000 to $54,999 | 372 (4.6%) | 359 (5.5%) |
| $55,000 to $64,999 | 506 (6.2%) | 437 (6.7%) |
| $65,000 to $74,999 | 679 (8.3%) | 300 (4.6%) |
| $75,000 to $99,999 | 979 (12.0%) | 614 (9.5%) |
| $100,000+ | 1,763 (21.6%) | 471 (7.3%) |
| Total | 8,152 (100.0%) | 6,487 (100.0%) |
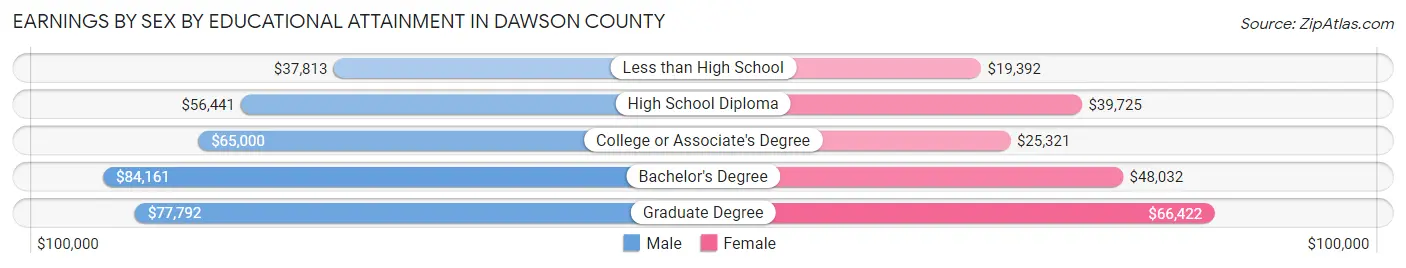
Earnings by Sex by Educational Attainment in Dawson County
Average earnings in Dawson County are $65,050 for men and $42,645 for women, a difference of 34.4%. Men with an educational attainment of bachelor's degree enjoy the highest average annual earnings of $84,161, while those with less than high school education earn the least with $37,813. Women with an educational attainment of graduate degree earn the most with the average annual earnings of $66,422, while those with less than high school education have the smallest earnings of $19,392.
| Educational Attainment | Male Income | Female Income |
| Less than High School | $37,813 | $19,392 |
| High School Diploma | $56,441 | $39,725 |
| College or Associate's Degree | $65,000 | $25,321 |
| Bachelor's Degree | $84,161 | $48,032 |
| Graduate Degree | $77,792 | $66,422 |
| Total | $65,050 | $42,645 |
Family Income in Dawson County
Family Income Brackets in Dawson County
According to the Dawson County family income data, there are 1,678 families falling into the $100,000 to $149,999 income range, which is the most common income bracket and makes up 22.6% of all families. Conversely, the $10,000 to $14,999 income bracket is the least frequent group with only 74 families (1.0%) belonging to this category.
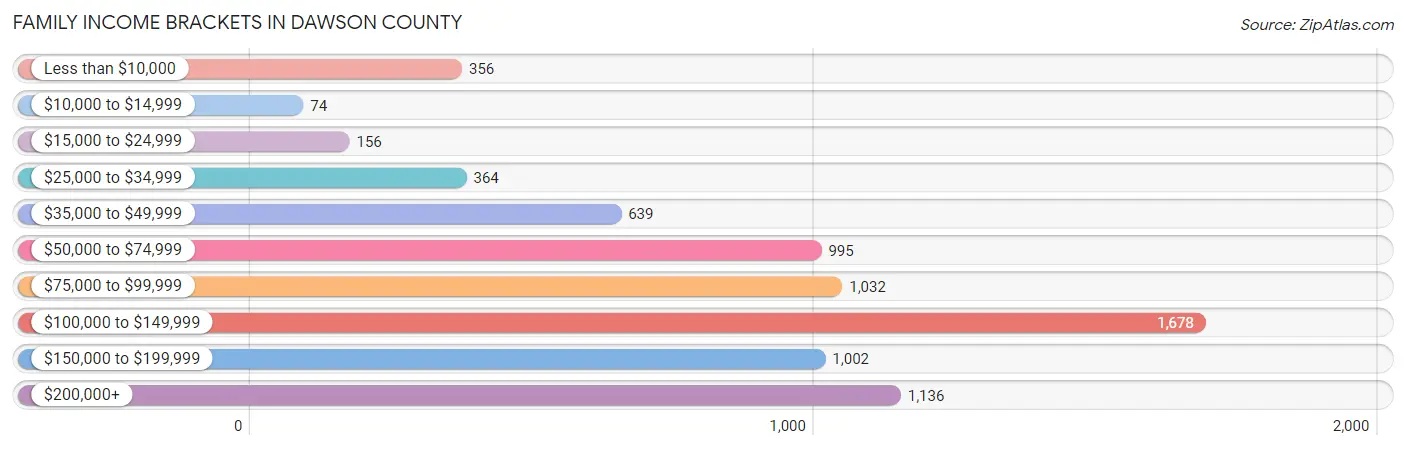
| Income Bracket | # Families | % Families |
| Less than $10,000 | 356 | 4.8% |
| $10,000 to $14,999 | 74 | 1.0% |
| $15,000 to $24,999 | 156 | 2.1% |
| $25,000 to $34,999 | 364 | 4.9% |
| $35,000 to $49,999 | 639 | 8.6% |
| $50,000 to $74,999 | 995 | 13.4% |
| $75,000 to $99,999 | 1,032 | 13.9% |
| $100,000 to $149,999 | 1,678 | 22.6% |
| $150,000 to $199,999 | 1,002 | 13.5% |
| $200,000+ | 1,136 | 15.3% |
Family Income by Famaliy Size in Dawson County
5-person families (752 | 10.1%) account for the highest median family income in Dawson County with $129,861 per family, while 2-person families (3,492 | 47.0%) have the highest median income of $48,184 per family member.
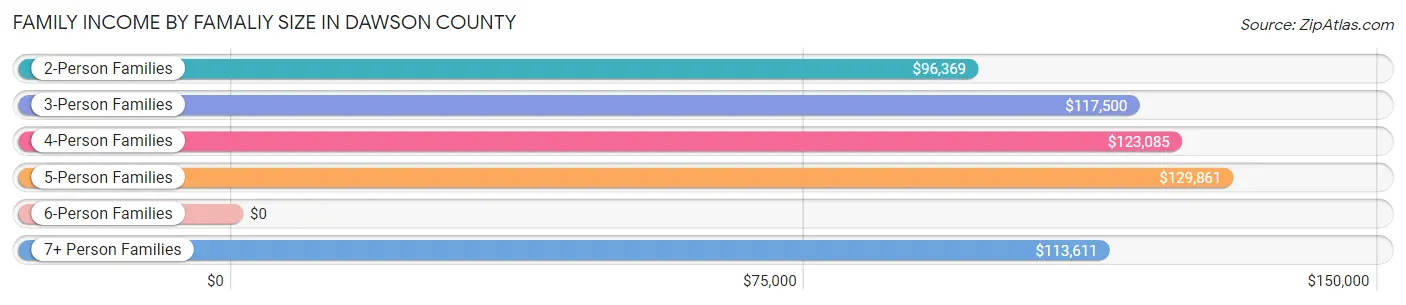
| Income Bracket | # Families | Median Income |
| 2-Person Families | 3,492 (47.0%) | $96,369 |
| 3-Person Families | 1,632 (22.0%) | $117,500 |
| 4-Person Families | 1,206 (16.2%) | $123,085 |
| 5-Person Families | 752 (10.1%) | $129,861 |
| 6-Person Families | 271 (3.6%) | $0 |
| 7+ Person Families | 72 (1.0%) | $113,611 |
| Total | 7,425 (100.0%) | $101,924 |
Family Income by Number of Earners in Dawson County
The median family income in Dawson County is $101,924, with families comprising 3+ earners (1,057) having the highest median family income of $172,868, while families with no earners (1,428) have the lowest median family income of $44,583, accounting for 14.2% and 19.2% of families, respectively.
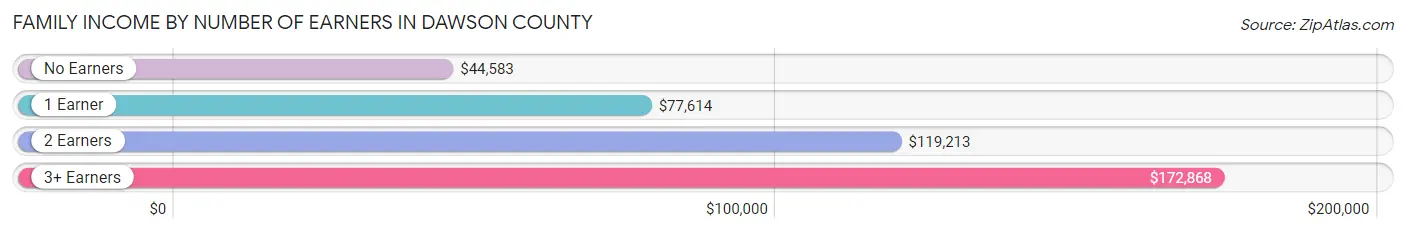
| Number of Earners | # Families | Median Income |
| No Earners | 1,428 (19.2%) | $44,583 |
| 1 Earner | 2,208 (29.7%) | $77,614 |
| 2 Earners | 2,732 (36.8%) | $119,213 |
| 3+ Earners | 1,057 (14.2%) | $172,868 |
| Total | 7,425 (100.0%) | $101,924 |
Household Income in Dawson County
Household Income Brackets in Dawson County
With 2,058 households falling in the category, the $100,000 to $149,999 income range is the most frequent in Dawson County, accounting for 19.9% of all households. In contrast, only 186 households (1.8%) fall into the $10,000 to $14,999 income bracket, making it the least populous group.
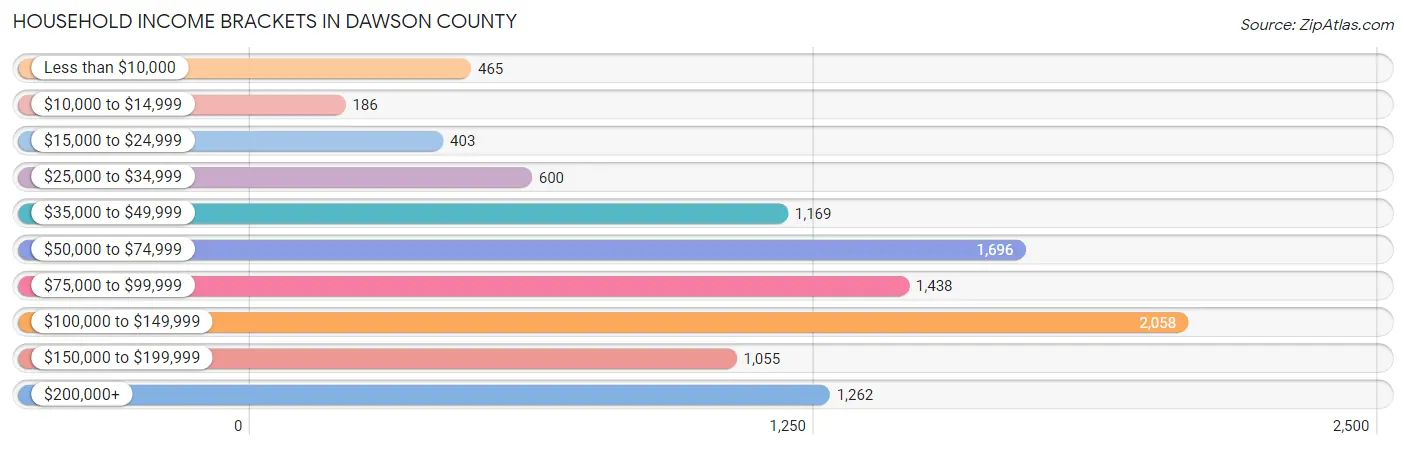
| Income Bracket | # Households | % Households |
| Less than $10,000 | 465 | 4.5% |
| $10,000 to $14,999 | 186 | 1.8% |
| $15,000 to $24,999 | 403 | 3.9% |
| $25,000 to $34,999 | 600 | 5.8% |
| $35,000 to $49,999 | 1,169 | 11.3% |
| $50,000 to $74,999 | 1,696 | 16.4% |
| $75,000 to $99,999 | 1,438 | 13.9% |
| $100,000 to $149,999 | 2,058 | 19.9% |
| $150,000 to $199,999 | 1,055 | 10.2% |
| $200,000+ | 1,262 | 12.2% |
Household Income by Householder Age in Dawson County
The median household income in Dawson County is $84,516, with the highest median household income of $117,544 found in the 45 to 64 years age bracket for the primary householder. A total of 4,293 households (41.5%) fall into this category. Meanwhile, the 65+ years age bracket for the primary householder has the lowest median household income of $54,561, with 3,301 households (31.9%) in this group.
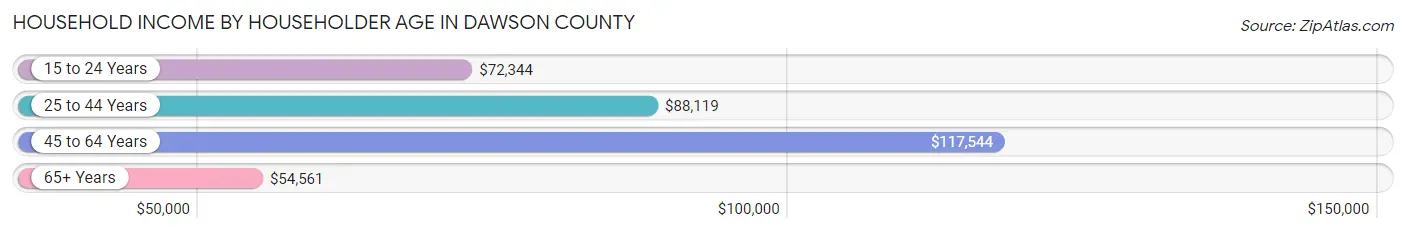
| Income Bracket | # Households | Median Income |
| 15 to 24 Years | 208 (2.0%) | $72,344 |
| 25 to 44 Years | 2,541 (24.6%) | $88,119 |
| 45 to 64 Years | 4,293 (41.5%) | $117,544 |
| 65+ Years | 3,301 (31.9%) | $54,561 |
| Total | 10,343 (100.0%) | $84,516 |
Poverty in Dawson County
Income Below Poverty by Sex and Age in Dawson County
With 9.0% poverty level for males and 10.3% for females among the residents of Dawson County, 15 year old males and under 5 year old females are the most vulnerable to poverty, with 101 males (38.9%) and 189 females (30.3%) in their respective age groups living below the poverty level.
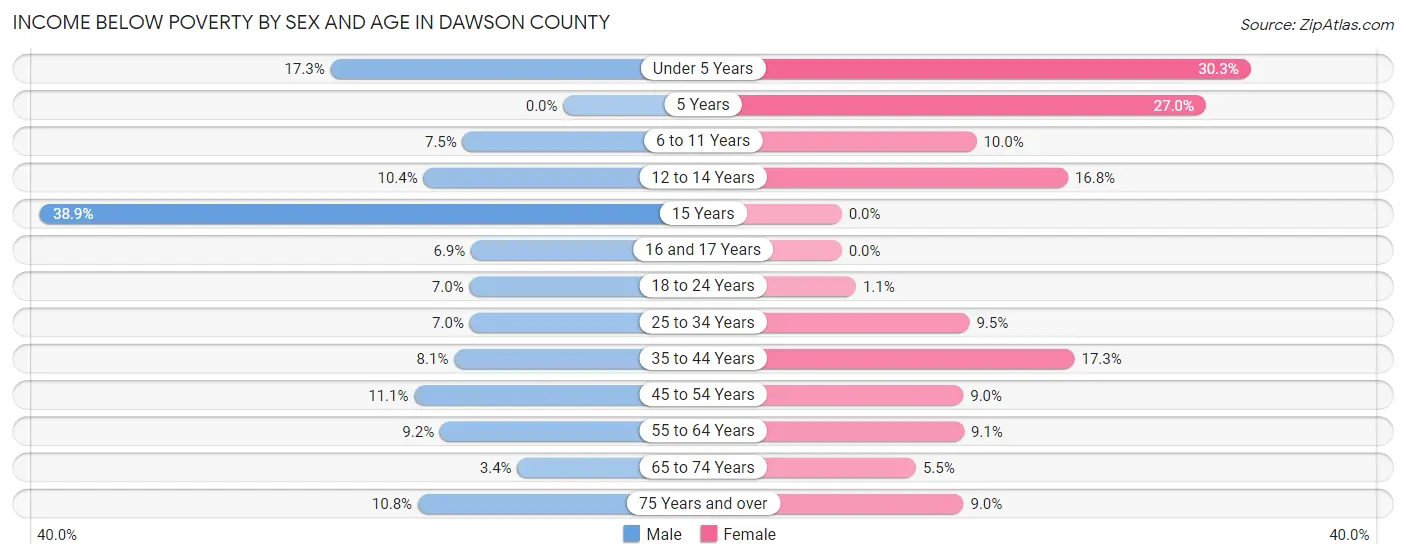
| Age Bracket | Male | Female |
| Under 5 Years | 121 (17.3%) | 189 (30.3%) |
| 5 Years | 0 (0.0%) | 50 (27.0%) |
| 6 to 11 Years | 80 (7.5%) | 49 (10.0%) |
| 12 to 14 Years | 44 (10.4%) | 117 (16.8%) |
| 15 Years | 101 (38.9%) | 0 (0.0%) |
| 16 and 17 Years | 28 (6.9%) | 0 (0.0%) |
| 18 to 24 Years | 87 (7.0%) | 11 (1.1%) |
| 25 to 34 Years | 114 (7.0%) | 152 (9.5%) |
| 35 to 44 Years | 123 (8.1%) | 253 (17.3%) |
| 45 to 54 Years | 216 (11.1%) | 174 (9.0%) |
| 55 to 64 Years | 181 (9.2%) | 182 (9.1%) |
| 65 to 74 Years | 56 (3.4%) | 96 (5.5%) |
| 75 Years and over | 104 (10.8%) | 95 (9.0%) |
| Total | 1,255 (9.0%) | 1,368 (10.3%) |
Income Above Poverty by Sex and Age in Dawson County
According to the poverty statistics in Dawson County, males aged 5 years and females aged 15 years are the age groups that are most secure financially, with 100.0% of males and 100.0% of females in these age groups living above the poverty line.
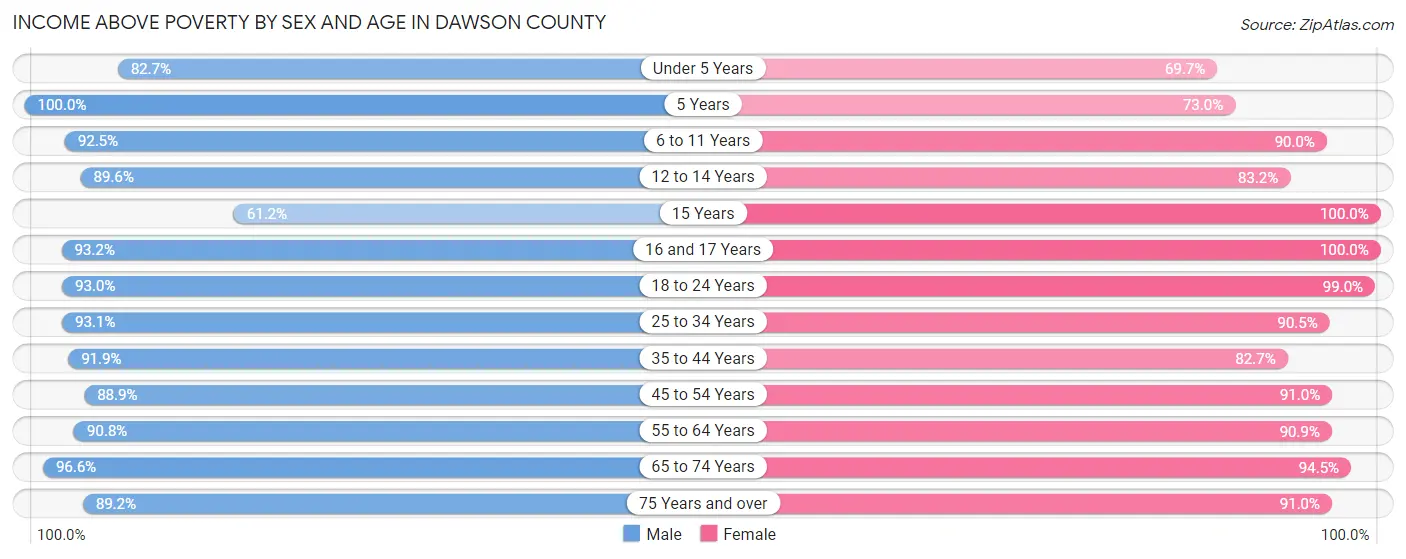
| Age Bracket | Male | Female |
| Under 5 Years | 579 (82.7%) | 434 (69.7%) |
| 5 Years | 123 (100.0%) | 135 (73.0%) |
| 6 to 11 Years | 990 (92.5%) | 441 (90.0%) |
| 12 to 14 Years | 380 (89.6%) | 580 (83.2%) |
| 15 Years | 159 (61.2%) | 59 (100.0%) |
| 16 and 17 Years | 381 (93.1%) | 376 (100.0%) |
| 18 to 24 Years | 1,162 (93.0%) | 1,035 (99.0%) |
| 25 to 34 Years | 1,526 (93.0%) | 1,451 (90.5%) |
| 35 to 44 Years | 1,396 (91.9%) | 1,211 (82.7%) |
| 45 to 54 Years | 1,735 (88.9%) | 1,755 (91.0%) |
| 55 to 64 Years | 1,796 (90.8%) | 1,824 (90.9%) |
| 65 to 74 Years | 1,587 (96.6%) | 1,647 (94.5%) |
| 75 Years and over | 859 (89.2%) | 956 (91.0%) |
| Total | 12,673 (91.0%) | 11,904 (89.7%) |
Income Below Poverty Among Married-Couple Families in Dawson County
The poverty statistics for married-couple families in Dawson County show that 3.6% or 217 of the total 6,043 families live below the poverty line. Families with 1 or 2 children have the highest poverty rate of 4.1%, comprising of 70 families. On the other hand, families with 3 or 4 children have the lowest poverty rate of 0.0%, which includes 0 families.
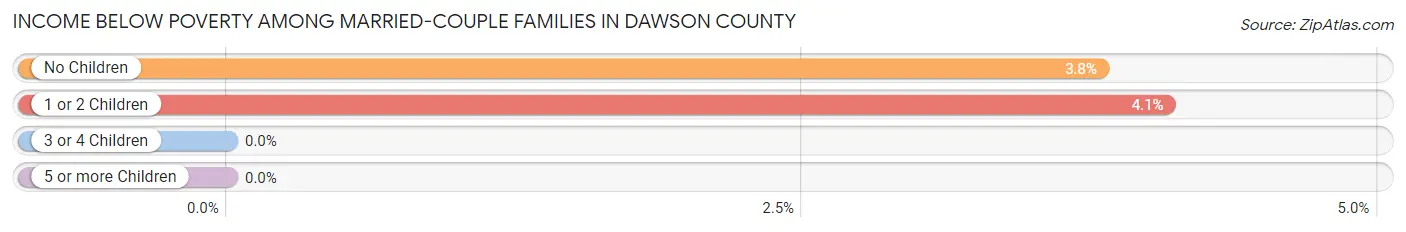
| Children | Above Poverty | Below Poverty |
| No Children | 3,735 (96.2%) | 147 (3.8%) |
| 1 or 2 Children | 1,646 (95.9%) | 70 (4.1%) |
| 3 or 4 Children | 427 (100.0%) | 0 (0.0%) |
| 5 or more Children | 18 (100.0%) | 0 (0.0%) |
| Total | 5,826 (96.4%) | 217 (3.6%) |
Income Below Poverty Among Single-Parent Households in Dawson County
According to the poverty data in Dawson County, 7.7% or 26 single-father households and 29.3% or 306 single-mother households are living below the poverty line. Among single-father households, those with no children have the highest poverty rate, with 26 households (12.5%) experiencing poverty. Likewise, among single-mother households, those with 5 or more children have the highest poverty rate, with 106 households (79.1%) falling below the poverty line.
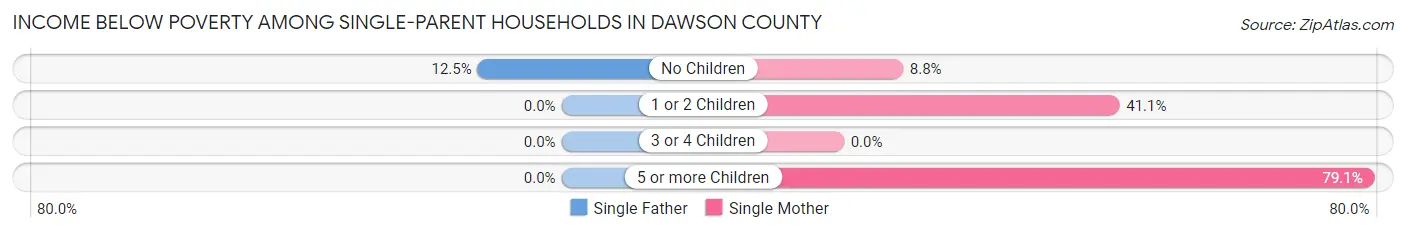
| Children | Single Father | Single Mother |
| No Children | 26 (12.5%) | 39 (8.8%) |
| 1 or 2 Children | 0 (0.0%) | 161 (41.1%) |
| 3 or 4 Children | 0 (0.0%) | 0 (0.0%) |
| 5 or more Children | 0 (0.0%) | 106 (79.1%) |
| Total | 26 (7.7%) | 306 (29.3%) |
Income Below Poverty Among Married-Couple vs Single-Parent Households in Dawson County
The poverty data for Dawson County shows that 217 of the married-couple family households (3.6%) and 332 of the single-parent households (24.0%) are living below the poverty level. Within the married-couple family households, those with 1 or 2 children have the highest poverty rate, with 70 households (4.1%) falling below the poverty line. Among the single-parent households, those with 5 or more children have the highest poverty rate, with 106 household (79.1%) living below poverty.
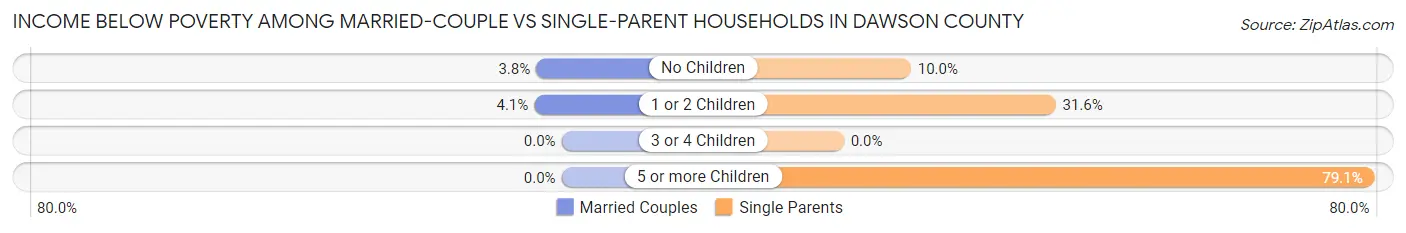
| Children | Married-Couple Families | Single-Parent Households |
| No Children | 147 (3.8%) | 65 (10.0%) |
| 1 or 2 Children | 70 (4.1%) | 161 (31.6%) |
| 3 or 4 Children | 0 (0.0%) | 0 (0.0%) |
| 5 or more Children | 0 (0.0%) | 106 (79.1%) |
| Total | 217 (3.6%) | 332 (24.0%) |
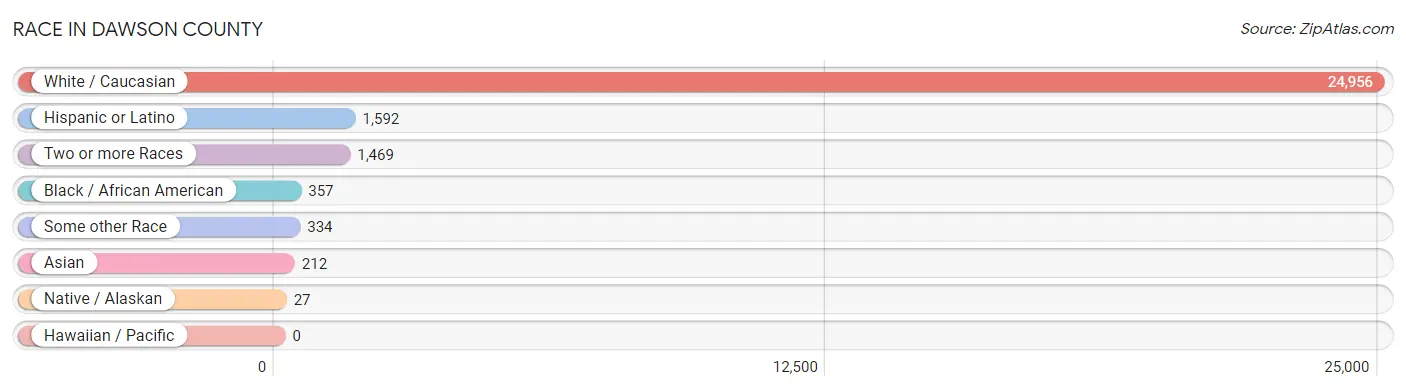
Race in Dawson County
The most populous races in Dawson County are White / Caucasian (24,956 | 91.2%), Hispanic or Latino (1,592 | 5.8%), and Two or more Races (1,469 | 5.4%).
| Race | # Population | % Population |
| Asian | 212 | 0.8% |
| Black / African American | 357 | 1.3% |
| Hawaiian / Pacific | 0 | 0.0% |
| Hispanic or Latino | 1,592 | 5.8% |
| Native / Alaskan | 27 | 0.1% |
| White / Caucasian | 24,956 | 91.2% |
| Two or more Races | 1,469 | 5.4% |
| Some other Race | 334 | 1.2% |
| Total | 27,355 | 100.0% |
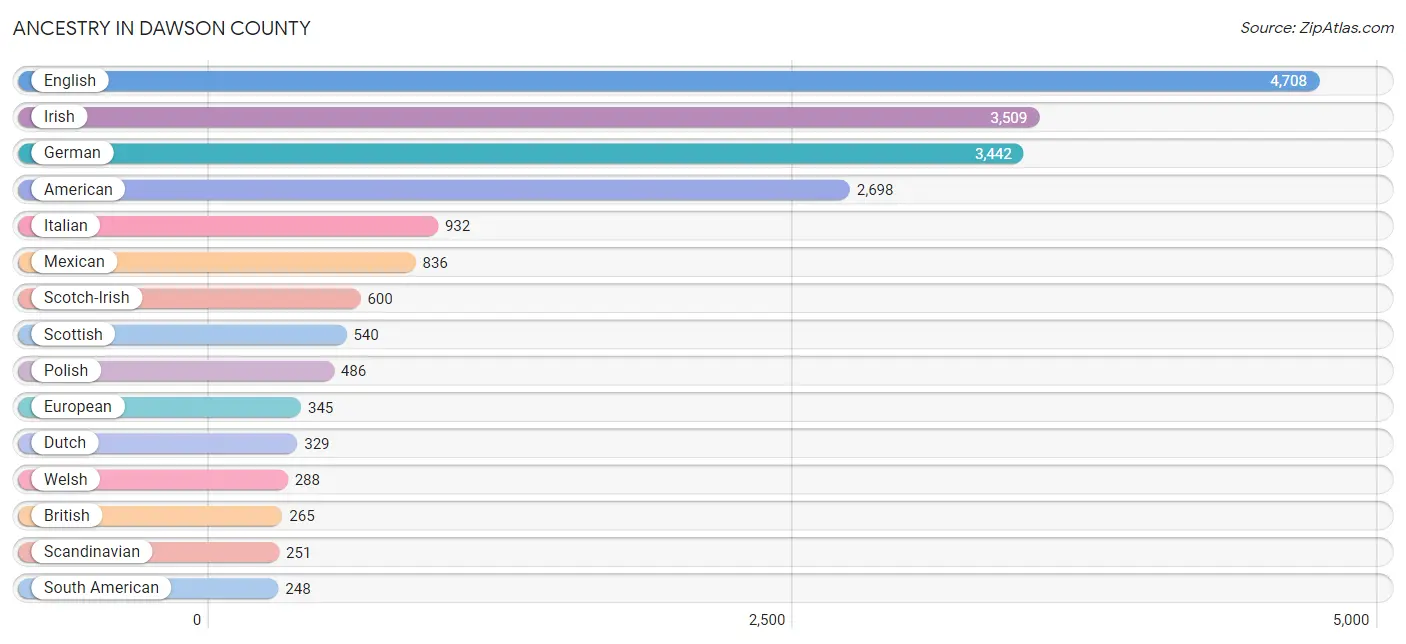
Ancestry in Dawson County
The most populous ancestries reported in Dawson County are English (4,708 | 17.2%), Irish (3,509 | 12.8%), German (3,442 | 12.6%), American (2,698 | 9.9%), and Italian (932 | 3.4%), together accounting for 55.9% of all Dawson County residents.
| Ancestry | # Population | % Population |
| African | 162 | 0.6% |
| American | 2,698 | 9.9% |
| Arab | 116 | 0.4% |
| Austrian | 21 | 0.1% |
| British | 265 | 1.0% |
| Burmese | 31 | 0.1% |
| Canadian | 22 | 0.1% |
| Central American | 87 | 0.3% |
| Cherokee | 53 | 0.2% |
| Chippewa | 73 | 0.3% |
| Choctaw | 7 | 0.0% |
| Colombian | 208 | 0.8% |
| Cree | 1 | 0.0% |
| Croatian | 21 | 0.1% |
| Cuban | 246 | 0.9% |
| Czech | 75 | 0.3% |
| Czechoslovakian | 18 | 0.1% |
| Danish | 6 | 0.0% |
| Dominican | 14 | 0.1% |
| Dutch | 329 | 1.2% |
| Eastern European | 182 | 0.7% |
| English | 4,708 | 17.2% |
| European | 345 | 1.3% |
| Finnish | 17 | 0.1% |
| French | 180 | 0.7% |
| French Canadian | 156 | 0.6% |
| German | 3,442 | 12.6% |
| Greek | 67 | 0.2% |
| Guamanian / Chamorro | 10 | 0.0% |
| Guatemalan | 70 | 0.3% |
| Haitian | 55 | 0.2% |
| Hungarian | 113 | 0.4% |
| Indian (Asian) | 2 | 0.0% |
| Iraqi | 102 | 0.4% |
| Irish | 3,509 | 12.8% |
| Italian | 932 | 3.4% |
| Jamaican | 45 | 0.2% |
| Korean | 125 | 0.5% |
| Lebanese | 14 | 0.1% |
| Lithuanian | 27 | 0.1% |
| Luxembourger | 5 | 0.0% |
| Mexican | 836 | 3.1% |
| Nicaraguan | 17 | 0.1% |
| Northern European | 78 | 0.3% |
| Norwegian | 91 | 0.3% |
| Peruvian | 40 | 0.2% |
| Polish | 486 | 1.8% |
| Portuguese | 50 | 0.2% |
| Puerto Rican | 89 | 0.3% |
| Romanian | 11 | 0.0% |
| Russian | 28 | 0.1% |
| Scandinavian | 251 | 0.9% |
| Scotch-Irish | 600 | 2.2% |
| Scottish | 540 | 2.0% |
| Slovak | 15 | 0.1% |
| South African | 6 | 0.0% |
| South American | 248 | 0.9% |
| Spanish | 55 | 0.2% |
| Subsaharan African | 168 | 0.6% |
| Swedish | 54 | 0.2% |
| Swiss | 41 | 0.2% |
| Thai | 126 | 0.5% |
| Ukrainian | 35 | 0.1% |
| Welsh | 288 | 1.1% | View All 64 Rows |
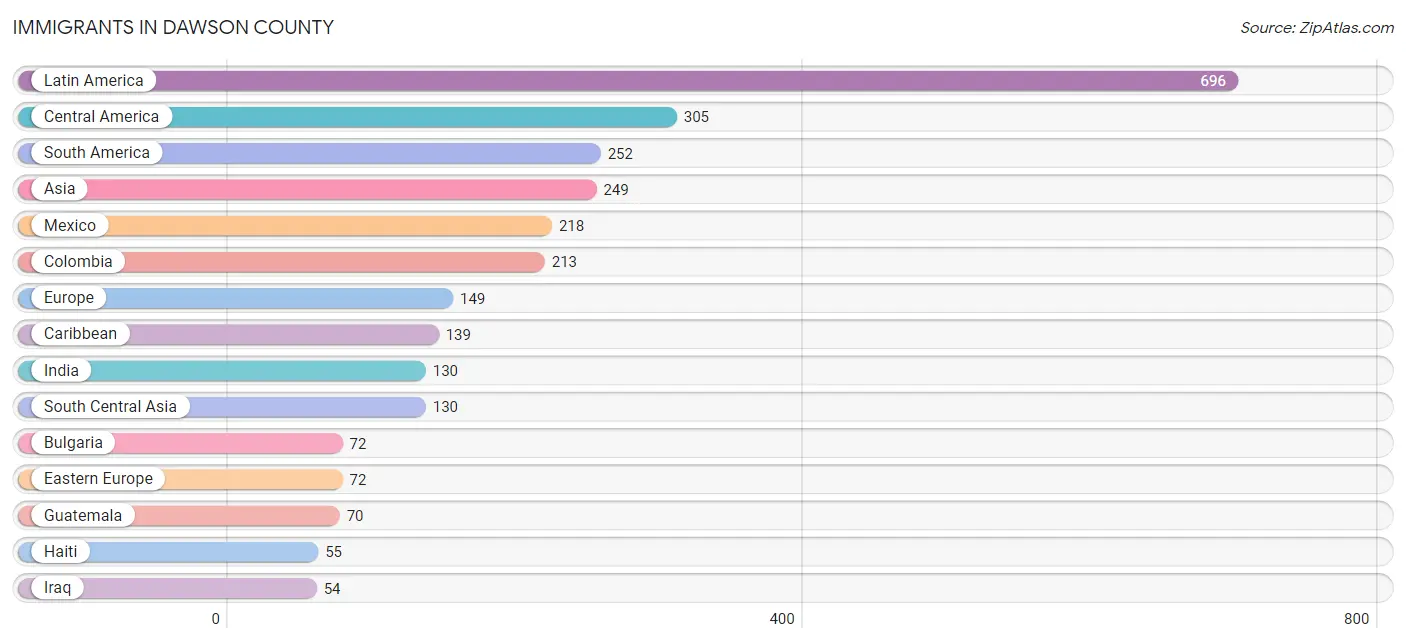
Immigrants in Dawson County
The most numerous immigrant groups reported in Dawson County came from Latin America (696 | 2.5%), Central America (305 | 1.1%), South America (252 | 0.9%), Asia (249 | 0.9%), and Mexico (218 | 0.8%), together accounting for 6.3% of all Dawson County residents.
| Immigration Origin | # Population | % Population |
| Africa | 13 | 0.1% |
| Asia | 249 | 0.9% |
| Brazil | 6 | 0.0% |
| Bulgaria | 72 | 0.3% |
| Canada | 40 | 0.2% |
| Caribbean | 139 | 0.5% |
| Central America | 305 | 1.1% |
| Colombia | 213 | 0.8% |
| Cuba | 20 | 0.1% |
| Denmark | 6 | 0.0% |
| Dominican Republic | 14 | 0.1% |
| Eastern Africa | 7 | 0.0% |
| Eastern Asia | 11 | 0.0% |
| Eastern Europe | 72 | 0.3% |
| Ethiopia | 7 | 0.0% |
| Europe | 149 | 0.5% |
| Germany | 25 | 0.1% |
| Grenada | 5 | 0.0% |
| Guatemala | 70 | 0.3% |
| Haiti | 55 | 0.2% |
| India | 130 | 0.5% |
| Indonesia | 2 | 0.0% |
| Iraq | 54 | 0.2% |
| Italy | 7 | 0.0% |
| Jamaica | 45 | 0.2% |
| Korea | 11 | 0.0% |
| Latin America | 696 | 2.5% |
| Mexico | 218 | 0.8% |
| Netherlands | 5 | 0.0% |
| Nicaragua | 17 | 0.1% |
| Northern Europe | 40 | 0.2% |
| Peru | 33 | 0.1% |
| Philippines | 52 | 0.2% |
| Scotland | 10 | 0.0% |
| South Africa | 6 | 0.0% |
| South America | 252 | 0.9% |
| South Central Asia | 130 | 0.5% |
| South Eastern Asia | 54 | 0.2% |
| Southern Europe | 7 | 0.0% |
| Western Asia | 54 | 0.2% |
| Western Europe | 30 | 0.1% | View All 41 Rows |
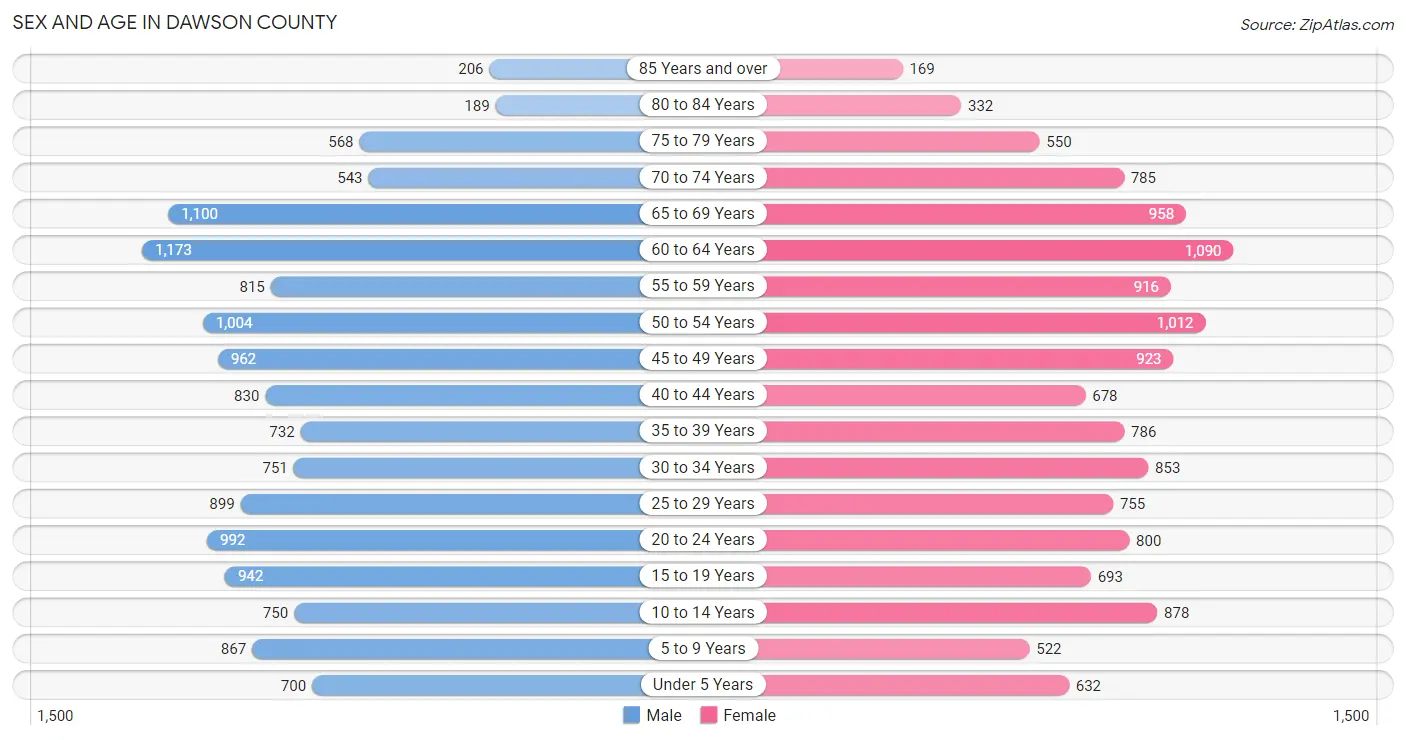
Sex and Age in Dawson County
Sex and Age in Dawson County
The most populous age groups in Dawson County are 60 to 64 Years (1,173 | 8.4%) for men and 60 to 64 Years (1,090 | 8.2%) for women.
| Age Bracket | Male | Female |
| Under 5 Years | 700 (5.0%) | 632 (4.7%) |
| 5 to 9 Years | 867 (6.2%) | 522 (3.9%) |
| 10 to 14 Years | 750 (5.3%) | 878 (6.6%) |
| 15 to 19 Years | 942 (6.7%) | 693 (5.2%) |
| 20 to 24 Years | 992 (7.1%) | 800 (6.0%) |
| 25 to 29 Years | 899 (6.4%) | 755 (5.7%) |
| 30 to 34 Years | 751 (5.4%) | 853 (6.4%) |
| 35 to 39 Years | 732 (5.2%) | 786 (5.9%) |
| 40 to 44 Years | 830 (5.9%) | 678 (5.1%) |
| 45 to 49 Years | 962 (6.9%) | 923 (6.9%) |
| 50 to 54 Years | 1,004 (7.2%) | 1,012 (7.6%) |
| 55 to 59 Years | 815 (5.8%) | 916 (6.9%) |
| 60 to 64 Years | 1,173 (8.4%) | 1,090 (8.2%) |
| 65 to 69 Years | 1,100 (7.8%) | 958 (7.2%) |
| 70 to 74 Years | 543 (3.9%) | 785 (5.9%) |
| 75 to 79 Years | 568 (4.1%) | 550 (4.1%) |
| 80 to 84 Years | 189 (1.3%) | 332 (2.5%) |
| 85 Years and over | 206 (1.5%) | 169 (1.3%) |
| Total | 14,023 (100.0%) | 13,332 (100.0%) |
Families and Households in Dawson County
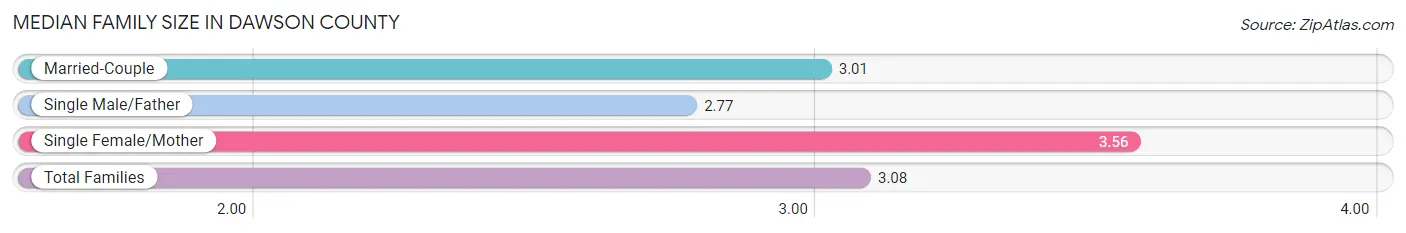
Median Family Size in Dawson County
The median family size in Dawson County is 3.08 persons per family, with single female/mother families (1,043 | 14.1%) accounting for the largest median family size of 3.56 persons per family. On the other hand, single male/father families (339 | 4.6%) represent the smallest median family size with 2.77 persons per family.
| Family Type | # Families | Family Size |
| Married-Couple | 6,043 (81.4%) | 3.01 |
| Single Male/Father | 339 (4.6%) | 2.77 |
| Single Female/Mother | 1,043 (14.1%) | 3.56 |
| Total Families | 7,425 (100.0%) | 3.08 |
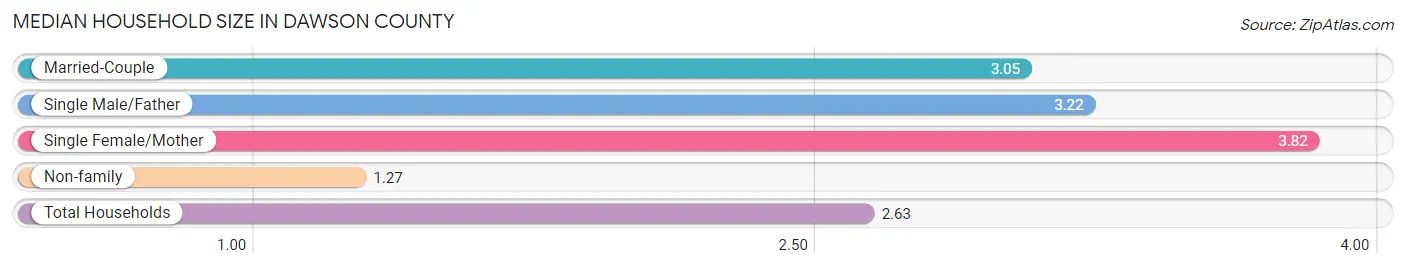
Median Household Size in Dawson County
The median household size in Dawson County is 2.63 persons per household, with single female/mother households (1,043 | 10.1%) accounting for the largest median household size of 3.82 persons per household. non-family households (2,918 | 28.2%) represent the smallest median household size with 1.27 persons per household.
| Household Type | # Households | Household Size |
| Married-Couple | 6,043 (58.4%) | 3.05 |
| Single Male/Father | 339 (3.3%) | 3.22 |
| Single Female/Mother | 1,043 (10.1%) | 3.82 |
| Non-family | 2,918 (28.2%) | 1.27 |
| Total Households | 10,343 (100.0%) | 2.63 |
Household Size by Marriage Status in Dawson County
Out of a total of 10,343 households in Dawson County, 7,425 (71.8%) are family households, while 2,918 (28.2%) are nonfamily households. The most numerous type of family households are 2-person households, comprising 3,331, and the most common type of nonfamily households are 1-person households, comprising 2,374.
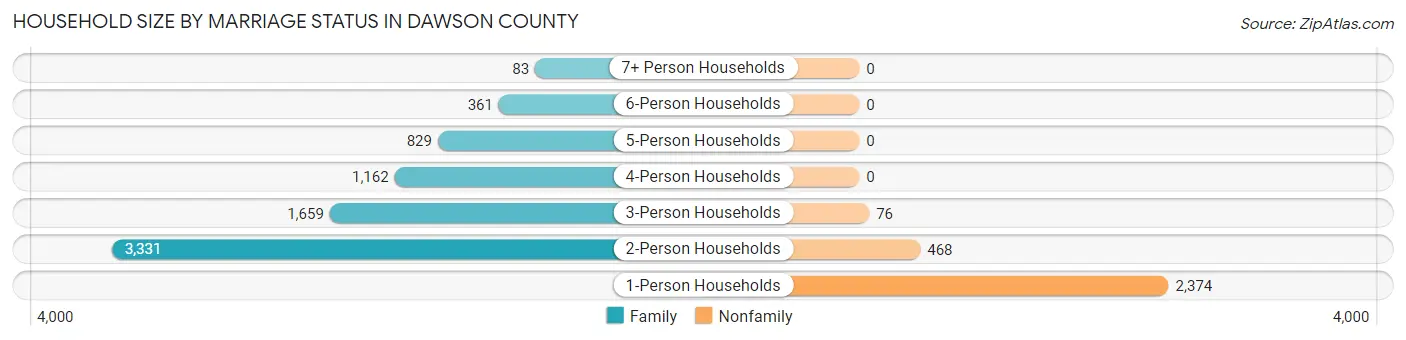
| Household Size | Family Households | Nonfamily Households |
| 1-Person Households | - | 2,374 (23.0%) |
| 2-Person Households | 3,331 (32.2%) | 468 (4.5%) |
| 3-Person Households | 1,659 (16.0%) | 76 (0.7%) |
| 4-Person Households | 1,162 (11.2%) | 0 (0.0%) |
| 5-Person Households | 829 (8.0%) | 0 (0.0%) |
| 6-Person Households | 361 (3.5%) | 0 (0.0%) |
| 7+ Person Households | 83 (0.8%) | 0 (0.0%) |
| Total | 7,425 (71.8%) | 2,918 (28.2%) |
Female Fertility in Dawson County
Fertility by Age in Dawson County
Average fertility rate in Dawson County is 66.0 births per 1,000 women. Women in the age bracket of 20 to 34 years have the highest fertility rate with 113.0 births per 1,000 women. Women in the age bracket of 20 to 34 years acount for 74.2% of all women with births.
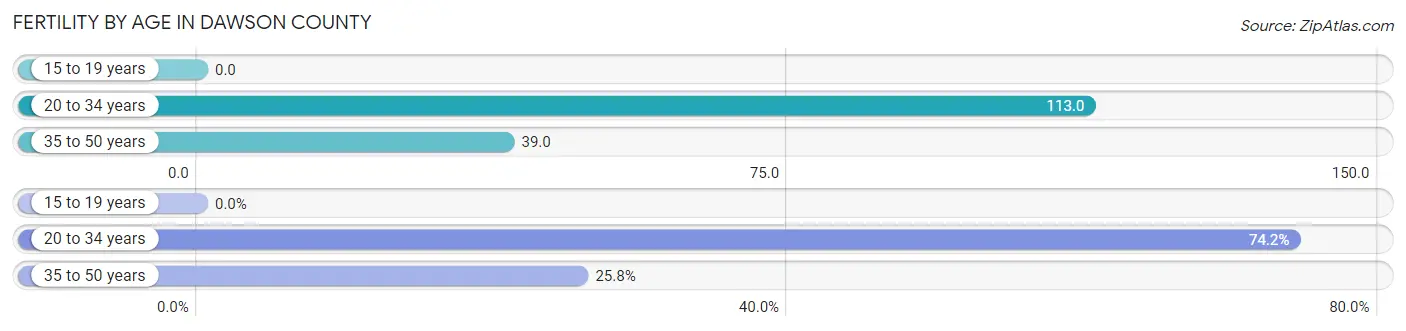
| Age Bracket | Women with Births | Births / 1,000 Women |
| 15 to 19 years | 0 (0.0%) | 0.0 |
| 20 to 34 years | 273 (74.2%) | 113.0 |
| 35 to 50 years | 95 (25.8%) | 39.0 |
| Total | 368 (100.0%) | 66.0 |
Fertility by Age by Marriage Status in Dawson County
81.8% of women with births (368) in Dawson County are married. The highest percentage of unmarried women with births falls into 20 to 34 years age bracket with 24.5% of them unmarried at the time of birth, while the lowest percentage of unmarried women with births belong to 35 to 50 years age bracket with 0.0% of them unmarried.
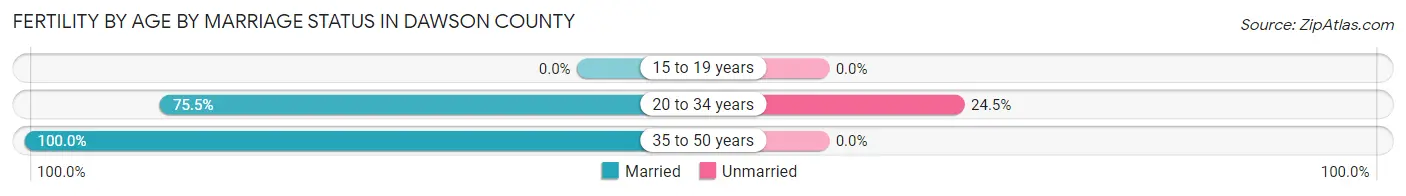
| Age Bracket | Married | Unmarried |
| 15 to 19 years | 0 (0.0%) | 0 (0.0%) |
| 20 to 34 years | 206 (75.5%) | 67 (24.5%) |
| 35 to 50 years | 95 (100.0%) | 0 (0.0%) |
| Total | 301 (81.8%) | 67 (18.2%) |
Fertility by Education in Dawson County
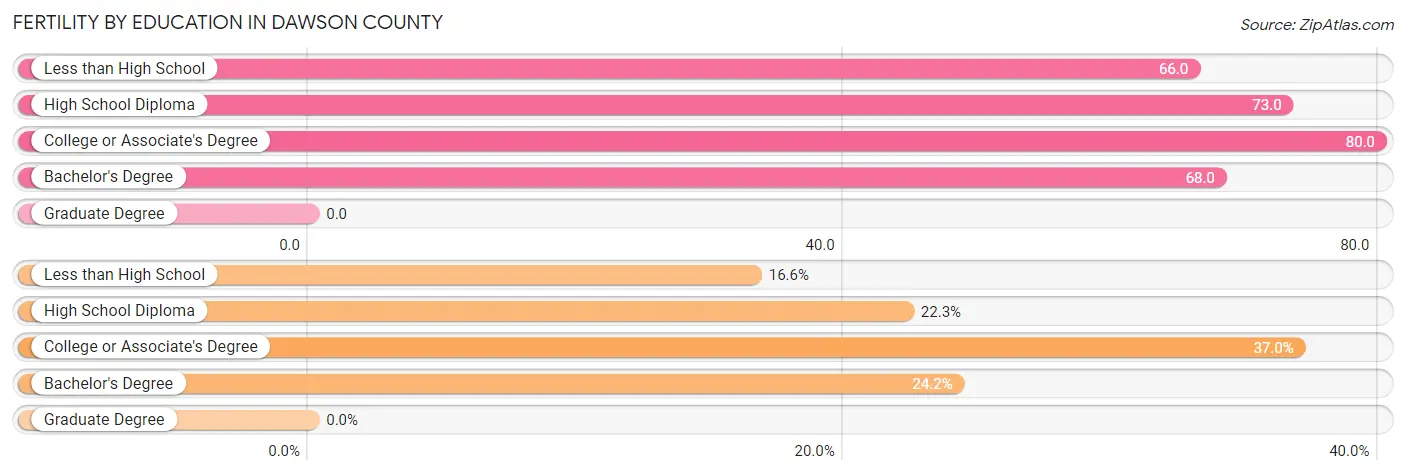
| Educational Attainment | Women with Births | Births / 1,000 Women |
| Less than High School | 61 (16.6%) | 66.0 |
| High School Diploma | 82 (22.3%) | 73.0 |
| College or Associate's Degree | 136 (37.0%) | 80.0 |
| Bachelor's Degree | 89 (24.2%) | 68.0 |
| Graduate Degree | 0 (0.0%) | 0.0 |
| Total | 368 (100.0%) | 66.0 |
Fertility by Education by Marriage Status in Dawson County
18.2% of women with births in Dawson County are unmarried. Women with the educational attainment of high school diploma are most likely to be married with 100.0% of them married at childbirth, while women with the educational attainment of less than high school are least likely to be married with 70.5% of them unmarried at childbirth.
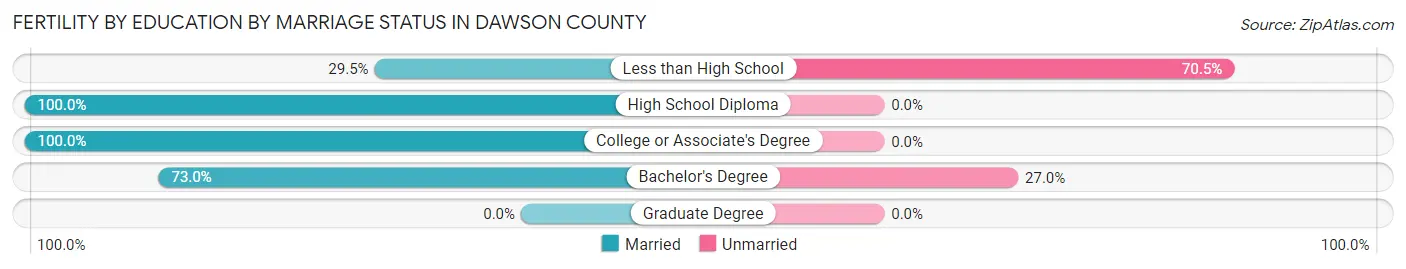
| Educational Attainment | Married | Unmarried |
| Less than High School | 18 (29.5%) | 43 (70.5%) |
| High School Diploma | 82 (100.0%) | 0 (0.0%) |
| College or Associate's Degree | 136 (100.0%) | 0 (0.0%) |
| Bachelor's Degree | 65 (73.0%) | 24 (27.0%) |
| Graduate Degree | 0 (0.0%) | 0 (0.0%) |
| Total | 301 (81.8%) | 67 (18.2%) |
Employment Characteristics in Dawson County
Employment by Class of Employer in Dawson County
Among the 13,367 employed individuals in Dawson County, private company employees (9,215 | 68.9%), local government employees (1,370 | 10.2%), and self-employed (incorporated) (715 | 5.3%) make up the most common classes of employment.
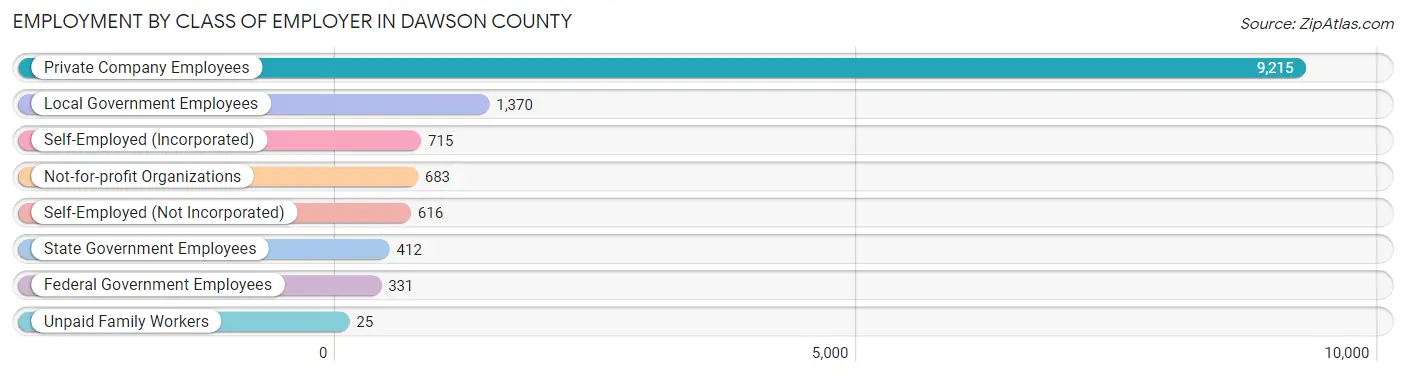
| Employer Class | # Employees | % Employees |
| Private Company Employees | 9,215 | 68.9% |
| Self-Employed (Incorporated) | 715 | 5.3% |
| Self-Employed (Not Incorporated) | 616 | 4.6% |
| Not-for-profit Organizations | 683 | 5.1% |
| Local Government Employees | 1,370 | 10.2% |
| State Government Employees | 412 | 3.1% |
| Federal Government Employees | 331 | 2.5% |
| Unpaid Family Workers | 25 | 0.2% |
| Total | 13,367 | 100.0% |
Employment Status by Age in Dawson County
According to the labor force statistics for Dawson County, out of the total population over 16 years of age (22,687), 63.3% or 14,361 individuals are in the labor force, with 4.6% or 661 of them unemployed. The age group with the highest labor force participation rate is 20 to 24 years, with 89.6% or 1,606 individuals in the labor force. Within the labor force, the 75 years and over age range has the highest percentage of unemployed individuals, with 11.2% or 26 of them being unemployed.
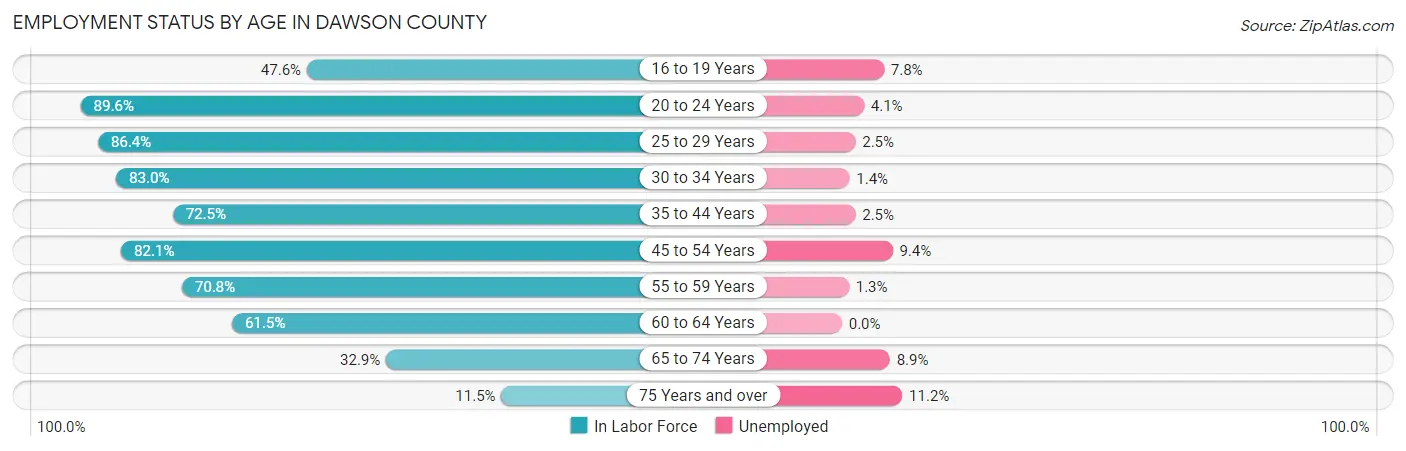
| Age Bracket | In Labor Force | Unemployed |
| 16 to 19 Years | 626 (47.6%) | 49 (7.8%) |
| 20 to 24 Years | 1,606 (89.6%) | 66 (4.1%) |
| 25 to 29 Years | 1,429 (86.4%) | 36 (2.5%) |
| 30 to 34 Years | 1,331 (83.0%) | 19 (1.4%) |
| 35 to 44 Years | 2,194 (72.5%) | 55 (2.5%) |
| 45 to 54 Years | 3,203 (82.1%) | 301 (9.4%) |
| 55 to 59 Years | 1,226 (70.8%) | 16 (1.3%) |
| 60 to 64 Years | 1,392 (61.5%) | 0 (0.0%) |
| 65 to 74 Years | 1,114 (32.9%) | 99 (8.9%) |
| 75 Years and over | 232 (11.5%) | 26 (11.2%) |
| Total | 14,361 (63.3%) | 661 (4.6%) |
Employment Status by Educational Attainment in Dawson County
According to labor force statistics for Dawson County, 76.0% of individuals (10,776) out of the total population between 25 and 64 years of age (14,179) are in the labor force, with 4.0% or 431 of them being unemployed. The group with the highest labor force participation rate are those with the educational attainment of bachelor's degree or higher, with 85.7% or 4,354 individuals in the labor force. Within the labor force, individuals with less than high school education have the highest percentage of unemployment, with 6.9% or 62 of them being unemployed.
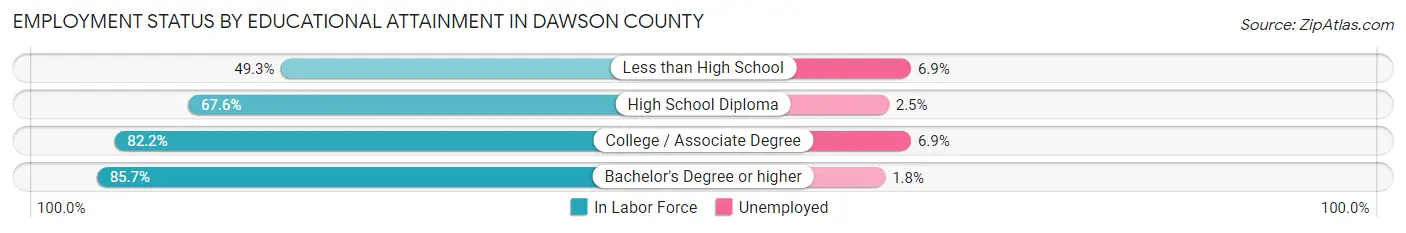
| Educational Attainment | In Labor Force | Unemployed |
| Less than High School | 894 (49.3%) | 125 (6.9%) |
| High School Diploma | 2,158 (67.6%) | 80 (2.5%) |
| College / Associate Degree | 3,364 (82.2%) | 282 (6.9%) |
| Bachelor's Degree or higher | 4,354 (85.7%) | 91 (1.8%) |
| Total | 10,776 (76.0%) | 567 (4.0%) |
Employment Occupations by Sex in Dawson County
Management, Business, Science and Arts Occupations
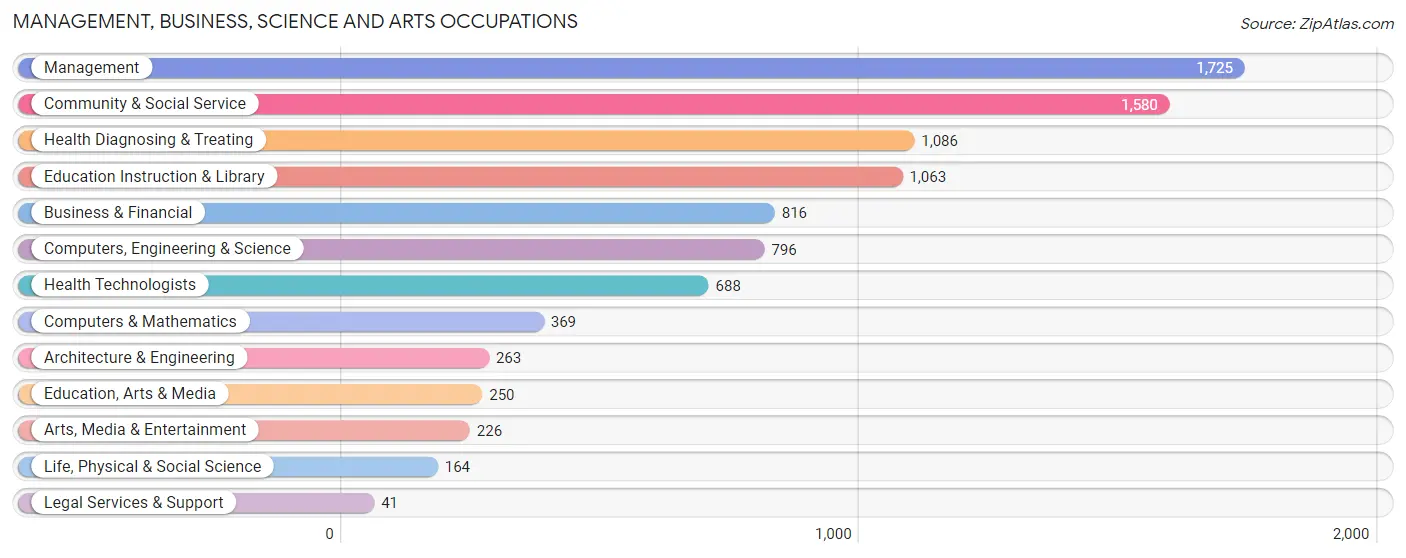
The most common Management, Business, Science and Arts occupations in Dawson County are Management (1,725 | 12.7%), Community & Social Service (1,580 | 11.6%), Health Diagnosing & Treating (1,086 | 8.0%), Education Instruction & Library (1,063 | 7.8%), and Business & Financial (816 | 6.0%).
Management, Business, Science and Arts Occupations by Sex
Within the Management, Business, Science and Arts occupations in Dawson County, the most male-oriented occupations are Architecture & Engineering (81.8%), Computers, Engineering & Science (72.2%), and Computers & Mathematics (71.3%), while the most female-oriented occupations are Legal Services & Support (100.0%), Education Instruction & Library (80.6%), and Community & Social Service (74.6%).
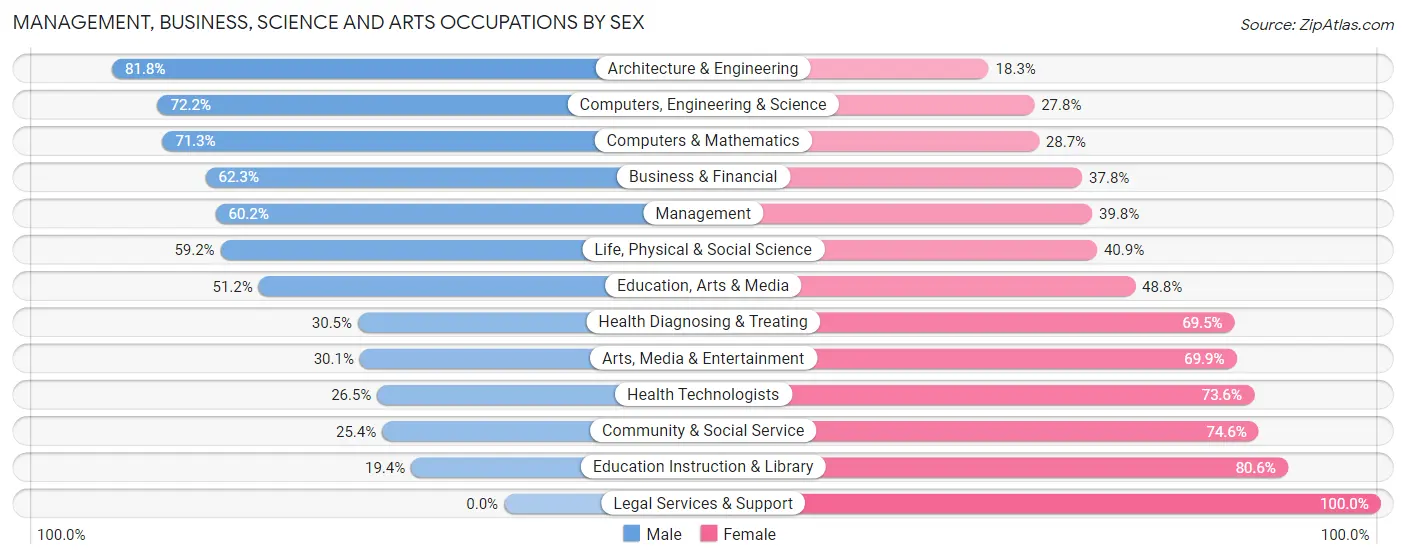
| Occupation | Male | Female |
| Management | 1,038 (60.2%) | 687 (39.8%) |
| Business & Financial | 508 (62.3%) | 308 (37.8%) |
| Computers, Engineering & Science | 575 (72.2%) | 221 (27.8%) |
| Computers & Mathematics | 263 (71.3%) | 106 (28.7%) |
| Architecture & Engineering | 215 (81.8%) | 48 (18.2%) |
| Life, Physical & Social Science | 97 (59.2%) | 67 (40.8%) |
| Community & Social Service | 402 (25.4%) | 1,178 (74.6%) |
| Education, Arts & Media | 128 (51.2%) | 122 (48.8%) |
| Legal Services & Support | 0 (0.0%) | 41 (100.0%) |
| Education Instruction & Library | 206 (19.4%) | 857 (80.6%) |
| Arts, Media & Entertainment | 68 (30.1%) | 158 (69.9%) |
| Health Diagnosing & Treating | 331 (30.5%) | 755 (69.5%) |
| Health Technologists | 182 (26.5%) | 506 (73.6%) |
| Total (Category) | 2,854 (47.5%) | 3,149 (52.5%) |
| Total (Overall) | 7,554 (55.5%) | 6,050 (44.5%) |
Services Occupations
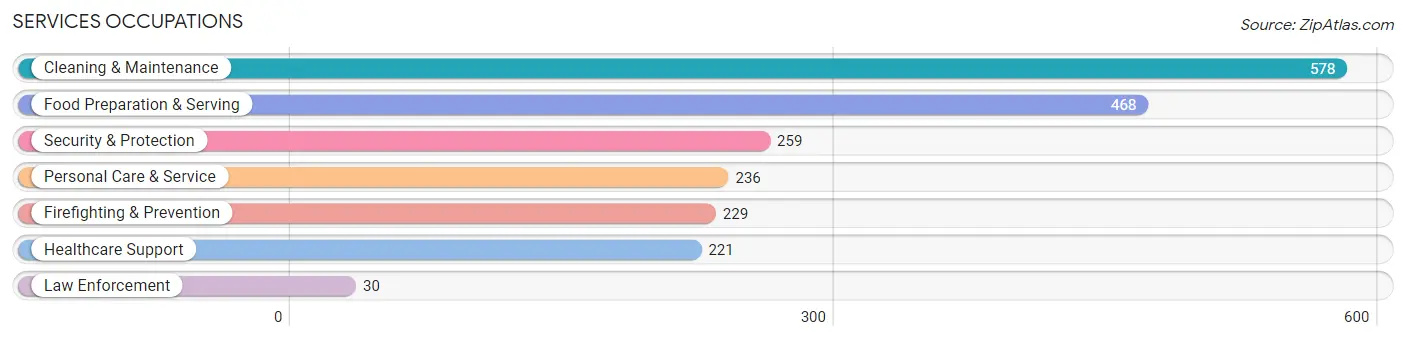
The most common Services occupations in Dawson County are Cleaning & Maintenance (578 | 4.3%), Food Preparation & Serving (468 | 3.4%), Security & Protection (259 | 1.9%), Personal Care & Service (236 | 1.7%), and Firefighting & Prevention (229 | 1.7%).
Services Occupations by Sex
Within the Services occupations in Dawson County, the most male-oriented occupations are Law Enforcement (100.0%), Security & Protection (90.3%), and Firefighting & Prevention (89.1%), while the most female-oriented occupations are Healthcare Support (96.8%), Personal Care & Service (72.9%), and Food Preparation & Serving (42.7%).
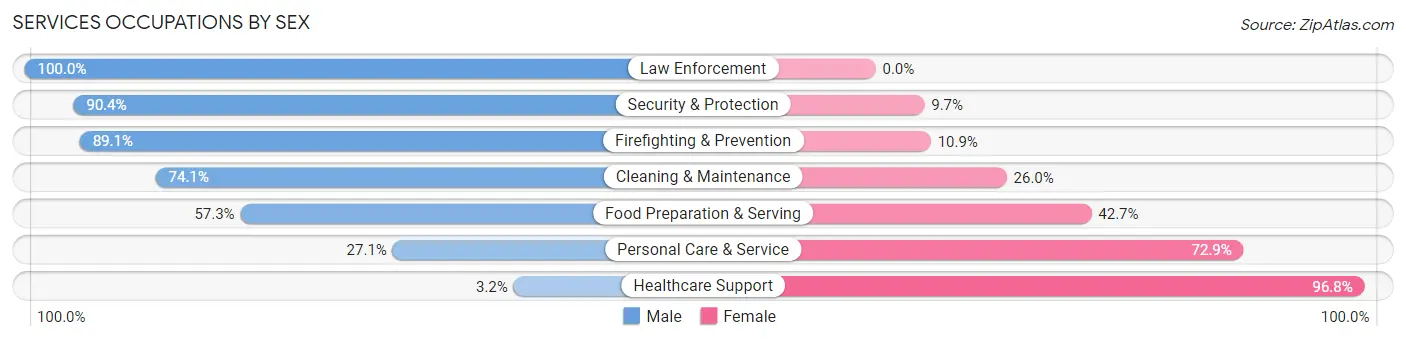
| Occupation | Male | Female |
| Healthcare Support | 7 (3.2%) | 214 (96.8%) |
| Security & Protection | 234 (90.3%) | 25 (9.7%) |
| Firefighting & Prevention | 204 (89.1%) | 25 (10.9%) |
| Law Enforcement | 30 (100.0%) | 0 (0.0%) |
| Food Preparation & Serving | 268 (57.3%) | 200 (42.7%) |
| Cleaning & Maintenance | 428 (74.1%) | 150 (26.0%) |
| Personal Care & Service | 64 (27.1%) | 172 (72.9%) |
| Total (Category) | 1,001 (56.8%) | 761 (43.2%) |
| Total (Overall) | 7,554 (55.5%) | 6,050 (44.5%) |
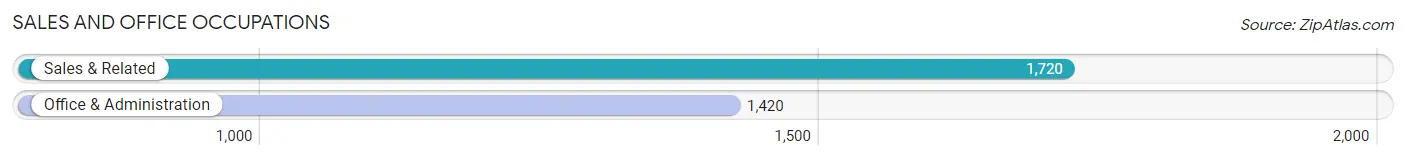
Sales and Office Occupations
The most common Sales and Office occupations in Dawson County are Sales & Related (1,720 | 12.6%), and Office & Administration (1,420 | 10.4%).
Sales and Office Occupations by Sex
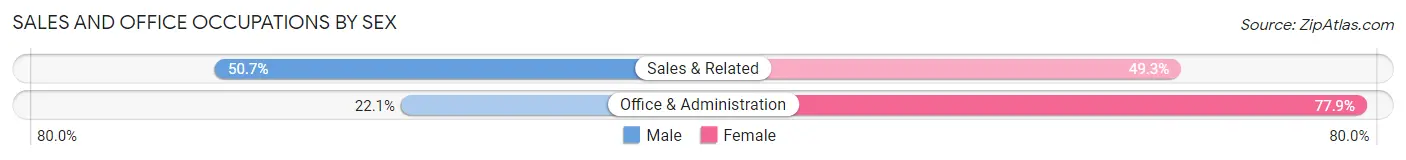
| Occupation | Male | Female |
| Sales & Related | 872 (50.7%) | 848 (49.3%) |
| Office & Administration | 314 (22.1%) | 1,106 (77.9%) |
| Total (Category) | 1,186 (37.8%) | 1,954 (62.2%) |
| Total (Overall) | 7,554 (55.5%) | 6,050 (44.5%) |
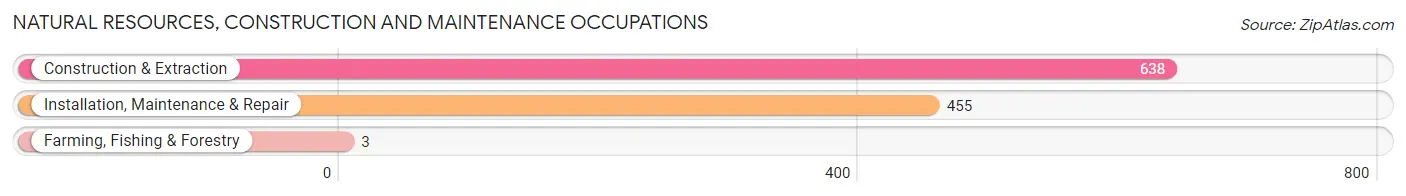
Natural Resources, Construction and Maintenance Occupations
The most common Natural Resources, Construction and Maintenance occupations in Dawson County are Construction & Extraction (638 | 4.7%), Installation, Maintenance & Repair (455 | 3.3%), and Farming, Fishing & Forestry (3 | 0.0%).
Natural Resources, Construction and Maintenance Occupations by Sex
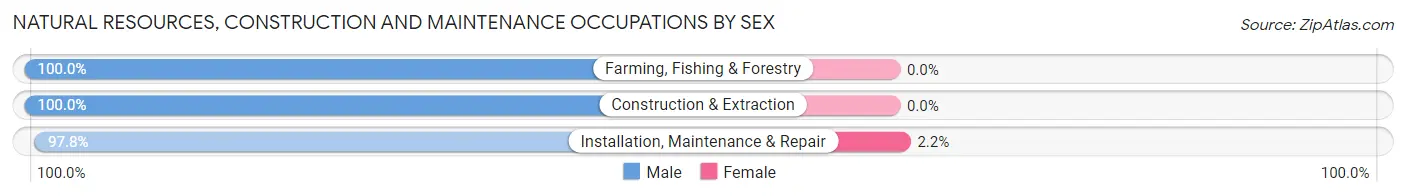
| Occupation | Male | Female |
| Farming, Fishing & Forestry | 3 (100.0%) | 0 (0.0%) |
| Construction & Extraction | 638 (100.0%) | 0 (0.0%) |
| Installation, Maintenance & Repair | 445 (97.8%) | 10 (2.2%) |
| Total (Category) | 1,086 (99.1%) | 10 (0.9%) |
| Total (Overall) | 7,554 (55.5%) | 6,050 (44.5%) |
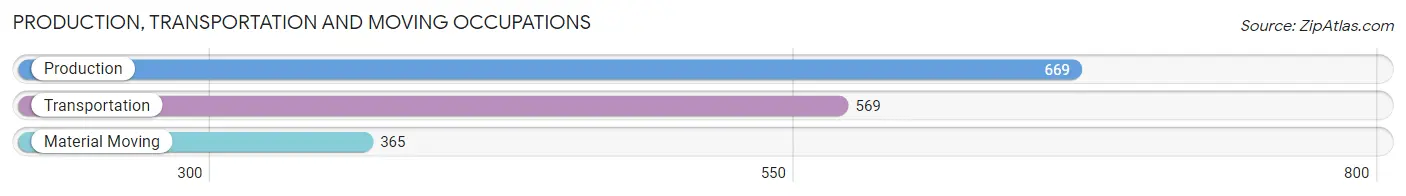
Production, Transportation and Moving Occupations
The most common Production, Transportation and Moving occupations in Dawson County are Production (669 | 4.9%), Transportation (569 | 4.2%), and Material Moving (365 | 2.7%).
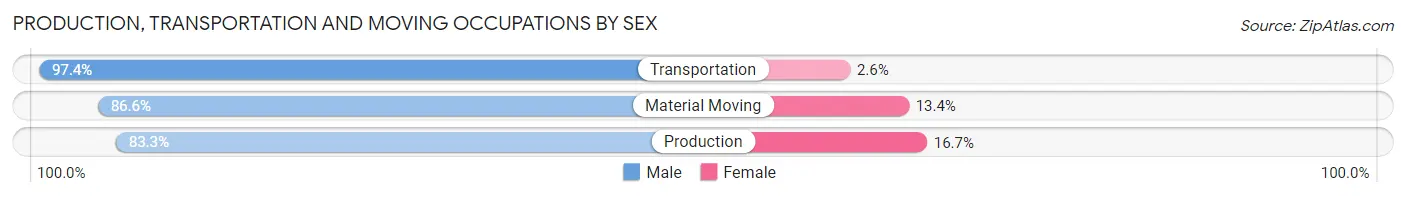
Production, Transportation and Moving Occupations by Sex
| Occupation | Male | Female |
| Production | 557 (83.3%) | 112 (16.7%) |
| Transportation | 554 (97.4%) | 15 (2.6%) |
| Material Moving | 316 (86.6%) | 49 (13.4%) |
| Total (Category) | 1,427 (89.0%) | 176 (11.0%) |
| Total (Overall) | 7,554 (55.5%) | 6,050 (44.5%) |
Employment Industries by Sex in Dawson County
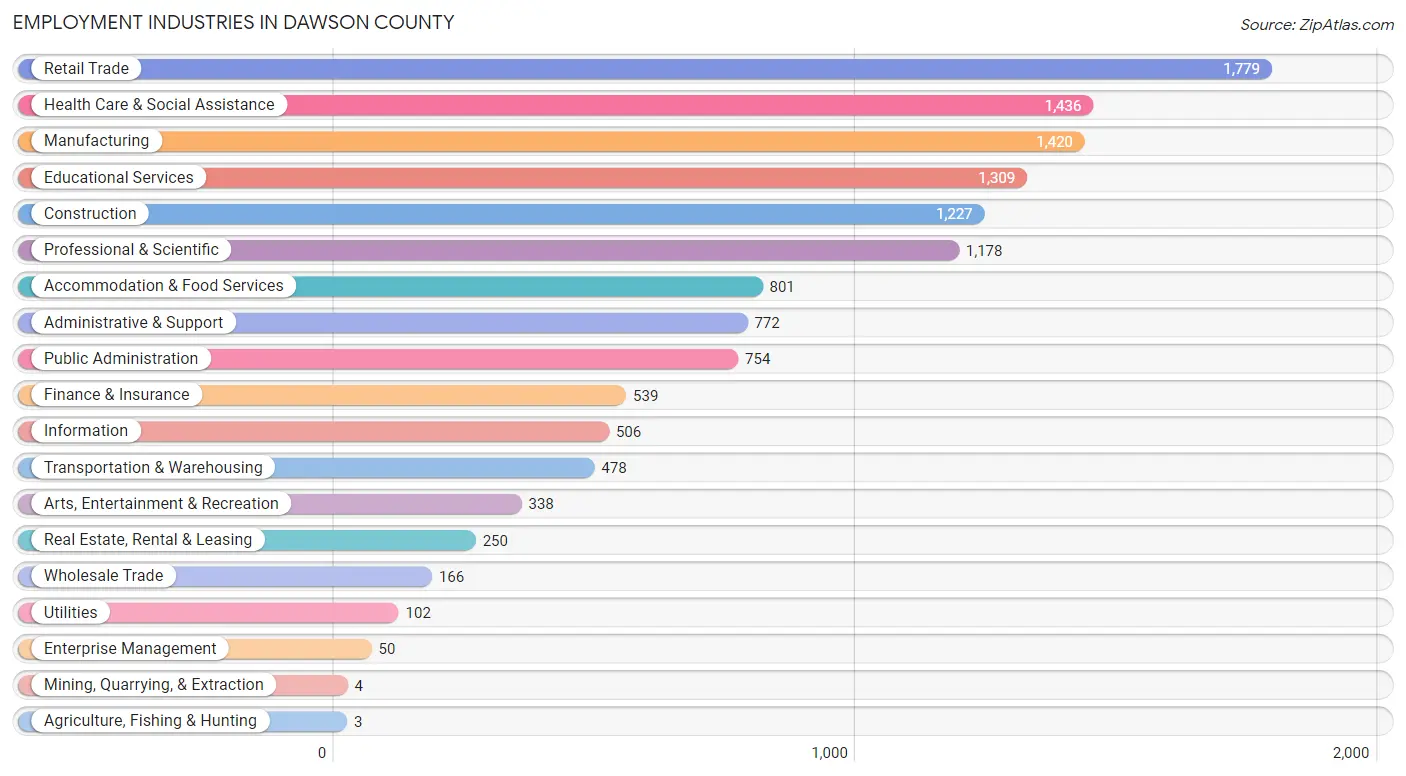
Employment Industries in Dawson County
The major employment industries in Dawson County include Retail Trade (1,779 | 13.1%), Health Care & Social Assistance (1,436 | 10.6%), Manufacturing (1,420 | 10.4%), Educational Services (1,309 | 9.6%), and Construction (1,227 | 9.0%).
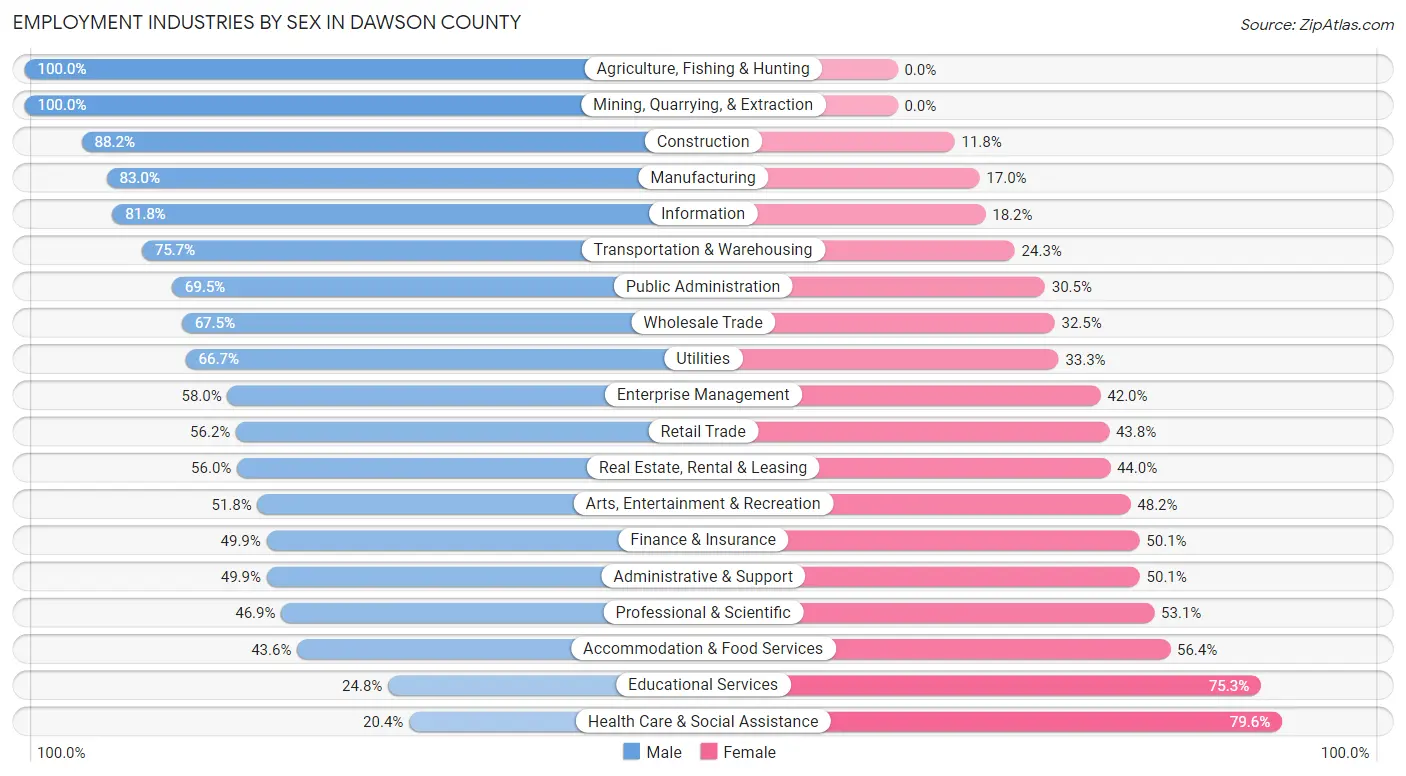
Employment Industries by Sex in Dawson County
The Dawson County industries that see more men than women are Agriculture, Fishing & Hunting (100.0%), Mining, Quarrying, & Extraction (100.0%), and Construction (88.2%), whereas the industries that tend to have a higher number of women are Health Care & Social Assistance (79.6%), Educational Services (75.2%), and Accommodation & Food Services (56.4%).
| Industry | Male | Female |
| Agriculture, Fishing & Hunting | 3 (100.0%) | 0 (0.0%) |
| Mining, Quarrying, & Extraction | 4 (100.0%) | 0 (0.0%) |
| Construction | 1,082 (88.2%) | 145 (11.8%) |
| Manufacturing | 1,179 (83.0%) | 241 (17.0%) |
| Wholesale Trade | 112 (67.5%) | 54 (32.5%) |
| Retail Trade | 1,000 (56.2%) | 779 (43.8%) |
| Transportation & Warehousing | 362 (75.7%) | 116 (24.3%) |
| Utilities | 68 (66.7%) | 34 (33.3%) |
| Information | 414 (81.8%) | 92 (18.2%) |
| Finance & Insurance | 269 (49.9%) | 270 (50.1%) |
| Real Estate, Rental & Leasing | 140 (56.0%) | 110 (44.0%) |
| Professional & Scientific | 552 (46.9%) | 626 (53.1%) |
| Enterprise Management | 29 (58.0%) | 21 (42.0%) |
| Administrative & Support | 385 (49.9%) | 387 (50.1%) |
| Educational Services | 324 (24.7%) | 985 (75.2%) |
| Health Care & Social Assistance | 293 (20.4%) | 1,143 (79.6%) |
| Arts, Entertainment & Recreation | 175 (51.8%) | 163 (48.2%) |
| Accommodation & Food Services | 349 (43.6%) | 452 (56.4%) |
| Public Administration | 524 (69.5%) | 230 (30.5%) |
| Total | 7,554 (55.5%) | 6,050 (44.5%) |
Education in Dawson County
School Enrollment in Dawson County
The most common levels of schooling among the 5,925 students in Dawson County are high school (1,378 | 23.3%), middle school (1,278 | 21.6%), and college / undergraduate (1,196 | 20.2%).
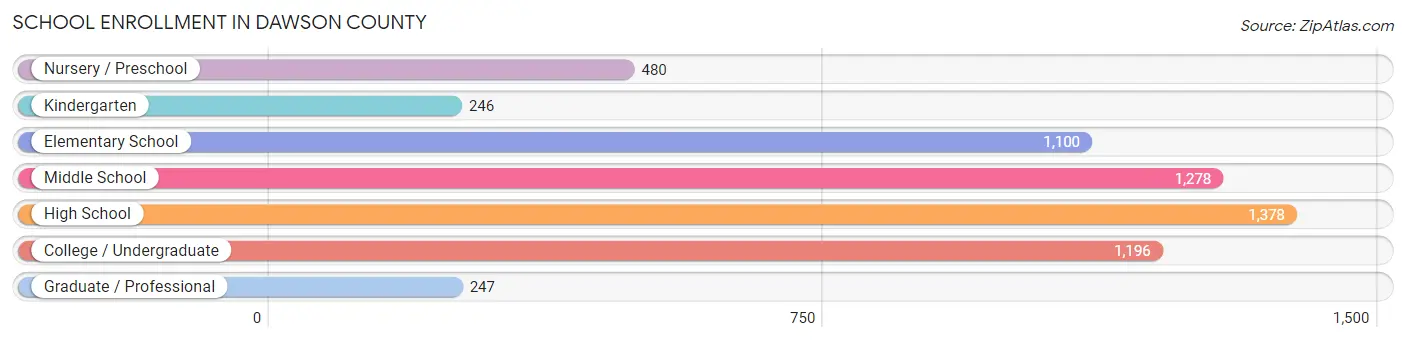
| School Level | # Students | % Students |
| Nursery / Preschool | 480 | 8.1% |
| Kindergarten | 246 | 4.2% |
| Elementary School | 1,100 | 18.6% |
| Middle School | 1,278 | 21.6% |
| High School | 1,378 | 23.3% |
| College / Undergraduate | 1,196 | 20.2% |
| Graduate / Professional | 247 | 4.2% |
| Total | 5,925 | 100.0% |
School Enrollment by Age by Funding Source in Dawson County
Out of a total of 5,925 students who are enrolled in schools in Dawson County, 1,090 (18.4%) attend a private institution, while the remaining 4,835 (81.6%) are enrolled in public schools. The age group of 3 to 4 year olds has the highest likelihood of being enrolled in private schools, with 148 (51.2% in the age bracket) enrolled. Conversely, the age group of 20 to 24 year olds has the lowest likelihood of being enrolled in a private school, with 453 (96.6% in the age bracket) attending a public institution.
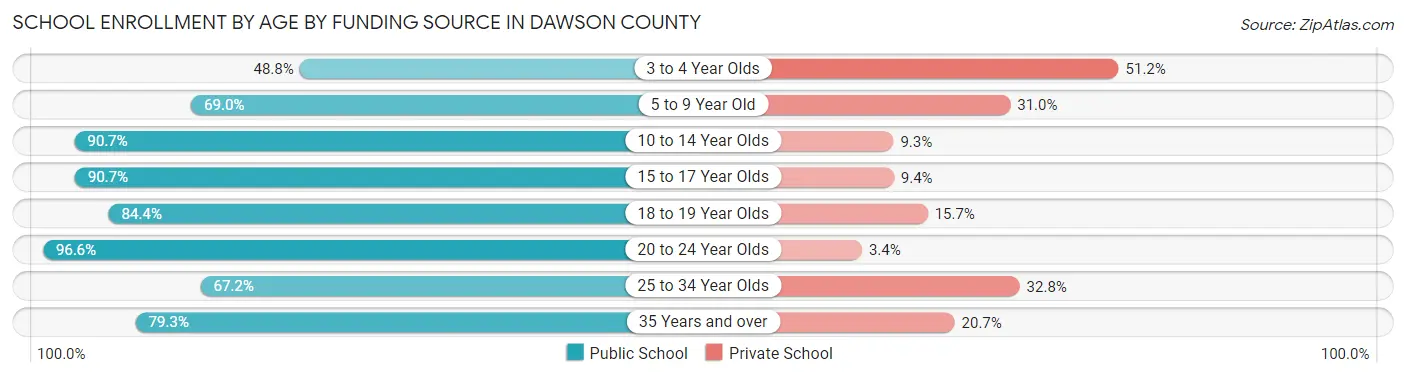
| Age Bracket | Public School | Private School |
| 3 to 4 Year Olds | 141 (48.8%) | 148 (51.2%) |
| 5 to 9 Year Old | 958 (69.0%) | 431 (31.0%) |
| 10 to 14 Year Olds | 1,477 (90.7%) | 151 (9.3%) |
| 15 to 17 Year Olds | 979 (90.6%) | 101 (9.3%) |
| 18 to 19 Year Olds | 264 (84.4%) | 49 (15.7%) |
| 20 to 24 Year Olds | 453 (96.6%) | 16 (3.4%) |
| 25 to 34 Year Olds | 203 (67.2%) | 99 (32.8%) |
| 35 Years and over | 361 (79.3%) | 94 (20.7%) |
| Total | 4,835 (81.6%) | 1,090 (18.4%) |
Educational Attainment by Field of Study in Dawson County
Business (1,713 | 23.2%), education (1,132 | 15.4%), science & technology (966 | 13.1%), arts & humanities (690 | 9.4%), and engineering (420 | 5.7%) are the most common fields of study among 7,370 individuals in Dawson County who have obtained a bachelor's degree or higher.
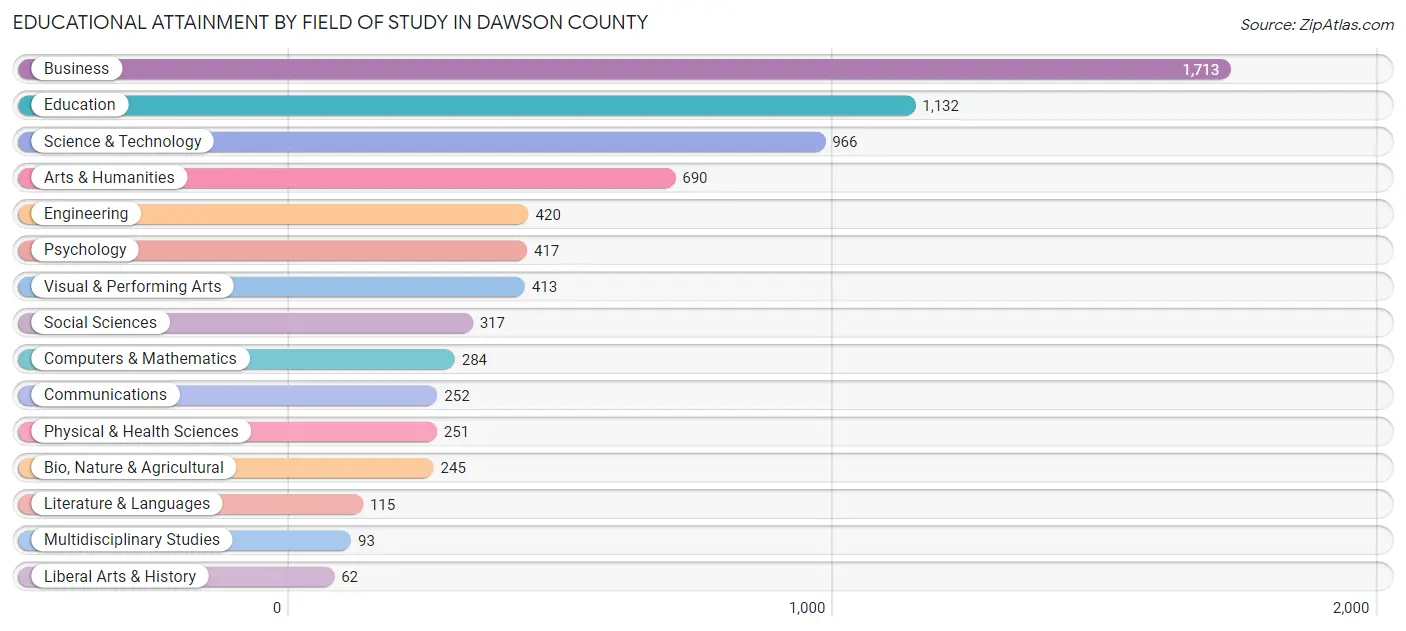
| Field of Study | # Graduates | % Graduates |
| Computers & Mathematics | 284 | 3.8% |
| Bio, Nature & Agricultural | 245 | 3.3% |
| Physical & Health Sciences | 251 | 3.4% |
| Psychology | 417 | 5.7% |
| Social Sciences | 317 | 4.3% |
| Engineering | 420 | 5.7% |
| Multidisciplinary Studies | 93 | 1.3% |
| Science & Technology | 966 | 13.1% |
| Business | 1,713 | 23.2% |
| Education | 1,132 | 15.4% |
| Literature & Languages | 115 | 1.6% |
| Liberal Arts & History | 62 | 0.8% |
| Visual & Performing Arts | 413 | 5.6% |
| Communications | 252 | 3.4% |
| Arts & Humanities | 690 | 9.4% |
| Total | 7,370 | 100.0% |
Transportation & Commute in Dawson County
Vehicle Availability by Sex in Dawson County
The most prevalent vehicle ownership categories in Dawson County are males with 2 vehicles (2,857, accounting for 38.2%) and females with 2 vehicles (2,202, making up 48.6%).
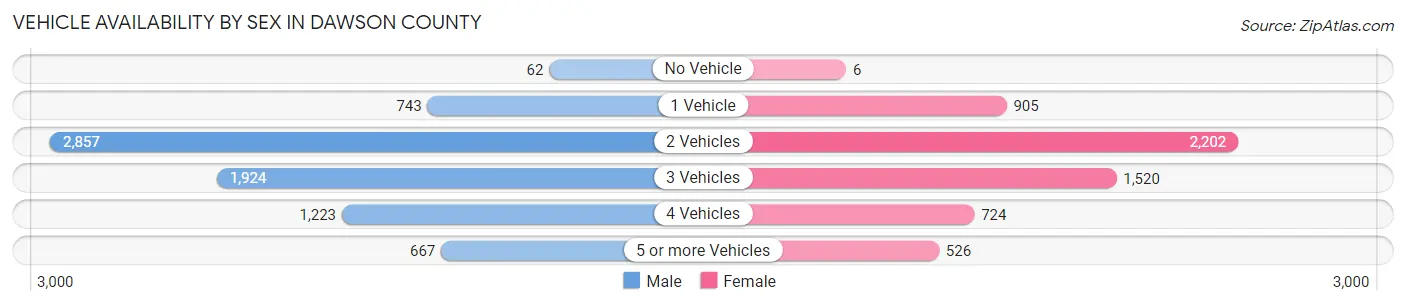
| Vehicles Available | Male | Female |
| No Vehicle | 62 (0.8%) | 6 (0.1%) |
| 1 Vehicle | 743 (9.9%) | 905 (15.4%) |
| 2 Vehicles | 2,857 (38.2%) | 2,202 (37.4%) |
| 3 Vehicles | 1,924 (25.7%) | 1,520 (25.8%) |
| 4 Vehicles | 1,223 (16.4%) | 724 (12.3%) |
| 5 or more Vehicles | 667 (8.9%) | 526 (8.9%) |
| Total | 7,476 (100.0%) | 5,883 (100.0%) |
Commute Time in Dawson County
The most frequently occuring commute durations in Dawson County are 45 to 59 minutes (1,777 commuters, 15.4%), 30 to 34 minutes (1,512 commuters, 13.1%), and 5 to 9 minutes (1,215 commuters, 10.5%).
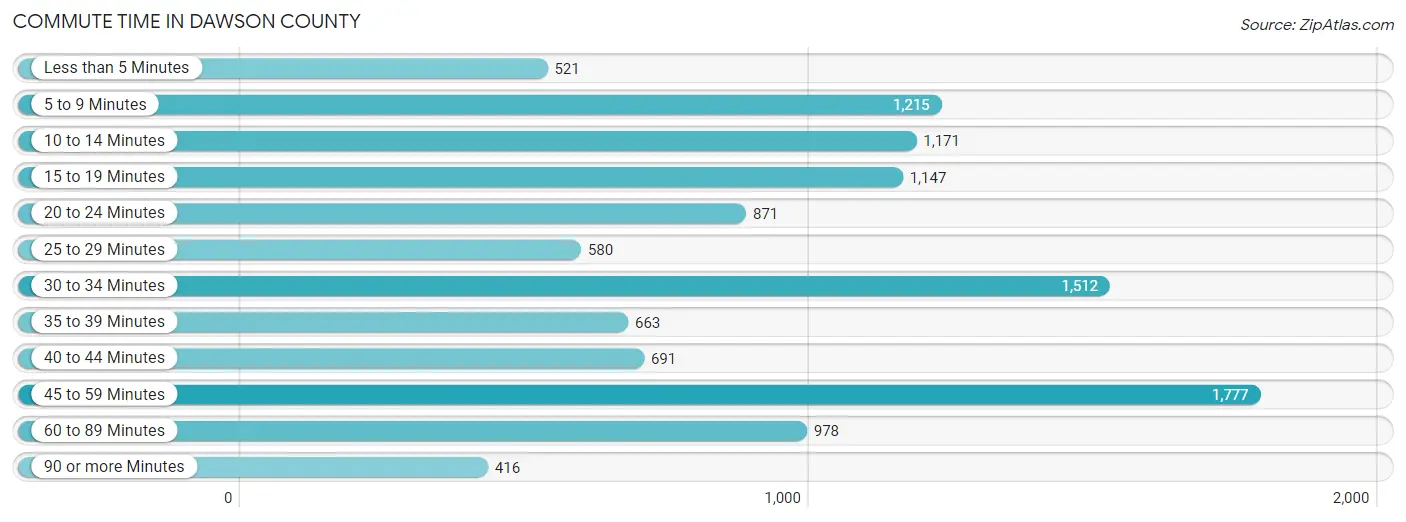
| Commute Time | # Commuters | % Commuters |
| Less than 5 Minutes | 521 | 4.5% |
| 5 to 9 Minutes | 1,215 | 10.5% |
| 10 to 14 Minutes | 1,171 | 10.2% |
| 15 to 19 Minutes | 1,147 | 9.9% |
| 20 to 24 Minutes | 871 | 7.5% |
| 25 to 29 Minutes | 580 | 5.0% |
| 30 to 34 Minutes | 1,512 | 13.1% |
| 35 to 39 Minutes | 663 | 5.7% |
| 40 to 44 Minutes | 691 | 6.0% |
| 45 to 59 Minutes | 1,777 | 15.4% |
| 60 to 89 Minutes | 978 | 8.5% |
| 90 or more Minutes | 416 | 3.6% |
Commute Time by Sex in Dawson County
The most common commute times in Dawson County are 45 to 59 minutes (1,257 commuters, 19.5%) for males and 5 to 9 minutes (745 commuters, 14.6%) for females.
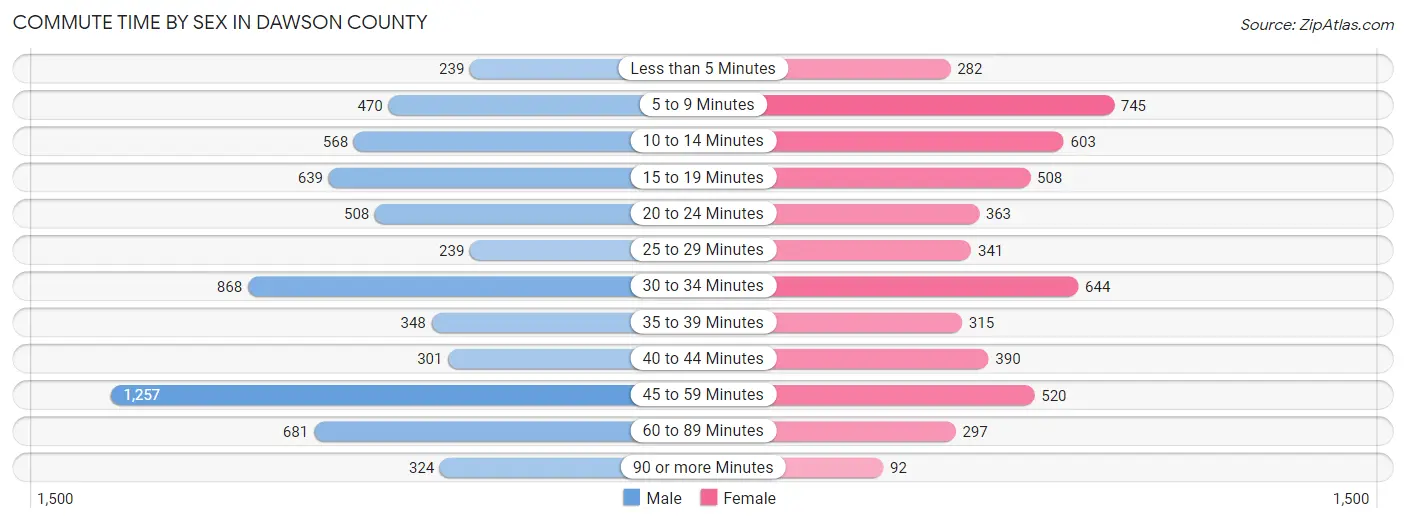
| Commute Time | Male | Female |
| Less than 5 Minutes | 239 (3.7%) | 282 (5.5%) |
| 5 to 9 Minutes | 470 (7.3%) | 745 (14.6%) |
| 10 to 14 Minutes | 568 (8.8%) | 603 (11.8%) |
| 15 to 19 Minutes | 639 (9.9%) | 508 (10.0%) |
| 20 to 24 Minutes | 508 (7.9%) | 363 (7.1%) |
| 25 to 29 Minutes | 239 (3.7%) | 341 (6.7%) |
| 30 to 34 Minutes | 868 (13.5%) | 644 (12.6%) |
| 35 to 39 Minutes | 348 (5.4%) | 315 (6.2%) |
| 40 to 44 Minutes | 301 (4.7%) | 390 (7.6%) |
| 45 to 59 Minutes | 1,257 (19.5%) | 520 (10.2%) |
| 60 to 89 Minutes | 681 (10.6%) | 297 (5.8%) |
| 90 or more Minutes | 324 (5.0%) | 92 (1.8%) |
Time of Departure to Work by Sex in Dawson County
The most frequent times of departure to work in Dawson County are 6:00 AM to 6:29 AM (1,322, 20.5%) for males and 6:30 AM to 6:59 AM (864, 16.9%) for females.
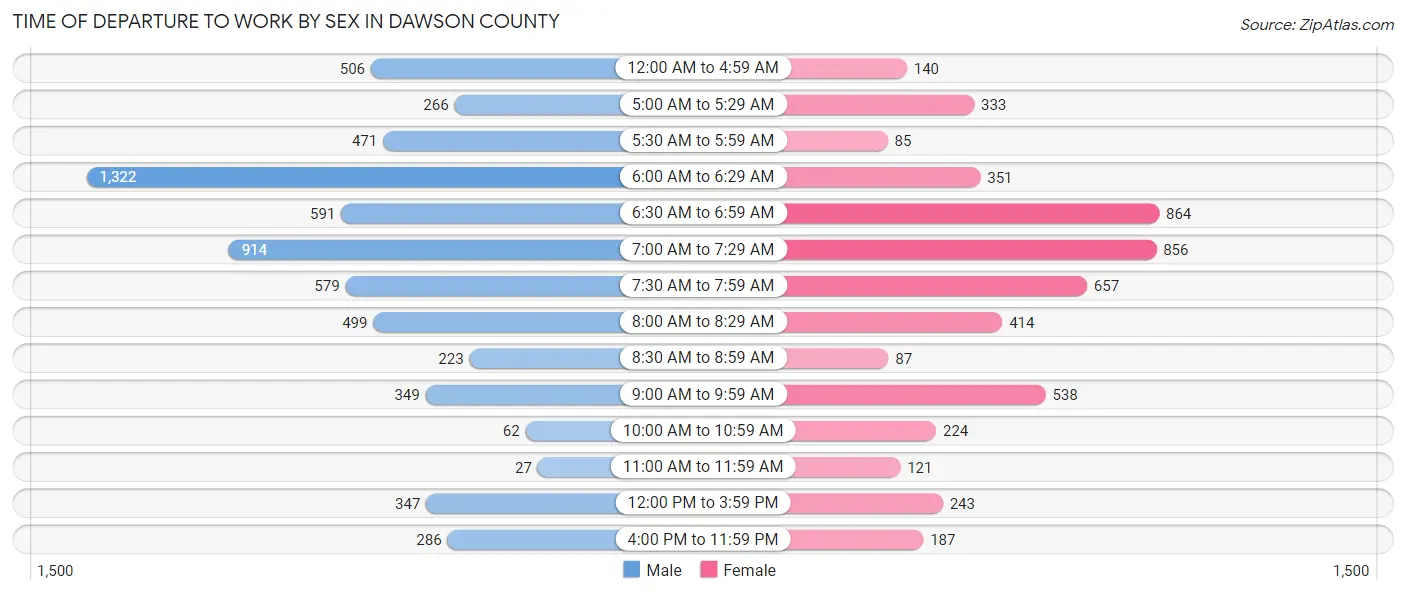
| Time of Departure | Male | Female |
| 12:00 AM to 4:59 AM | 506 (7.9%) | 140 (2.8%) |
| 5:00 AM to 5:29 AM | 266 (4.1%) | 333 (6.5%) |
| 5:30 AM to 5:59 AM | 471 (7.3%) | 85 (1.7%) |
| 6:00 AM to 6:29 AM | 1,322 (20.5%) | 351 (6.9%) |
| 6:30 AM to 6:59 AM | 591 (9.2%) | 864 (16.9%) |
| 7:00 AM to 7:29 AM | 914 (14.2%) | 856 (16.8%) |
| 7:30 AM to 7:59 AM | 579 (9.0%) | 657 (12.9%) |
| 8:00 AM to 8:29 AM | 499 (7.7%) | 414 (8.1%) |
| 8:30 AM to 8:59 AM | 223 (3.5%) | 87 (1.7%) |
| 9:00 AM to 9:59 AM | 349 (5.4%) | 538 (10.5%) |
| 10:00 AM to 10:59 AM | 62 (1.0%) | 224 (4.4%) |
| 11:00 AM to 11:59 AM | 27 (0.4%) | 121 (2.4%) |
| 12:00 PM to 3:59 PM | 347 (5.4%) | 243 (4.8%) |
| 4:00 PM to 11:59 PM | 286 (4.4%) | 187 (3.7%) |
| Total | 6,442 (100.0%) | 5,100 (100.0%) |
Housing Occupancy in Dawson County
Occupancy by Ownership in Dawson County
Of the total 10,343 dwellings in Dawson County, owner-occupied units account for 8,295 (80.2%), while renter-occupied units make up 2,048 (19.8%).
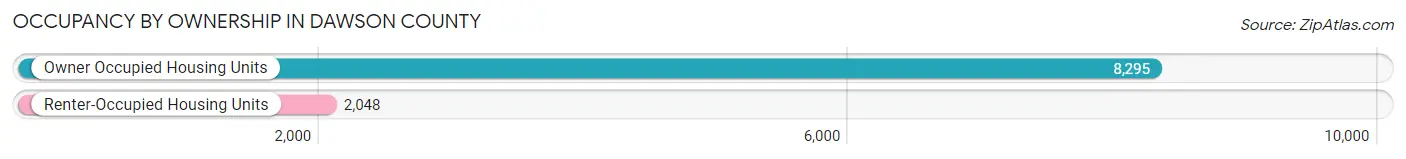
| Occupancy | # Housing Units | % Housing Units |
| Owner Occupied Housing Units | 8,295 | 80.2% |
| Renter-Occupied Housing Units | 2,048 | 19.8% |
| Total Occupied Housing Units | 10,343 | 100.0% |
Occupancy by Household Size in Dawson County
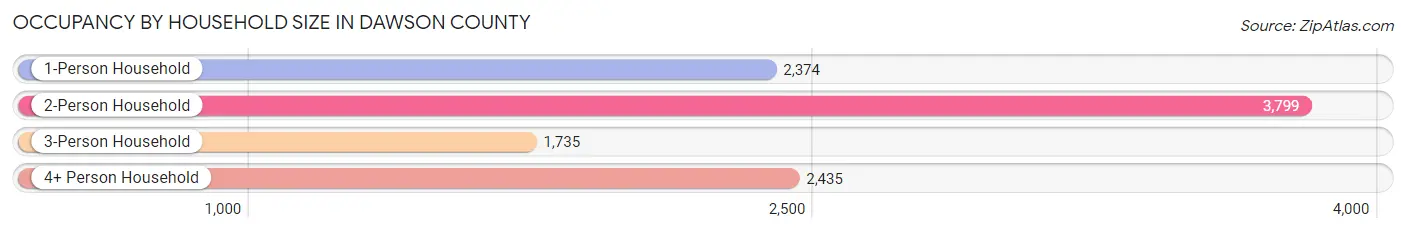
| Household Size | # Housing Units | % Housing Units |
| 1-Person Household | 2,374 | 23.0% |
| 2-Person Household | 3,799 | 36.7% |
| 3-Person Household | 1,735 | 16.8% |
| 4+ Person Household | 2,435 | 23.5% |
| Total Housing Units | 10,343 | 100.0% |
Occupancy by Ownership by Household Size in Dawson County
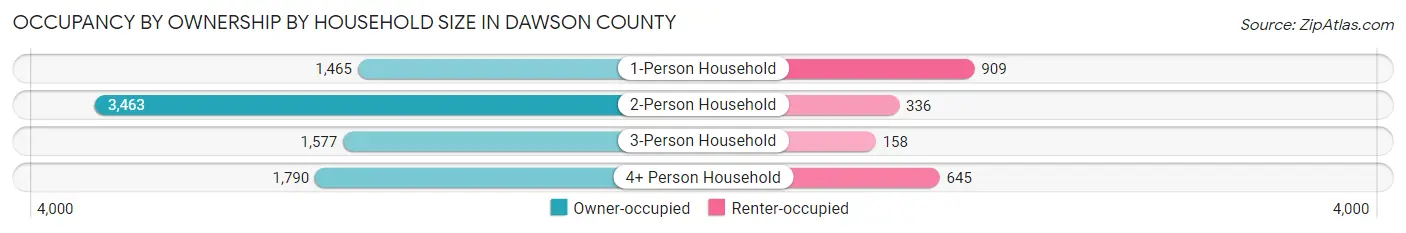
| Household Size | Owner-occupied | Renter-occupied |
| 1-Person Household | 1,465 (61.7%) | 909 (38.3%) |
| 2-Person Household | 3,463 (91.2%) | 336 (8.8%) |
| 3-Person Household | 1,577 (90.9%) | 158 (9.1%) |
| 4+ Person Household | 1,790 (73.5%) | 645 (26.5%) |
| Total Housing Units | 8,295 (80.2%) | 2,048 (19.8%) |
Occupancy by Educational Attainment in Dawson County
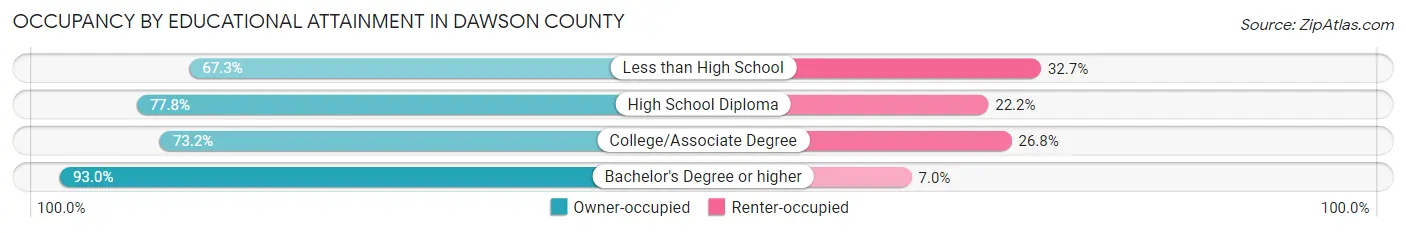
| Household Size | Owner-occupied | Renter-occupied |
| Less than High School | 826 (67.3%) | 401 (32.7%) |
| High School Diploma | 1,522 (77.8%) | 435 (22.2%) |
| College/Associate Degree | 2,620 (73.2%) | 961 (26.8%) |
| Bachelor's Degree or higher | 3,327 (93.0%) | 251 (7.0%) |
Occupancy by Age of Householder in Dawson County
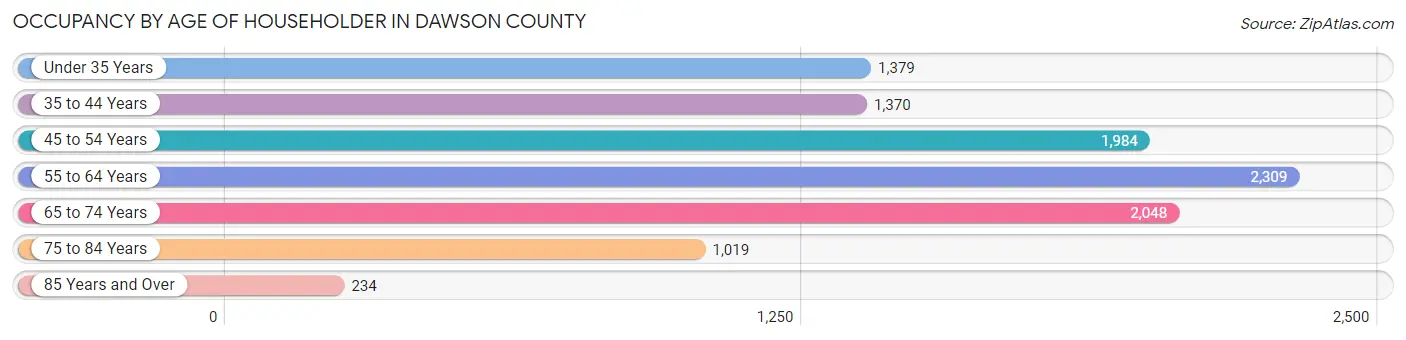
| Age Bracket | # Households | % Households |
| Under 35 Years | 1,379 | 13.3% |
| 35 to 44 Years | 1,370 | 13.3% |
| 45 to 54 Years | 1,984 | 19.2% |
| 55 to 64 Years | 2,309 | 22.3% |
| 65 to 74 Years | 2,048 | 19.8% |
| 75 to 84 Years | 1,019 | 9.9% |
| 85 Years and Over | 234 | 2.3% |
| Total | 10,343 | 100.0% |
Housing Finances in Dawson County
Median Income by Occupancy in Dawson County
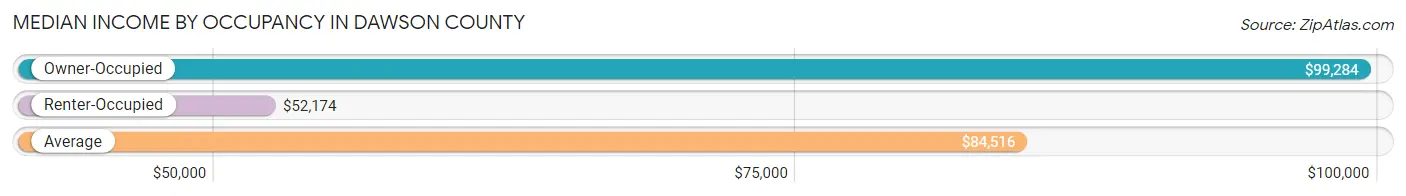
| Occupancy Type | # Households | Median Income |
| Owner-Occupied | 8,295 (80.2%) | $99,284 |
| Renter-Occupied | 2,048 (19.8%) | $52,174 |
| Average | 10,343 (100.0%) | $84,516 |
Occupancy by Householder Income Bracket in Dawson County
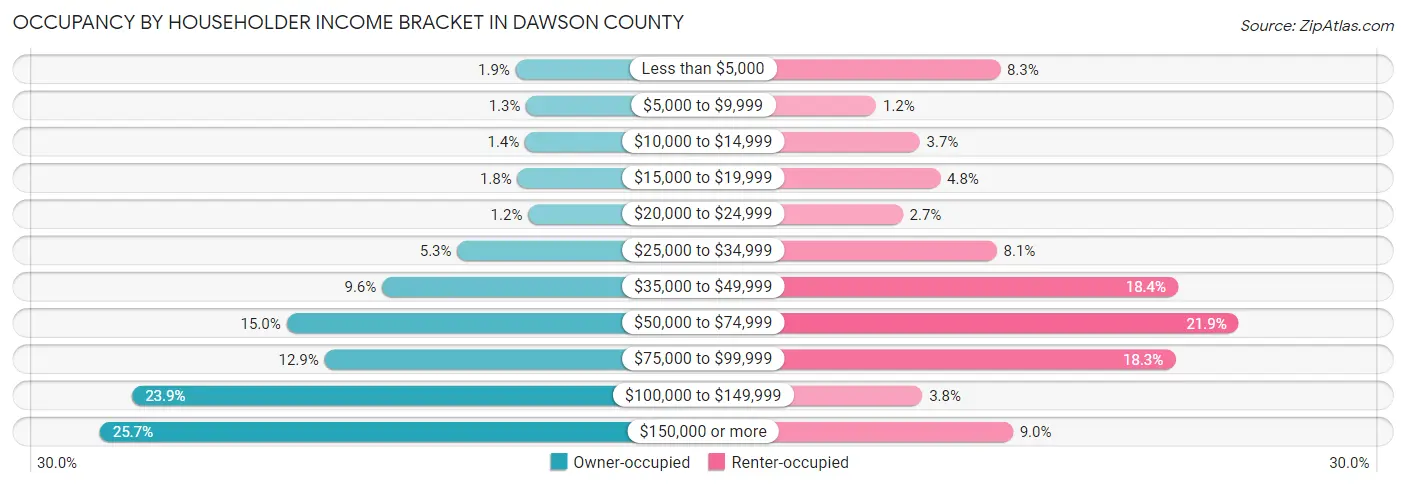
| Income Bracket | Owner-occupied | Renter-occupied |
| Less than $5,000 | 161 (1.9%) | 169 (8.3%) |
| $5,000 to $9,999 | 110 (1.3%) | 24 (1.2%) |
| $10,000 to $14,999 | 116 (1.4%) | 75 (3.7%) |
| $15,000 to $19,999 | 152 (1.8%) | 99 (4.8%) |
| $20,000 to $24,999 | 101 (1.2%) | 55 (2.7%) |
| $25,000 to $34,999 | 437 (5.3%) | 165 (8.1%) |
| $35,000 to $49,999 | 794 (9.6%) | 377 (18.4%) |
| $50,000 to $74,999 | 1,247 (15.0%) | 448 (21.9%) |
| $75,000 to $99,999 | 1,067 (12.9%) | 374 (18.3%) |
| $100,000 to $149,999 | 1,978 (23.8%) | 78 (3.8%) |
| $150,000 or more | 2,132 (25.7%) | 184 (9.0%) |
| Total | 8,295 (100.0%) | 2,048 (100.0%) |
Monthly Housing Cost Tiers in Dawson County
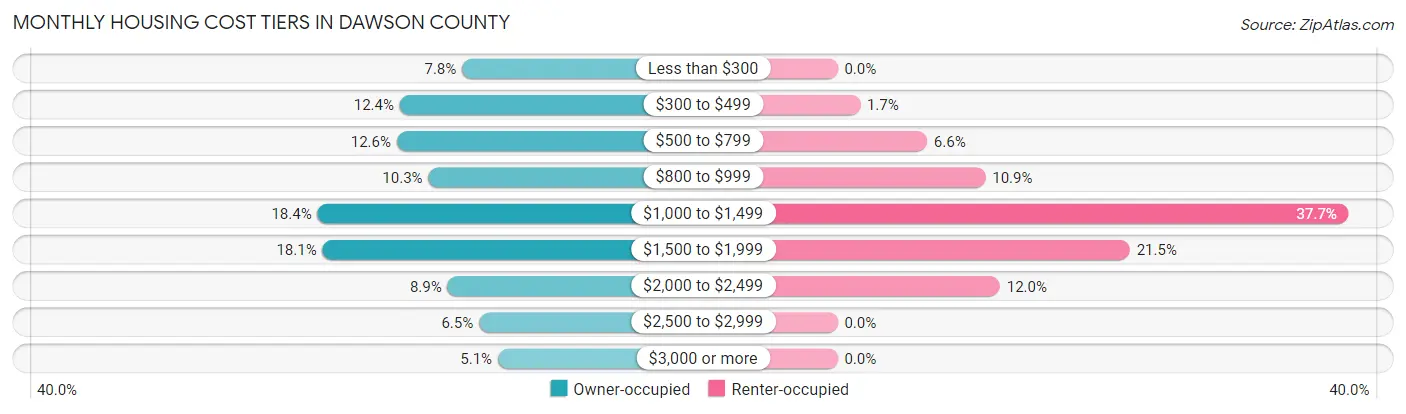
| Monthly Cost | Owner-occupied | Renter-occupied |
| Less than $300 | 645 (7.8%) | 0 (0.0%) |
| $300 to $499 | 1,026 (12.4%) | 34 (1.7%) |
| $500 to $799 | 1,044 (12.6%) | 135 (6.6%) |
| $800 to $999 | 851 (10.3%) | 223 (10.9%) |
| $1,000 to $1,499 | 1,529 (18.4%) | 771 (37.7%) |
| $1,500 to $1,999 | 1,498 (18.1%) | 441 (21.5%) |
| $2,000 to $2,499 | 734 (8.8%) | 245 (12.0%) |
| $2,500 to $2,999 | 542 (6.5%) | 0 (0.0%) |
| $3,000 or more | 426 (5.1%) | 0 (0.0%) |
| Total | 8,295 (100.0%) | 2,048 (100.0%) |
Physical Housing Characteristics in Dawson County
Housing Structures in Dawson County
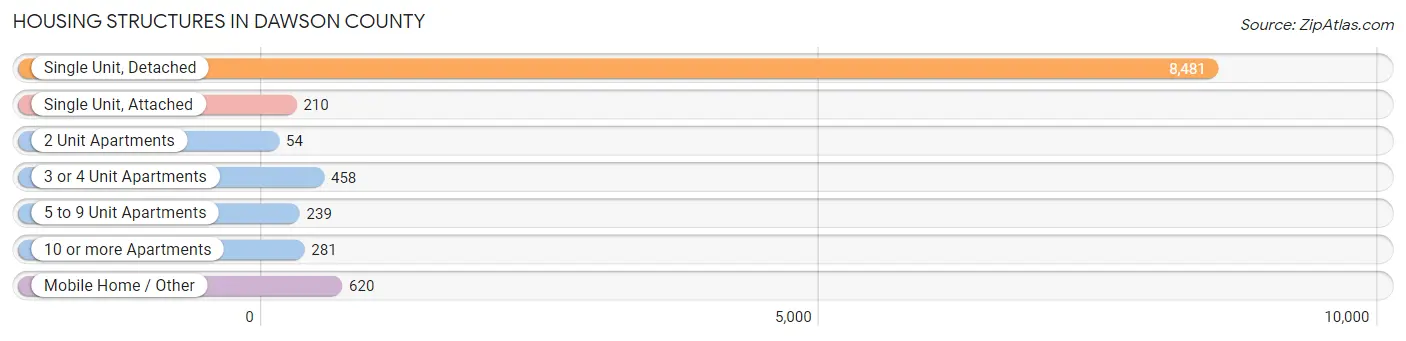
| Structure Type | # Housing Units | % Housing Units |
| Single Unit, Detached | 8,481 | 82.0% |
| Single Unit, Attached | 210 | 2.0% |
| 2 Unit Apartments | 54 | 0.5% |
| 3 or 4 Unit Apartments | 458 | 4.4% |
| 5 to 9 Unit Apartments | 239 | 2.3% |
| 10 or more Apartments | 281 | 2.7% |
| Mobile Home / Other | 620 | 6.0% |
| Total | 10,343 | 100.0% |
Housing Structures by Occupancy in Dawson County
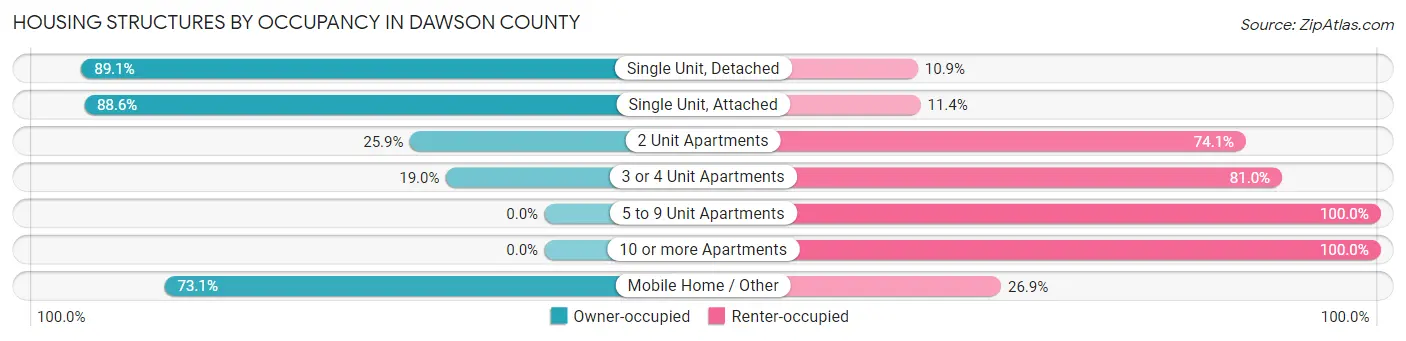
| Structure Type | Owner-occupied | Renter-occupied |
| Single Unit, Detached | 7,555 (89.1%) | 926 (10.9%) |
| Single Unit, Attached | 186 (88.6%) | 24 (11.4%) |
| 2 Unit Apartments | 14 (25.9%) | 40 (74.1%) |
| 3 or 4 Unit Apartments | 87 (19.0%) | 371 (81.0%) |
| 5 to 9 Unit Apartments | 0 (0.0%) | 239 (100.0%) |
| 10 or more Apartments | 0 (0.0%) | 281 (100.0%) |
| Mobile Home / Other | 453 (73.1%) | 167 (26.9%) |
| Total | 8,295 (80.2%) | 2,048 (19.8%) |
Housing Structures by Number of Rooms in Dawson County
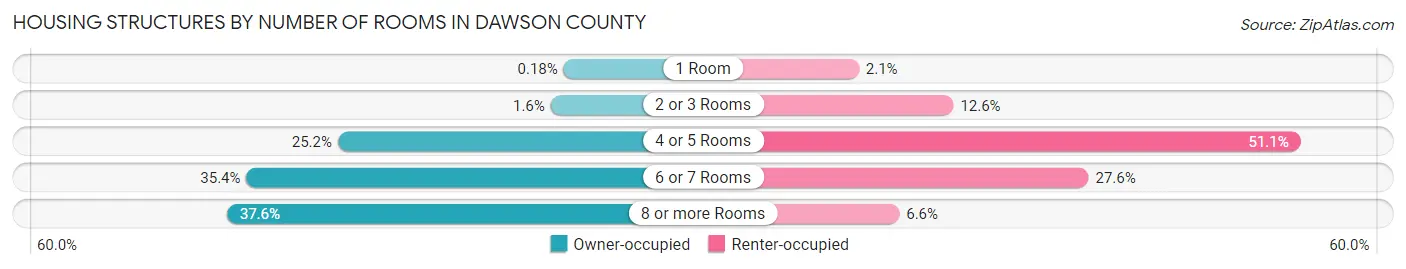
| Number of Rooms | Owner-occupied | Renter-occupied |
| 1 Room | 15 (0.2%) | 43 (2.1%) |
| 2 or 3 Rooms | 134 (1.6%) | 258 (12.6%) |
| 4 or 5 Rooms | 2,094 (25.2%) | 1,047 (51.1%) |
| 6 or 7 Rooms | 2,936 (35.4%) | 565 (27.6%) |
| 8 or more Rooms | 3,116 (37.6%) | 135 (6.6%) |
| Total | 8,295 (100.0%) | 2,048 (100.0%) |
Housing Structure by Heating Type in Dawson County
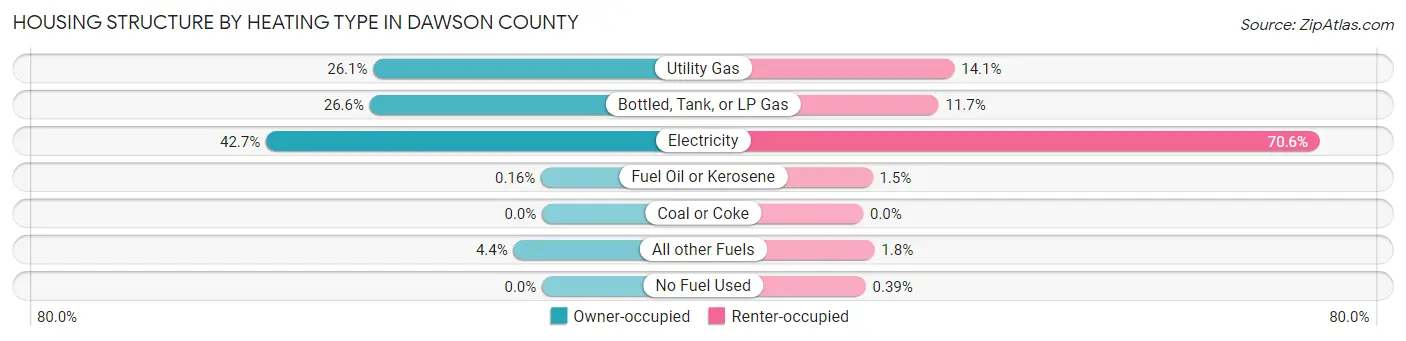
| Heating Type | Owner-occupied | Renter-occupied |
| Utility Gas | 2,165 (26.1%) | 289 (14.1%) |
| Bottled, Tank, or LP Gas | 2,210 (26.6%) | 239 (11.7%) |
| Electricity | 3,540 (42.7%) | 1,446 (70.6%) |
| Fuel Oil or Kerosene | 13 (0.2%) | 30 (1.5%) |
| Coal or Coke | 0 (0.0%) | 0 (0.0%) |
| All other Fuels | 367 (4.4%) | 36 (1.8%) |
| No Fuel Used | 0 (0.0%) | 8 (0.4%) |
| Total | 8,295 (100.0%) | 2,048 (100.0%) |
Household Vehicle Usage in Dawson County
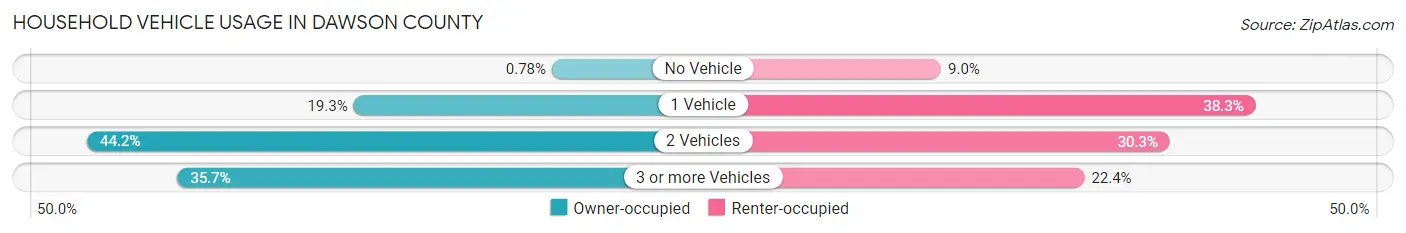
| Vehicles per Household | Owner-occupied | Renter-occupied |
| No Vehicle | 65 (0.8%) | 184 (9.0%) |
| 1 Vehicle | 1,601 (19.3%) | 785 (38.3%) |
| 2 Vehicles | 3,664 (44.2%) | 621 (30.3%) |
| 3 or more Vehicles | 2,965 (35.7%) | 458 (22.4%) |
| Total | 8,295 (100.0%) | 2,048 (100.0%) |
Real Estate & Mortgages in Dawson County
Real Estate and Mortgage Overview in Dawson County
| Characteristic | Without Mortgage | With Mortgage |
| Housing Units | 3,264 | 5,031 |
| Median Property Value | $265,100 | $339,300 |
| Median Household Income | $71,577 | $1,565 |
| Monthly Housing Costs | $495 | $426 |
| Real Estate Taxes | $1,633 | $173 |
Property Value by Mortgage Status in Dawson County
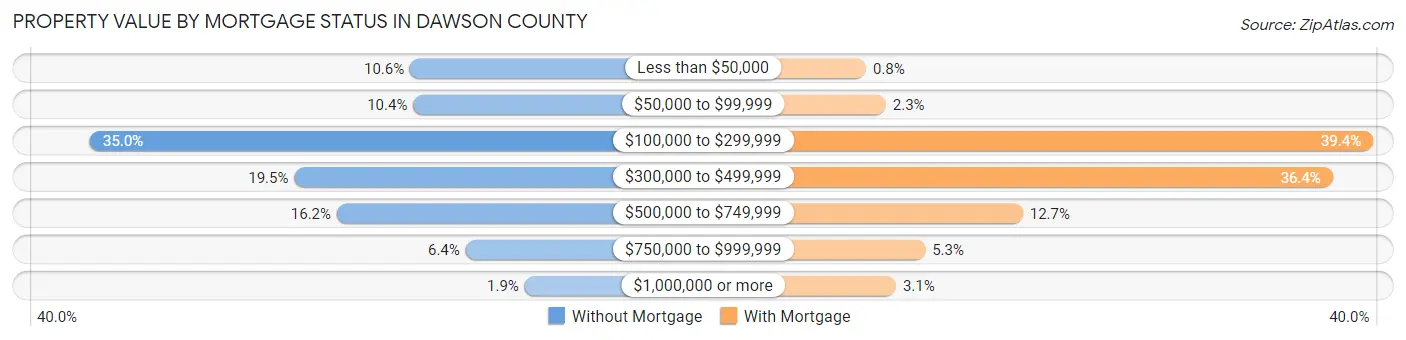
| Property Value | Without Mortgage | With Mortgage |
| Less than $50,000 | 347 (10.6%) | 40 (0.8%) |
| $50,000 to $99,999 | 339 (10.4%) | 116 (2.3%) |
| $100,000 to $299,999 | 1,143 (35.0%) | 1,983 (39.4%) |
| $300,000 to $499,999 | 635 (19.5%) | 1,829 (36.3%) |
| $500,000 to $749,999 | 529 (16.2%) | 641 (12.7%) |
| $750,000 to $999,999 | 209 (6.4%) | 267 (5.3%) |
| $1,000,000 or more | 62 (1.9%) | 155 (3.1%) |
| Total | 3,264 (100.0%) | 5,031 (100.0%) |
Household Income by Mortgage Status in Dawson County
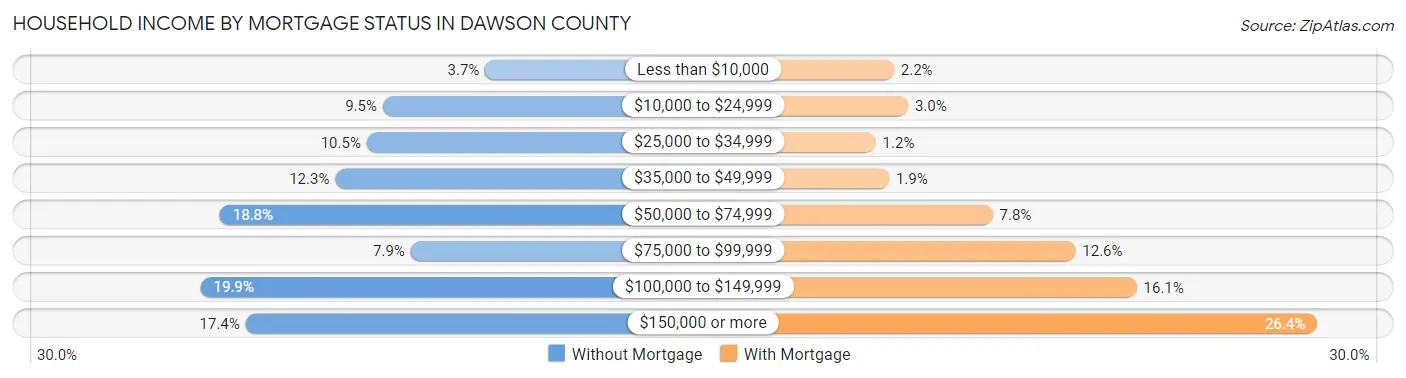
| Household Income | Without Mortgage | With Mortgage |
| Less than $10,000 | 120 (3.7%) | 110 (2.2%) |
| $10,000 to $24,999 | 311 (9.5%) | 151 (3.0%) |
| $25,000 to $34,999 | 341 (10.4%) | 58 (1.1%) |
| $35,000 to $49,999 | 400 (12.2%) | 96 (1.9%) |
| $50,000 to $74,999 | 615 (18.8%) | 394 (7.8%) |
| $75,000 to $99,999 | 259 (7.9%) | 632 (12.6%) |
| $100,000 to $149,999 | 651 (19.9%) | 808 (16.1%) |
| $150,000 or more | 567 (17.4%) | 1,327 (26.4%) |
| Total | 3,264 (100.0%) | 5,031 (100.0%) |
Property Value to Household Income Ratio in Dawson County
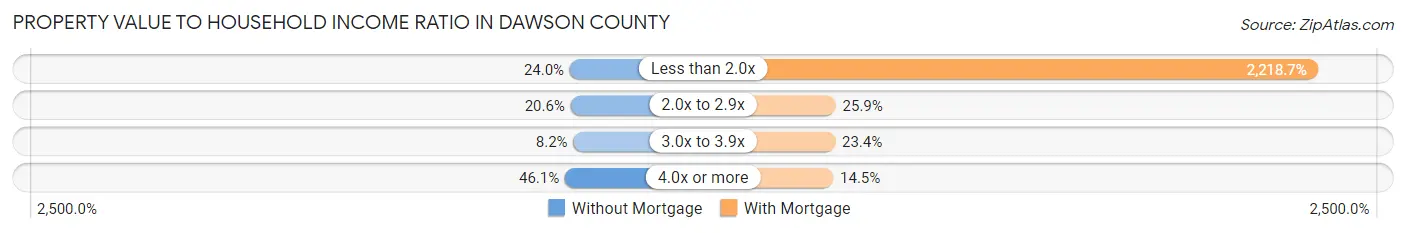
| Value-to-Income Ratio | Without Mortgage | With Mortgage |
| Less than 2.0x | 784 (24.0%) | 111,621 (2,218.7%) |
| 2.0x to 2.9x | 671 (20.6%) | 1,305 (25.9%) |
| 3.0x to 3.9x | 266 (8.2%) | 1,176 (23.4%) |
| 4.0x or more | 1,504 (46.1%) | 729 (14.5%) |
| Total | 3,264 (100.0%) | 5,031 (100.0%) |
Real Estate Taxes by Mortgage Status in Dawson County
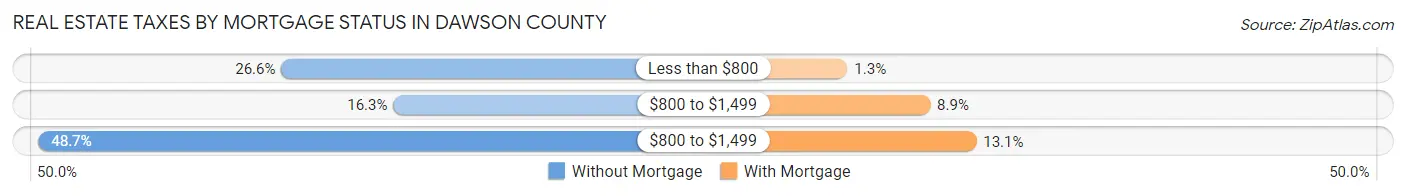
| Property Taxes | Without Mortgage | With Mortgage |
| Less than $800 | 867 (26.6%) | 66 (1.3%) |
| $800 to $1,499 | 533 (16.3%) | 446 (8.9%) |
| $800 to $1,499 | 1,591 (48.7%) | 658 (13.1%) |
| Total | 3,264 (100.0%) | 5,031 (100.0%) |
Health & Disability in Dawson County
Health Insurance Coverage by Age in Dawson County
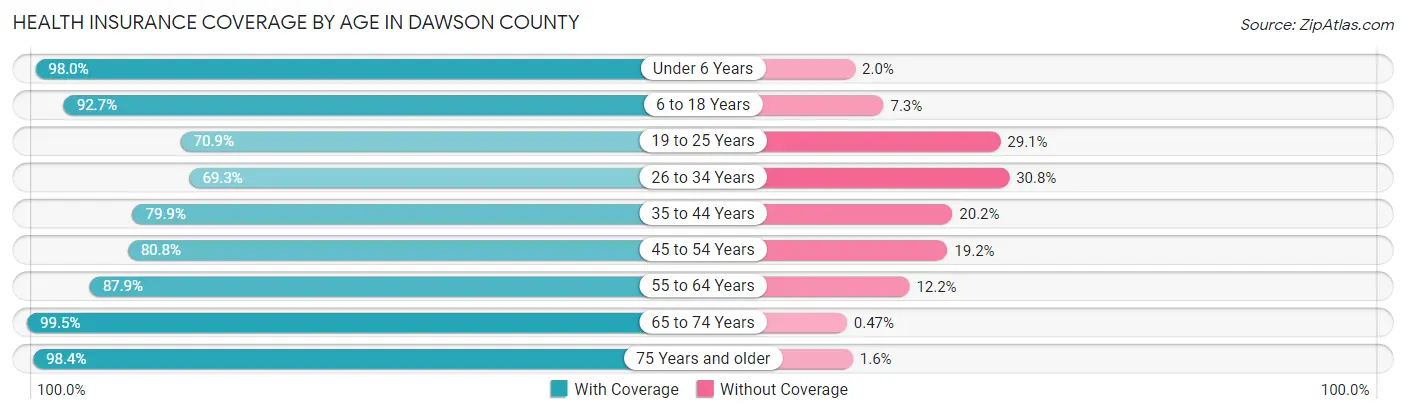
| Age Bracket | With Coverage | Without Coverage |
| Under 6 Years | 1,607 (98.0%) | 33 (2.0%) |
| 6 to 18 Years | 3,735 (92.7%) | 295 (7.3%) |
| 19 to 25 Years | 1,747 (70.9%) | 717 (29.1%) |
| 26 to 34 Years | 1,919 (69.3%) | 852 (30.7%) |
| 35 to 44 Years | 2,382 (79.8%) | 601 (20.2%) |
| 45 to 54 Years | 3,134 (80.8%) | 746 (19.2%) |
| 55 to 64 Years | 3,499 (87.8%) | 484 (12.1%) |
| 65 to 74 Years | 3,370 (99.5%) | 16 (0.5%) |
| 75 Years and older | 1,982 (98.4%) | 32 (1.6%) |
| Total | 23,375 (86.1%) | 3,776 (13.9%) |
Health Insurance Coverage by Citizenship Status in Dawson County
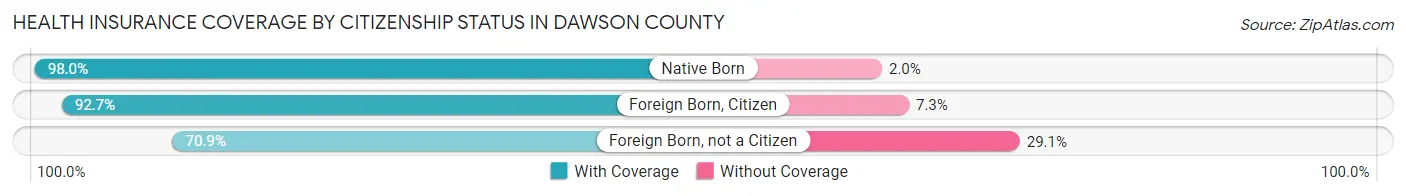
| Citizenship Status | With Coverage | Without Coverage |
| Native Born | 1,607 (98.0%) | 33 (2.0%) |
| Foreign Born, Citizen | 3,735 (92.7%) | 295 (7.3%) |
| Foreign Born, not a Citizen | 1,747 (70.9%) | 717 (29.1%) |
Health Insurance Coverage by Household Income in Dawson County
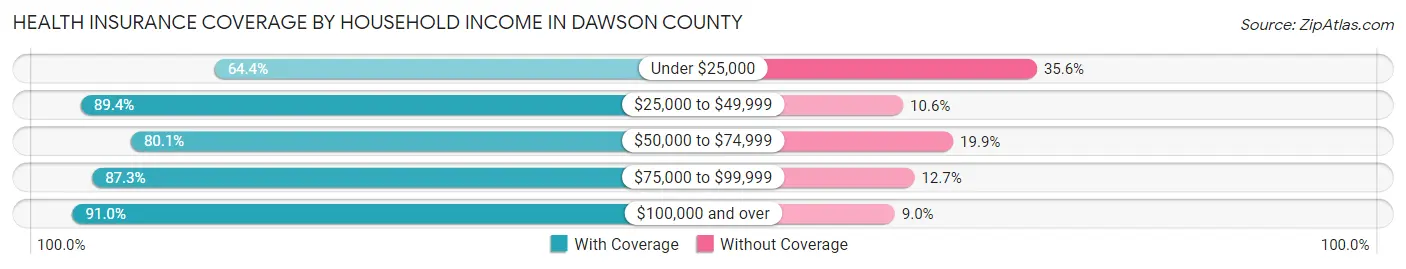
| Household Income | With Coverage | Without Coverage |
| Under $25,000 | 1,487 (64.4%) | 823 (35.6%) |
| $25,000 to $49,999 | 3,107 (89.4%) | 367 (10.6%) |
| $50,000 to $74,999 | 3,691 (80.1%) | 919 (19.9%) |
| $75,000 to $99,999 | 3,643 (87.3%) | 529 (12.7%) |
| $100,000 and over | 11,443 (91.0%) | 1,132 (9.0%) |
Public vs Private Health Insurance Coverage by Age in Dawson County
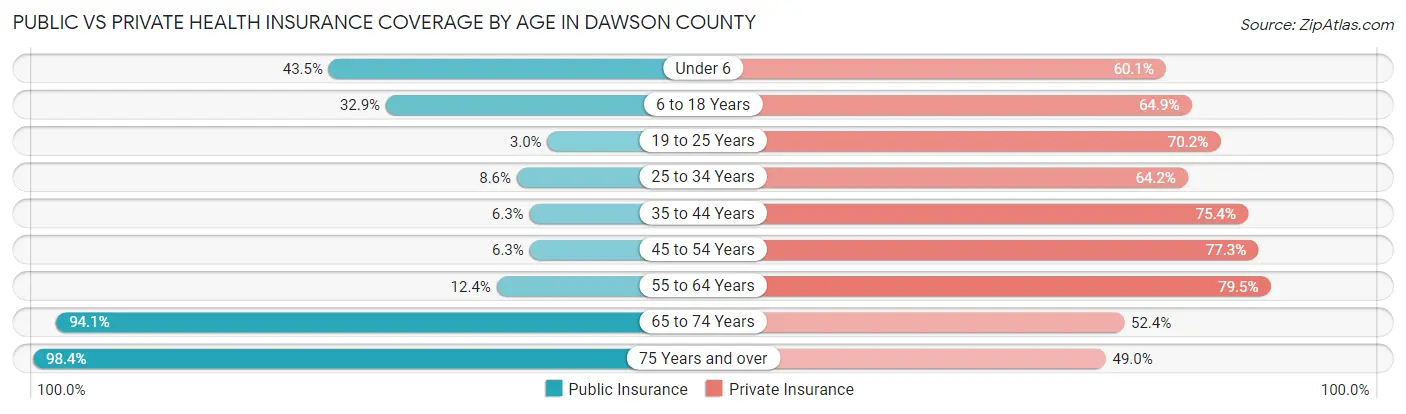
| Age Bracket | Public Insurance | Private Insurance |
| Under 6 | 714 (43.5%) | 986 (60.1%) |
| 6 to 18 Years | 1,327 (32.9%) | 2,614 (64.9%) |
| 19 to 25 Years | 73 (3.0%) | 1,730 (70.2%) |
| 25 to 34 Years | 239 (8.6%) | 1,779 (64.2%) |
| 35 to 44 Years | 188 (6.3%) | 2,248 (75.4%) |
| 45 to 54 Years | 243 (6.3%) | 2,998 (77.3%) |
| 55 to 64 Years | 493 (12.4%) | 3,168 (79.5%) |
| 65 to 74 Years | 3,187 (94.1%) | 1,774 (52.4%) |
| 75 Years and over | 1,982 (98.4%) | 986 (49.0%) |
| Total | 8,446 (31.1%) | 18,283 (67.3%) |
Disability Status by Sex by Age in Dawson County
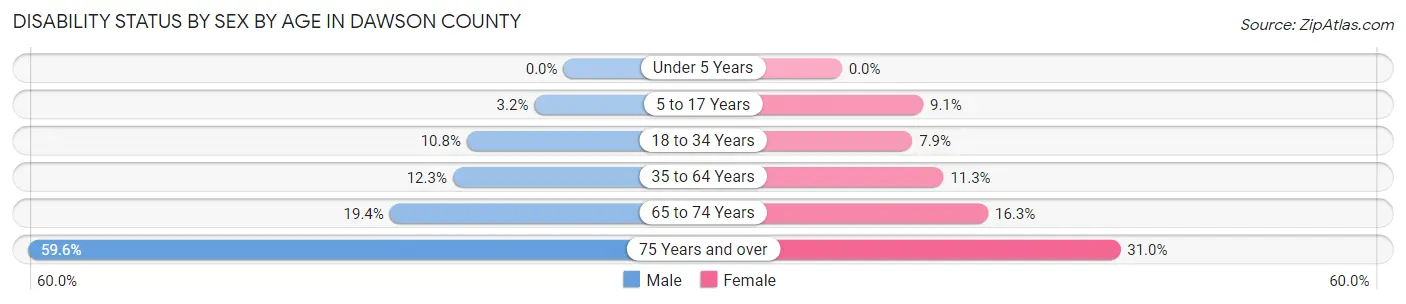
| Age Bracket | Male | Female |
| Under 5 Years | 0 (0.0%) | 0 (0.0%) |
| 5 to 17 Years | 74 (3.2%) | 166 (9.0%) |
| 18 to 34 Years | 303 (10.8%) | 207 (7.9%) |
| 35 to 64 Years | 671 (12.3%) | 611 (11.3%) |
| 65 to 74 Years | 318 (19.4%) | 284 (16.3%) |
| 75 Years and over | 574 (59.6%) | 326 (31.0%) |
Disability Class by Sex by Age in Dawson County
Disability Class: Hearing Difficulty
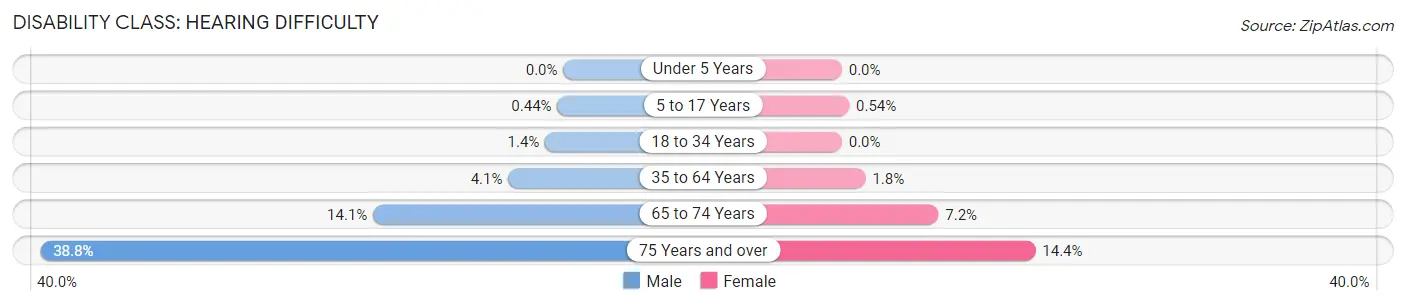
| Age Bracket | Male | Female |
| Under 5 Years | 0 (0.0%) | 0 (0.0%) |
| 5 to 17 Years | 10 (0.4%) | 10 (0.5%) |
| 18 to 34 Years | 38 (1.3%) | 0 (0.0%) |
| 35 to 64 Years | 223 (4.1%) | 95 (1.8%) |
| 65 to 74 Years | 232 (14.1%) | 125 (7.2%) |
| 75 Years and over | 374 (38.8%) | 151 (14.4%) |
Disability Class: Vision Difficulty
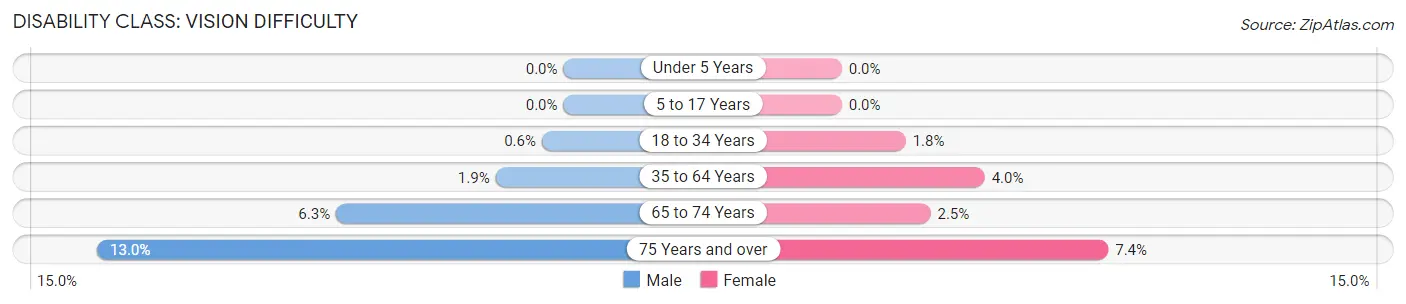
| Age Bracket | Male | Female |
| Under 5 Years | 0 (0.0%) | 0 (0.0%) |
| 5 to 17 Years | 0 (0.0%) | 0 (0.0%) |
| 18 to 34 Years | 17 (0.6%) | 47 (1.8%) |
| 35 to 64 Years | 103 (1.9%) | 215 (4.0%) |
| 65 to 74 Years | 104 (6.3%) | 43 (2.5%) |
| 75 Years and over | 125 (13.0%) | 78 (7.4%) |
Disability Class: Cognitive Difficulty
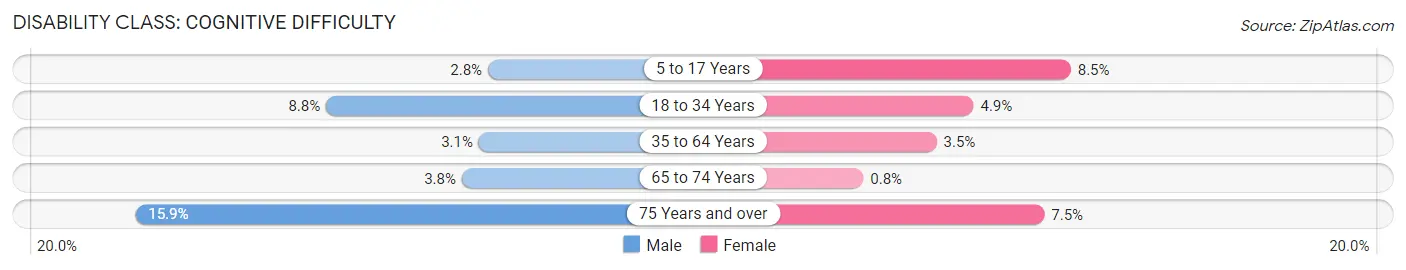
| Age Bracket | Male | Female |
| 5 to 17 Years | 64 (2.8%) | 156 (8.5%) |
| 18 to 34 Years | 248 (8.8%) | 129 (4.9%) |
| 35 to 64 Years | 171 (3.1%) | 190 (3.5%) |
| 65 to 74 Years | 62 (3.8%) | 14 (0.8%) |
| 75 Years and over | 153 (15.9%) | 79 (7.5%) |
Disability Class: Ambulatory Difficulty
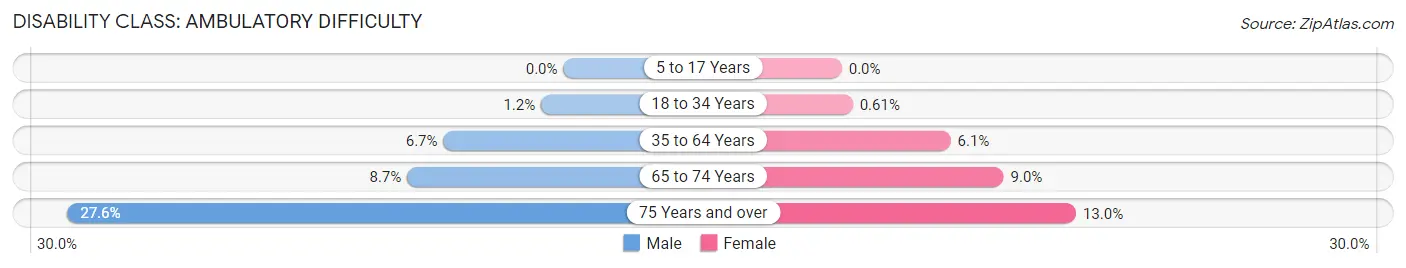
| Age Bracket | Male | Female |
| 5 to 17 Years | 0 (0.0%) | 0 (0.0%) |
| 18 to 34 Years | 35 (1.2%) | 16 (0.6%) |
| 35 to 64 Years | 364 (6.7%) | 327 (6.1%) |
| 65 to 74 Years | 143 (8.7%) | 157 (9.0%) |
| 75 Years and over | 266 (27.6%) | 137 (13.0%) |
Disability Class: Self-Care Difficulty
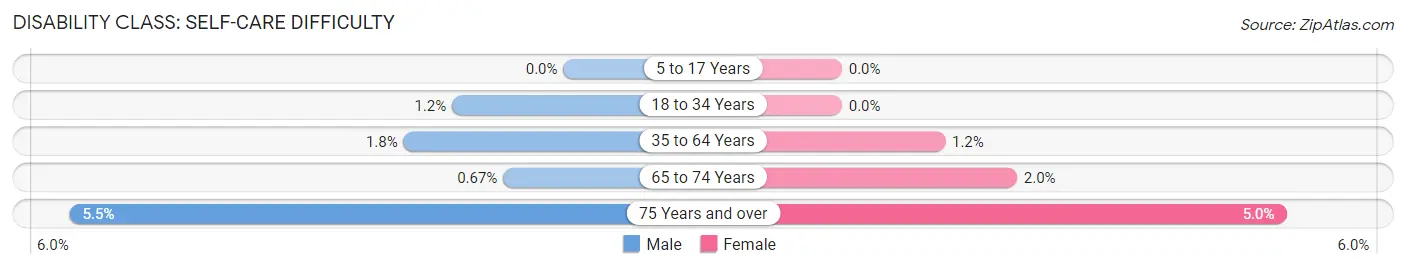
| Age Bracket | Male | Female |
| 5 to 17 Years | 0 (0.0%) | 0 (0.0%) |
| 18 to 34 Years | 35 (1.2%) | 0 (0.0%) |
| 35 to 64 Years | 97 (1.8%) | 62 (1.1%) |
| 65 to 74 Years | 11 (0.7%) | 34 (1.9%) |
| 75 Years and over | 53 (5.5%) | 52 (5.0%) |
Technology Access in Dawson County
Computing Device Access in Dawson County
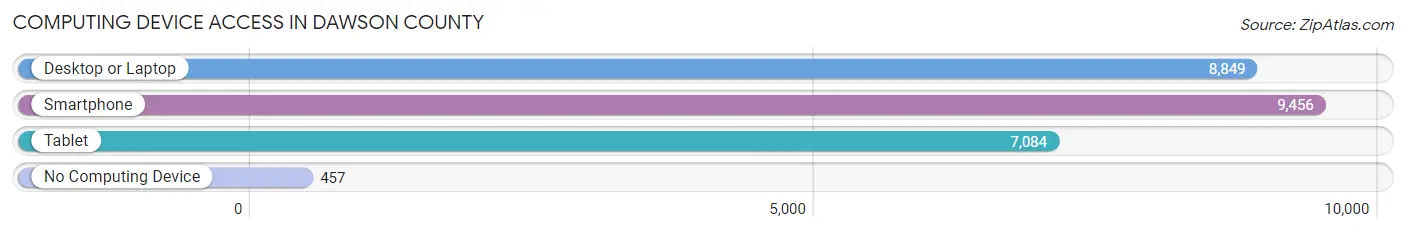
| Device Type | # Households | % Households |
| Desktop or Laptop | 8,849 | 85.6% |
| Smartphone | 9,456 | 91.4% |
| Tablet | 7,084 | 68.5% |
| No Computing Device | 457 | 4.4% |
| Total | 10,343 | 100.0% |
Internet Access in Dawson County
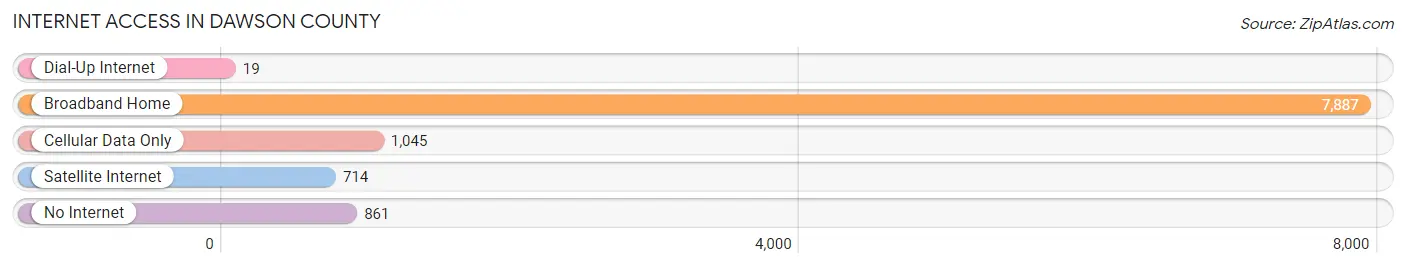
| Internet Type | # Households | % Households |
| Dial-Up Internet | 19 | 0.2% |
| Broadband Home | 7,887 | 76.2% |
| Cellular Data Only | 1,045 | 10.1% |
| Satellite Internet | 714 | 6.9% |
| No Internet | 861 | 8.3% |
| Total | 10,343 | 100.0% |
Dawson County Summary
Dawson County is a county located in the north-central part of the U.S. state of Georgia. As of the 2010 census, the population was 22,330. The county seat is Dawsonville. The county was created on December 3, 1857 from parts of Gilmer, Lumpkin, and Forsyth counties and named for Senator William Crosby Dawson.
History
Dawson County was created in 1857 from parts of Gilmer, Lumpkin, and Forsyth counties. It was named for Senator William Crosby Dawson, who served in the Georgia General Assembly from 1843 to 1844 and in the U.S. House of Representatives from 1845 to 1849.
The first county seat was at Rock House, located near the Etowah River. In 1859, the county seat was moved to Dawsonville, which was named for Senator Dawson.
Geography
Dawson County is located in the north-central part of Georgia, approximately 40 miles north of Atlanta. It is bordered by Forsyth County to the north, Lumpkin County to the east, Hall County to the south, and Pickens County to the west.
The county has a total area of 229 square miles, of which 227 square miles is land and 2 square miles (0.9%) is water. The highest point in the county is Chestatee Mountain, which has an elevation of 1,945 feet.
Economy
The economy of Dawson County is largely based on agriculture and tourism. The county is home to several wineries, including the Wolf Mountain Vineyards and Winery, which is the highest elevation winery in the United States.
The county is also home to several large employers, including the North Georgia Premium Outlets, which is the largest outlet mall in the state. Other major employers include the Georgia Department of Corrections, which operates the Dawson State Prison, and the Georgia Department of Transportation, which operates the Dawson County Maintenance Facility.
Demographics
As of the 2010 census, there were 22,330 people, 8,093 households, and 5,945 families residing in the county. The population density was 98.2 people per square mile. There were 8,890 housing units at an average density of 39.2 per square mile. The racial makeup of the county was 92.2% White, 3.3% Black or African American, 0.3% Native American, 0.7% Asian, 0.1% Pacific Islander, 2.3% from other races, and 1.2% from two or more races. 5.3% of the population were Hispanic or Latino of any race.
The median income for a household in the county was $45,945 and the median income for a family was $54,945. The per capita income for the county was $22,945. About 8.7% of families and 11.2% of the population were below the poverty line, including 14.2% of those under age 18 and 8.2% of those age 65 or over.
Common Questions
What is Per Capita Income in Dawson County?
Per Capita income in Dawson County is $41,096.
What is the Median Family Income in Dawson County?
Median Family Income in Dawson County is $101,924.
What is the Median Household income in Dawson County?
Median Household Income in Dawson County is $84,516.
What is Income or Wage Gap in Dawson County?
Income or Wage Gap in Dawson County is 26.6%.
Women in Dawson County earn 73.4 cents for every dollar earned by a man.
What is Inequality or Gini Index in Dawson County?
Inequality or Gini Index in Dawson County is 0.41.
What is the Total Population of Dawson County?
Total Population of Dawson County is 27,355.
What is the Total Male Population of Dawson County?
Total Male Population of Dawson County is 14,023.
What is the Total Female Population of Dawson County?
Total Female Population of Dawson County is 13,332.
What is the Ratio of Males per 100 Females in Dawson County?
There are 105.18 Males per 100 Females in Dawson County.
What is the Ratio of Females per 100 Males in Dawson County?
There are 95.07 Females per 100 Males in Dawson County.
What is the Median Population Age in Dawson County?
Median Population Age in Dawson County is 43.9 Years.
What is the Average Family Size in Dawson County
Average Family Size in Dawson County is 3.1 People.
What is the Average Household Size in Dawson County
Average Household Size in Dawson County is 2.6 People.
How Large is the Labor Force in Dawson County?
There are 14,361 People in the Labor Forcein in Dawson County.
What is the Percentage of People in the Labor Force in Dawson County?
63.3% of People are in the Labor Force in Dawson County.
What is the Unemployment Rate in Dawson County?
Unemployment Rate in Dawson County is 4.6%.