Dade County, GA Map & Demographics
Dade County Overview
$30,078
PER CAPITA INCOME
$69,846
AVG FAMILY INCOME
$59,531
AVG HOUSEHOLD INCOME
30.7%
WAGE / INCOME GAP [ % ]
69.3¢/ $1
WAGE / INCOME GAP [ $ ]
0.43
INEQUALITY / GINI INDEX
16,239
TOTAL POPULATION
8,015
MALE POPULATION
8,224
FEMALE POPULATION
97.46
MALES / 100 FEMALES
102.61
FEMALES / 100 MALES
42.5
MEDIAN AGE
2.9
AVG FAMILY SIZE
2.5
AVG HOUSEHOLD SIZE
7,490
LABOR FORCE [ PEOPLE ]
56.0%
PERCENT IN LABOR FORCE
5.5%
UNEMPLOYMENT RATE
Dade County Area Codes
Income in Dade County
Income Overview in Dade County
Per Capita Income in Dade County is $30,078, while median incomes of families and households are $69,846 and $59,531 respectively.
| Characteristic | Number | Measure |
| Per Capita Income | 16,239 | $30,078 |
| Median Family Income | 4,333 | $69,846 |
| Mean Family Income | 4,333 | $90,397 |
| Median Household Income | 6,074 | $59,531 |
| Mean Household Income | 6,074 | $79,211 |
| Income Deficit | 4,333 | $0 |
| Wage / Income Gap (%) | 16,239 | 30.75% |
| Wage / Income Gap ($) | 16,239 | 69.25¢ per $1 |
| Gini / Inequality Index | 16,239 | 0.43 |
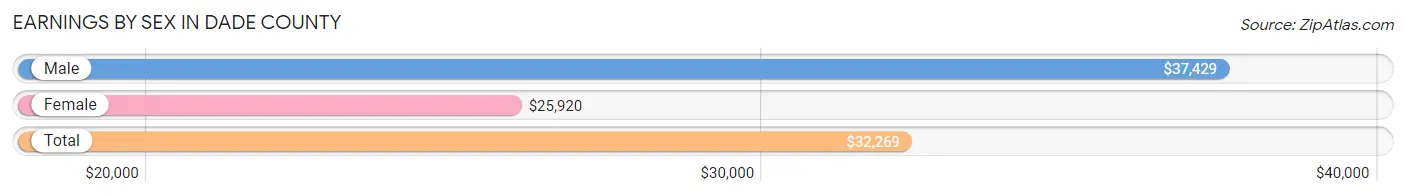
Earnings by Sex in Dade County
Average Earnings in Dade County are $32,269, $37,429 for men and $25,920 for women, a difference of 30.7%.
| Sex | Number | Average Earnings |
| Male | 4,295 (51.1%) | $37,429 |
| Female | 4,102 (48.8%) | $25,920 |
| Total | 8,397 (100.0%) | $32,269 |
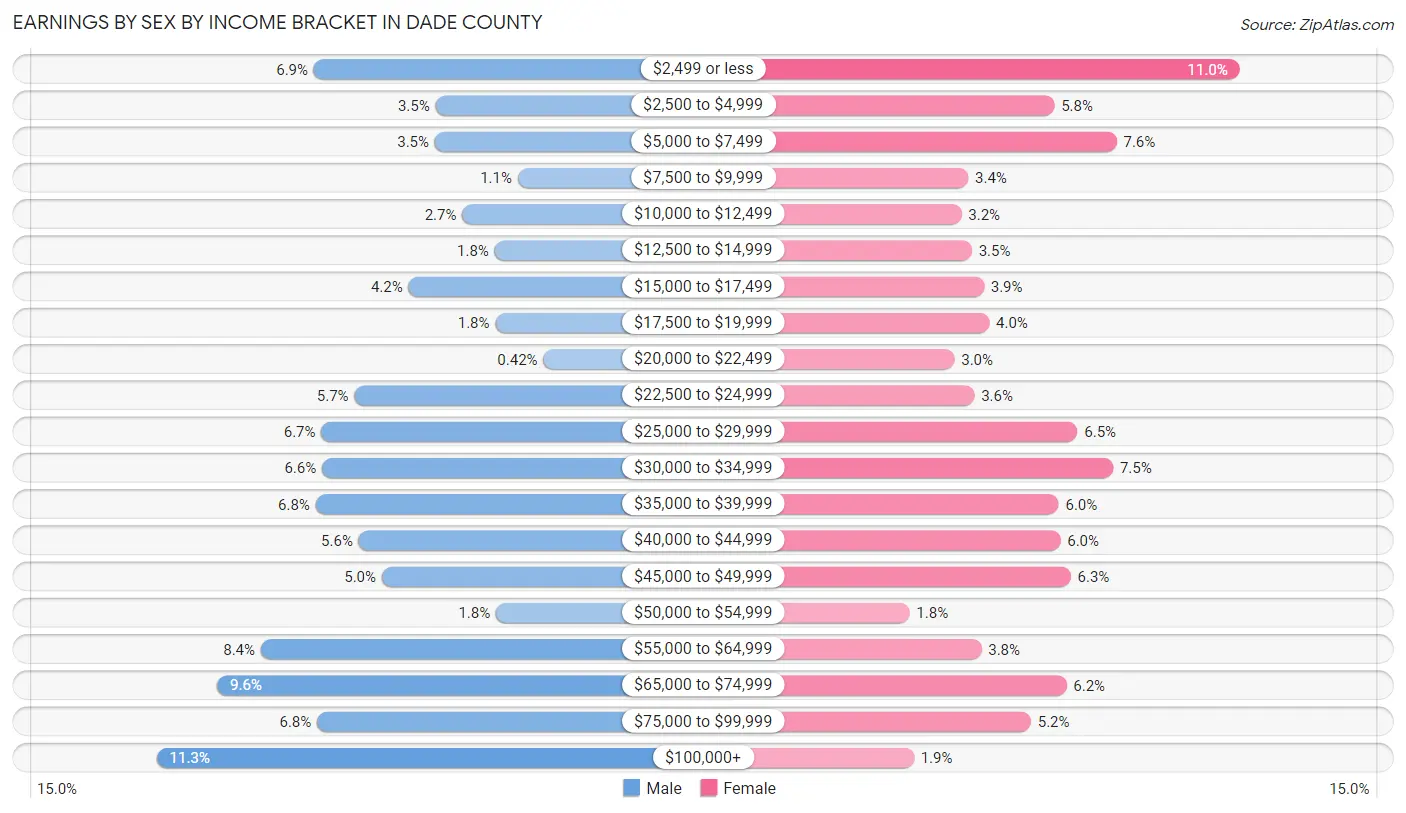
Earnings by Sex by Income Bracket in Dade County
The most common earnings brackets in Dade County are $100,000+ for men (485 | 11.3%) and $2,499 or less for women (453 | 11.0%).
| Income | Male | Female |
| $2,499 or less | 295 (6.9%) | 453 (11.0%) |
| $2,500 to $4,999 | 148 (3.5%) | 239 (5.8%) |
| $5,000 to $7,499 | 149 (3.5%) | 311 (7.6%) |
| $7,500 to $9,999 | 49 (1.1%) | 140 (3.4%) |
| $10,000 to $12,499 | 116 (2.7%) | 132 (3.2%) |
| $12,500 to $14,999 | 77 (1.8%) | 144 (3.5%) |
| $15,000 to $17,499 | 181 (4.2%) | 158 (3.8%) |
| $17,500 to $19,999 | 76 (1.8%) | 164 (4.0%) |
| $20,000 to $22,499 | 18 (0.4%) | 124 (3.0%) |
| $22,500 to $24,999 | 246 (5.7%) | 147 (3.6%) |
| $25,000 to $29,999 | 286 (6.7%) | 266 (6.5%) |
| $30,000 to $34,999 | 285 (6.6%) | 307 (7.5%) |
| $35,000 to $39,999 | 293 (6.8%) | 244 (5.9%) |
| $40,000 to $44,999 | 241 (5.6%) | 246 (6.0%) |
| $45,000 to $49,999 | 213 (5.0%) | 258 (6.3%) |
| $50,000 to $54,999 | 75 (1.8%) | 72 (1.8%) |
| $55,000 to $64,999 | 359 (8.4%) | 155 (3.8%) |
| $65,000 to $74,999 | 412 (9.6%) | 253 (6.2%) |
| $75,000 to $99,999 | 291 (6.8%) | 212 (5.2%) |
| $100,000+ | 485 (11.3%) | 77 (1.9%) |
| Total | 4,295 (100.0%) | 4,102 (100.0%) |
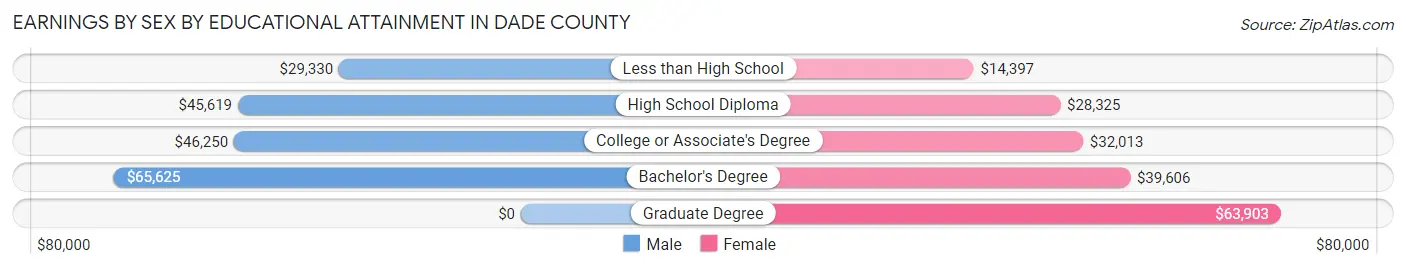
Earnings by Sex by Educational Attainment in Dade County
Average earnings in Dade County are $46,109 for men and $32,330 for women, a difference of 29.9%. Men with an educational attainment of bachelor's degree enjoy the highest average annual earnings of $65,625, while those with less than high school education earn the least with $29,330. Women with an educational attainment of graduate degree earn the most with the average annual earnings of $63,903, while those with less than high school education have the smallest earnings of $14,397.
| Educational Attainment | Male Income | Female Income |
| Less than High School | $29,330 | $14,397 |
| High School Diploma | $45,619 | $28,325 |
| College or Associate's Degree | $46,250 | $32,013 |
| Bachelor's Degree | $65,625 | $39,606 |
| Graduate Degree | - | - |
| Total | $46,109 | $32,330 |
Family Income in Dade County
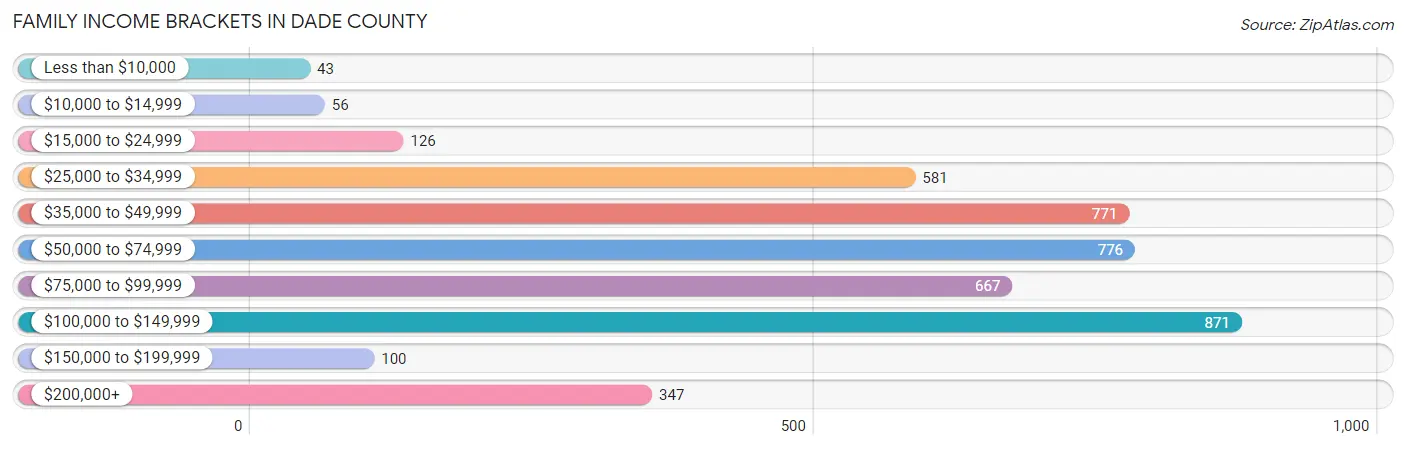
Family Income Brackets in Dade County
According to the Dade County family income data, there are 871 families falling into the $100,000 to $149,999 income range, which is the most common income bracket and makes up 20.1% of all families. Conversely, the less than $10,000 income bracket is the least frequent group with only 43 families (1.0%) belonging to this category.
| Income Bracket | # Families | % Families |
| Less than $10,000 | 43 | 1.0% |
| $10,000 to $14,999 | 56 | 1.3% |
| $15,000 to $24,999 | 126 | 2.9% |
| $25,000 to $34,999 | 581 | 13.4% |
| $35,000 to $49,999 | 771 | 17.8% |
| $50,000 to $74,999 | 776 | 17.9% |
| $75,000 to $99,999 | 667 | 15.4% |
| $100,000 to $149,999 | 871 | 20.1% |
| $150,000 to $199,999 | 100 | 2.3% |
| $200,000+ | 347 | 8.0% |
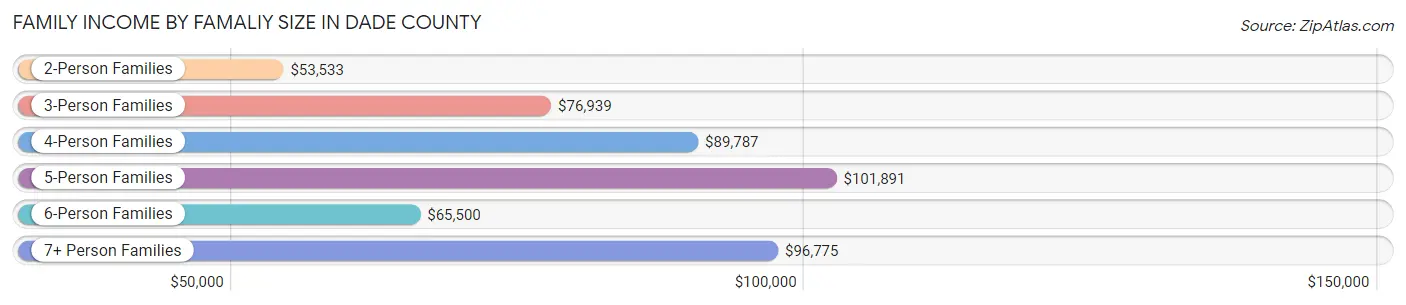
Family Income by Famaliy Size in Dade County
5-person families (383 | 8.8%) account for the highest median family income in Dade County with $101,891 per family, while 2-person families (2,441 | 56.3%) have the highest median income of $26,766 per family member.
| Income Bracket | # Families | Median Income |
| 2-Person Families | 2,441 (56.3%) | $53,533 |
| 3-Person Families | 778 (18.0%) | $76,939 |
| 4-Person Families | 566 (13.1%) | $89,787 |
| 5-Person Families | 383 (8.8%) | $101,891 |
| 6-Person Families | 78 (1.8%) | $65,500 |
| 7+ Person Families | 87 (2.0%) | $96,775 |
| Total | 4,333 (100.0%) | $69,846 |
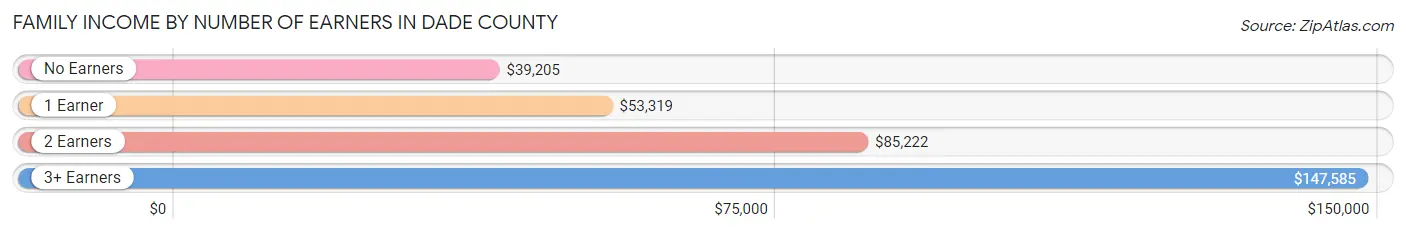
Family Income by Number of Earners in Dade County
The median family income in Dade County is $69,846, with families comprising 3+ earners (491) having the highest median family income of $147,585, while families with no earners (922) have the lowest median family income of $39,205, accounting for 11.3% and 21.3% of families, respectively.
| Number of Earners | # Families | Median Income |
| No Earners | 922 (21.3%) | $39,205 |
| 1 Earner | 1,226 (28.3%) | $53,319 |
| 2 Earners | 1,694 (39.1%) | $85,222 |
| 3+ Earners | 491 (11.3%) | $147,585 |
| Total | 4,333 (100.0%) | $69,846 |
Household Income in Dade County
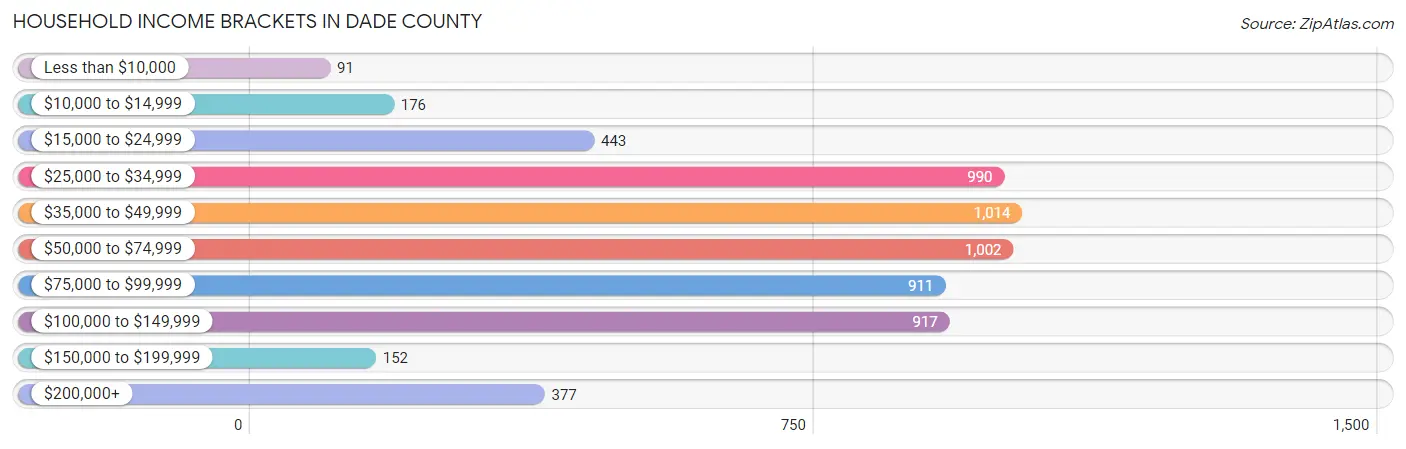
Household Income Brackets in Dade County
With 1,014 households falling in the category, the $35,000 to $49,999 income range is the most frequent in Dade County, accounting for 16.7% of all households. In contrast, only 91 households (1.5%) fall into the less than $10,000 income bracket, making it the least populous group.
| Income Bracket | # Households | % Households |
| Less than $10,000 | 91 | 1.5% |
| $10,000 to $14,999 | 176 | 2.9% |
| $15,000 to $24,999 | 443 | 7.3% |
| $25,000 to $34,999 | 990 | 16.3% |
| $35,000 to $49,999 | 1,014 | 16.7% |
| $50,000 to $74,999 | 1,002 | 16.5% |
| $75,000 to $99,999 | 911 | 15.0% |
| $100,000 to $149,999 | 917 | 15.1% |
| $150,000 to $199,999 | 152 | 2.5% |
| $200,000+ | 377 | 6.2% |
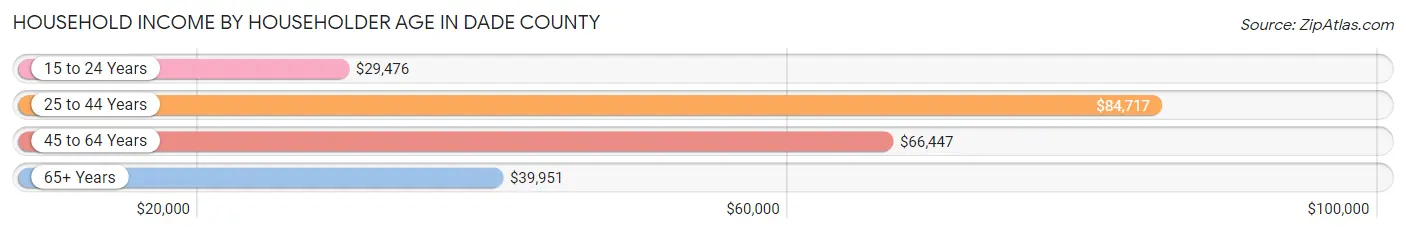
Household Income by Householder Age in Dade County
The median household income in Dade County is $59,531, with the highest median household income of $84,717 found in the 25 to 44 years age bracket for the primary householder. A total of 1,759 households (29.0%) fall into this category. Meanwhile, the 15 to 24 years age bracket for the primary householder has the lowest median household income of $29,476, with 171 households (2.8%) in this group.
| Income Bracket | # Households | Median Income |
| 15 to 24 Years | 171 (2.8%) | $29,476 |
| 25 to 44 Years | 1,759 (29.0%) | $84,717 |
| 45 to 64 Years | 2,156 (35.5%) | $66,447 |
| 65+ Years | 1,988 (32.7%) | $39,951 |
| Total | 6,074 (100.0%) | $59,531 |
Poverty in Dade County
Income Below Poverty by Sex and Age in Dade County
With 5.7% poverty level for males and 7.4% for females among the residents of Dade County, 16 and 17 year old males and 16 and 17 year old females are the most vulnerable to poverty, with 19 males (12.1%) and 35 females (25.9%) in their respective age groups living below the poverty level.
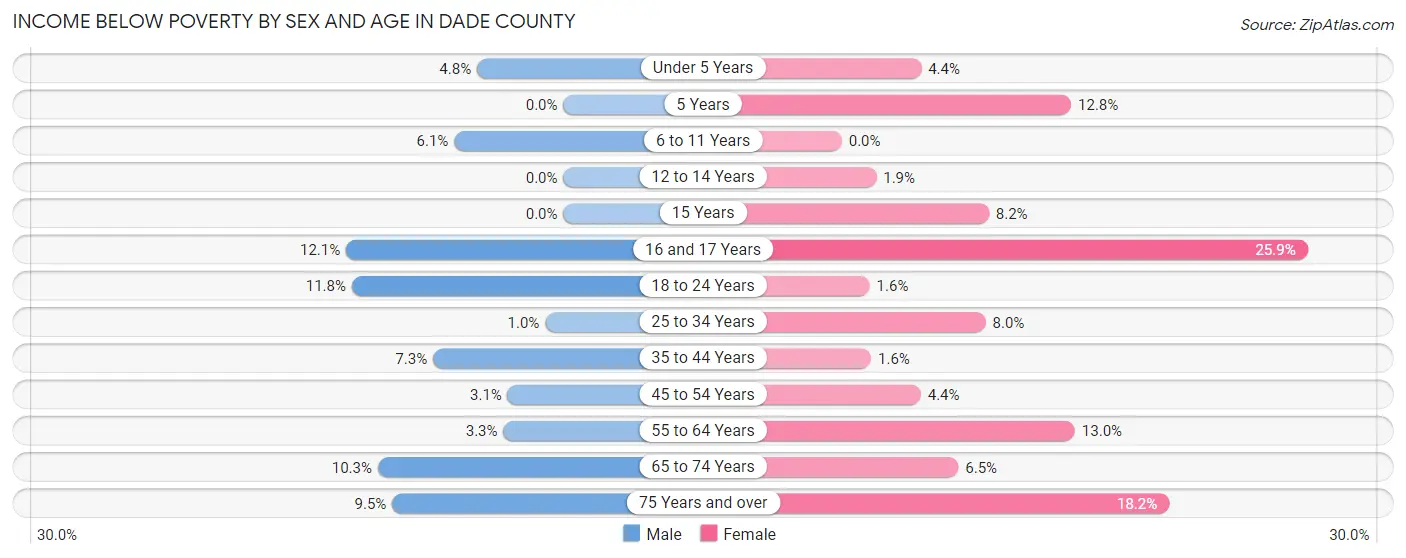
| Age Bracket | Male | Female |
| Under 5 Years | 25 (4.8%) | 15 (4.4%) |
| 5 Years | 0 (0.0%) | 6 (12.8%) |
| 6 to 11 Years | 38 (6.1%) | 0 (0.0%) |
| 12 to 14 Years | 0 (0.0%) | 5 (1.9%) |
| 15 Years | 0 (0.0%) | 19 (8.2%) |
| 16 and 17 Years | 19 (12.1%) | 35 (25.9%) |
| 18 to 24 Years | 51 (11.8%) | 5 (1.5%) |
| 25 to 34 Years | 10 (1.0%) | 71 (8.0%) |
| 35 to 44 Years | 69 (7.3%) | 15 (1.6%) |
| 45 to 54 Years | 30 (3.1%) | 41 (4.4%) |
| 55 to 64 Years | 38 (3.3%) | 159 (13.0%) |
| 65 to 74 Years | 93 (10.3%) | 69 (6.5%) |
| 75 Years and over | 51 (9.5%) | 121 (18.2%) |
| Total | 424 (5.7%) | 561 (7.4%) |
Income Above Poverty by Sex and Age in Dade County
According to the poverty statistics in Dade County, males aged 5 years and females aged 6 to 11 years are the age groups that are most secure financially, with 100.0% of males and 100.0% of females in these age groups living above the poverty line.
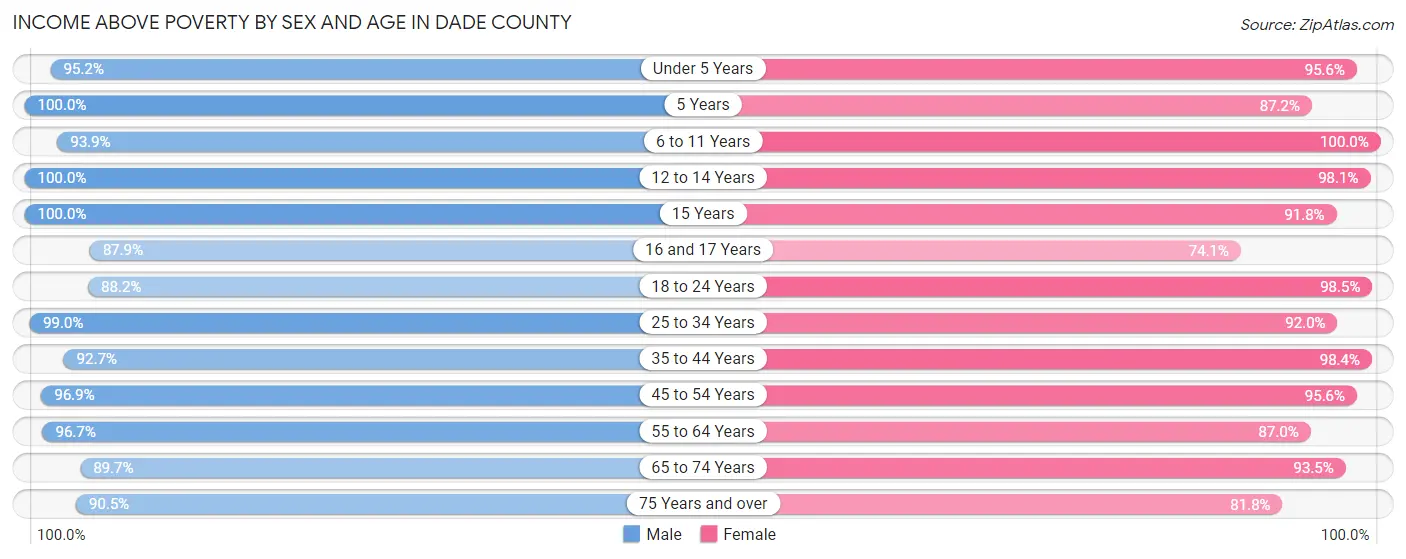
| Age Bracket | Male | Female |
| Under 5 Years | 495 (95.2%) | 324 (95.6%) |
| 5 Years | 70 (100.0%) | 41 (87.2%) |
| 6 to 11 Years | 587 (93.9%) | 553 (100.0%) |
| 12 to 14 Years | 187 (100.0%) | 256 (98.1%) |
| 15 Years | 20 (100.0%) | 213 (91.8%) |
| 16 and 17 Years | 138 (87.9%) | 100 (74.1%) |
| 18 to 24 Years | 382 (88.2%) | 317 (98.5%) |
| 25 to 34 Years | 976 (99.0%) | 815 (92.0%) |
| 35 to 44 Years | 882 (92.7%) | 908 (98.4%) |
| 45 to 54 Years | 938 (96.9%) | 890 (95.6%) |
| 55 to 64 Years | 1,100 (96.7%) | 1,066 (87.0%) |
| 65 to 74 Years | 807 (89.7%) | 994 (93.5%) |
| 75 Years and over | 484 (90.5%) | 543 (81.8%) |
| Total | 7,066 (94.3%) | 7,020 (92.6%) |
Income Below Poverty Among Married-Couple Families in Dade County
The poverty statistics for married-couple families in Dade County show that 2.9% or 106 of the total 3,691 families live below the poverty line. Families with no children have the highest poverty rate of 3.3%, comprising of 83 families. On the other hand, families with 3 or 4 children have the lowest poverty rate of 0.0%, which includes 0 families.
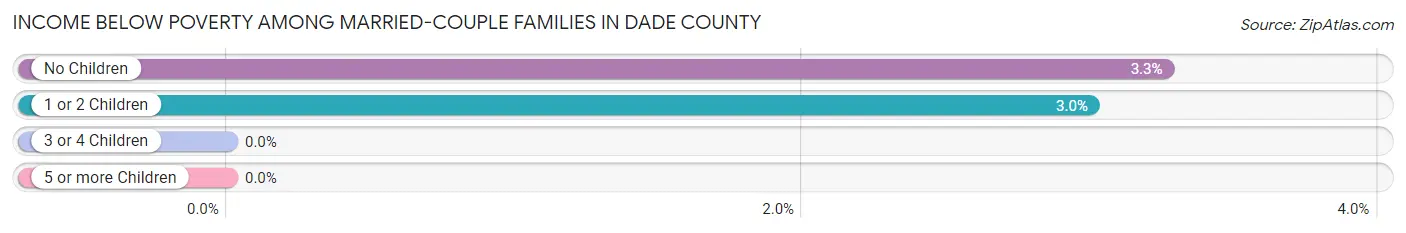
| Children | Above Poverty | Below Poverty |
| No Children | 2,463 (96.7%) | 83 (3.3%) |
| 1 or 2 Children | 744 (97.0%) | 23 (3.0%) |
| 3 or 4 Children | 311 (100.0%) | 0 (0.0%) |
| 5 or more Children | 67 (100.0%) | 0 (0.0%) |
| Total | 3,585 (97.1%) | 106 (2.9%) |
Income Below Poverty Among Single-Parent Households in Dade County
According to the poverty data in Dade County, 8.1% or 17 single-father households and 16.2% or 70 single-mother households are living below the poverty line. Among single-father households, those with 1 or 2 children have the highest poverty rate, with 17 households (22.4%) experiencing poverty. Likewise, among single-mother households, those with 1 or 2 children have the highest poverty rate, with 52 households (22.5%) falling below the poverty line.
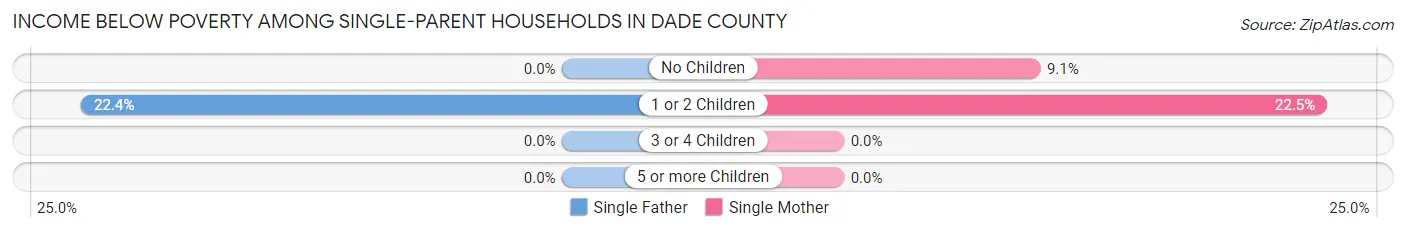
| Children | Single Father | Single Mother |
| No Children | 0 (0.0%) | 18 (9.1%) |
| 1 or 2 Children | 17 (22.4%) | 52 (22.5%) |
| 3 or 4 Children | 0 (0.0%) | 0 (0.0%) |
| 5 or more Children | 0 (0.0%) | 0 (0.0%) |
| Total | 17 (8.1%) | 70 (16.2%) |
Income Below Poverty Among Married-Couple vs Single-Parent Households in Dade County
The poverty data for Dade County shows that 106 of the married-couple family households (2.9%) and 87 of the single-parent households (13.6%) are living below the poverty level. Within the married-couple family households, those with no children have the highest poverty rate, with 83 households (3.3%) falling below the poverty line. Among the single-parent households, those with 1 or 2 children have the highest poverty rate, with 69 household (22.5%) living below poverty.
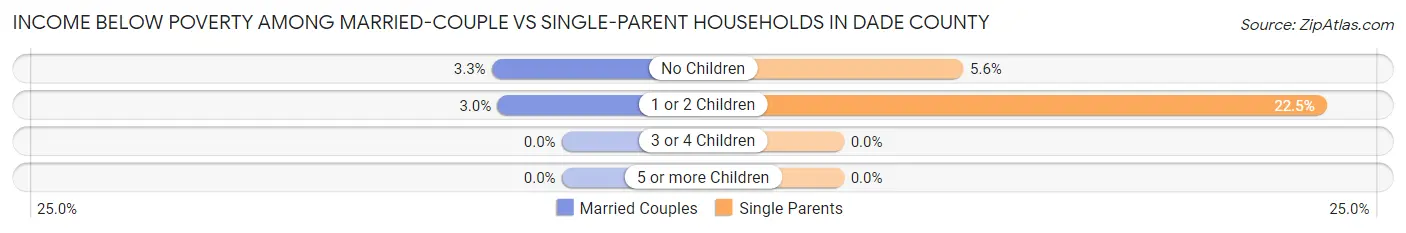
| Children | Married-Couple Families | Single-Parent Households |
| No Children | 83 (3.3%) | 18 (5.6%) |
| 1 or 2 Children | 23 (3.0%) | 69 (22.5%) |
| 3 or 4 Children | 0 (0.0%) | 0 (0.0%) |
| 5 or more Children | 0 (0.0%) | 0 (0.0%) |
| Total | 106 (2.9%) | 87 (13.6%) |
Race in Dade County
The most populous races in Dade County are White / Caucasian (15,240 | 93.9%), Two or more Races (640 | 3.9%), and Hispanic or Latino (419 | 2.6%).
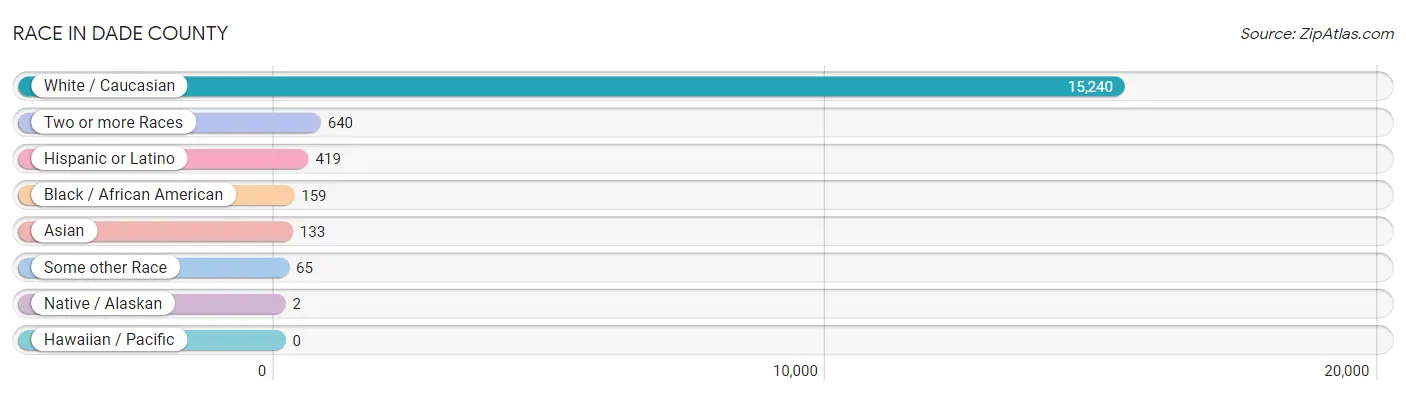
| Race | # Population | % Population |
| Asian | 133 | 0.8% |
| Black / African American | 159 | 1.0% |
| Hawaiian / Pacific | 0 | 0.0% |
| Hispanic or Latino | 419 | 2.6% |
| Native / Alaskan | 2 | 0.0% |
| White / Caucasian | 15,240 | 93.9% |
| Two or more Races | 640 | 3.9% |
| Some other Race | 65 | 0.4% |
| Total | 16,239 | 100.0% |
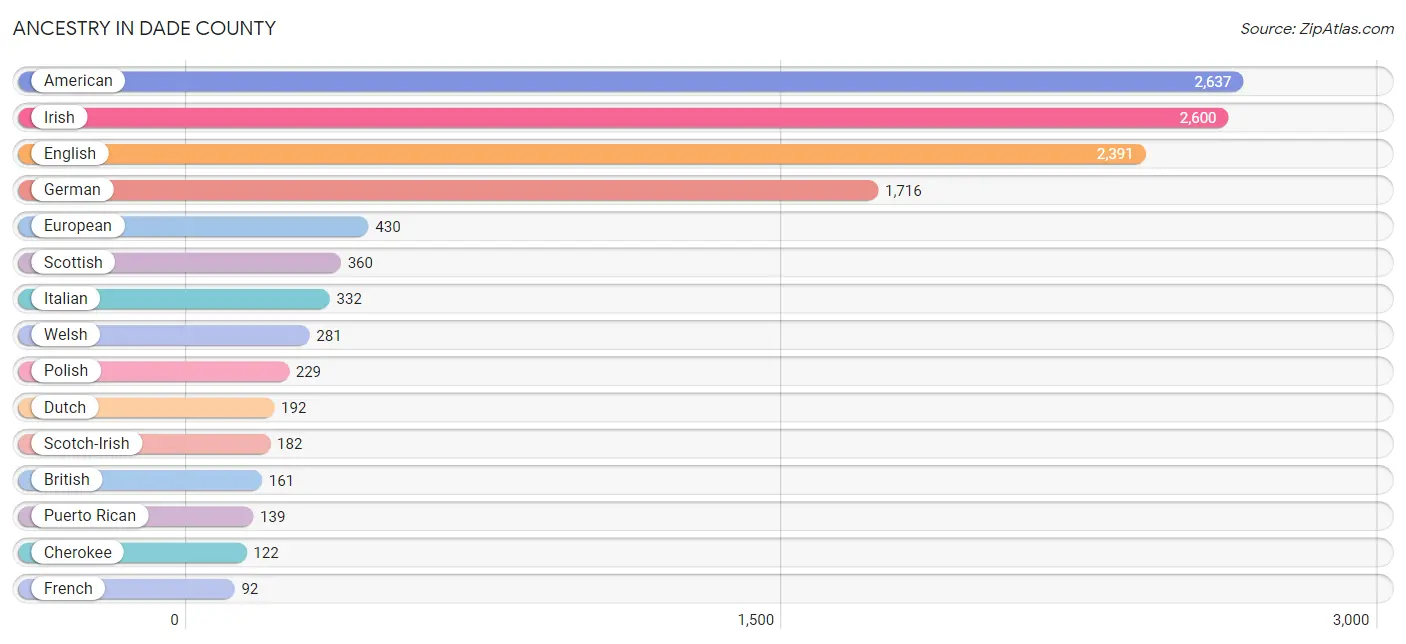
Ancestry in Dade County
The most populous ancestries reported in Dade County are American (2,637 | 16.2%), Irish (2,600 | 16.0%), English (2,391 | 14.7%), German (1,716 | 10.6%), and European (430 | 2.6%), together accounting for 60.2% of all Dade County residents.
| Ancestry | # Population | % Population |
| American | 2,637 | 16.2% |
| Apache | 9 | 0.1% |
| Arab | 9 | 0.1% |
| Austrian | 33 | 0.2% |
| Bhutanese | 4 | 0.0% |
| Blackfeet | 11 | 0.1% |
| Brazilian | 9 | 0.1% |
| British | 161 | 1.0% |
| Burmese | 11 | 0.1% |
| Canadian | 9 | 0.1% |
| Central American | 16 | 0.1% |
| Cherokee | 122 | 0.7% |
| Colombian | 39 | 0.2% |
| Croatian | 4 | 0.0% |
| Czech | 49 | 0.3% |
| Danish | 24 | 0.2% |
| Dutch | 192 | 1.2% |
| Eastern European | 22 | 0.1% |
| Egyptian | 9 | 0.1% |
| English | 2,391 | 14.7% |
| Ethiopian | 8 | 0.1% |
| European | 430 | 2.6% |
| Finnish | 14 | 0.1% |
| French | 92 | 0.6% |
| French Canadian | 23 | 0.1% |
| German | 1,716 | 10.6% |
| Ghanaian | 13 | 0.1% |
| Greek | 14 | 0.1% |
| Guatemalan | 16 | 0.1% |
| Indian (Asian) | 4 | 0.0% |
| Iranian | 8 | 0.1% |
| Irish | 2,600 | 16.0% |
| Italian | 332 | 2.0% |
| Korean | 29 | 0.2% |
| Latvian | 20 | 0.1% |
| Lebanese | 9 | 0.1% |
| Lithuanian | 4 | 0.0% |
| Mexican | 76 | 0.5% |
| Nigerian | 4 | 0.0% |
| Northern European | 42 | 0.3% |
| Norwegian | 92 | 0.6% |
| Peruvian | 19 | 0.1% |
| Polish | 229 | 1.4% |
| Portuguese | 73 | 0.4% |
| Puerto Rican | 139 | 0.9% |
| Russian | 8 | 0.1% |
| Scandinavian | 51 | 0.3% |
| Scotch-Irish | 182 | 1.1% |
| Scottish | 360 | 2.2% |
| Slovak | 9 | 0.1% |
| South American | 58 | 0.4% |
| Sri Lankan | 9 | 0.1% |
| Subsaharan African | 29 | 0.2% |
| Swedish | 64 | 0.4% |
| Swiss | 17 | 0.1% |
| Thai | 85 | 0.5% |
| Welsh | 281 | 1.7% |
| Yugoslavian | 8 | 0.1% | View All 58 Rows |
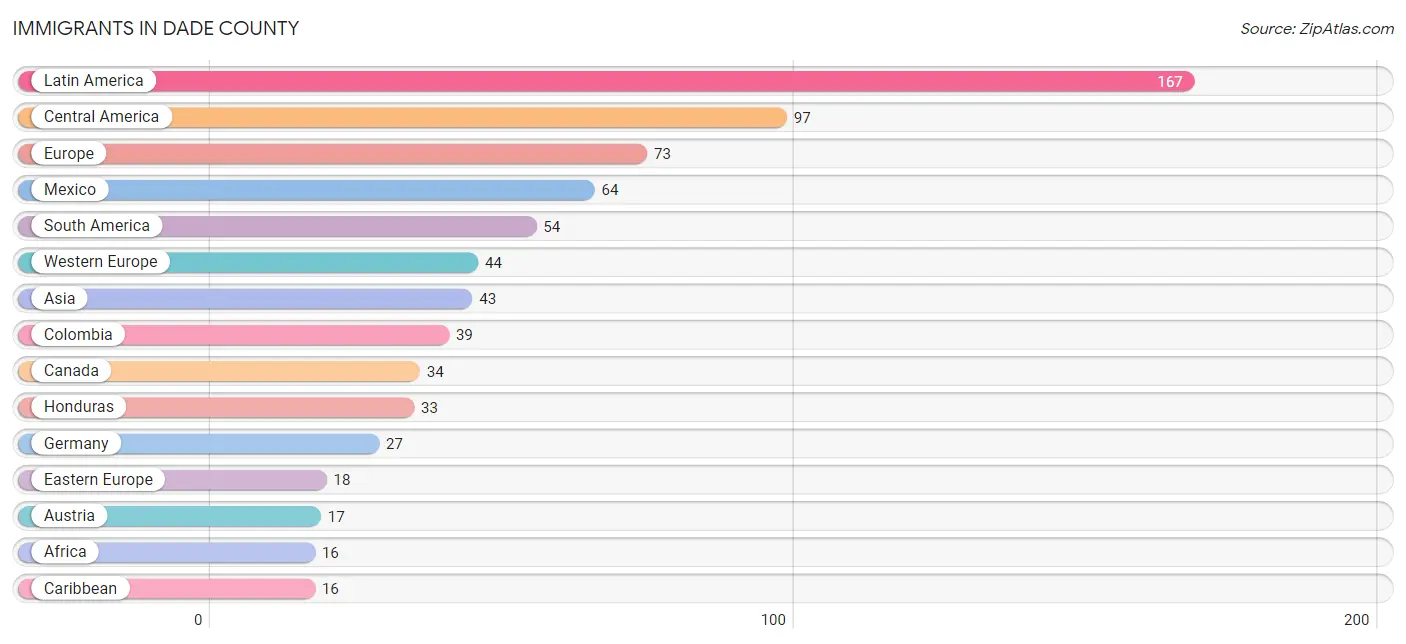
Immigrants in Dade County
The most numerous immigrant groups reported in Dade County came from Latin America (167 | 1.0%), Central America (97 | 0.6%), Europe (73 | 0.4%), Mexico (64 | 0.4%), and South America (54 | 0.3%), together accounting for 2.8% of all Dade County residents.
| Immigration Origin | # Population | % Population |
| Africa | 16 | 0.1% |
| Asia | 43 | 0.3% |
| Austria | 17 | 0.1% |
| Bosnia and Herzegovina | 10 | 0.1% |
| Brazil | 15 | 0.1% |
| Canada | 34 | 0.2% |
| Caribbean | 16 | 0.1% |
| Central America | 97 | 0.6% |
| China | 4 | 0.0% |
| Colombia | 39 | 0.2% |
| Croatia | 4 | 0.0% |
| Eastern Africa | 12 | 0.1% |
| Eastern Asia | 11 | 0.1% |
| Eastern Europe | 18 | 0.1% |
| England | 11 | 0.1% |
| Ethiopia | 8 | 0.1% |
| Europe | 73 | 0.4% |
| Germany | 27 | 0.2% |
| Honduras | 33 | 0.2% |
| India | 12 | 0.1% |
| Kazakhstan | 4 | 0.0% |
| Korea | 7 | 0.0% |
| Latin America | 167 | 1.0% |
| Lebanon | 9 | 0.1% |
| Mexico | 64 | 0.4% |
| Nigeria | 4 | 0.0% |
| Northern Europe | 11 | 0.1% |
| Philippines | 3 | 0.0% |
| Russia | 4 | 0.0% |
| South America | 54 | 0.3% |
| South Central Asia | 16 | 0.1% |
| South Eastern Asia | 7 | 0.0% |
| Trinidad and Tobago | 16 | 0.1% |
| Vietnam | 4 | 0.0% |
| Western Africa | 4 | 0.0% |
| Western Asia | 9 | 0.1% |
| Western Europe | 44 | 0.3% |
| Zimbabwe | 4 | 0.0% | View All 38 Rows |
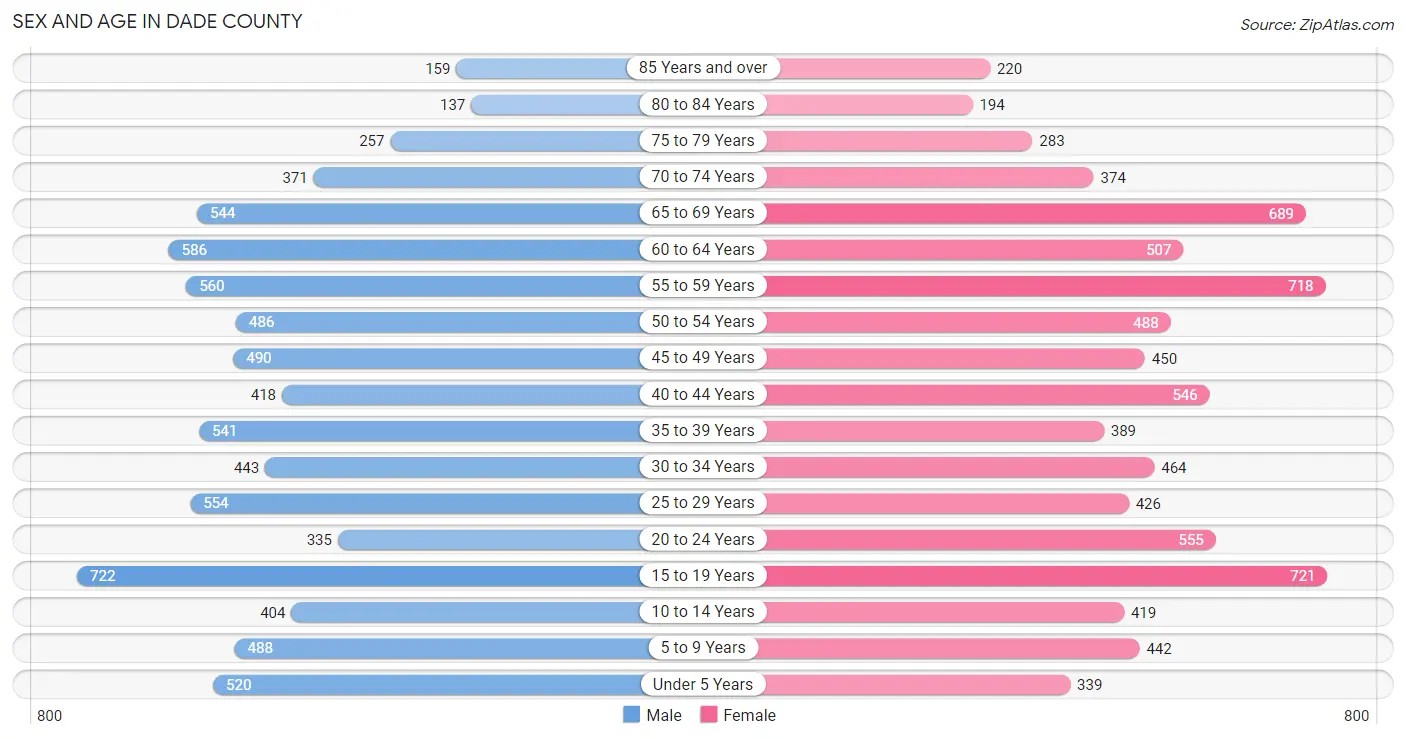
Sex and Age in Dade County
Sex and Age in Dade County
The most populous age groups in Dade County are 15 to 19 Years (722 | 9.0%) for men and 15 to 19 Years (721 | 8.8%) for women.
| Age Bracket | Male | Female |
| Under 5 Years | 520 (6.5%) | 339 (4.1%) |
| 5 to 9 Years | 488 (6.1%) | 442 (5.4%) |
| 10 to 14 Years | 404 (5.0%) | 419 (5.1%) |
| 15 to 19 Years | 722 (9.0%) | 721 (8.8%) |
| 20 to 24 Years | 335 (4.2%) | 555 (6.8%) |
| 25 to 29 Years | 554 (6.9%) | 426 (5.2%) |
| 30 to 34 Years | 443 (5.5%) | 464 (5.6%) |
| 35 to 39 Years | 541 (6.8%) | 389 (4.7%) |
| 40 to 44 Years | 418 (5.2%) | 546 (6.6%) |
| 45 to 49 Years | 490 (6.1%) | 450 (5.5%) |
| 50 to 54 Years | 486 (6.1%) | 488 (5.9%) |
| 55 to 59 Years | 560 (7.0%) | 718 (8.7%) |
| 60 to 64 Years | 586 (7.3%) | 507 (6.2%) |
| 65 to 69 Years | 544 (6.8%) | 689 (8.4%) |
| 70 to 74 Years | 371 (4.6%) | 374 (4.5%) |
| 75 to 79 Years | 257 (3.2%) | 283 (3.4%) |
| 80 to 84 Years | 137 (1.7%) | 194 (2.4%) |
| 85 Years and over | 159 (2.0%) | 220 (2.7%) |
| Total | 8,015 (100.0%) | 8,224 (100.0%) |
Families and Households in Dade County
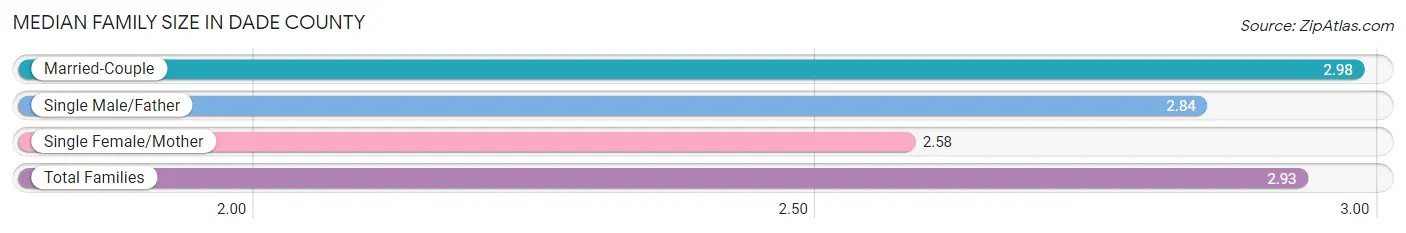
Median Family Size in Dade County
The median family size in Dade County is 2.93 persons per family, with married-couple families (3,691 | 85.2%) accounting for the largest median family size of 2.98 persons per family. On the other hand, single female/mother families (431 | 10.0%) represent the smallest median family size with 2.58 persons per family.
| Family Type | # Families | Family Size |
| Married-Couple | 3,691 (85.2%) | 2.98 |
| Single Male/Father | 211 (4.9%) | 2.84 |
| Single Female/Mother | 431 (10.0%) | 2.58 |
| Total Families | 4,333 (100.0%) | 2.93 |
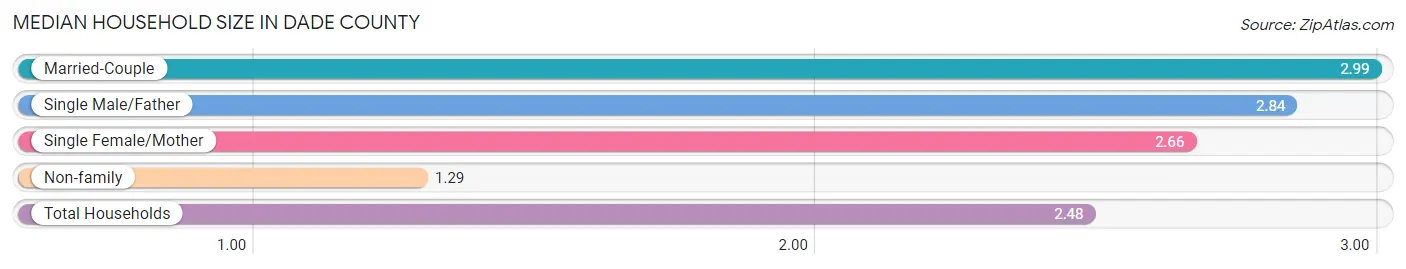
Median Household Size in Dade County
The median household size in Dade County is 2.48 persons per household, with married-couple households (3,691 | 60.8%) accounting for the largest median household size of 2.99 persons per household. non-family households (1,741 | 28.7%) represent the smallest median household size with 1.29 persons per household.
| Household Type | # Households | Household Size |
| Married-Couple | 3,691 (60.8%) | 2.99 |
| Single Male/Father | 211 (3.5%) | 2.84 |
| Single Female/Mother | 431 (7.1%) | 2.66 |
| Non-family | 1,741 (28.7%) | 1.29 |
| Total Households | 6,074 (100.0%) | 2.48 |
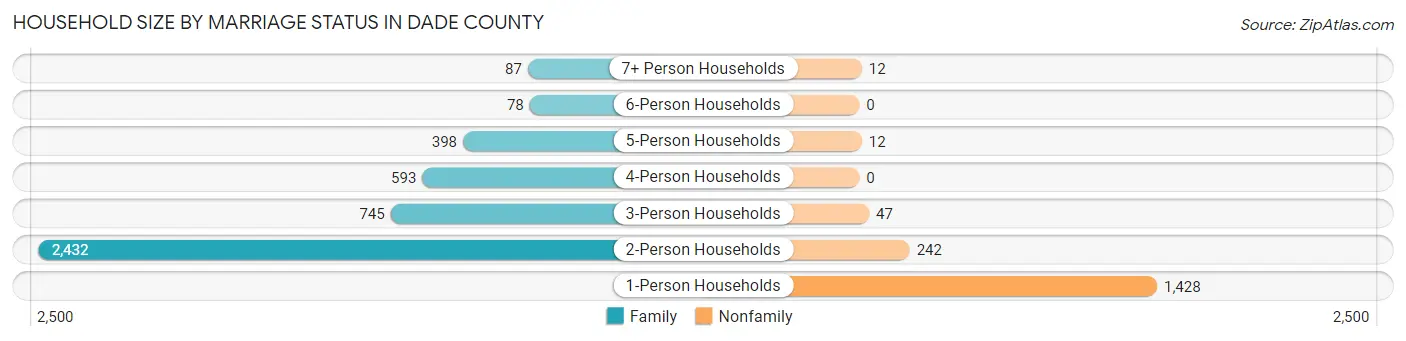
Household Size by Marriage Status in Dade County
Out of a total of 6,074 households in Dade County, 4,333 (71.3%) are family households, while 1,741 (28.7%) are nonfamily households. The most numerous type of family households are 2-person households, comprising 2,432, and the most common type of nonfamily households are 1-person households, comprising 1,428.
| Household Size | Family Households | Nonfamily Households |
| 1-Person Households | - | 1,428 (23.5%) |
| 2-Person Households | 2,432 (40.0%) | 242 (4.0%) |
| 3-Person Households | 745 (12.3%) | 47 (0.8%) |
| 4-Person Households | 593 (9.8%) | 0 (0.0%) |
| 5-Person Households | 398 (6.6%) | 12 (0.2%) |
| 6-Person Households | 78 (1.3%) | 0 (0.0%) |
| 7+ Person Households | 87 (1.4%) | 12 (0.2%) |
| Total | 4,333 (71.3%) | 1,741 (28.7%) |
Female Fertility in Dade County
Fertility by Age in Dade County
Average fertility rate in Dade County is 23.0 births per 1,000 women. Women in the age bracket of 20 to 34 years have the highest fertility rate with 53.0 births per 1,000 women. Women in the age bracket of 20 to 34 years acount for 89.5% of all women with births.
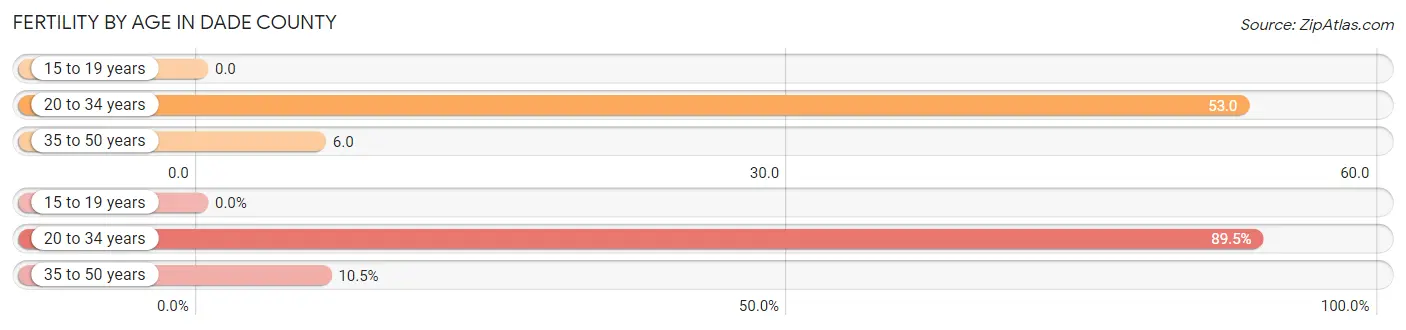
| Age Bracket | Women with Births | Births / 1,000 Women |
| 15 to 19 years | 0 (0.0%) | 0.0 |
| 20 to 34 years | 77 (89.5%) | 53.0 |
| 35 to 50 years | 9 (10.5%) | 6.0 |
| Total | 86 (100.0%) | 23.0 |
Fertility by Age by Marriage Status in Dade County
74.4% of women with births (86) in Dade County are married. The highest percentage of unmarried women with births falls into 20 to 34 years age bracket with 28.6% of them unmarried at the time of birth, while the lowest percentage of unmarried women with births belong to 35 to 50 years age bracket with 0.0% of them unmarried.
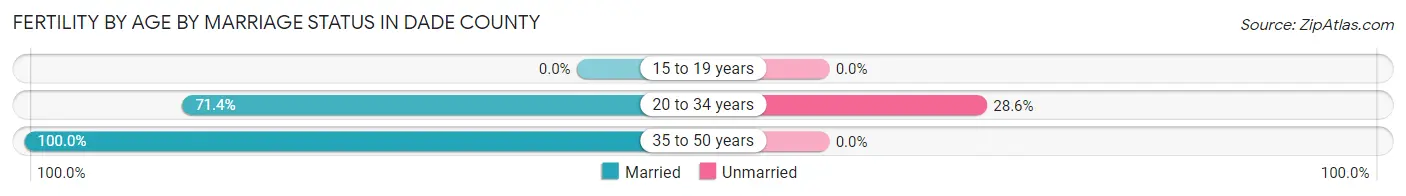
| Age Bracket | Married | Unmarried |
| 15 to 19 years | 0 (0.0%) | 0 (0.0%) |
| 20 to 34 years | 55 (71.4%) | 22 (28.6%) |
| 35 to 50 years | 9 (100.0%) | 0 (0.0%) |
| Total | 64 (74.4%) | 22 (25.6%) |
Fertility by Education in Dade County
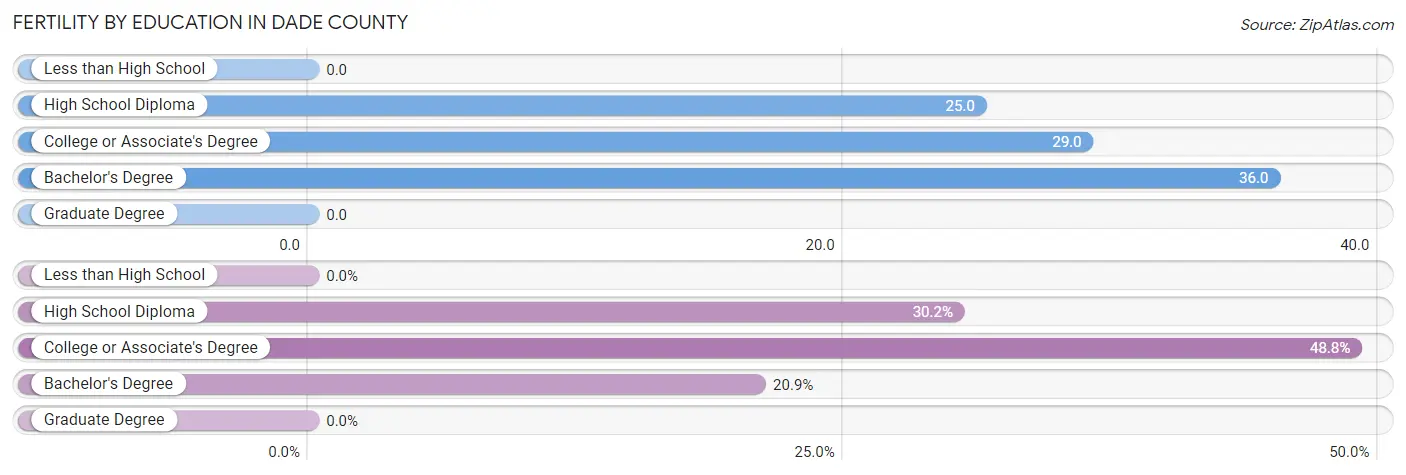
| Educational Attainment | Women with Births | Births / 1,000 Women |
| Less than High School | 0 (0.0%) | 0.0 |
| High School Diploma | 26 (30.2%) | 25.0 |
| College or Associate's Degree | 42 (48.8%) | 29.0 |
| Bachelor's Degree | 18 (20.9%) | 36.0 |
| Graduate Degree | 0 (0.0%) | 0.0 |
| Total | 86 (100.0%) | 23.0 |
Fertility by Education by Marriage Status in Dade County
25.6% of women with births in Dade County are unmarried. Women with the educational attainment of high school diploma are most likely to be married with 100.0% of them married at childbirth, while women with the educational attainment of college or associate's degree are least likely to be married with 52.4% of them unmarried at childbirth.
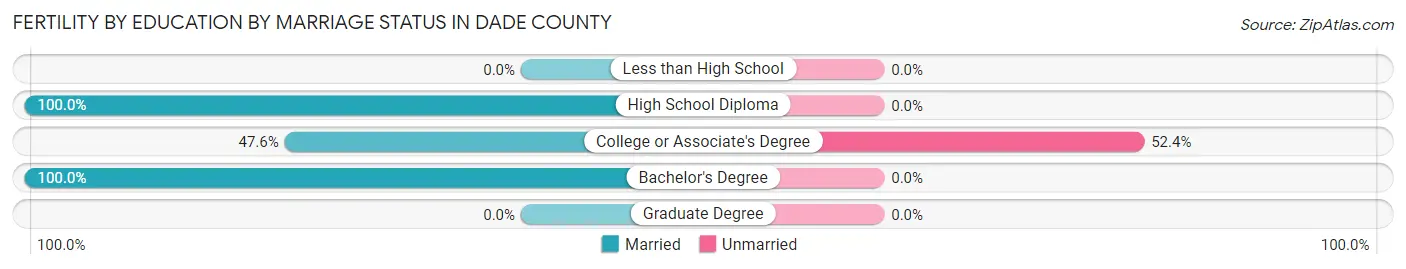
| Educational Attainment | Married | Unmarried |
| Less than High School | 0 (0.0%) | 0 (0.0%) |
| High School Diploma | 26 (100.0%) | 0 (0.0%) |
| College or Associate's Degree | 20 (47.6%) | 22 (52.4%) |
| Bachelor's Degree | 18 (100.0%) | 0 (0.0%) |
| Graduate Degree | 0 (0.0%) | 0 (0.0%) |
| Total | 64 (74.4%) | 22 (25.6%) |
Employment Characteristics in Dade County
Employment by Class of Employer in Dade County
Among the 6,928 employed individuals in Dade County, private company employees (4,823 | 69.6%), not-for-profit organizations (552 | 8.0%), and self-employed (not incorporated) (500 | 7.2%) make up the most common classes of employment.
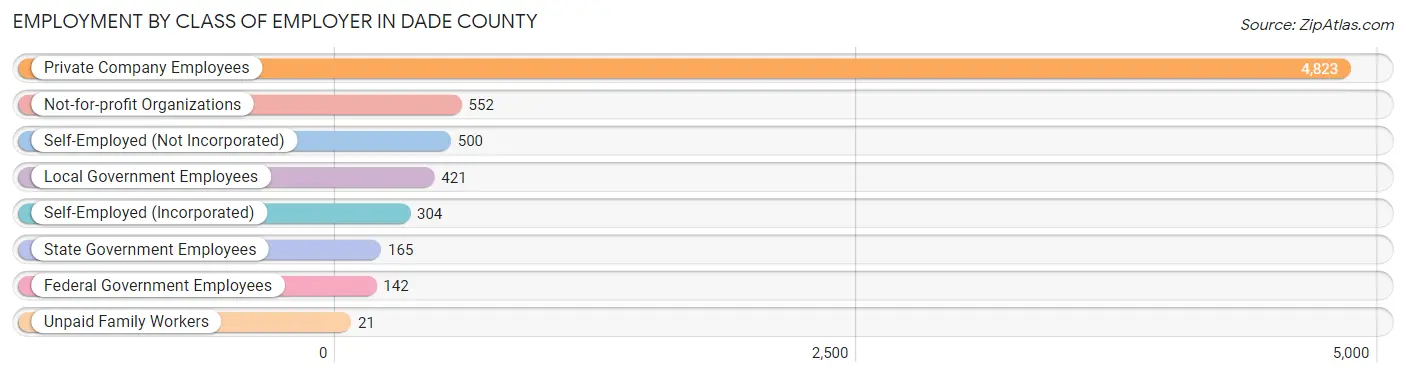
| Employer Class | # Employees | % Employees |
| Private Company Employees | 4,823 | 69.6% |
| Self-Employed (Incorporated) | 304 | 4.4% |
| Self-Employed (Not Incorporated) | 500 | 7.2% |
| Not-for-profit Organizations | 552 | 8.0% |
| Local Government Employees | 421 | 6.1% |
| State Government Employees | 165 | 2.4% |
| Federal Government Employees | 142 | 2.1% |
| Unpaid Family Workers | 21 | 0.3% |
| Total | 6,928 | 100.0% |
Employment Status by Age in Dade County
According to the labor force statistics for Dade County, out of the total population over 16 years of age (13,375), 56.0% or 7,490 individuals are in the labor force, with 5.5% or 412 of them unemployed. The age group with the highest labor force participation rate is 25 to 29 years, with 90.8% or 890 individuals in the labor force. Within the labor force, the 25 to 29 years age range has the highest percentage of unemployed individuals, with 11.2% or 100 of them being unemployed.
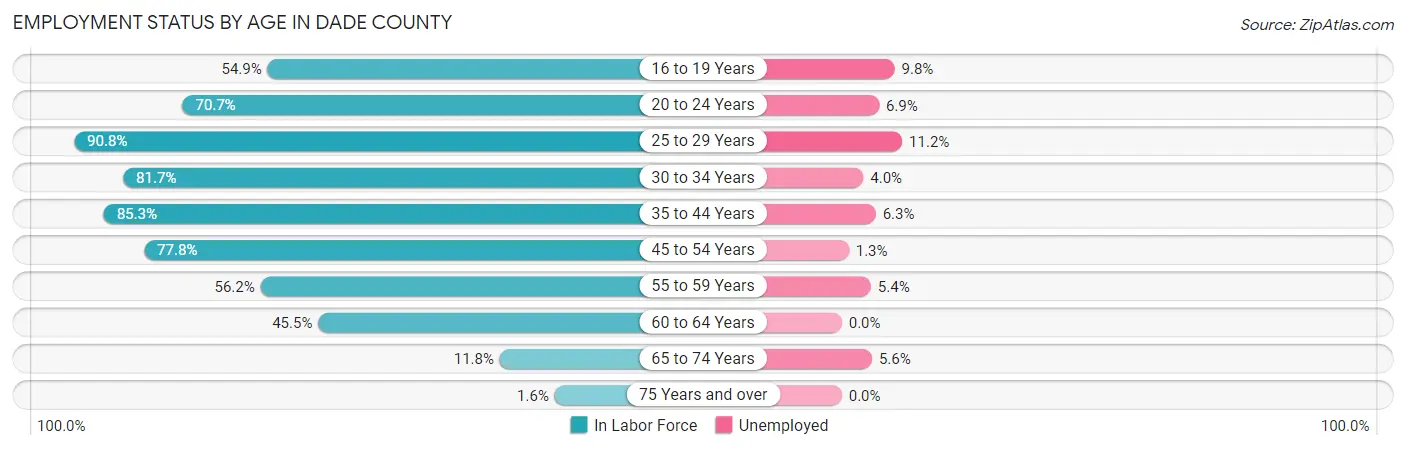
| Age Bracket | In Labor Force | Unemployed |
| 16 to 19 Years | 654 (54.9%) | 64 (9.8%) |
| 20 to 24 Years | 629 (70.7%) | 43 (6.9%) |
| 25 to 29 Years | 890 (90.8%) | 100 (11.2%) |
| 30 to 34 Years | 741 (81.7%) | 30 (4.0%) |
| 35 to 44 Years | 1,616 (85.3%) | 102 (6.3%) |
| 45 to 54 Years | 1,489 (77.8%) | 19 (1.3%) |
| 55 to 59 Years | 718 (56.2%) | 39 (5.4%) |
| 60 to 64 Years | 497 (45.5%) | 0 (0.0%) |
| 65 to 74 Years | 233 (11.8%) | 13 (5.6%) |
| 75 Years and over | 20 (1.6%) | 0 (0.0%) |
| Total | 7,490 (56.0%) | 412 (5.5%) |
Employment Status by Educational Attainment in Dade County
According to labor force statistics for Dade County, 73.8% of individuals (5,953) out of the total population between 25 and 64 years of age (8,066) are in the labor force, with 4.9% or 292 of them being unemployed. The group with the highest labor force participation rate are those with the educational attainment of bachelor's degree or higher, with 86.5% or 1,301 individuals in the labor force. Within the labor force, individuals with bachelor's degree or higher education have the highest percentage of unemployment, with 8.8% or 114 of them being unemployed.
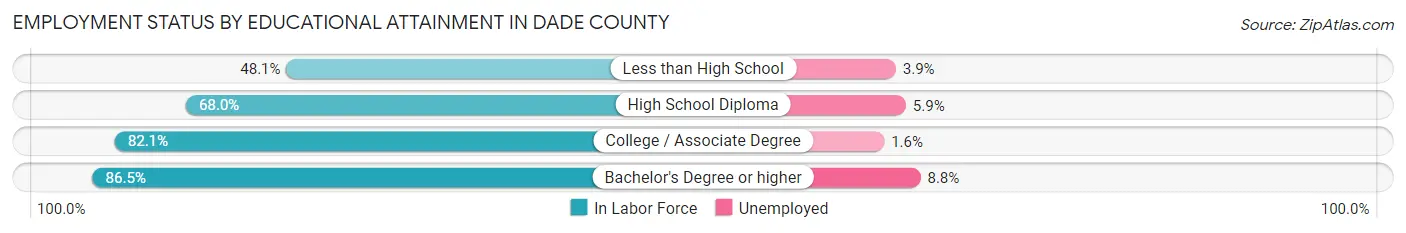
| Educational Attainment | In Labor Force | Unemployed |
| Less than High School | 411 (48.1%) | 33 (3.9%) |
| High School Diploma | 2,164 (68.0%) | 188 (5.9%) |
| College / Associate Degree | 2,073 (82.1%) | 40 (1.6%) |
| Bachelor's Degree or higher | 1,301 (86.5%) | 132 (8.8%) |
| Total | 5,953 (73.8%) | 395 (4.9%) |
Employment Occupations by Sex in Dade County
Management, Business, Science and Arts Occupations
The most common Management, Business, Science and Arts occupations in Dade County are Management (730 | 10.3%), Community & Social Service (547 | 7.7%), Computers, Engineering & Science (375 | 5.3%), Education Instruction & Library (352 | 5.0%), and Business & Financial (222 | 3.1%).

Management, Business, Science and Arts Occupations by Sex
Within the Management, Business, Science and Arts occupations in Dade County, the most male-oriented occupations are Computers & Mathematics (92.6%), Architecture & Engineering (88.9%), and Computers, Engineering & Science (80.0%), while the most female-oriented occupations are Health Diagnosing & Treating (94.5%), Health Technologists (93.7%), and Arts, Media & Entertainment (85.4%).
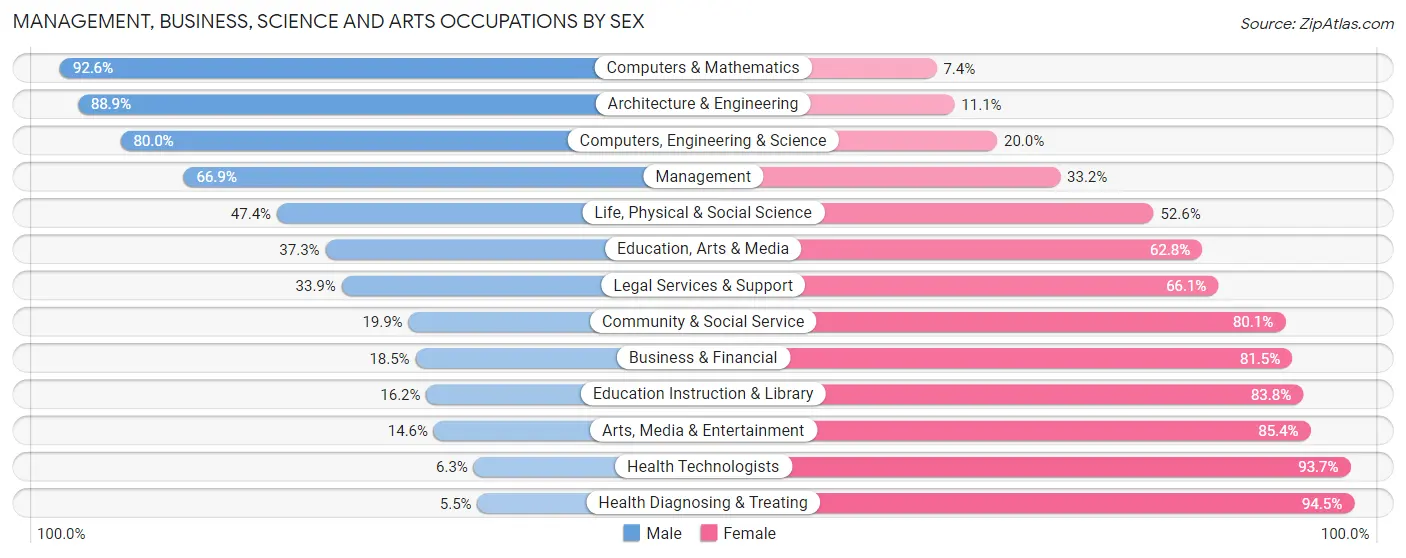
| Occupation | Male | Female |
| Management | 488 (66.8%) | 242 (33.2%) |
| Business & Financial | 41 (18.5%) | 181 (81.5%) |
| Computers, Engineering & Science | 300 (80.0%) | 75 (20.0%) |
| Computers & Mathematics | 151 (92.6%) | 12 (7.4%) |
| Architecture & Engineering | 104 (88.9%) | 13 (11.1%) |
| Life, Physical & Social Science | 45 (47.4%) | 50 (52.6%) |
| Community & Social Service | 109 (19.9%) | 438 (80.1%) |
| Education, Arts & Media | 19 (37.2%) | 32 (62.7%) |
| Legal Services & Support | 21 (33.9%) | 41 (66.1%) |
| Education Instruction & Library | 57 (16.2%) | 295 (83.8%) |
| Arts, Media & Entertainment | 12 (14.6%) | 70 (85.4%) |
| Health Diagnosing & Treating | 12 (5.5%) | 205 (94.5%) |
| Health Technologists | 12 (6.3%) | 178 (93.7%) |
| Total (Category) | 950 (45.4%) | 1,141 (54.6%) |
| Total (Overall) | 3,748 (53.0%) | 3,325 (47.0%) |
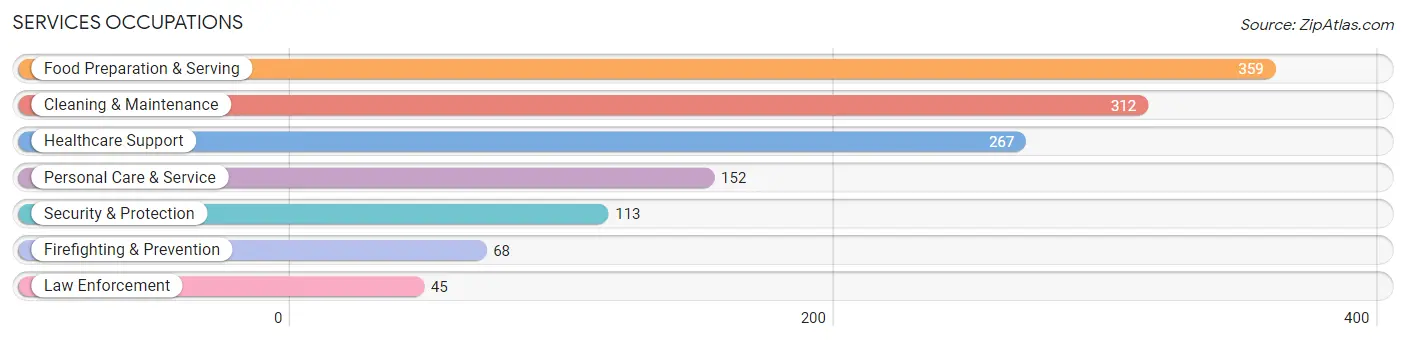
Services Occupations
The most common Services occupations in Dade County are Food Preparation & Serving (359 | 5.1%), Cleaning & Maintenance (312 | 4.4%), Healthcare Support (267 | 3.8%), Personal Care & Service (152 | 2.1%), and Security & Protection (113 | 1.6%).
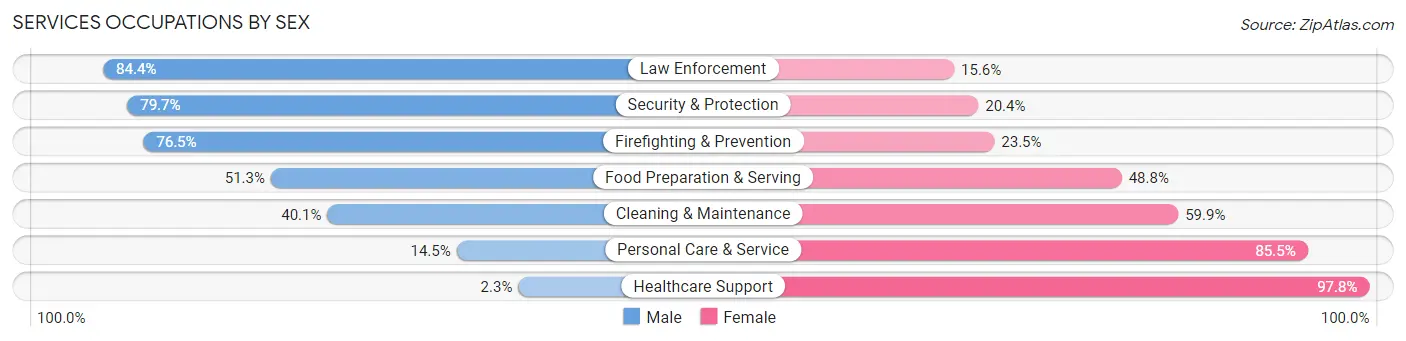
Services Occupations by Sex
Within the Services occupations in Dade County, the most male-oriented occupations are Law Enforcement (84.4%), Security & Protection (79.6%), and Firefighting & Prevention (76.5%), while the most female-oriented occupations are Healthcare Support (97.8%), Personal Care & Service (85.5%), and Cleaning & Maintenance (59.9%).
| Occupation | Male | Female |
| Healthcare Support | 6 (2.2%) | 261 (97.8%) |
| Security & Protection | 90 (79.6%) | 23 (20.3%) |
| Firefighting & Prevention | 52 (76.5%) | 16 (23.5%) |
| Law Enforcement | 38 (84.4%) | 7 (15.6%) |
| Food Preparation & Serving | 184 (51.2%) | 175 (48.7%) |
| Cleaning & Maintenance | 125 (40.1%) | 187 (59.9%) |
| Personal Care & Service | 22 (14.5%) | 130 (85.5%) |
| Total (Category) | 427 (35.5%) | 776 (64.5%) |
| Total (Overall) | 3,748 (53.0%) | 3,325 (47.0%) |
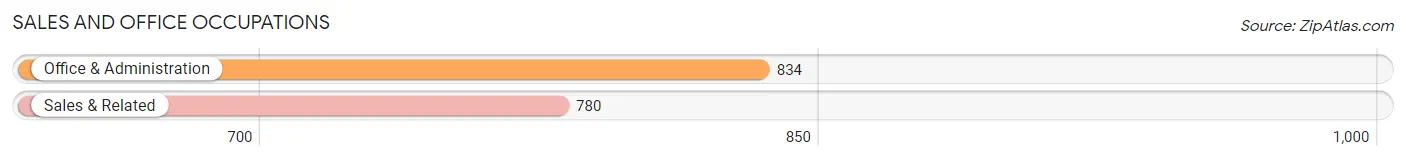
Sales and Office Occupations
The most common Sales and Office occupations in Dade County are Office & Administration (834 | 11.8%), and Sales & Related (780 | 11.0%).
Sales and Office Occupations by Sex

| Occupation | Male | Female |
| Sales & Related | 438 (56.1%) | 342 (43.9%) |
| Office & Administration | 62 (7.4%) | 772 (92.6%) |
| Total (Category) | 500 (31.0%) | 1,114 (69.0%) |
| Total (Overall) | 3,748 (53.0%) | 3,325 (47.0%) |
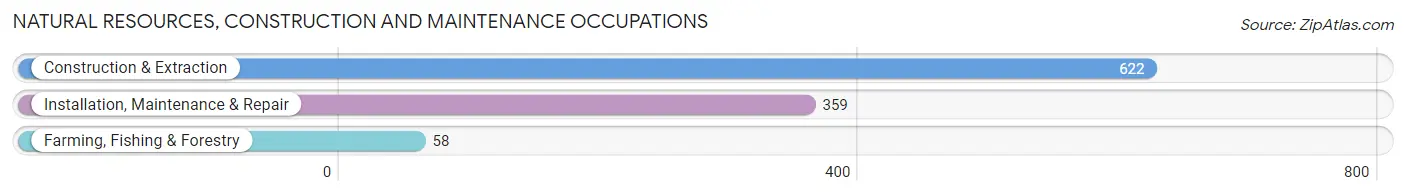
Natural Resources, Construction and Maintenance Occupations
The most common Natural Resources, Construction and Maintenance occupations in Dade County are Construction & Extraction (622 | 8.8%), Installation, Maintenance & Repair (359 | 5.1%), and Farming, Fishing & Forestry (58 | 0.8%).
Natural Resources, Construction and Maintenance Occupations by Sex
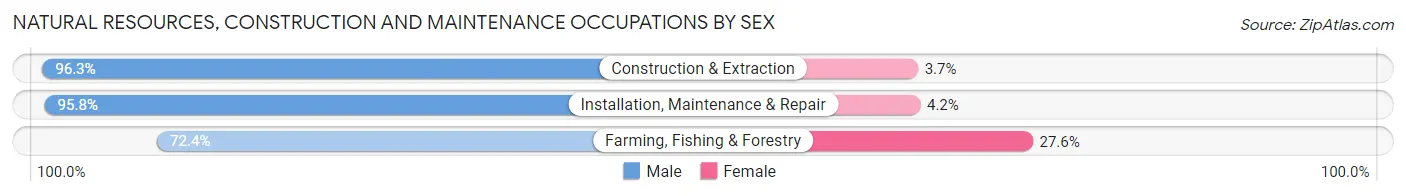
| Occupation | Male | Female |
| Farming, Fishing & Forestry | 42 (72.4%) | 16 (27.6%) |
| Construction & Extraction | 599 (96.3%) | 23 (3.7%) |
| Installation, Maintenance & Repair | 344 (95.8%) | 15 (4.2%) |
| Total (Category) | 985 (94.8%) | 54 (5.2%) |
| Total (Overall) | 3,748 (53.0%) | 3,325 (47.0%) |
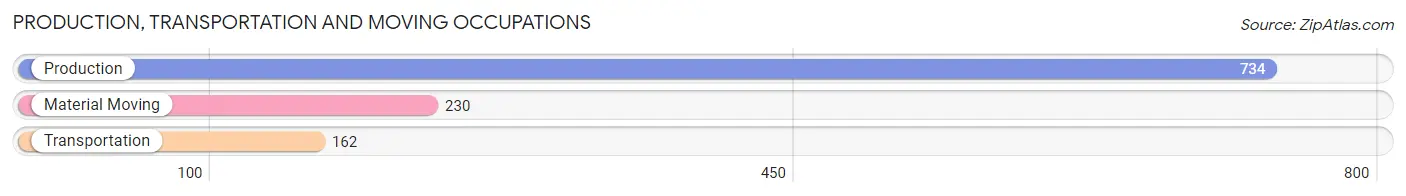
Production, Transportation and Moving Occupations
The most common Production, Transportation and Moving occupations in Dade County are Production (734 | 10.4%), Material Moving (230 | 3.3%), and Transportation (162 | 2.3%).
Production, Transportation and Moving Occupations by Sex
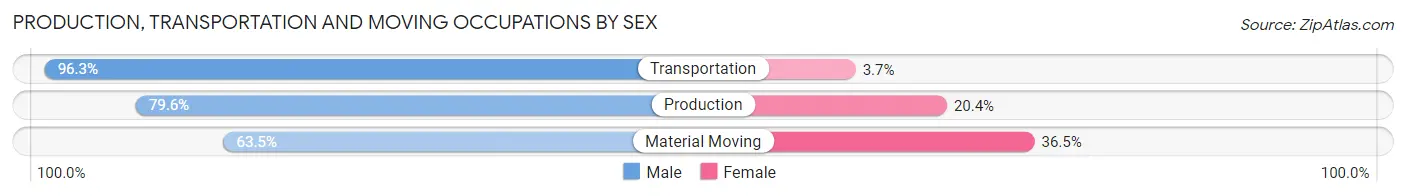
| Occupation | Male | Female |
| Production | 584 (79.6%) | 150 (20.4%) |
| Transportation | 156 (96.3%) | 6 (3.7%) |
| Material Moving | 146 (63.5%) | 84 (36.5%) |
| Total (Category) | 886 (78.7%) | 240 (21.3%) |
| Total (Overall) | 3,748 (53.0%) | 3,325 (47.0%) |
Employment Industries by Sex in Dade County
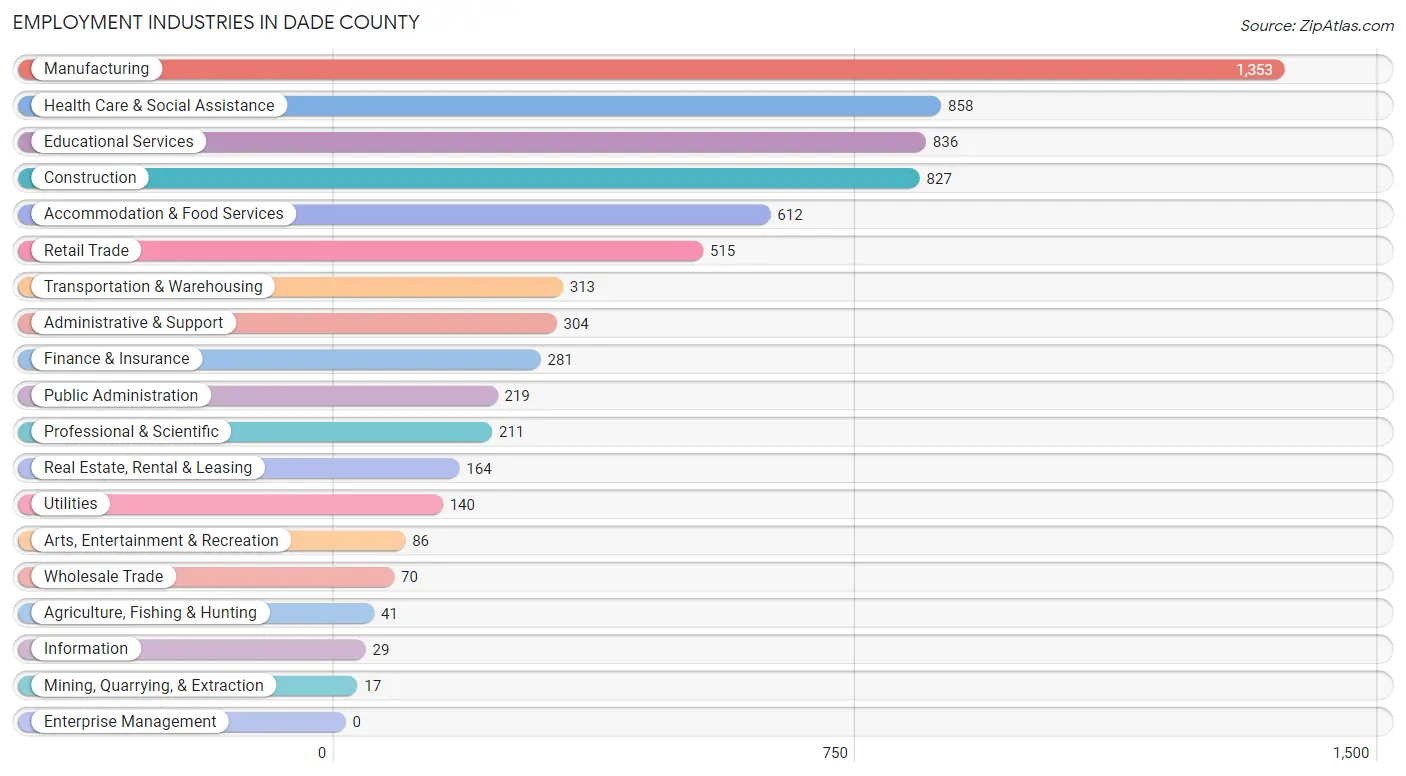
Employment Industries in Dade County
The major employment industries in Dade County include Manufacturing (1,353 | 19.1%), Health Care & Social Assistance (858 | 12.1%), Educational Services (836 | 11.8%), Construction (827 | 11.7%), and Accommodation & Food Services (612 | 8.6%).
Employment Industries by Sex in Dade County
The Dade County industries that see more men than women are Mining, Quarrying, & Extraction (100.0%), Utilities (93.6%), and Construction (91.7%), whereas the industries that tend to have a higher number of women are Health Care & Social Assistance (88.9%), Real Estate, Rental & Leasing (81.7%), and Public Administration (75.8%).
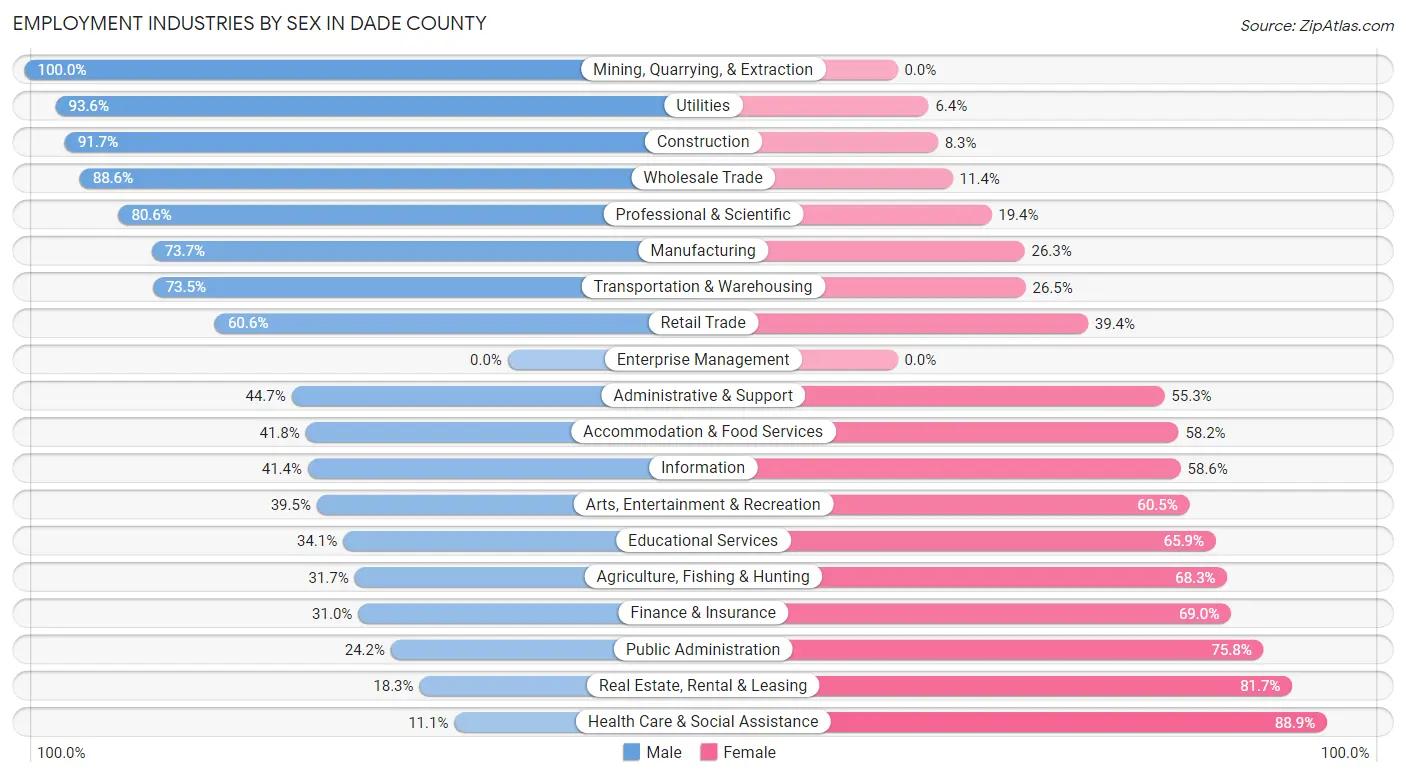
| Industry | Male | Female |
| Agriculture, Fishing & Hunting | 13 (31.7%) | 28 (68.3%) |
| Mining, Quarrying, & Extraction | 17 (100.0%) | 0 (0.0%) |
| Construction | 758 (91.7%) | 69 (8.3%) |
| Manufacturing | 997 (73.7%) | 356 (26.3%) |
| Wholesale Trade | 62 (88.6%) | 8 (11.4%) |
| Retail Trade | 312 (60.6%) | 203 (39.4%) |
| Transportation & Warehousing | 230 (73.5%) | 83 (26.5%) |
| Utilities | 131 (93.6%) | 9 (6.4%) |
| Information | 12 (41.4%) | 17 (58.6%) |
| Finance & Insurance | 87 (31.0%) | 194 (69.0%) |
| Real Estate, Rental & Leasing | 30 (18.3%) | 134 (81.7%) |
| Professional & Scientific | 170 (80.6%) | 41 (19.4%) |
| Enterprise Management | 0 (0.0%) | 0 (0.0%) |
| Administrative & Support | 136 (44.7%) | 168 (55.3%) |
| Educational Services | 285 (34.1%) | 551 (65.9%) |
| Health Care & Social Assistance | 95 (11.1%) | 763 (88.9%) |
| Arts, Entertainment & Recreation | 34 (39.5%) | 52 (60.5%) |
| Accommodation & Food Services | 256 (41.8%) | 356 (58.2%) |
| Public Administration | 53 (24.2%) | 166 (75.8%) |
| Total | 3,748 (53.0%) | 3,325 (47.0%) |
Education in Dade County
School Enrollment in Dade County
The most common levels of schooling among the 4,010 students in Dade County are college / undergraduate (1,520 | 37.9%), elementary school (833 | 20.8%), and high school (574 | 14.3%).
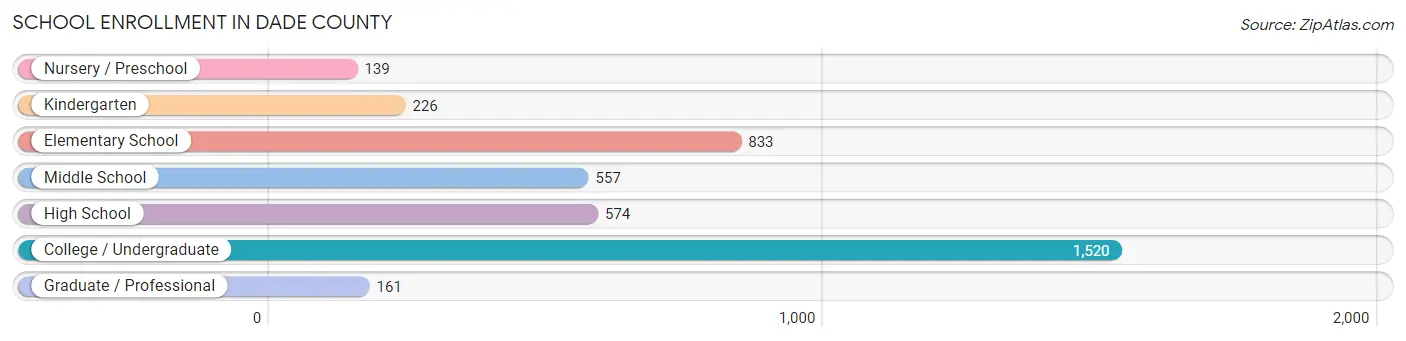
| School Level | # Students | % Students |
| Nursery / Preschool | 139 | 3.5% |
| Kindergarten | 226 | 5.6% |
| Elementary School | 833 | 20.8% |
| Middle School | 557 | 13.9% |
| High School | 574 | 14.3% |
| College / Undergraduate | 1,520 | 37.9% |
| Graduate / Professional | 161 | 4.0% |
| Total | 4,010 | 100.0% |
School Enrollment by Age by Funding Source in Dade County
Out of a total of 4,010 students who are enrolled in schools in Dade County, 1,283 (32.0%) attend a private institution, while the remaining 2,727 (68.0%) are enrolled in public schools. The age group of 20 to 24 year olds has the highest likelihood of being enrolled in private schools, with 531 (83.0% in the age bracket) enrolled. Conversely, the age group of 35 years and over has the lowest likelihood of being enrolled in a private school, with 132 (95.0% in the age bracket) attending a public institution.
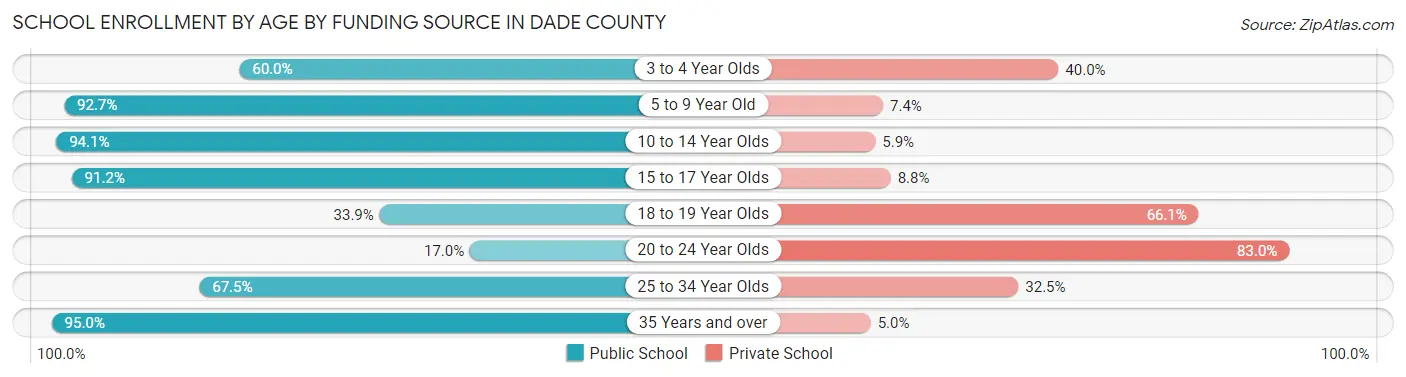
| Age Bracket | Public School | Private School |
| 3 to 4 Year Olds | 75 (60.0%) | 50 (40.0%) |
| 5 to 9 Year Old | 832 (92.6%) | 66 (7.3%) |
| 10 to 14 Year Olds | 670 (94.1%) | 42 (5.9%) |
| 15 to 17 Year Olds | 479 (91.2%) | 46 (8.8%) |
| 18 to 19 Year Olds | 229 (33.9%) | 447 (66.1%) |
| 20 to 24 Year Olds | 109 (17.0%) | 531 (83.0%) |
| 25 to 34 Year Olds | 199 (67.5%) | 96 (32.5%) |
| 35 Years and over | 132 (95.0%) | 7 (5.0%) |
| Total | 2,727 (68.0%) | 1,283 (32.0%) |
Educational Attainment by Field of Study in Dade County
Business (467 | 21.0%), education (347 | 15.6%), bio, nature & agricultural (245 | 11.0%), science & technology (221 | 10.0%), and computers & mathematics (172 | 7.7%) are the most common fields of study among 2,220 individuals in Dade County who have obtained a bachelor's degree or higher.
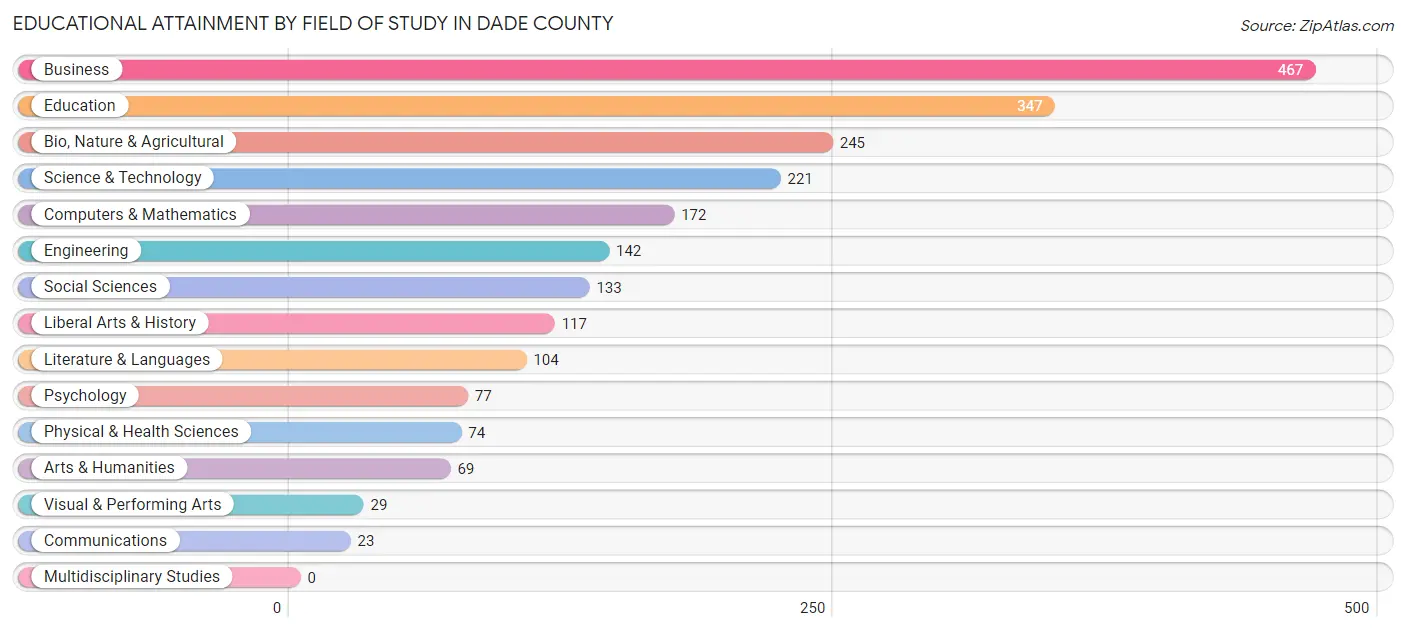
| Field of Study | # Graduates | % Graduates |
| Computers & Mathematics | 172 | 7.7% |
| Bio, Nature & Agricultural | 245 | 11.0% |
| Physical & Health Sciences | 74 | 3.3% |
| Psychology | 77 | 3.5% |
| Social Sciences | 133 | 6.0% |
| Engineering | 142 | 6.4% |
| Multidisciplinary Studies | 0 | 0.0% |
| Science & Technology | 221 | 10.0% |
| Business | 467 | 21.0% |
| Education | 347 | 15.6% |
| Literature & Languages | 104 | 4.7% |
| Liberal Arts & History | 117 | 5.3% |
| Visual & Performing Arts | 29 | 1.3% |
| Communications | 23 | 1.0% |
| Arts & Humanities | 69 | 3.1% |
| Total | 2,220 | 100.0% |
Transportation & Commute in Dade County
Vehicle Availability by Sex in Dade County
The most prevalent vehicle ownership categories in Dade County are males with 2 vehicles (1,377, accounting for 39.8%) and females with 2 vehicles (1,188, making up 46.8%).
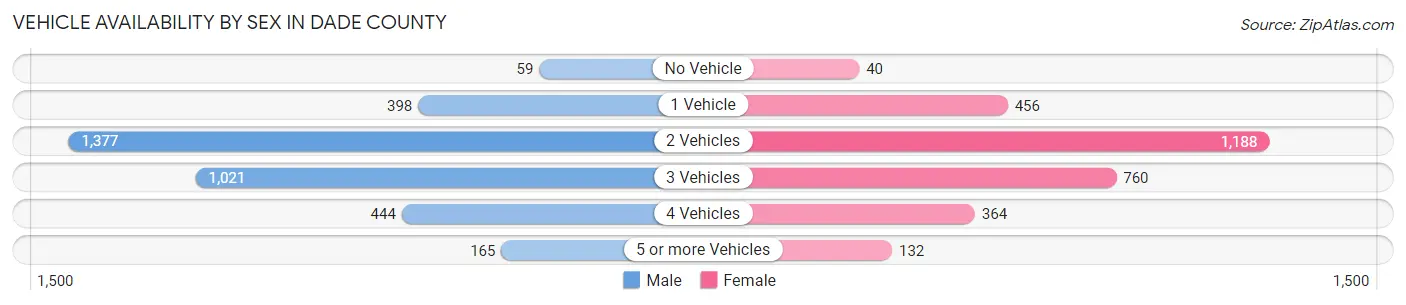
| Vehicles Available | Male | Female |
| No Vehicle | 59 (1.7%) | 40 (1.4%) |
| 1 Vehicle | 398 (11.5%) | 456 (15.5%) |
| 2 Vehicles | 1,377 (39.8%) | 1,188 (40.4%) |
| 3 Vehicles | 1,021 (29.5%) | 760 (25.9%) |
| 4 Vehicles | 444 (12.8%) | 364 (12.4%) |
| 5 or more Vehicles | 165 (4.8%) | 132 (4.5%) |
| Total | 3,464 (100.0%) | 2,940 (100.0%) |
Commute Time in Dade County
The most frequently occuring commute durations in Dade County are 30 to 34 minutes (1,049 commuters, 16.8%), 15 to 19 minutes (738 commuters, 11.8%), and 5 to 9 minutes (733 commuters, 11.7%).
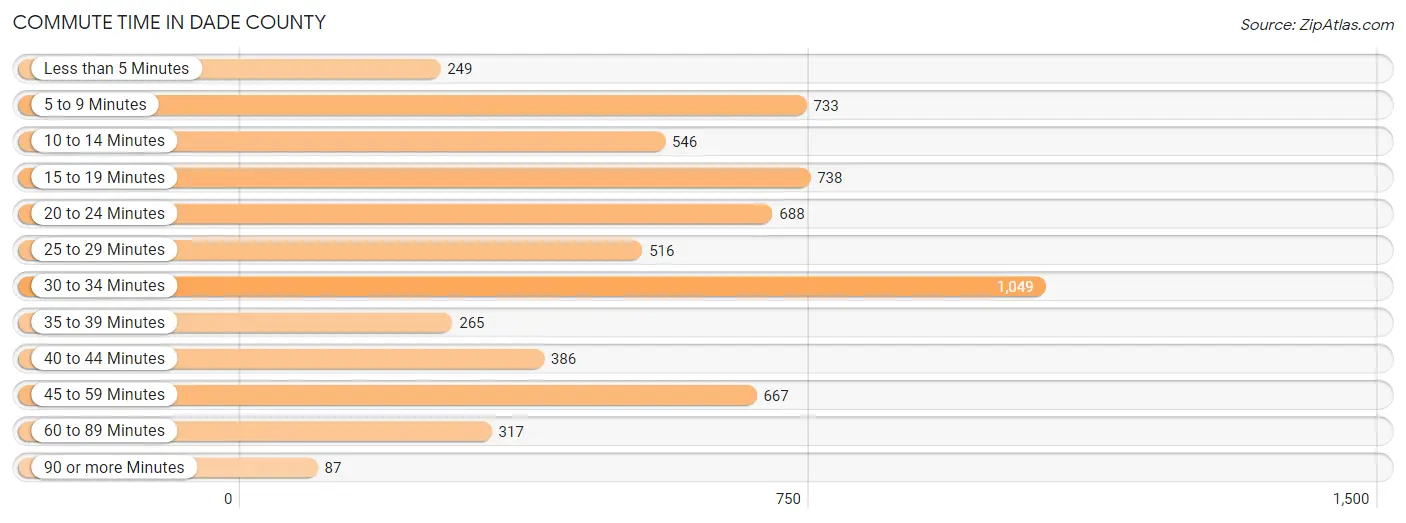
| Commute Time | # Commuters | % Commuters |
| Less than 5 Minutes | 249 | 4.0% |
| 5 to 9 Minutes | 733 | 11.7% |
| 10 to 14 Minutes | 546 | 8.7% |
| 15 to 19 Minutes | 738 | 11.8% |
| 20 to 24 Minutes | 688 | 11.0% |
| 25 to 29 Minutes | 516 | 8.3% |
| 30 to 34 Minutes | 1,049 | 16.8% |
| 35 to 39 Minutes | 265 | 4.3% |
| 40 to 44 Minutes | 386 | 6.2% |
| 45 to 59 Minutes | 667 | 10.7% |
| 60 to 89 Minutes | 317 | 5.1% |
| 90 or more Minutes | 87 | 1.4% |
Commute Time by Sex in Dade County
The most common commute times in Dade County are 30 to 34 minutes (616 commuters, 18.3%) for males and 15 to 19 minutes (436 commuters, 15.2%) for females.
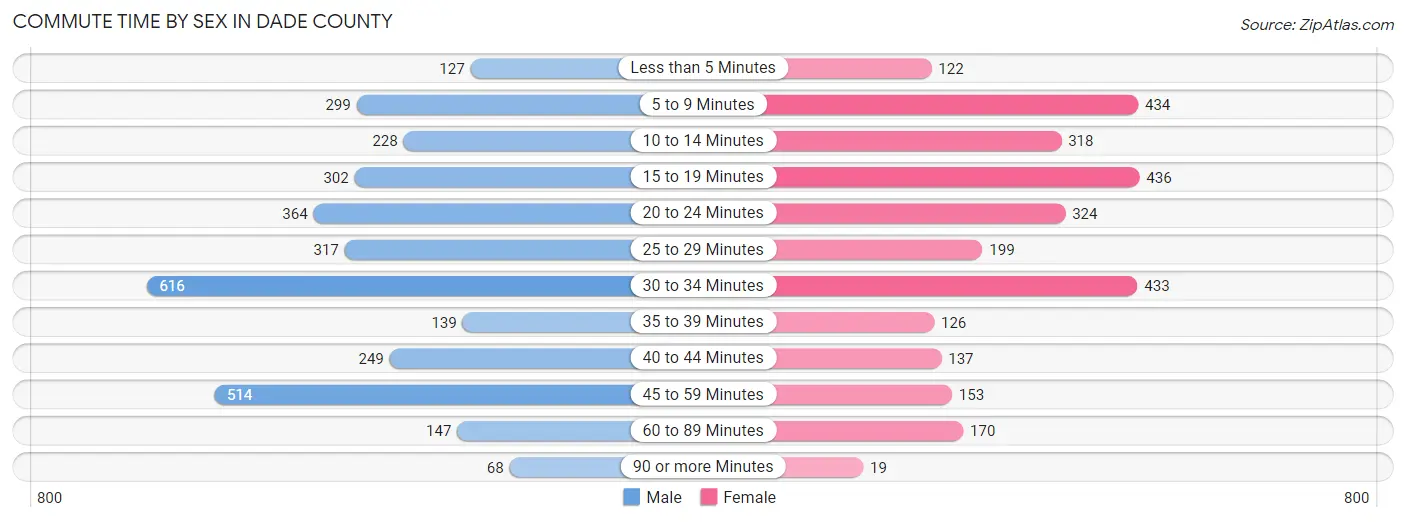
| Commute Time | Male | Female |
| Less than 5 Minutes | 127 (3.8%) | 122 (4.3%) |
| 5 to 9 Minutes | 299 (8.9%) | 434 (15.1%) |
| 10 to 14 Minutes | 228 (6.8%) | 318 (11.1%) |
| 15 to 19 Minutes | 302 (9.0%) | 436 (15.2%) |
| 20 to 24 Minutes | 364 (10.8%) | 324 (11.3%) |
| 25 to 29 Minutes | 317 (9.4%) | 199 (6.9%) |
| 30 to 34 Minutes | 616 (18.3%) | 433 (15.1%) |
| 35 to 39 Minutes | 139 (4.1%) | 126 (4.4%) |
| 40 to 44 Minutes | 249 (7.4%) | 137 (4.8%) |
| 45 to 59 Minutes | 514 (15.2%) | 153 (5.3%) |
| 60 to 89 Minutes | 147 (4.4%) | 170 (5.9%) |
| 90 or more Minutes | 68 (2.0%) | 19 (0.7%) |
Time of Departure to Work by Sex in Dade County
The most frequent times of departure to work in Dade County are 7:00 AM to 7:29 AM (450, 13.4%) for males and 7:30 AM to 7:59 AM (574, 20.0%) for females.
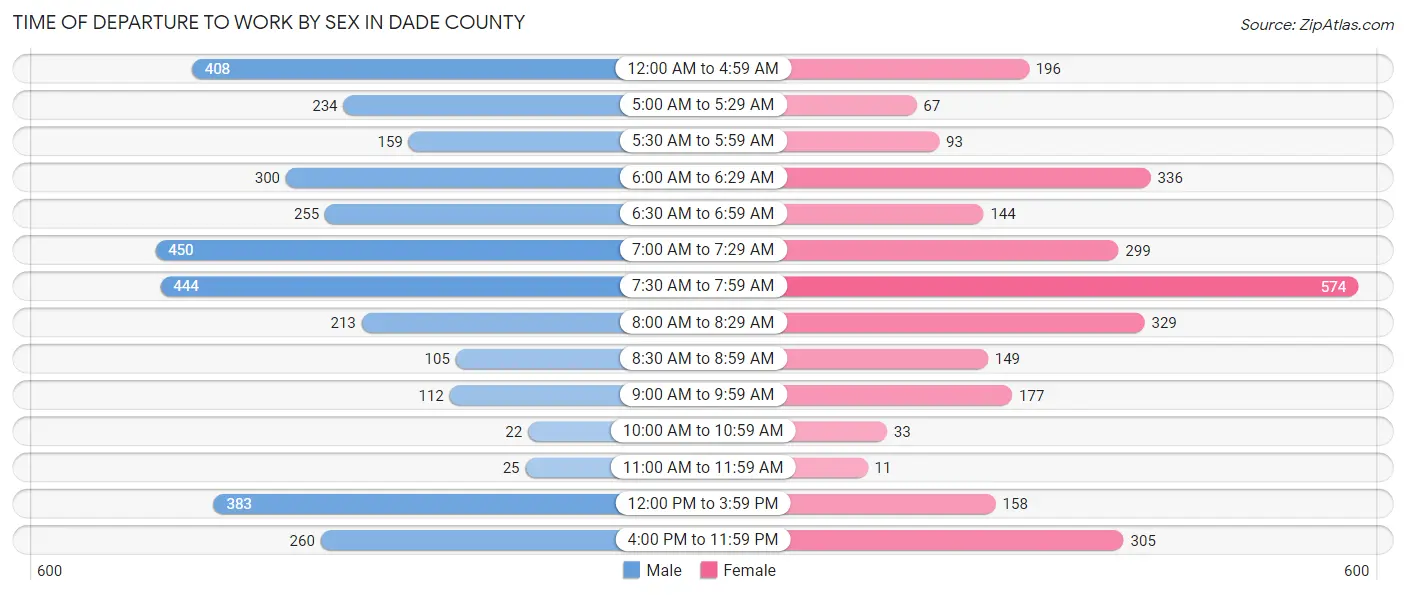
| Time of Departure | Male | Female |
| 12:00 AM to 4:59 AM | 408 (12.1%) | 196 (6.8%) |
| 5:00 AM to 5:29 AM | 234 (6.9%) | 67 (2.3%) |
| 5:30 AM to 5:59 AM | 159 (4.7%) | 93 (3.2%) |
| 6:00 AM to 6:29 AM | 300 (8.9%) | 336 (11.7%) |
| 6:30 AM to 6:59 AM | 255 (7.6%) | 144 (5.0%) |
| 7:00 AM to 7:29 AM | 450 (13.4%) | 299 (10.4%) |
| 7:30 AM to 7:59 AM | 444 (13.2%) | 574 (20.0%) |
| 8:00 AM to 8:29 AM | 213 (6.3%) | 329 (11.5%) |
| 8:30 AM to 8:59 AM | 105 (3.1%) | 149 (5.2%) |
| 9:00 AM to 9:59 AM | 112 (3.3%) | 177 (6.2%) |
| 10:00 AM to 10:59 AM | 22 (0.6%) | 33 (1.1%) |
| 11:00 AM to 11:59 AM | 25 (0.7%) | 11 (0.4%) |
| 12:00 PM to 3:59 PM | 383 (11.4%) | 158 (5.5%) |
| 4:00 PM to 11:59 PM | 260 (7.7%) | 305 (10.6%) |
| Total | 3,370 (100.0%) | 2,871 (100.0%) |
Housing Occupancy in Dade County
Occupancy by Ownership in Dade County
Of the total 6,074 dwellings in Dade County, owner-occupied units account for 4,639 (76.4%), while renter-occupied units make up 1,435 (23.6%).
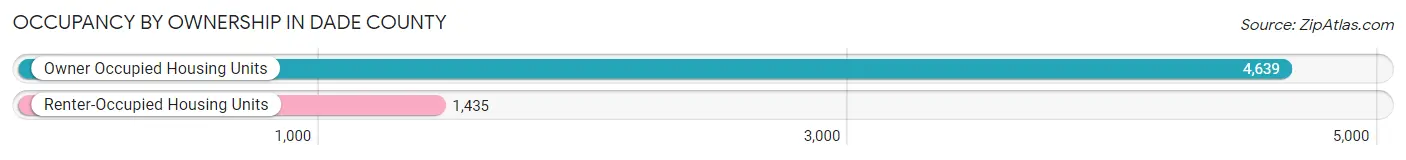
| Occupancy | # Housing Units | % Housing Units |
| Owner Occupied Housing Units | 4,639 | 76.4% |
| Renter-Occupied Housing Units | 1,435 | 23.6% |
| Total Occupied Housing Units | 6,074 | 100.0% |
Occupancy by Household Size in Dade County
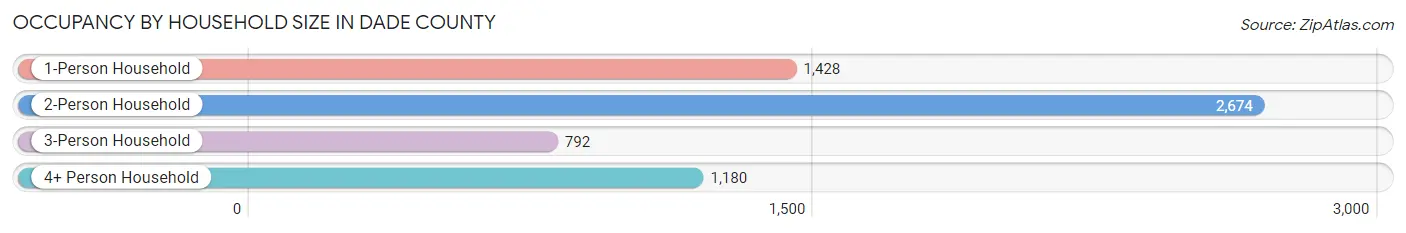
| Household Size | # Housing Units | % Housing Units |
| 1-Person Household | 1,428 | 23.5% |
| 2-Person Household | 2,674 | 44.0% |
| 3-Person Household | 792 | 13.0% |
| 4+ Person Household | 1,180 | 19.4% |
| Total Housing Units | 6,074 | 100.0% |
Occupancy by Ownership by Household Size in Dade County
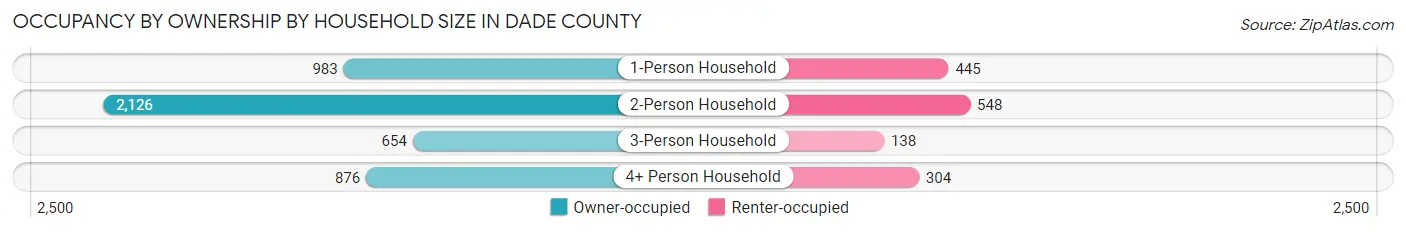
| Household Size | Owner-occupied | Renter-occupied |
| 1-Person Household | 983 (68.8%) | 445 (31.2%) |
| 2-Person Household | 2,126 (79.5%) | 548 (20.5%) |
| 3-Person Household | 654 (82.6%) | 138 (17.4%) |
| 4+ Person Household | 876 (74.2%) | 304 (25.8%) |
| Total Housing Units | 4,639 (76.4%) | 1,435 (23.6%) |
Occupancy by Educational Attainment in Dade County
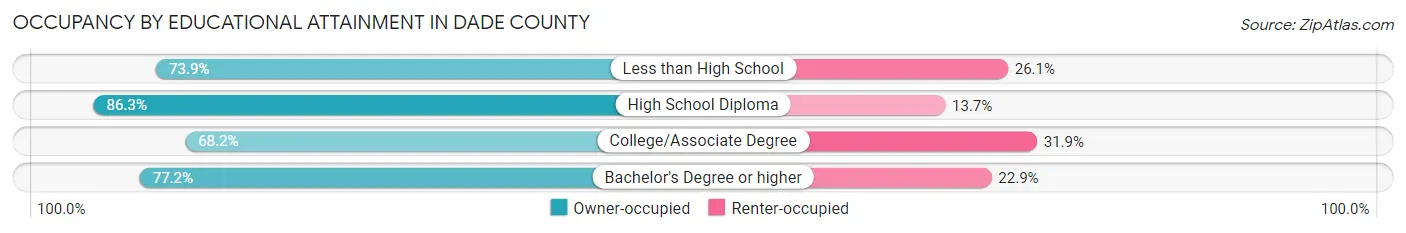
| Household Size | Owner-occupied | Renter-occupied |
| Less than High School | 609 (73.9%) | 215 (26.1%) |
| High School Diploma | 1,655 (86.3%) | 262 (13.7%) |
| College/Associate Degree | 1,487 (68.1%) | 695 (31.9%) |
| Bachelor's Degree or higher | 888 (77.1%) | 263 (22.9%) |
Occupancy by Age of Householder in Dade County
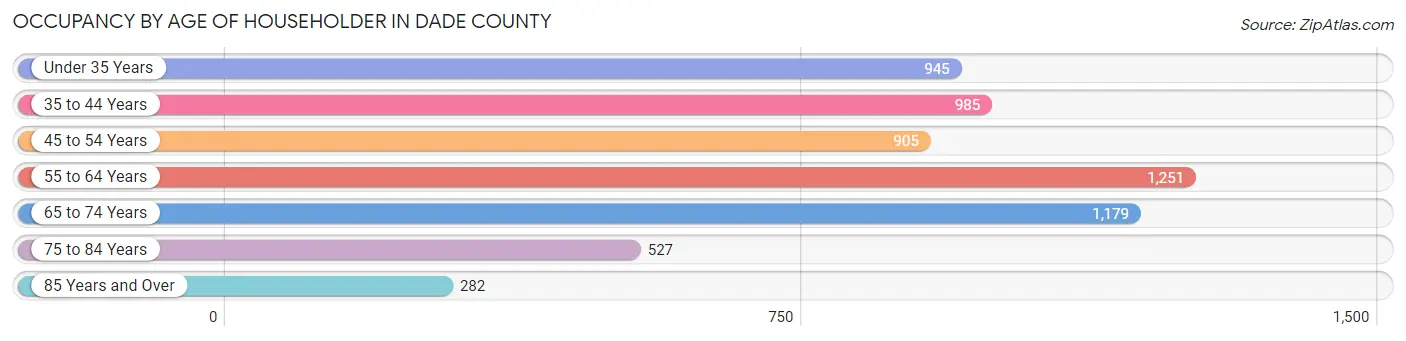
| Age Bracket | # Households | % Households |
| Under 35 Years | 945 | 15.6% |
| 35 to 44 Years | 985 | 16.2% |
| 45 to 54 Years | 905 | 14.9% |
| 55 to 64 Years | 1,251 | 20.6% |
| 65 to 74 Years | 1,179 | 19.4% |
| 75 to 84 Years | 527 | 8.7% |
| 85 Years and Over | 282 | 4.6% |
| Total | 6,074 | 100.0% |
Housing Finances in Dade County
Median Income by Occupancy in Dade County
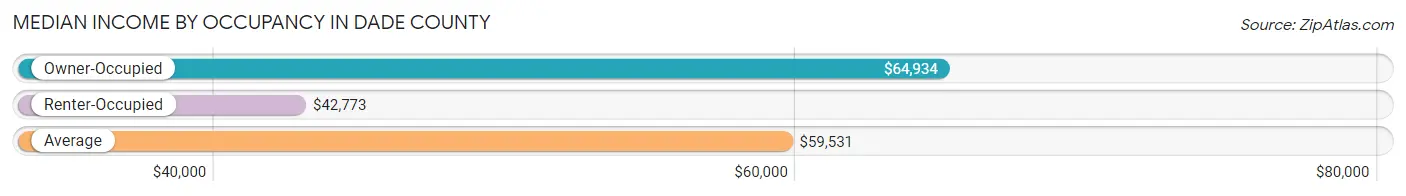
| Occupancy Type | # Households | Median Income |
| Owner-Occupied | 4,639 (76.4%) | $64,934 |
| Renter-Occupied | 1,435 (23.6%) | $42,773 |
| Average | 6,074 (100.0%) | $59,531 |
Occupancy by Householder Income Bracket in Dade County
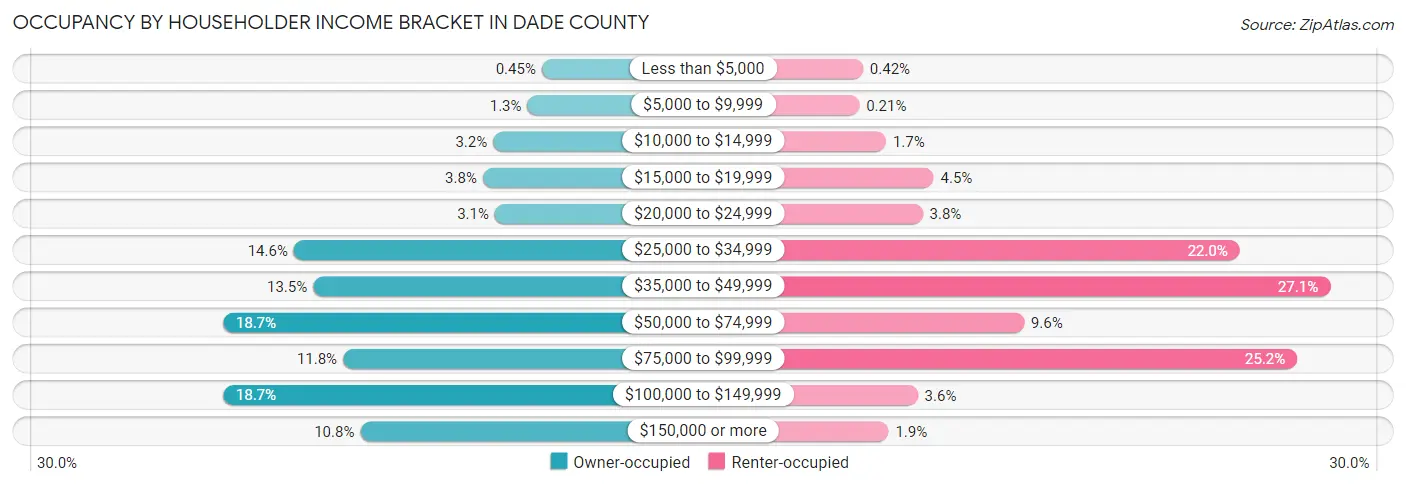
| Income Bracket | Owner-occupied | Renter-occupied |
| Less than $5,000 | 21 (0.4%) | 6 (0.4%) |
| $5,000 to $9,999 | 59 (1.3%) | 3 (0.2%) |
| $10,000 to $14,999 | 150 (3.2%) | 25 (1.7%) |
| $15,000 to $19,999 | 177 (3.8%) | 64 (4.5%) |
| $20,000 to $24,999 | 145 (3.1%) | 55 (3.8%) |
| $25,000 to $34,999 | 678 (14.6%) | 315 (22.0%) |
| $35,000 to $49,999 | 627 (13.5%) | 389 (27.1%) |
| $50,000 to $74,999 | 866 (18.7%) | 138 (9.6%) |
| $75,000 to $99,999 | 548 (11.8%) | 362 (25.2%) |
| $100,000 to $149,999 | 866 (18.7%) | 51 (3.5%) |
| $150,000 or more | 502 (10.8%) | 27 (1.9%) |
| Total | 4,639 (100.0%) | 1,435 (100.0%) |
Monthly Housing Cost Tiers in Dade County
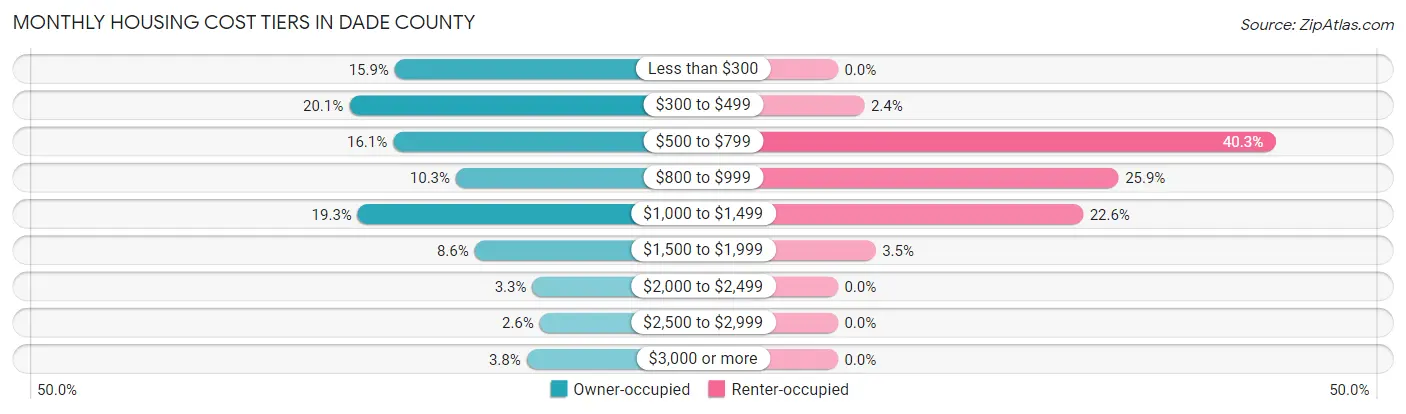
| Monthly Cost | Owner-occupied | Renter-occupied |
| Less than $300 | 739 (15.9%) | 0 (0.0%) |
| $300 to $499 | 934 (20.1%) | 35 (2.4%) |
| $500 to $799 | 746 (16.1%) | 578 (40.3%) |
| $800 to $999 | 478 (10.3%) | 371 (25.9%) |
| $1,000 to $1,499 | 897 (19.3%) | 324 (22.6%) |
| $1,500 to $1,999 | 398 (8.6%) | 50 (3.5%) |
| $2,000 to $2,499 | 151 (3.3%) | 0 (0.0%) |
| $2,500 to $2,999 | 120 (2.6%) | 0 (0.0%) |
| $3,000 or more | 176 (3.8%) | 0 (0.0%) |
| Total | 4,639 (100.0%) | 1,435 (100.0%) |
Physical Housing Characteristics in Dade County
Housing Structures in Dade County
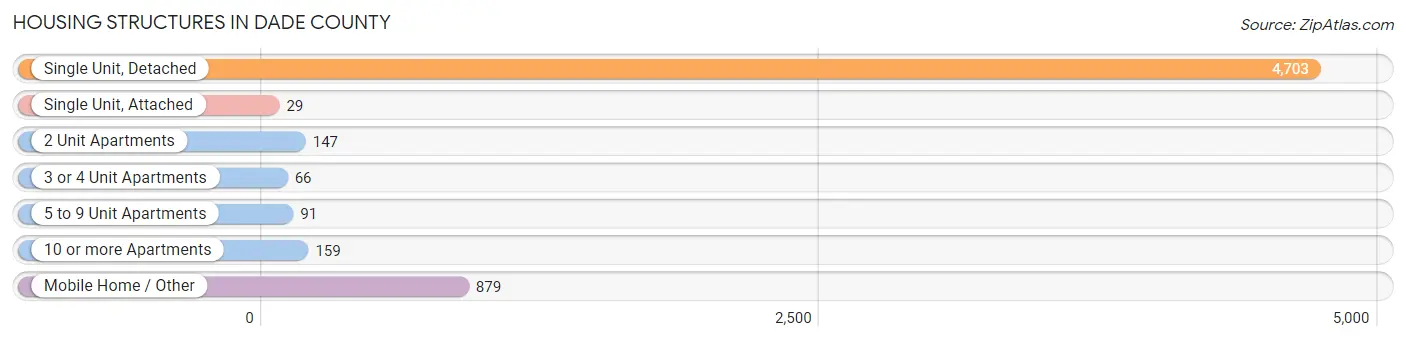
| Structure Type | # Housing Units | % Housing Units |
| Single Unit, Detached | 4,703 | 77.4% |
| Single Unit, Attached | 29 | 0.5% |
| 2 Unit Apartments | 147 | 2.4% |
| 3 or 4 Unit Apartments | 66 | 1.1% |
| 5 to 9 Unit Apartments | 91 | 1.5% |
| 10 or more Apartments | 159 | 2.6% |
| Mobile Home / Other | 879 | 14.5% |
| Total | 6,074 | 100.0% |
Housing Structures by Occupancy in Dade County
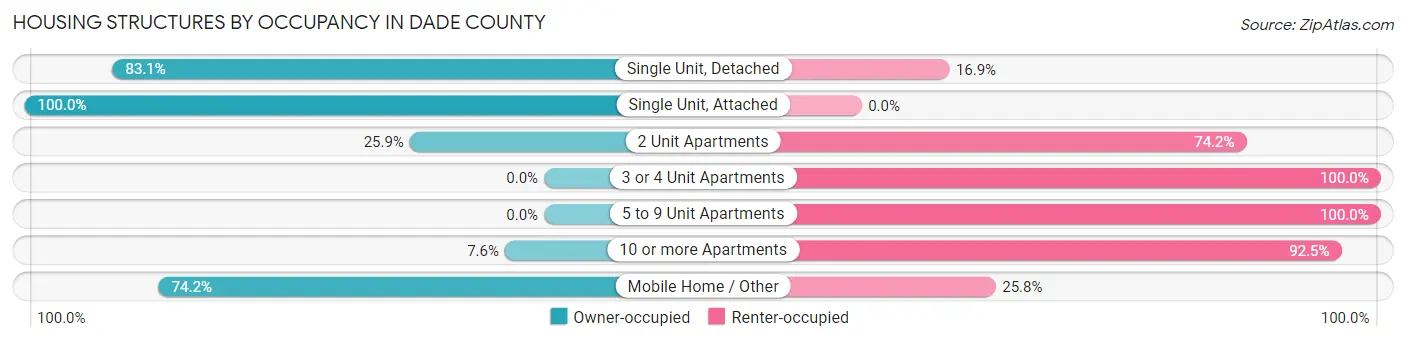
| Structure Type | Owner-occupied | Renter-occupied |
| Single Unit, Detached | 3,908 (83.1%) | 795 (16.9%) |
| Single Unit, Attached | 29 (100.0%) | 0 (0.0%) |
| 2 Unit Apartments | 38 (25.9%) | 109 (74.2%) |
| 3 or 4 Unit Apartments | 0 (0.0%) | 66 (100.0%) |
| 5 to 9 Unit Apartments | 0 (0.0%) | 91 (100.0%) |
| 10 or more Apartments | 12 (7.5%) | 147 (92.4%) |
| Mobile Home / Other | 652 (74.2%) | 227 (25.8%) |
| Total | 4,639 (76.4%) | 1,435 (23.6%) |
Housing Structures by Number of Rooms in Dade County
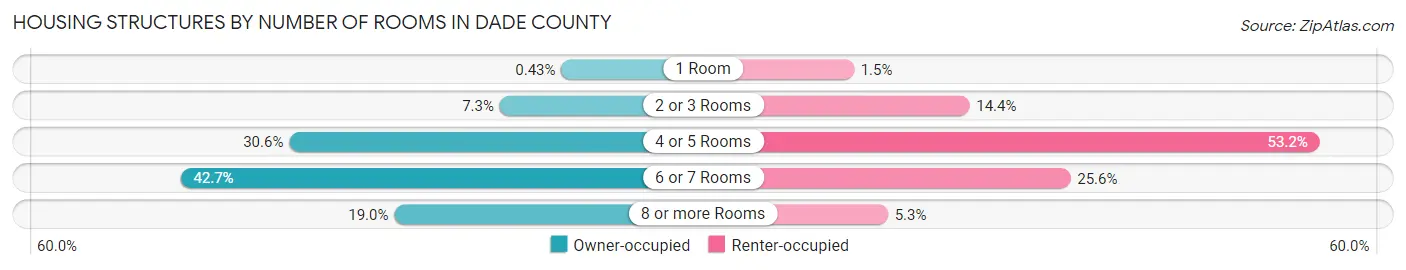
| Number of Rooms | Owner-occupied | Renter-occupied |
| 1 Room | 20 (0.4%) | 22 (1.5%) |
| 2 or 3 Rooms | 337 (7.3%) | 206 (14.4%) |
| 4 or 5 Rooms | 1,421 (30.6%) | 764 (53.2%) |
| 6 or 7 Rooms | 1,981 (42.7%) | 367 (25.6%) |
| 8 or more Rooms | 880 (19.0%) | 76 (5.3%) |
| Total | 4,639 (100.0%) | 1,435 (100.0%) |
Housing Structure by Heating Type in Dade County
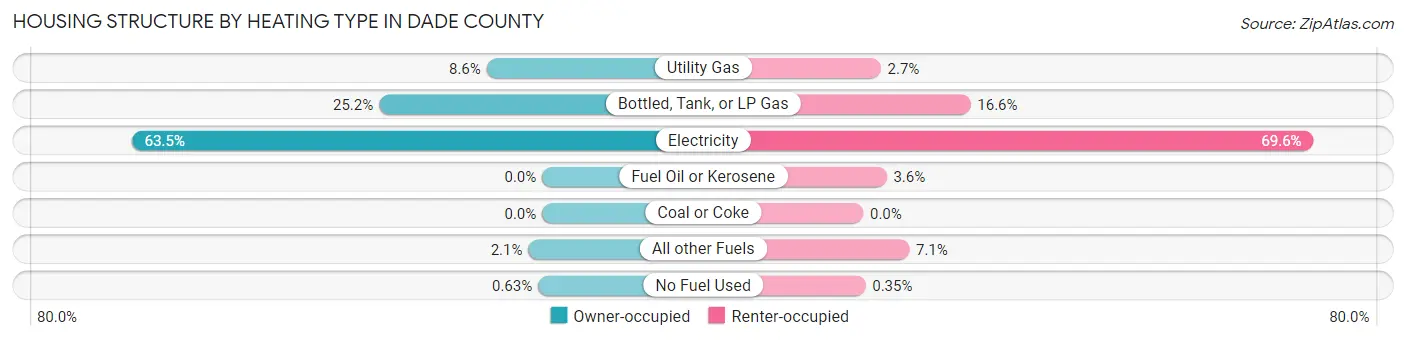
| Heating Type | Owner-occupied | Renter-occupied |
| Utility Gas | 398 (8.6%) | 39 (2.7%) |
| Bottled, Tank, or LP Gas | 1,169 (25.2%) | 238 (16.6%) |
| Electricity | 2,944 (63.5%) | 999 (69.6%) |
| Fuel Oil or Kerosene | 0 (0.0%) | 52 (3.6%) |
| Coal or Coke | 0 (0.0%) | 0 (0.0%) |
| All other Fuels | 99 (2.1%) | 102 (7.1%) |
| No Fuel Used | 29 (0.6%) | 5 (0.4%) |
| Total | 4,639 (100.0%) | 1,435 (100.0%) |
Household Vehicle Usage in Dade County
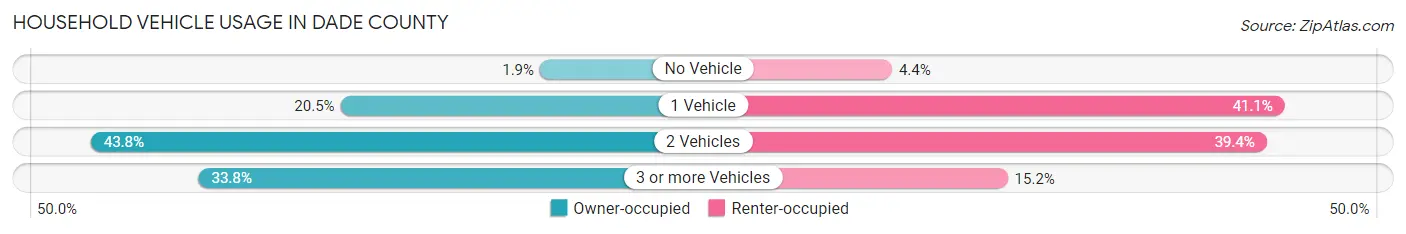
| Vehicles per Household | Owner-occupied | Renter-occupied |
| No Vehicle | 88 (1.9%) | 63 (4.4%) |
| 1 Vehicle | 952 (20.5%) | 589 (41.0%) |
| 2 Vehicles | 2,033 (43.8%) | 565 (39.4%) |
| 3 or more Vehicles | 1,566 (33.8%) | 218 (15.2%) |
| Total | 4,639 (100.0%) | 1,435 (100.0%) |
Real Estate & Mortgages in Dade County
Real Estate and Mortgage Overview in Dade County
| Characteristic | Without Mortgage | With Mortgage |
| Housing Units | 2,503 | 2,136 |
| Median Property Value | $118,600 | $200,000 |
| Median Household Income | $44,568 | $375 |
| Monthly Housing Costs | $407 | $170 |
| Real Estate Taxes | $567 | $76 |
Property Value by Mortgage Status in Dade County
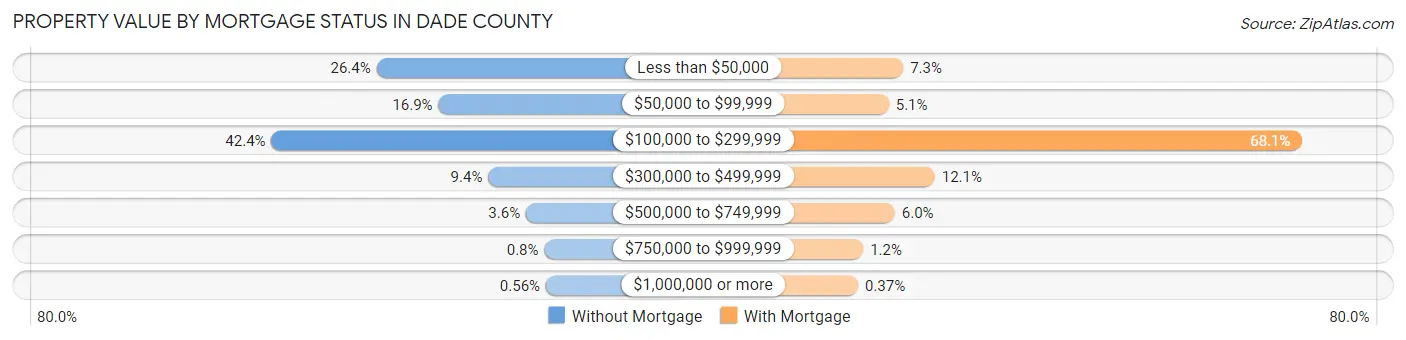
| Property Value | Without Mortgage | With Mortgage |
| Less than $50,000 | 660 (26.4%) | 155 (7.3%) |
| $50,000 to $99,999 | 424 (16.9%) | 108 (5.1%) |
| $100,000 to $299,999 | 1,061 (42.4%) | 1,454 (68.1%) |
| $300,000 to $499,999 | 234 (9.3%) | 258 (12.1%) |
| $500,000 to $749,999 | 90 (3.6%) | 128 (6.0%) |
| $750,000 to $999,999 | 20 (0.8%) | 25 (1.2%) |
| $1,000,000 or more | 14 (0.6%) | 8 (0.4%) |
| Total | 2,503 (100.0%) | 2,136 (100.0%) |
Household Income by Mortgage Status in Dade County
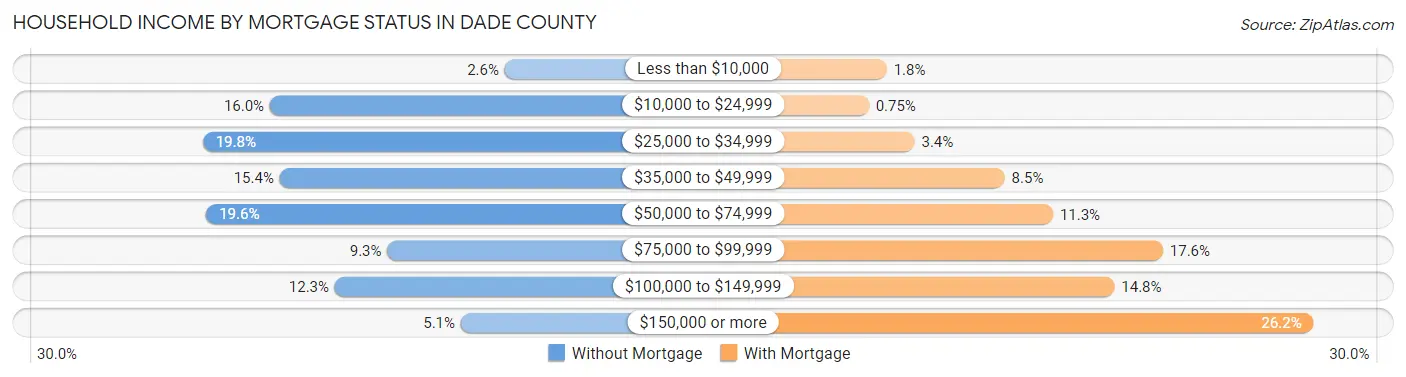
| Household Income | Without Mortgage | With Mortgage |
| Less than $10,000 | 64 (2.6%) | 38 (1.8%) |
| $10,000 to $24,999 | 400 (16.0%) | 16 (0.7%) |
| $25,000 to $34,999 | 496 (19.8%) | 72 (3.4%) |
| $35,000 to $49,999 | 386 (15.4%) | 182 (8.5%) |
| $50,000 to $74,999 | 491 (19.6%) | 241 (11.3%) |
| $75,000 to $99,999 | 232 (9.3%) | 375 (17.6%) |
| $100,000 to $149,999 | 307 (12.3%) | 316 (14.8%) |
| $150,000 or more | 127 (5.1%) | 559 (26.2%) |
| Total | 2,503 (100.0%) | 2,136 (100.0%) |
Property Value to Household Income Ratio in Dade County
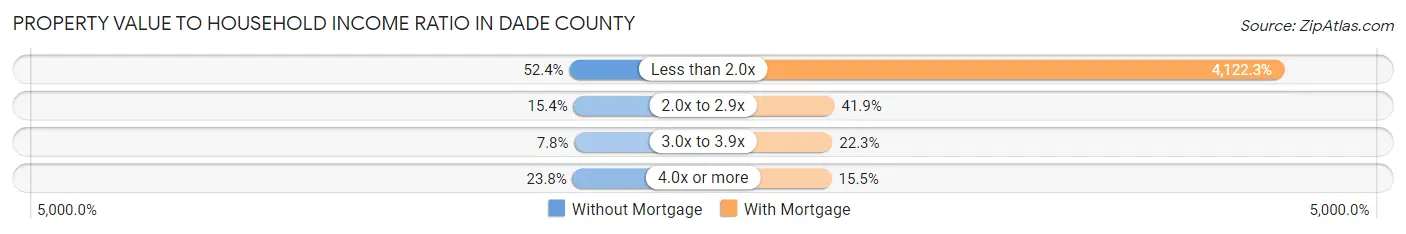
| Value-to-Income Ratio | Without Mortgage | With Mortgage |
| Less than 2.0x | 1,312 (52.4%) | 88,052 (4,122.3%) |
| 2.0x to 2.9x | 385 (15.4%) | 894 (41.8%) |
| 3.0x to 3.9x | 196 (7.8%) | 476 (22.3%) |
| 4.0x or more | 595 (23.8%) | 332 (15.5%) |
| Total | 2,503 (100.0%) | 2,136 (100.0%) |
Real Estate Taxes by Mortgage Status in Dade County
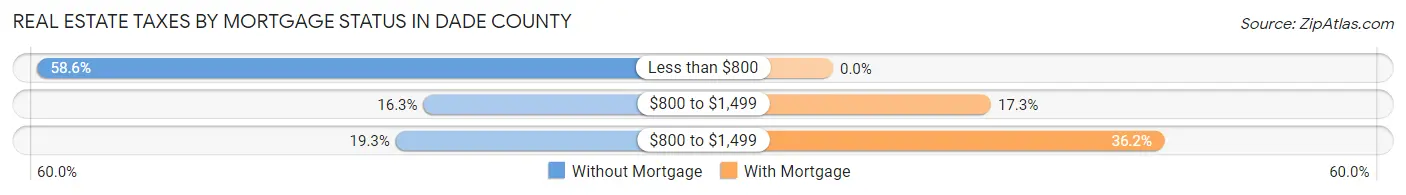
| Property Taxes | Without Mortgage | With Mortgage |
| Less than $800 | 1,466 (58.6%) | 0 (0.0%) |
| $800 to $1,499 | 408 (16.3%) | 370 (17.3%) |
| $800 to $1,499 | 484 (19.3%) | 774 (36.2%) |
| Total | 2,503 (100.0%) | 2,136 (100.0%) |
Health & Disability in Dade County
Health Insurance Coverage by Age in Dade County
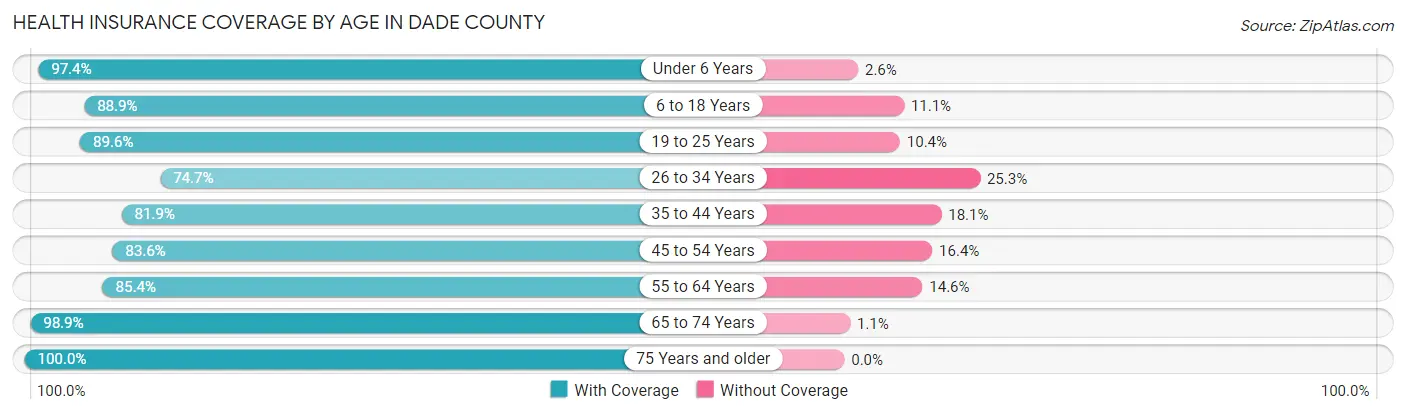
| Age Bracket | With Coverage | Without Coverage |
| Under 6 Years | 951 (97.4%) | 25 (2.6%) |
| 6 to 18 Years | 2,302 (88.9%) | 288 (11.1%) |
| 19 to 25 Years | 1,410 (89.6%) | 163 (10.4%) |
| 26 to 34 Years | 1,243 (74.7%) | 421 (25.3%) |
| 35 to 44 Years | 1,535 (81.9%) | 339 (18.1%) |
| 45 to 54 Years | 1,588 (83.6%) | 311 (16.4%) |
| 55 to 64 Years | 2,019 (85.4%) | 344 (14.6%) |
| 65 to 74 Years | 1,942 (98.9%) | 21 (1.1%) |
| 75 Years and older | 1,199 (100.0%) | 0 (0.0%) |
| Total | 14,189 (88.1%) | 1,912 (11.9%) |
Health Insurance Coverage by Citizenship Status in Dade County
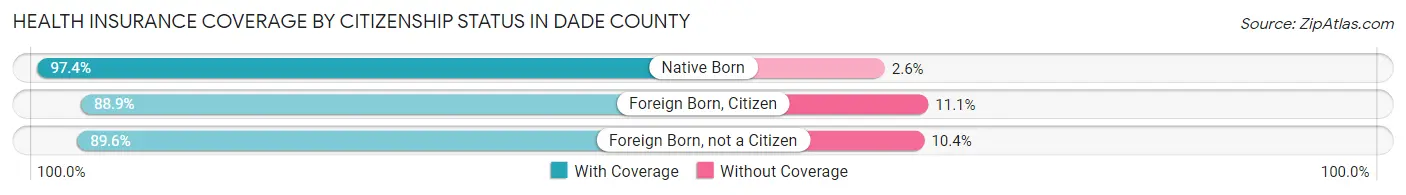
| Citizenship Status | With Coverage | Without Coverage |
| Native Born | 951 (97.4%) | 25 (2.6%) |
| Foreign Born, Citizen | 2,302 (88.9%) | 288 (11.1%) |
| Foreign Born, not a Citizen | 1,410 (89.6%) | 163 (10.4%) |
Health Insurance Coverage by Household Income in Dade County
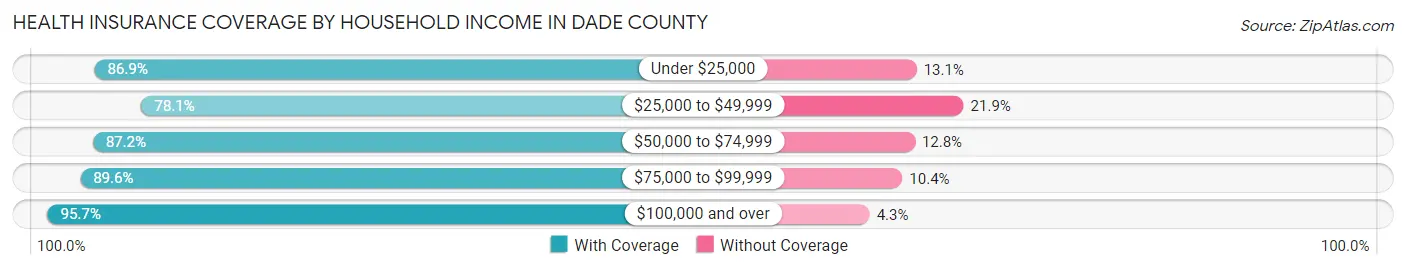
| Household Income | With Coverage | Without Coverage |
| Under $25,000 | 836 (86.9%) | 126 (13.1%) |
| $25,000 to $49,999 | 3,215 (78.1%) | 901 (21.9%) |
| $50,000 to $74,999 | 2,301 (87.2%) | 337 (12.8%) |
| $75,000 to $99,999 | 2,432 (89.6%) | 283 (10.4%) |
| $100,000 and over | 4,408 (95.7%) | 198 (4.3%) |
Public vs Private Health Insurance Coverage by Age in Dade County
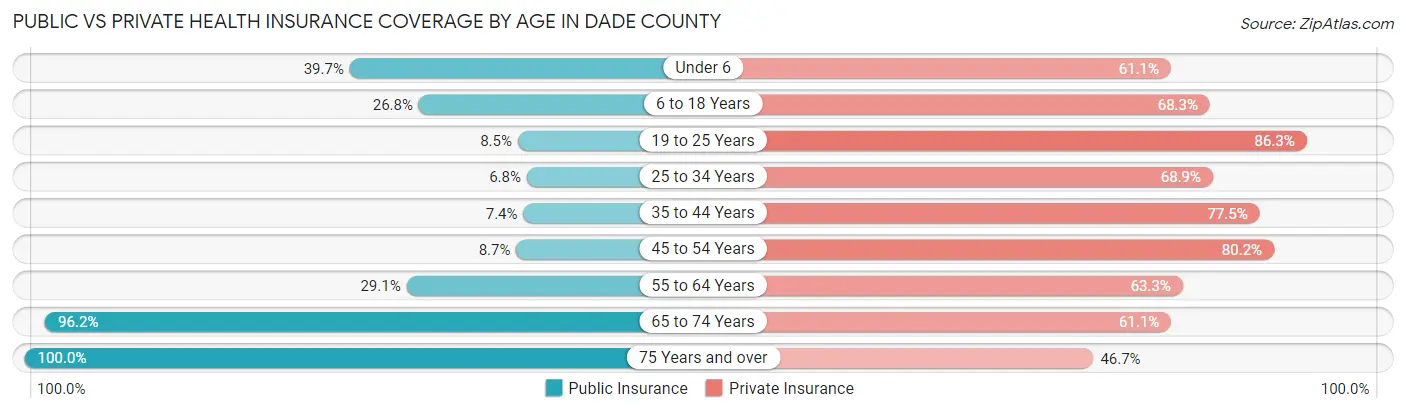
| Age Bracket | Public Insurance | Private Insurance |
| Under 6 | 387 (39.7%) | 596 (61.1%) |
| 6 to 18 Years | 695 (26.8%) | 1,769 (68.3%) |
| 19 to 25 Years | 133 (8.5%) | 1,357 (86.3%) |
| 25 to 34 Years | 113 (6.8%) | 1,146 (68.9%) |
| 35 to 44 Years | 139 (7.4%) | 1,453 (77.5%) |
| 45 to 54 Years | 166 (8.7%) | 1,523 (80.2%) |
| 55 to 64 Years | 688 (29.1%) | 1,495 (63.3%) |
| 65 to 74 Years | 1,888 (96.2%) | 1,200 (61.1%) |
| 75 Years and over | 1,199 (100.0%) | 560 (46.7%) |
| Total | 5,408 (33.6%) | 11,099 (68.9%) |
Disability Status by Sex by Age in Dade County
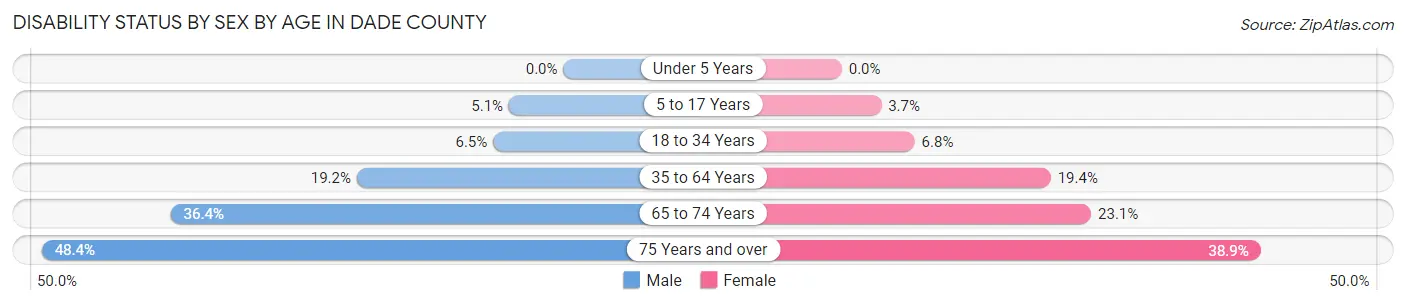
| Age Bracket | Male | Female |
| Under 5 Years | 0 (0.0%) | 0 (0.0%) |
| 5 to 17 Years | 54 (5.1%) | 45 (3.7%) |
| 18 to 34 Years | 121 (6.5%) | 121 (6.8%) |
| 35 to 64 Years | 586 (19.2%) | 597 (19.4%) |
| 65 to 74 Years | 328 (36.4%) | 246 (23.1%) |
| 75 Years and over | 259 (48.4%) | 258 (38.9%) |
Disability Class by Sex by Age in Dade County
Disability Class: Hearing Difficulty
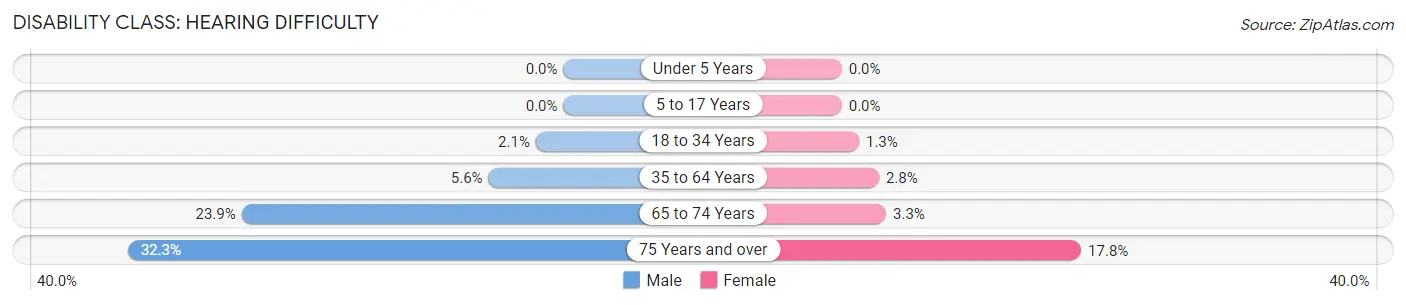
| Age Bracket | Male | Female |
| Under 5 Years | 0 (0.0%) | 0 (0.0%) |
| 5 to 17 Years | 0 (0.0%) | 0 (0.0%) |
| 18 to 34 Years | 38 (2.1%) | 23 (1.3%) |
| 35 to 64 Years | 170 (5.6%) | 85 (2.8%) |
| 65 to 74 Years | 215 (23.9%) | 35 (3.3%) |
| 75 Years and over | 173 (32.3%) | 118 (17.8%) |
Disability Class: Vision Difficulty
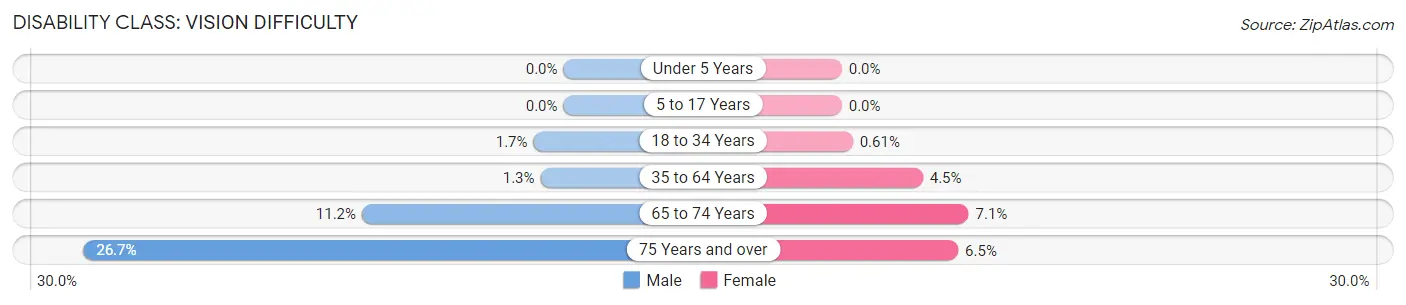
| Age Bracket | Male | Female |
| Under 5 Years | 0 (0.0%) | 0 (0.0%) |
| 5 to 17 Years | 0 (0.0%) | 0 (0.0%) |
| 18 to 34 Years | 31 (1.7%) | 11 (0.6%) |
| 35 to 64 Years | 39 (1.3%) | 139 (4.5%) |
| 65 to 74 Years | 101 (11.2%) | 75 (7.1%) |
| 75 Years and over | 143 (26.7%) | 43 (6.5%) |
Disability Class: Cognitive Difficulty
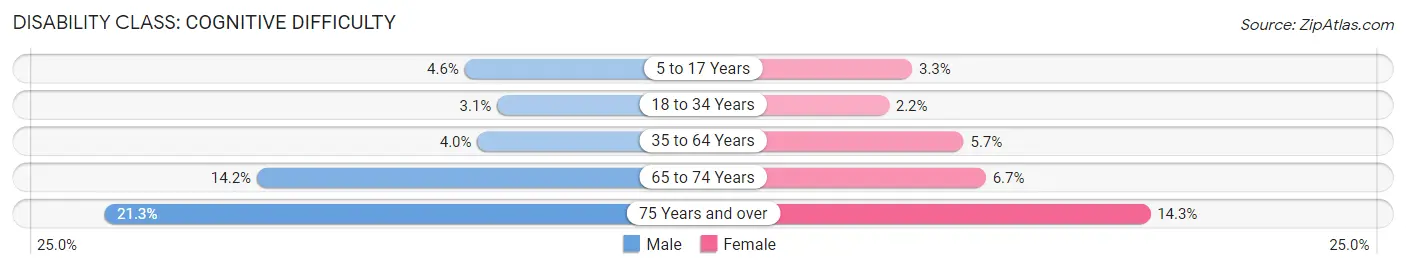
| Age Bracket | Male | Female |
| 5 to 17 Years | 49 (4.6%) | 40 (3.3%) |
| 18 to 34 Years | 57 (3.1%) | 39 (2.2%) |
| 35 to 64 Years | 122 (4.0%) | 174 (5.7%) |
| 65 to 74 Years | 128 (14.2%) | 71 (6.7%) |
| 75 Years and over | 114 (21.3%) | 95 (14.3%) |
Disability Class: Ambulatory Difficulty
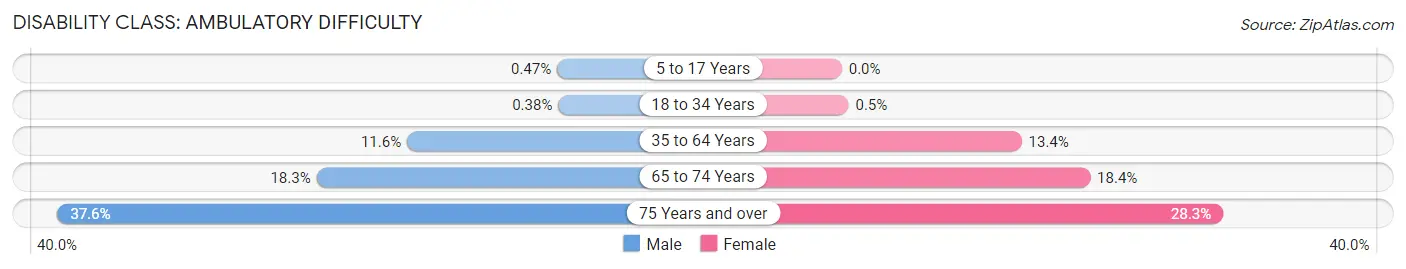
| Age Bracket | Male | Female |
| 5 to 17 Years | 5 (0.5%) | 0 (0.0%) |
| 18 to 34 Years | 7 (0.4%) | 9 (0.5%) |
| 35 to 64 Years | 355 (11.6%) | 411 (13.4%) |
| 65 to 74 Years | 165 (18.3%) | 196 (18.4%) |
| 75 Years and over | 201 (37.6%) | 188 (28.3%) |
Disability Class: Self-Care Difficulty
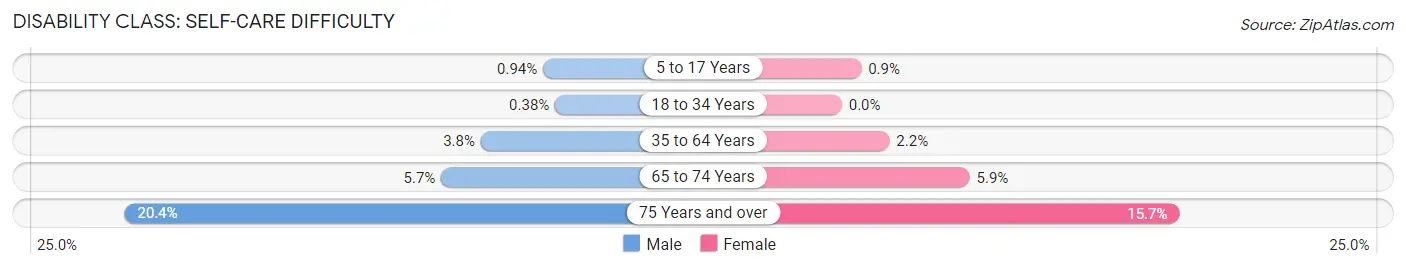
| Age Bracket | Male | Female |
| 5 to 17 Years | 10 (0.9%) | 11 (0.9%) |
| 18 to 34 Years | 7 (0.4%) | 0 (0.0%) |
| 35 to 64 Years | 117 (3.8%) | 68 (2.2%) |
| 65 to 74 Years | 51 (5.7%) | 63 (5.9%) |
| 75 Years and over | 109 (20.4%) | 104 (15.7%) |
Technology Access in Dade County
Computing Device Access in Dade County
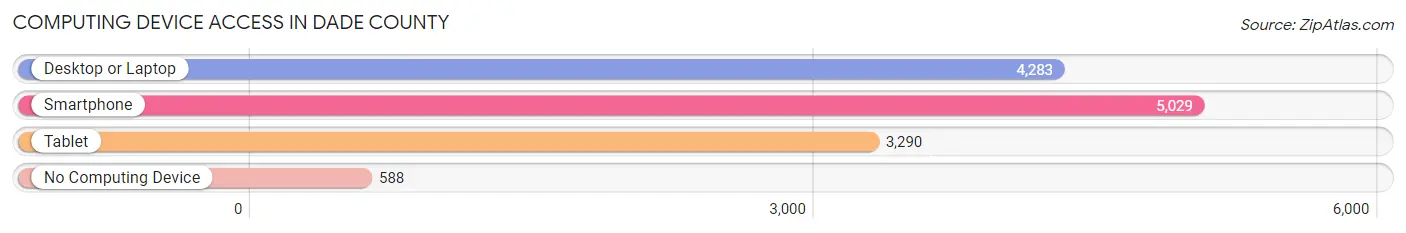
| Device Type | # Households | % Households |
| Desktop or Laptop | 4,283 | 70.5% |
| Smartphone | 5,029 | 82.8% |
| Tablet | 3,290 | 54.2% |
| No Computing Device | 588 | 9.7% |
| Total | 6,074 | 100.0% |
Internet Access in Dade County
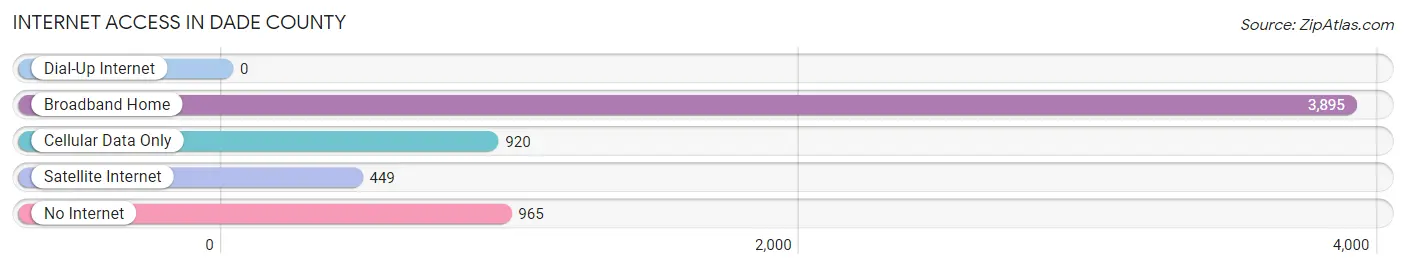
| Internet Type | # Households | % Households |
| Dial-Up Internet | 0 | 0.0% |
| Broadband Home | 3,895 | 64.1% |
| Cellular Data Only | 920 | 15.1% |
| Satellite Internet | 449 | 7.4% |
| No Internet | 965 | 15.9% |
| Total | 6,074 | 100.0% |
Dade County Summary
Dade County, Georgia is located in the northwest corner of the state, and is part of the Chattanooga, TN-GA Metropolitan Statistical Area. It is bordered by Walker County to the north, Catoosa County to the east, and Chattooga County to the south. The county seat is Trenton, and the county has a total area of 156 square miles, of which 155 square miles is land and 1 square mile is water.
History
Dade County was created in 1837 from parts of Walker and Catoosa counties. It was named for Major Francis Langhorne Dade, who was killed in 1835 during the Second Seminole War in Florida. The county was originally part of the Cherokee Nation, and the area was home to many Native American tribes.
Geography
Dade County is located in the northwest corner of Georgia, and is part of the Chattanooga, TN-GA Metropolitan Statistical Area. It is bordered by Walker County to the north, Catoosa County to the east, and Chattooga County to the south. The county seat is Trenton, and the county has a total area of 156 square miles, of which 155 square miles is land and 1 square mile is water. The terrain is mostly hilly, with elevations ranging from 800 to 1,400 feet above sea level. The highest point in the county is Lookout Mountain, which rises to 2,400 feet.
The county is home to several state parks, including Cloudland Canyon State Park, Fort Mountain State Park, and Chickamauga and Chattanooga National Military Park. The county is also home to several rivers, including the Conasauga, Coosawattee, and Oostanaula.
Economy
The economy of Dade County is largely based on agriculture and manufacturing. The county is home to several large farms, and the main crops grown are corn, soybeans, wheat, and hay. The county is also home to several manufacturing companies, including a paper mill, a furniture factory, and a carpet mill.
The county is also home to several tourist attractions, including Cloudland Canyon State Park, Fort Mountain State Park, and Chickamauga and Chattanooga National Military Park. These attractions bring in tourists from all over the country, and help to boost the local economy.
Demographics
As of the 2010 census, Dade County had a population of 16,633. The population was spread out, with 48.3% male and 51.7% female. The median age was 41.2 years. The racial makeup of the county was 95.2% White, 1.7% Black or African American, 0.3% Native American, 0.2% Asian, 0.1% Pacific Islander, 1.3% from other races, and 1.3% from two or more races. Hispanic or Latino of any race were 3.2% of the population.
The median household income was $37,945, and the median family income was $45,945. The per capita income was $19,945. About 14.2% of the population was below the poverty line.
Conclusion
Dade County, Georgia is located in the northwest corner of the state, and is part of the Chattanooga, TN-GA Metropolitan Statistical Area. It was created in 1837 from parts of Walker and Catoosa counties, and was named for Major Francis Langhorne Dade. The county has a total area of 156 square miles, and is home to several state parks, rivers, and tourist attractions. The economy of Dade County is largely based on agriculture and manufacturing, and the county is home to several large farms and manufacturing companies. As of the 2010 census, the population of Dade County was 16,633, with a median household income of $37,945 and a median family income of $45,945.
Common Questions
What is Per Capita Income in Dade County?
Per Capita income in Dade County is $30,078.
What is the Median Family Income in Dade County?
Median Family Income in Dade County is $69,846.
What is the Median Household income in Dade County?
Median Household Income in Dade County is $59,531.
What is Income or Wage Gap in Dade County?
Income or Wage Gap in Dade County is 30.7%.
Women in Dade County earn 69.3 cents for every dollar earned by a man.
What is Inequality or Gini Index in Dade County?
Inequality or Gini Index in Dade County is 0.43.
What is the Total Population of Dade County?
Total Population of Dade County is 16,239.
What is the Total Male Population of Dade County?
Total Male Population of Dade County is 8,015.
What is the Total Female Population of Dade County?
Total Female Population of Dade County is 8,224.
What is the Ratio of Males per 100 Females in Dade County?
There are 97.46 Males per 100 Females in Dade County.
What is the Ratio of Females per 100 Males in Dade County?
There are 102.61 Females per 100 Males in Dade County.
What is the Median Population Age in Dade County?
Median Population Age in Dade County is 42.5 Years.
What is the Average Family Size in Dade County
Average Family Size in Dade County is 2.9 People.
What is the Average Household Size in Dade County
Average Household Size in Dade County is 2.5 People.
How Large is the Labor Force in Dade County?
There are 7,490 People in the Labor Forcein in Dade County.
What is the Percentage of People in the Labor Force in Dade County?
56.0% of People are in the Labor Force in Dade County.
What is the Unemployment Rate in Dade County?
Unemployment Rate in Dade County is 5.5%.