Coffee County, GA Map & Demographics
Coffee County Map
Coffee County Overview
$23,839
PER CAPITA INCOME
$58,229
AVG FAMILY INCOME
$48,398
AVG HOUSEHOLD INCOME
14.7%
WAGE / INCOME GAP [ % ]
85.3¢/ $1
WAGE / INCOME GAP [ $ ]
$11,148
FAMILY INCOME DEFICIT
0.47
INEQUALITY / GINI INDEX
43,056
TOTAL POPULATION
22,197
MALE POPULATION
20,859
FEMALE POPULATION
106.41
MALES / 100 FEMALES
93.97
FEMALES / 100 MALES
36.4
MEDIAN AGE
3.3
AVG FAMILY SIZE
2.7
AVG HOUSEHOLD SIZE
18,600
LABOR FORCE [ PEOPLE ]
55.3%
PERCENT IN LABOR FORCE
4.3%
UNEMPLOYMENT RATE
Coffee County Area Codes
Income in Coffee County
Income Overview in Coffee County
Per Capita Income in Coffee County is $23,839, while median incomes of families and households are $58,229 and $48,398 respectively.
| Characteristic | Number | Measure |
| Per Capita Income | 43,056 | $23,839 |
| Median Family Income | 10,316 | $58,229 |
| Mean Family Income | 10,316 | $74,402 |
| Median Household Income | 14,894 | $48,398 |
| Mean Household Income | 14,894 | $62,361 |
| Income Deficit | 10,316 | $11,148 |
| Wage / Income Gap (%) | 43,056 | 14.68% |
| Wage / Income Gap ($) | 43,056 | 85.32¢ per $1 |
| Gini / Inequality Index | 43,056 | 0.47 |
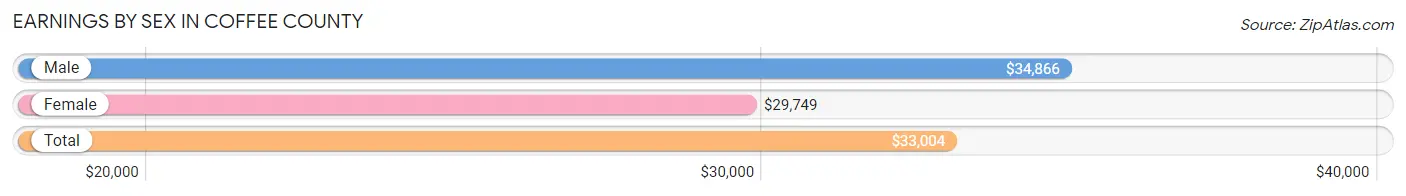
Earnings by Sex in Coffee County
Average Earnings in Coffee County are $33,004, $34,866 for men and $29,749 for women, a difference of 14.7%.
| Sex | Number | Average Earnings |
| Male | 10,540 (54.8%) | $34,866 |
| Female | 8,687 (45.2%) | $29,749 |
| Total | 19,227 (100.0%) | $33,004 |
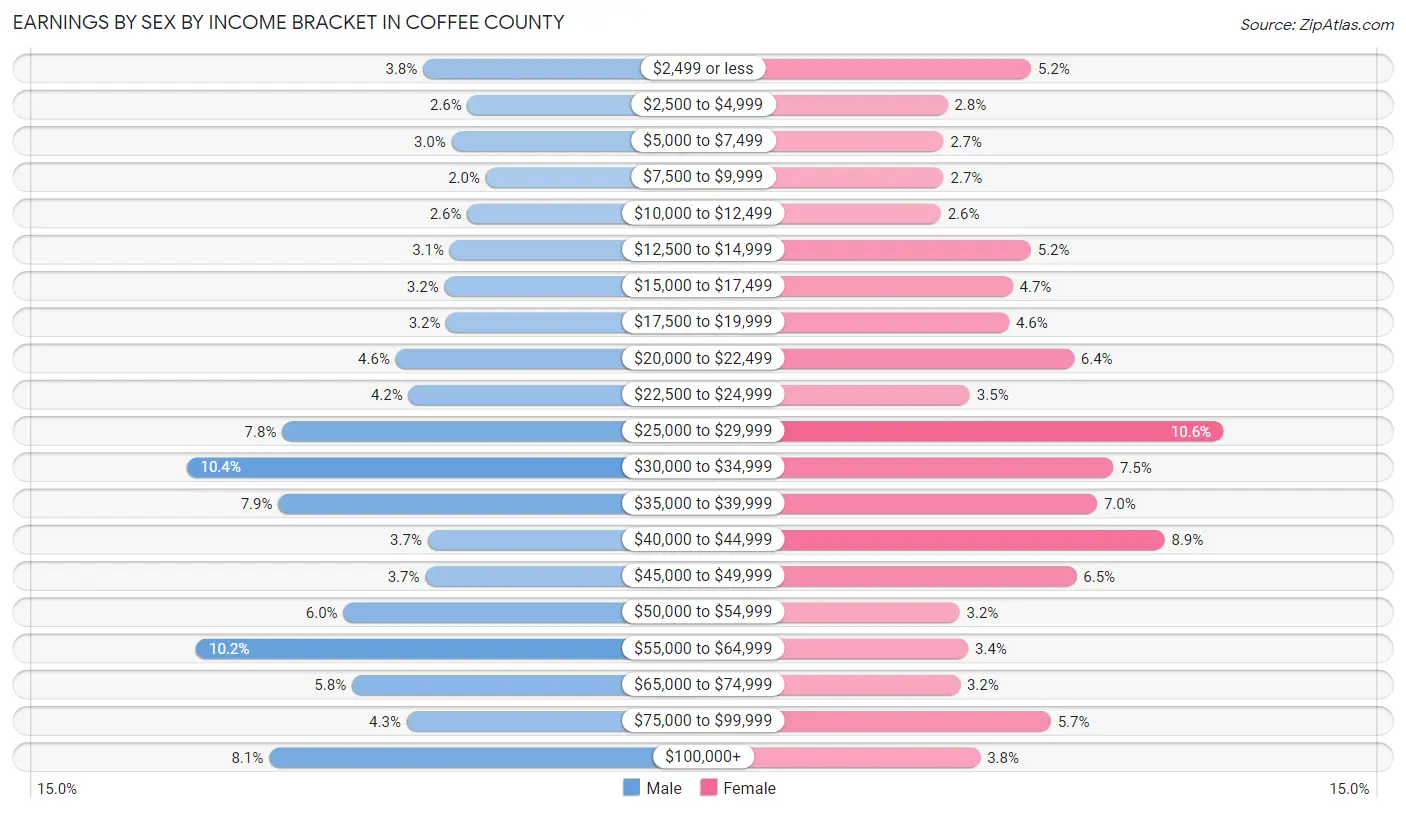
Earnings by Sex by Income Bracket in Coffee County
The most common earnings brackets in Coffee County are $30,000 to $34,999 for men (1,098 | 10.4%) and $25,000 to $29,999 for women (918 | 10.6%).
| Income | Male | Female |
| $2,499 or less | 400 (3.8%) | 450 (5.2%) |
| $2,500 to $4,999 | 269 (2.5%) | 246 (2.8%) |
| $5,000 to $7,499 | 316 (3.0%) | 235 (2.7%) |
| $7,500 to $9,999 | 215 (2.0%) | 236 (2.7%) |
| $10,000 to $12,499 | 270 (2.6%) | 229 (2.6%) |
| $12,500 to $14,999 | 321 (3.0%) | 449 (5.2%) |
| $15,000 to $17,499 | 337 (3.2%) | 405 (4.7%) |
| $17,500 to $19,999 | 332 (3.2%) | 396 (4.6%) |
| $20,000 to $22,499 | 482 (4.6%) | 554 (6.4%) |
| $22,500 to $24,999 | 444 (4.2%) | 301 (3.5%) |
| $25,000 to $29,999 | 818 (7.8%) | 918 (10.6%) |
| $30,000 to $34,999 | 1,098 (10.4%) | 650 (7.5%) |
| $35,000 to $39,999 | 830 (7.9%) | 611 (7.0%) |
| $40,000 to $44,999 | 387 (3.7%) | 776 (8.9%) |
| $45,000 to $49,999 | 394 (3.7%) | 560 (6.5%) |
| $50,000 to $54,999 | 637 (6.0%) | 275 (3.2%) |
| $55,000 to $64,999 | 1,073 (10.2%) | 296 (3.4%) |
| $65,000 to $74,999 | 611 (5.8%) | 276 (3.2%) |
| $75,000 to $99,999 | 449 (4.3%) | 498 (5.7%) |
| $100,000+ | 857 (8.1%) | 326 (3.7%) |
| Total | 10,540 (100.0%) | 8,687 (100.0%) |
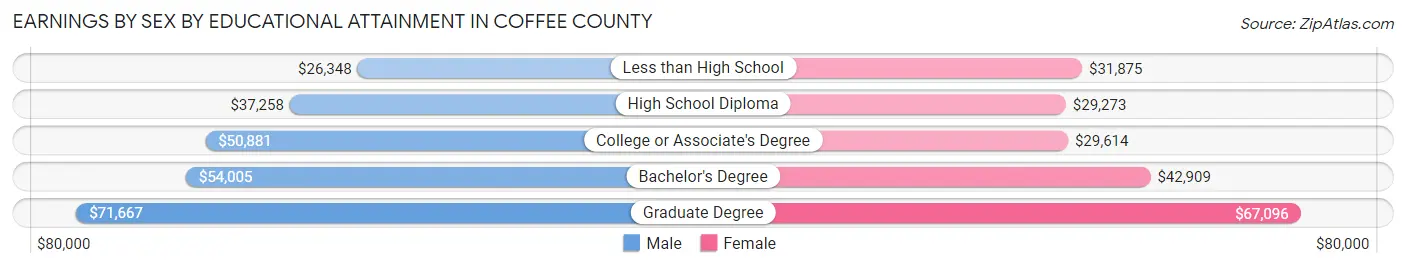
Earnings by Sex by Educational Attainment in Coffee County
Average earnings in Coffee County are $37,955 for men and $32,808 for women, a difference of 13.6%. Men with an educational attainment of graduate degree enjoy the highest average annual earnings of $71,667, while those with less than high school education earn the least with $26,348. Women with an educational attainment of graduate degree earn the most with the average annual earnings of $67,096, while those with high school diploma education have the smallest earnings of $29,273.
| Educational Attainment | Male Income | Female Income |
| Less than High School | $26,348 | $31,875 |
| High School Diploma | $37,258 | $29,273 |
| College or Associate's Degree | $50,881 | $29,614 |
| Bachelor's Degree | $54,005 | $42,909 |
| Graduate Degree | $71,667 | $67,096 |
| Total | $37,955 | $32,808 |
Family Income in Coffee County
Family Income Brackets in Coffee County
According to the Coffee County family income data, there are 1,981 families falling into the $50,000 to $74,999 income range, which is the most common income bracket and makes up 19.2% of all families. Conversely, the $10,000 to $14,999 income bracket is the least frequent group with only 433 families (4.2%) belonging to this category.
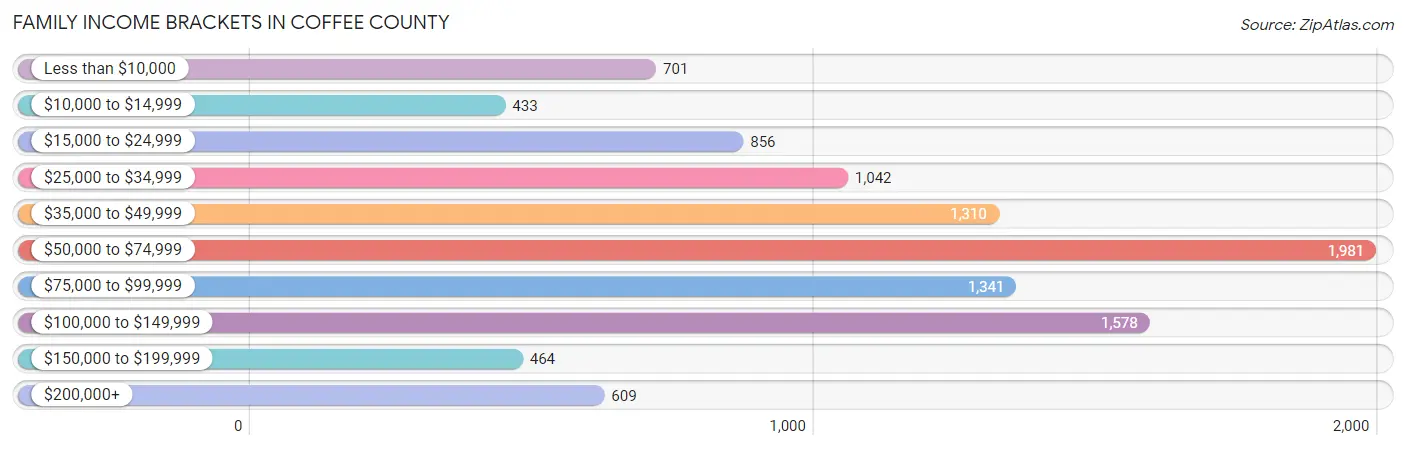
| Income Bracket | # Families | % Families |
| Less than $10,000 | 701 | 6.8% |
| $10,000 to $14,999 | 433 | 4.2% |
| $15,000 to $24,999 | 856 | 8.3% |
| $25,000 to $34,999 | 1,042 | 10.1% |
| $35,000 to $49,999 | 1,310 | 12.7% |
| $50,000 to $74,999 | 1,981 | 19.2% |
| $75,000 to $99,999 | 1,341 | 13.0% |
| $100,000 to $149,999 | 1,578 | 15.3% |
| $150,000 to $199,999 | 464 | 4.5% |
| $200,000+ | 609 | 5.9% |
Family Income by Famaliy Size in Coffee County
4-person families (1,877 | 18.2%) account for the highest median family income in Coffee County with $82,160 per family, while 2-person families (4,743 | 46.0%) have the highest median income of $23,490 per family member.
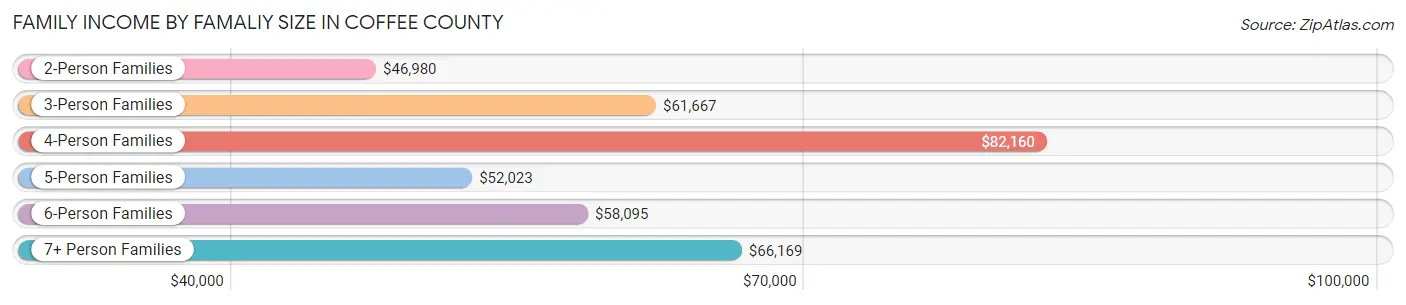
| Income Bracket | # Families | Median Income |
| 2-Person Families | 4,743 (46.0%) | $46,980 |
| 3-Person Families | 2,534 (24.6%) | $61,667 |
| 4-Person Families | 1,877 (18.2%) | $82,160 |
| 5-Person Families | 969 (9.4%) | $52,023 |
| 6-Person Families | 92 (0.9%) | $58,095 |
| 7+ Person Families | 101 (1.0%) | $66,169 |
| Total | 10,316 (100.0%) | $58,229 |
Family Income by Number of Earners in Coffee County
The median family income in Coffee County is $58,229, with families comprising 3+ earners (556) having the highest median family income of $115,366, while families with no earners (2,198) have the lowest median family income of $25,801, accounting for 5.4% and 21.3% of families, respectively.
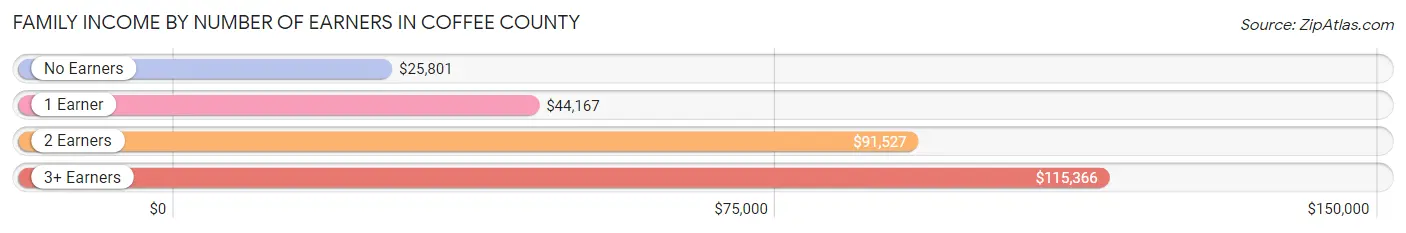
| Number of Earners | # Families | Median Income |
| No Earners | 2,198 (21.3%) | $25,801 |
| 1 Earner | 3,498 (33.9%) | $44,167 |
| 2 Earners | 4,064 (39.4%) | $91,527 |
| 3+ Earners | 556 (5.4%) | $115,366 |
| Total | 10,316 (100.0%) | $58,229 |
Household Income in Coffee County
Household Income Brackets in Coffee County
With 2,726 households falling in the category, the $50,000 to $74,999 income range is the most frequent in Coffee County, accounting for 18.3% of all households. In contrast, only 566 households (3.8%) fall into the $150,000 to $199,999 income bracket, making it the least populous group.
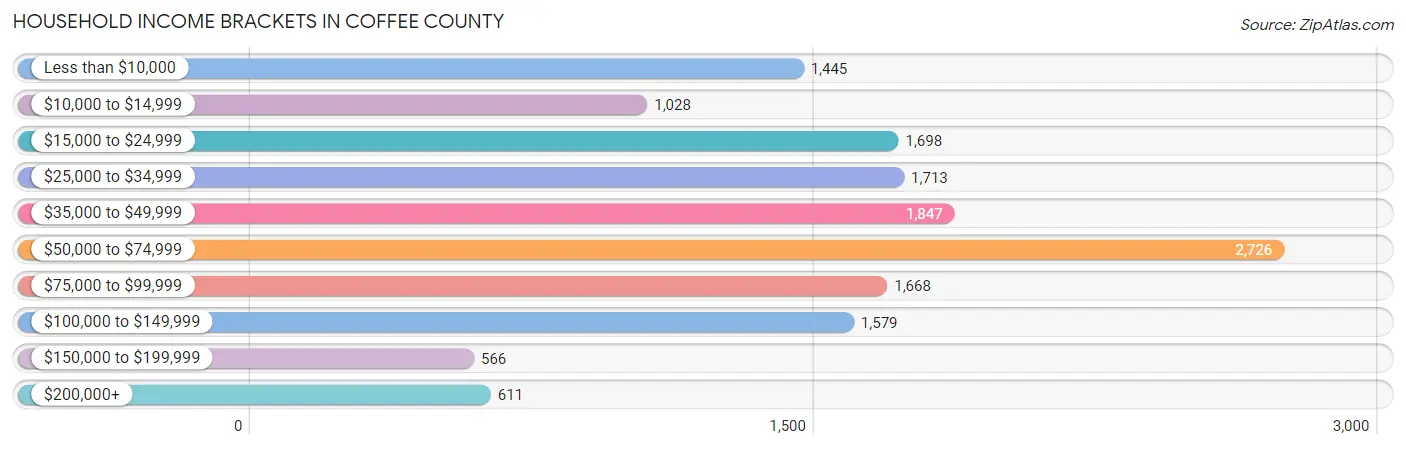
| Income Bracket | # Households | % Households |
| Less than $10,000 | 1,445 | 9.7% |
| $10,000 to $14,999 | 1,028 | 6.9% |
| $15,000 to $24,999 | 1,698 | 11.4% |
| $25,000 to $34,999 | 1,713 | 11.5% |
| $35,000 to $49,999 | 1,847 | 12.4% |
| $50,000 to $74,999 | 2,726 | 18.3% |
| $75,000 to $99,999 | 1,668 | 11.2% |
| $100,000 to $149,999 | 1,579 | 10.6% |
| $150,000 to $199,999 | 566 | 3.8% |
| $200,000+ | 611 | 4.1% |
Household Income by Householder Age in Coffee County
The median household income in Coffee County is $48,398, with the highest median household income of $53,096 found in the 45 to 64 years age bracket for the primary householder. A total of 5,293 households (35.5%) fall into this category. Meanwhile, the 65+ years age bracket for the primary householder has the lowest median household income of $31,190, with 3,828 households (25.7%) in this group.
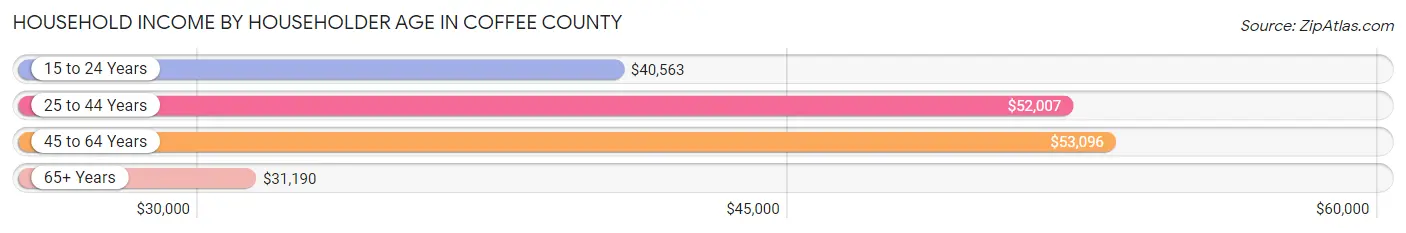
| Income Bracket | # Households | Median Income |
| 15 to 24 Years | 504 (3.4%) | $40,563 |
| 25 to 44 Years | 5,269 (35.4%) | $52,007 |
| 45 to 64 Years | 5,293 (35.5%) | $53,096 |
| 65+ Years | 3,828 (25.7%) | $31,190 |
| Total | 14,894 (100.0%) | $48,398 |
Poverty in Coffee County
Income Below Poverty by Sex and Age in Coffee County
With 16.9% poverty level for males and 23.1% for females among the residents of Coffee County, 6 to 11 year old males and 18 to 24 year old females are the most vulnerable to poverty, with 590 males (37.8%) and 653 females (42.6%) in their respective age groups living below the poverty level.
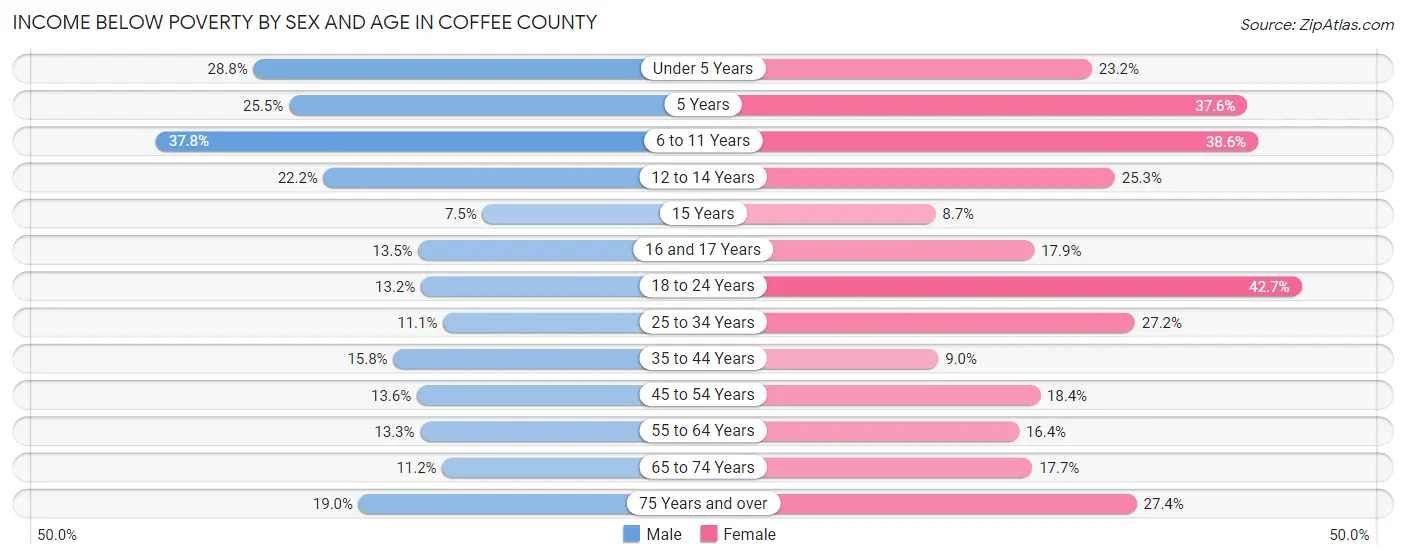
| Age Bracket | Male | Female |
| Under 5 Years | 366 (28.7%) | 321 (23.2%) |
| 5 Years | 140 (25.5%) | 140 (37.6%) |
| 6 to 11 Years | 590 (37.8%) | 747 (38.6%) |
| 12 to 14 Years | 169 (22.2%) | 132 (25.3%) |
| 15 Years | 30 (7.5%) | 25 (8.7%) |
| 16 and 17 Years | 76 (13.5%) | 87 (17.9%) |
| 18 to 24 Years | 275 (13.2%) | 653 (42.6%) |
| 25 to 34 Years | 300 (11.1%) | 811 (27.2%) |
| 35 to 44 Years | 367 (15.8%) | 234 (8.9%) |
| 45 to 54 Years | 350 (13.6%) | 447 (18.4%) |
| 55 to 64 Years | 303 (13.3%) | 410 (16.4%) |
| 65 to 74 Years | 197 (11.2%) | 416 (17.7%) |
| 75 Years and over | 167 (19.0%) | 310 (27.4%) |
| Total | 3,330 (16.9%) | 4,733 (23.1%) |
Income Above Poverty by Sex and Age in Coffee County
According to the poverty statistics in Coffee County, males aged 15 years and females aged 15 years are the age groups that are most secure financially, with 92.5% of males and 91.3% of females in these age groups living above the poverty line.
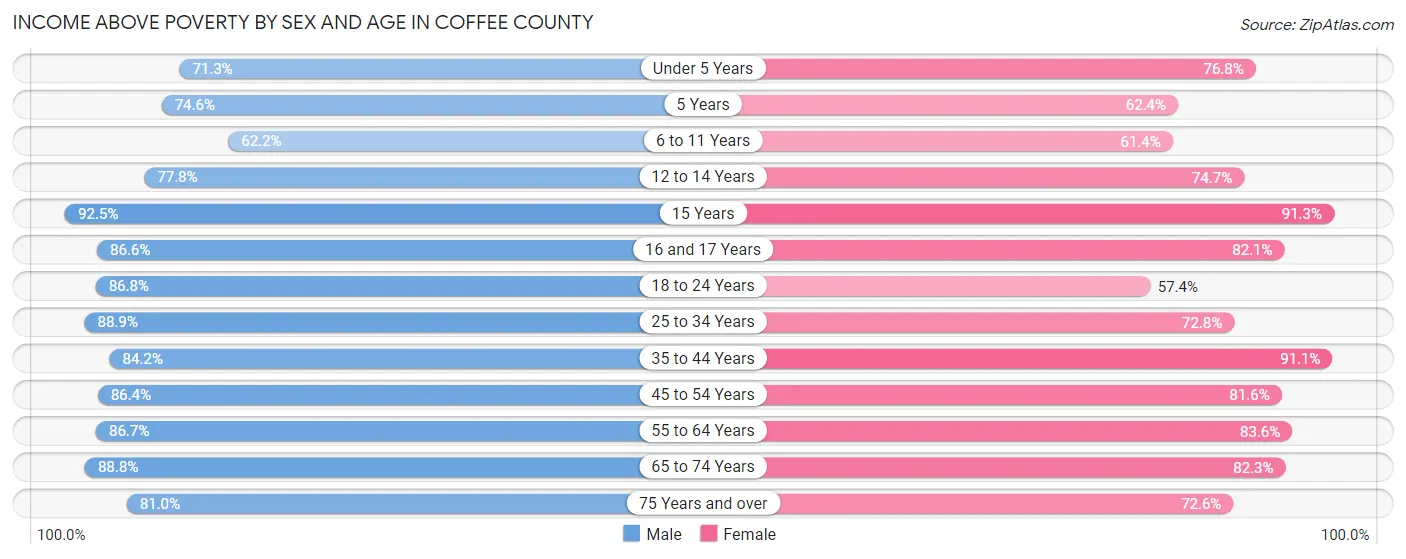
| Age Bracket | Male | Female |
| Under 5 Years | 907 (71.3%) | 1,062 (76.8%) |
| 5 Years | 410 (74.6%) | 232 (62.4%) |
| 6 to 11 Years | 970 (62.2%) | 1,187 (61.4%) |
| 12 to 14 Years | 591 (77.8%) | 389 (74.7%) |
| 15 Years | 370 (92.5%) | 263 (91.3%) |
| 16 and 17 Years | 489 (86.6%) | 400 (82.1%) |
| 18 to 24 Years | 1,808 (86.8%) | 878 (57.4%) |
| 25 to 34 Years | 2,394 (88.9%) | 2,171 (72.8%) |
| 35 to 44 Years | 1,960 (84.2%) | 2,381 (91.0%) |
| 45 to 54 Years | 2,227 (86.4%) | 1,984 (81.6%) |
| 55 to 64 Years | 1,980 (86.7%) | 2,084 (83.6%) |
| 65 to 74 Years | 1,559 (88.8%) | 1,938 (82.3%) |
| 75 Years and over | 713 (81.0%) | 823 (72.6%) |
| Total | 16,378 (83.1%) | 15,792 (76.9%) |
Income Below Poverty Among Married-Couple Families in Coffee County
The poverty statistics for married-couple families in Coffee County show that 6.5% or 444 of the total 6,854 families live below the poverty line. Families with 3 or 4 children have the highest poverty rate of 11.9%, comprising of 71 families. On the other hand, families with 5 or more children have the lowest poverty rate of 0.0%, which includes 0 families.
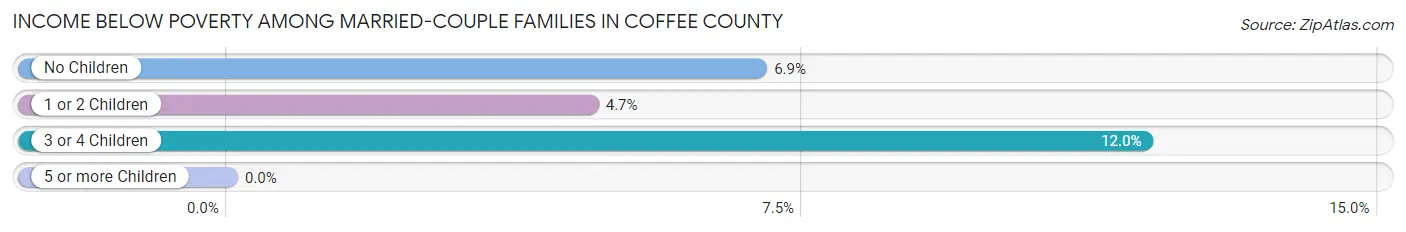
| Children | Above Poverty | Below Poverty |
| No Children | 3,394 (93.1%) | 252 (6.9%) |
| 1 or 2 Children | 2,449 (95.3%) | 121 (4.7%) |
| 3 or 4 Children | 523 (88.0%) | 71 (11.9%) |
| 5 or more Children | 44 (100.0%) | 0 (0.0%) |
| Total | 6,410 (93.5%) | 444 (6.5%) |
Income Below Poverty Among Single-Parent Households in Coffee County
According to the poverty data in Coffee County, 30.7% or 356 single-father households and 43.5% or 1,003 single-mother households are living below the poverty line. Among single-father households, those with 3 or 4 children have the highest poverty rate, with 30 households (100.0%) experiencing poverty. Likewise, among single-mother households, those with 5 or more children have the highest poverty rate, with 17 households (100.0%) falling below the poverty line.
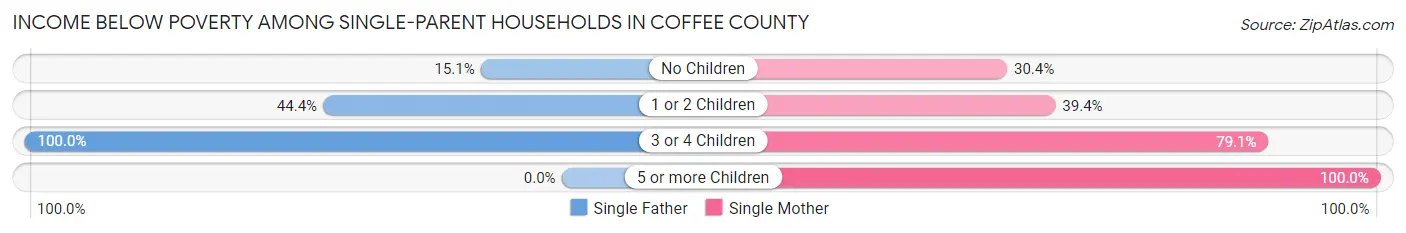
| Children | Single Father | Single Mother |
| No Children | 90 (15.1%) | 133 (30.4%) |
| 1 or 2 Children | 236 (44.4%) | 607 (39.4%) |
| 3 or 4 Children | 30 (100.0%) | 246 (79.1%) |
| 5 or more Children | 0 (0.0%) | 17 (100.0%) |
| Total | 356 (30.7%) | 1,003 (43.5%) |
Income Below Poverty Among Married-Couple vs Single-Parent Households in Coffee County
The poverty data for Coffee County shows that 444 of the married-couple family households (6.5%) and 1,359 of the single-parent households (39.3%) are living below the poverty level. Within the married-couple family households, those with 3 or 4 children have the highest poverty rate, with 71 households (11.9%) falling below the poverty line. Among the single-parent households, those with 5 or more children have the highest poverty rate, with 17 household (100.0%) living below poverty.
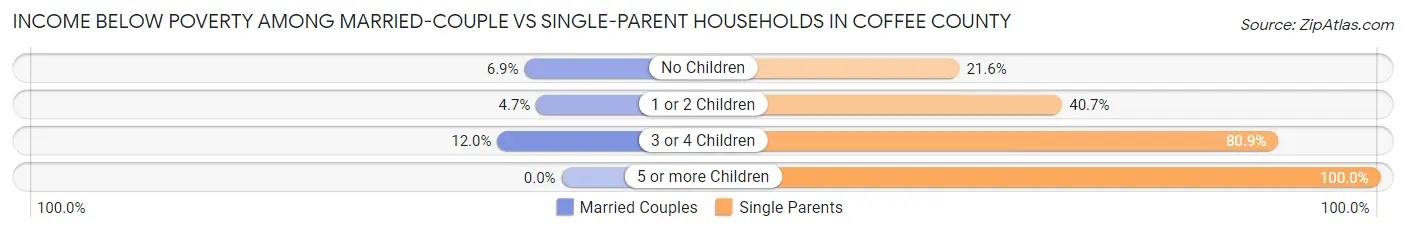
| Children | Married-Couple Families | Single-Parent Households |
| No Children | 252 (6.9%) | 223 (21.6%) |
| 1 or 2 Children | 121 (4.7%) | 843 (40.7%) |
| 3 or 4 Children | 71 (11.9%) | 276 (80.9%) |
| 5 or more Children | 0 (0.0%) | 17 (100.0%) |
| Total | 444 (6.5%) | 1,359 (39.3%) |
Race in Coffee County
The most populous races in Coffee County are White / Caucasian (26,766 | 62.2%), Black / African American (12,375 | 28.7%), and Hispanic or Latino (5,297 | 12.3%).
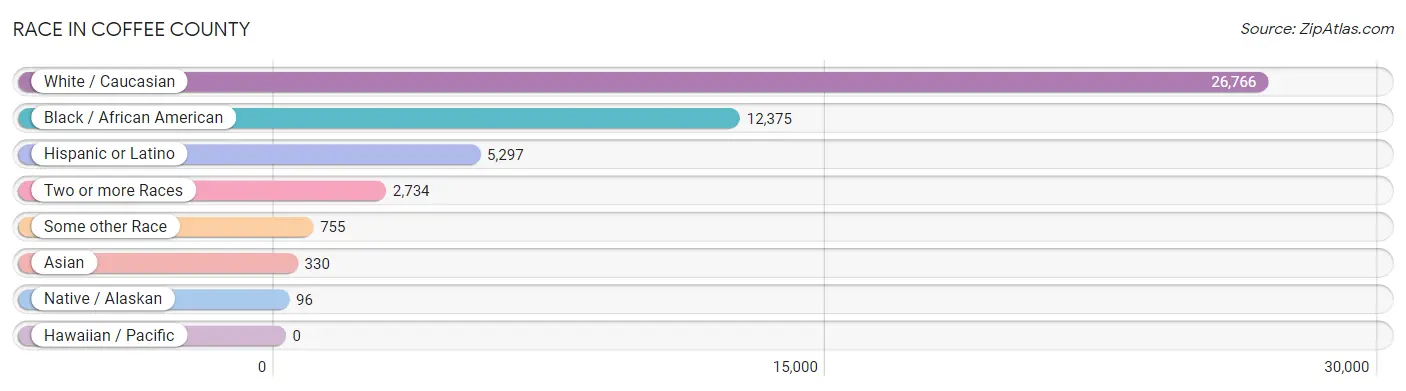
| Race | # Population | % Population |
| Asian | 330 | 0.8% |
| Black / African American | 12,375 | 28.7% |
| Hawaiian / Pacific | 0 | 0.0% |
| Hispanic or Latino | 5,297 | 12.3% |
| Native / Alaskan | 96 | 0.2% |
| White / Caucasian | 26,766 | 62.2% |
| Two or more Races | 2,734 | 6.4% |
| Some other Race | 755 | 1.8% |
| Total | 43,056 | 100.0% |
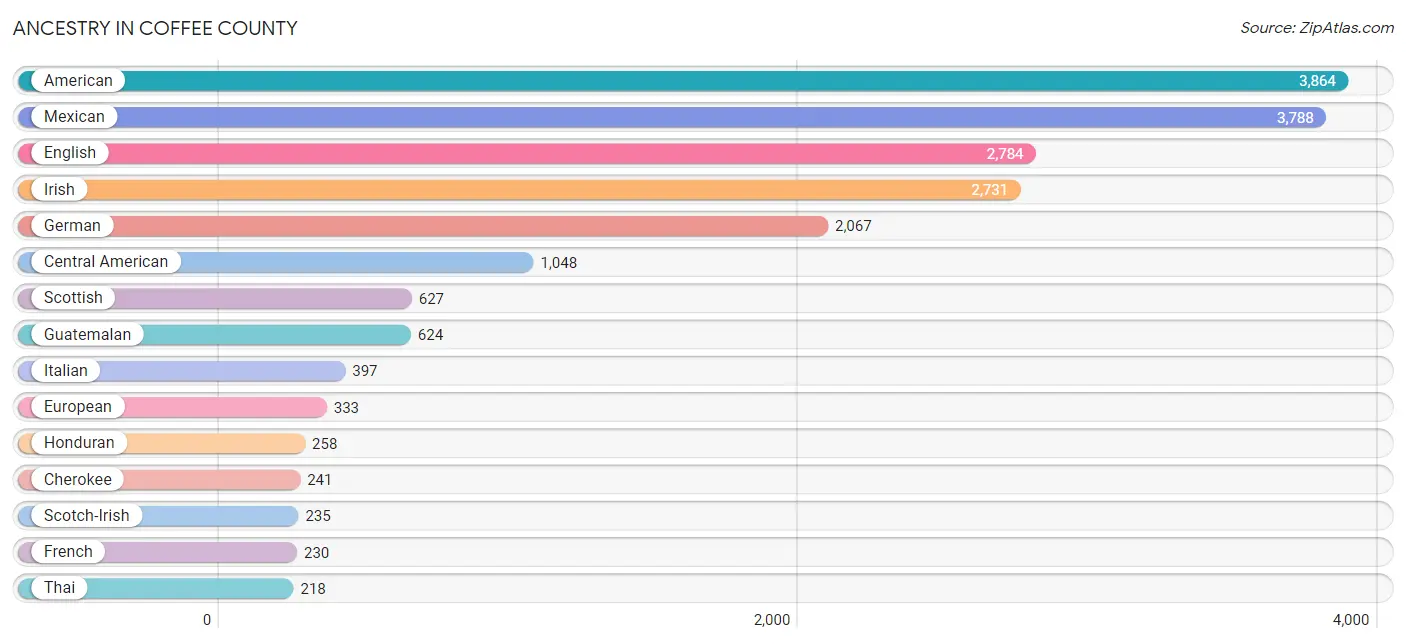
Ancestry in Coffee County
The most populous ancestries reported in Coffee County are American (3,864 | 9.0%), Mexican (3,788 | 8.8%), English (2,784 | 6.5%), Irish (2,731 | 6.3%), and German (2,067 | 4.8%), together accounting for 35.4% of all Coffee County residents.
| Ancestry | # Population | % Population |
| African | 123 | 0.3% |
| American | 3,864 | 9.0% |
| Arab | 17 | 0.0% |
| Argentinean | 5 | 0.0% |
| Armenian | 7 | 0.0% |
| Belgian | 6 | 0.0% |
| Bhutanese | 56 | 0.1% |
| Blackfeet | 10 | 0.0% |
| Brazilian | 18 | 0.0% |
| British | 67 | 0.2% |
| Burmese | 13 | 0.0% |
| Canadian | 8 | 0.0% |
| Central American | 1,048 | 2.4% |
| Central American Indian | 10 | 0.0% |
| Cherokee | 241 | 0.6% |
| Choctaw | 1 | 0.0% |
| Colombian | 34 | 0.1% |
| Cuban | 185 | 0.4% |
| Czech | 1 | 0.0% |
| Dutch | 76 | 0.2% |
| Eastern European | 35 | 0.1% |
| English | 2,784 | 6.5% |
| European | 333 | 0.8% |
| French | 230 | 0.5% |
| French Canadian | 33 | 0.1% |
| German | 2,067 | 4.8% |
| Greek | 34 | 0.1% |
| Guatemalan | 624 | 1.5% |
| Haitian | 78 | 0.2% |
| Honduran | 258 | 0.6% |
| Hungarian | 17 | 0.0% |
| Indian (Asian) | 6 | 0.0% |
| Iranian | 2 | 0.0% |
| Irish | 2,731 | 6.3% |
| Iroquois | 1 | 0.0% |
| Israeli | 1 | 0.0% |
| Italian | 397 | 0.9% |
| Jamaican | 7 | 0.0% |
| Korean | 2 | 0.0% |
| Lebanese | 17 | 0.0% |
| Lithuanian | 29 | 0.1% |
| Mexican | 3,788 | 8.8% |
| Mexican American Indian | 182 | 0.4% |
| Northern European | 32 | 0.1% |
| Norwegian | 38 | 0.1% |
| Pakistani | 66 | 0.2% |
| Peruvian | 64 | 0.2% |
| Polish | 18 | 0.0% |
| Portuguese | 18 | 0.0% |
| Puerto Rican | 137 | 0.3% |
| Russian | 52 | 0.1% |
| Salvadoran | 166 | 0.4% |
| Scandinavian | 46 | 0.1% |
| Scotch-Irish | 235 | 0.5% |
| Scottish | 627 | 1.5% |
| South American | 103 | 0.2% |
| Sri Lankan | 40 | 0.1% |
| Subsaharan African | 123 | 0.3% |
| Swedish | 20 | 0.1% |
| Swiss | 97 | 0.2% |
| Thai | 218 | 0.5% |
| Ukrainian | 17 | 0.0% |
| Welsh | 25 | 0.1% | View All 63 Rows |
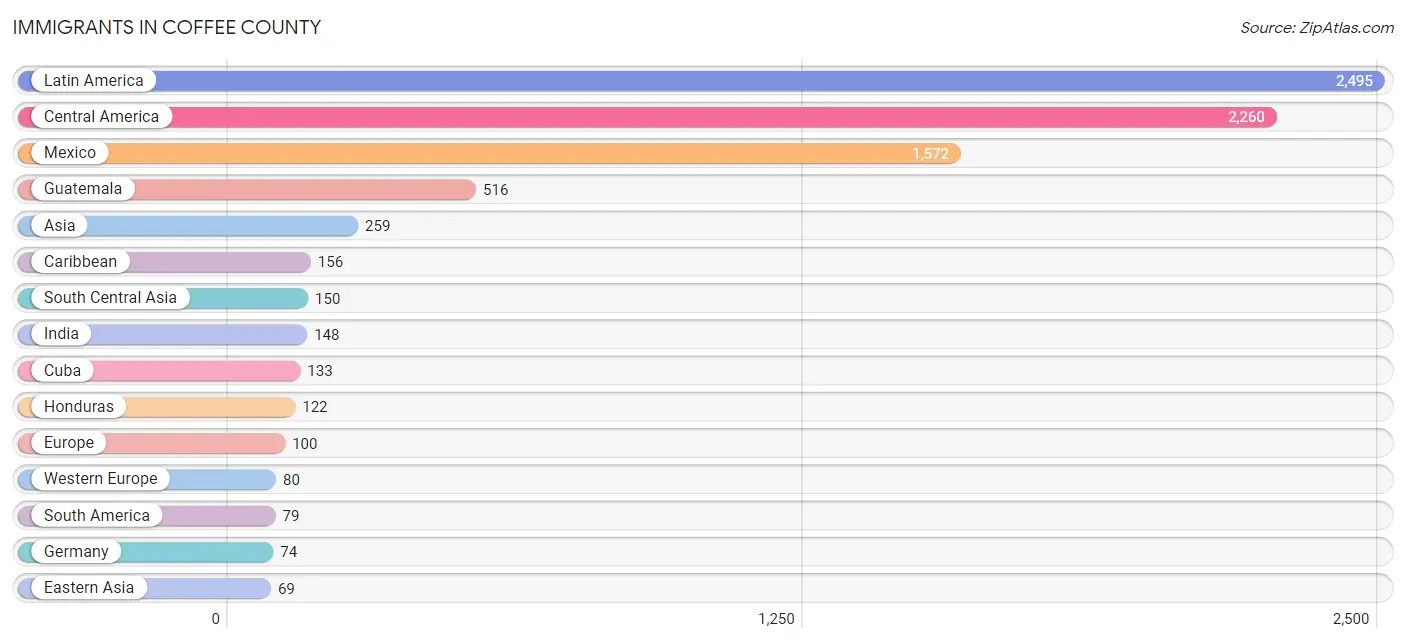
Immigrants in Coffee County
The most numerous immigrant groups reported in Coffee County came from Latin America (2,495 | 5.8%), Central America (2,260 | 5.2%), Mexico (1,572 | 3.6%), Guatemala (516 | 1.2%), and Asia (259 | 0.6%), together accounting for 16.5% of all Coffee County residents.
| Immigration Origin | # Population | % Population |
| Africa | 40 | 0.1% |
| Argentina | 5 | 0.0% |
| Asia | 259 | 0.6% |
| Canada | 36 | 0.1% |
| Caribbean | 156 | 0.4% |
| Central America | 2,260 | 5.2% |
| Colombia | 10 | 0.0% |
| Cuba | 133 | 0.3% |
| Eastern Asia | 69 | 0.2% |
| Eastern Europe | 17 | 0.0% |
| El Salvador | 26 | 0.1% |
| England | 3 | 0.0% |
| Europe | 100 | 0.2% |
| France | 6 | 0.0% |
| Germany | 74 | 0.2% |
| Guatemala | 516 | 1.2% |
| Haiti | 13 | 0.0% |
| Honduras | 122 | 0.3% |
| India | 148 | 0.3% |
| Iran | 2 | 0.0% |
| Jamaica | 3 | 0.0% |
| Japan | 56 | 0.1% |
| Korea | 13 | 0.0% |
| Latin America | 2,495 | 5.8% |
| Mexico | 1,572 | 3.6% |
| Nicaragua | 24 | 0.1% |
| Nigeria | 14 | 0.0% |
| Northern Europe | 3 | 0.0% |
| Peru | 64 | 0.2% |
| Russia | 17 | 0.0% |
| South America | 79 | 0.2% |
| South Central Asia | 150 | 0.4% |
| South Eastern Asia | 40 | 0.1% |
| Vietnam | 40 | 0.1% |
| Western Africa | 14 | 0.0% |
| Western Europe | 80 | 0.2% | View All 36 Rows |
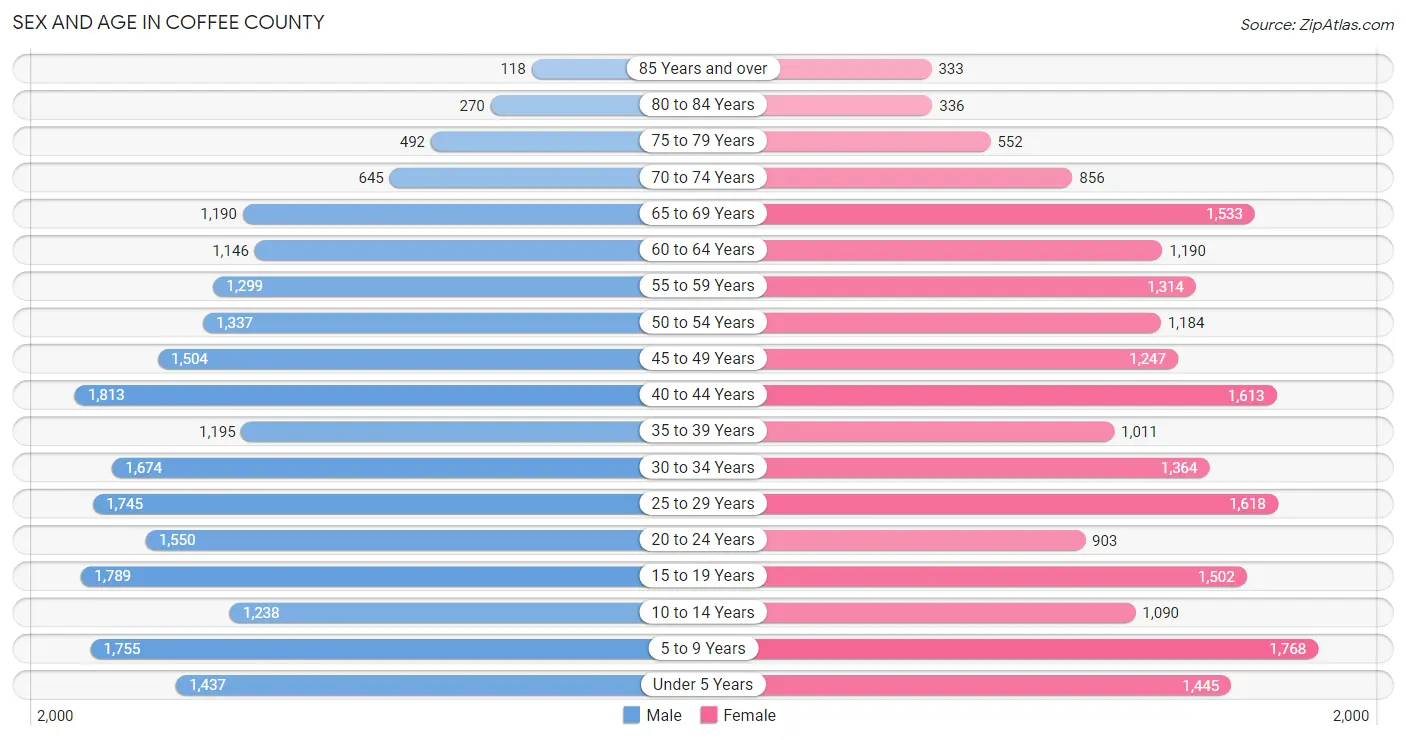
Sex and Age in Coffee County
Sex and Age in Coffee County
The most populous age groups in Coffee County are 40 to 44 Years (1,813 | 8.2%) for men and 5 to 9 Years (1,768 | 8.5%) for women.
| Age Bracket | Male | Female |
| Under 5 Years | 1,437 (6.5%) | 1,445 (6.9%) |
| 5 to 9 Years | 1,755 (7.9%) | 1,768 (8.5%) |
| 10 to 14 Years | 1,238 (5.6%) | 1,090 (5.2%) |
| 15 to 19 Years | 1,789 (8.1%) | 1,502 (7.2%) |
| 20 to 24 Years | 1,550 (7.0%) | 903 (4.3%) |
| 25 to 29 Years | 1,745 (7.9%) | 1,618 (7.8%) |
| 30 to 34 Years | 1,674 (7.5%) | 1,364 (6.5%) |
| 35 to 39 Years | 1,195 (5.4%) | 1,011 (4.9%) |
| 40 to 44 Years | 1,813 (8.2%) | 1,613 (7.7%) |
| 45 to 49 Years | 1,504 (6.8%) | 1,247 (6.0%) |
| 50 to 54 Years | 1,337 (6.0%) | 1,184 (5.7%) |
| 55 to 59 Years | 1,299 (5.9%) | 1,314 (6.3%) |
| 60 to 64 Years | 1,146 (5.2%) | 1,190 (5.7%) |
| 65 to 69 Years | 1,190 (5.4%) | 1,533 (7.3%) |
| 70 to 74 Years | 645 (2.9%) | 856 (4.1%) |
| 75 to 79 Years | 492 (2.2%) | 552 (2.6%) |
| 80 to 84 Years | 270 (1.2%) | 336 (1.6%) |
| 85 Years and over | 118 (0.5%) | 333 (1.6%) |
| Total | 22,197 (100.0%) | 20,859 (100.0%) |
Families and Households in Coffee County
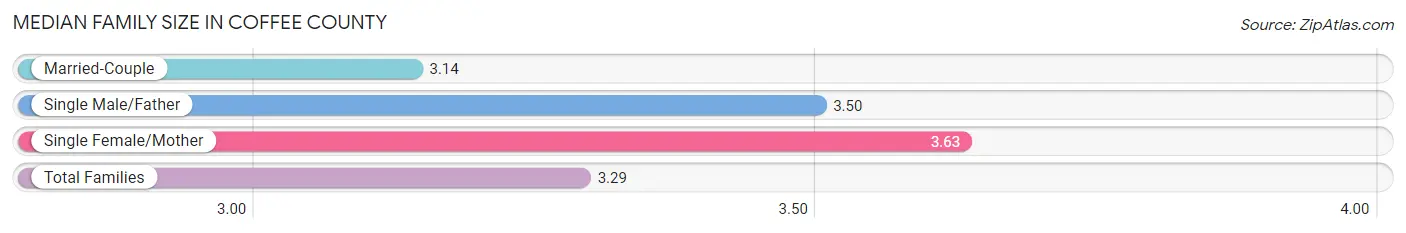
Median Family Size in Coffee County
The median family size in Coffee County is 3.29 persons per family, with single female/mother families (2,304 | 22.3%) accounting for the largest median family size of 3.63 persons per family. On the other hand, married-couple families (6,854 | 66.4%) represent the smallest median family size with 3.14 persons per family.
| Family Type | # Families | Family Size |
| Married-Couple | 6,854 (66.4%) | 3.14 |
| Single Male/Father | 1,158 (11.2%) | 3.50 |
| Single Female/Mother | 2,304 (22.3%) | 3.63 |
| Total Families | 10,316 (100.0%) | 3.29 |
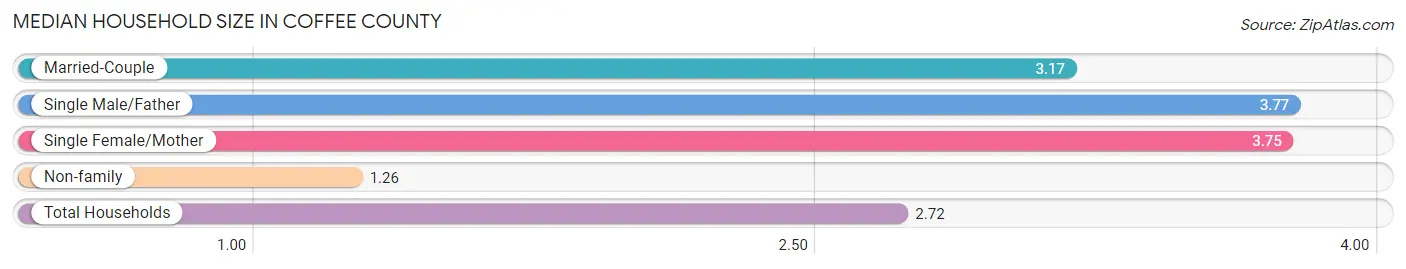
Median Household Size in Coffee County
The median household size in Coffee County is 2.72 persons per household, with single male/father households (1,158 | 7.8%) accounting for the largest median household size of 3.77 persons per household. non-family households (4,578 | 30.7%) represent the smallest median household size with 1.26 persons per household.
| Household Type | # Households | Household Size |
| Married-Couple | 6,854 (46.0%) | 3.17 |
| Single Male/Father | 1,158 (7.8%) | 3.77 |
| Single Female/Mother | 2,304 (15.5%) | 3.75 |
| Non-family | 4,578 (30.7%) | 1.26 |
| Total Households | 14,894 (100.0%) | 2.72 |
Household Size by Marriage Status in Coffee County
Out of a total of 14,894 households in Coffee County, 10,316 (69.3%) are family households, while 4,578 (30.7%) are nonfamily households. The most numerous type of family households are 2-person households, comprising 4,540, and the most common type of nonfamily households are 1-person households, comprising 3,865.
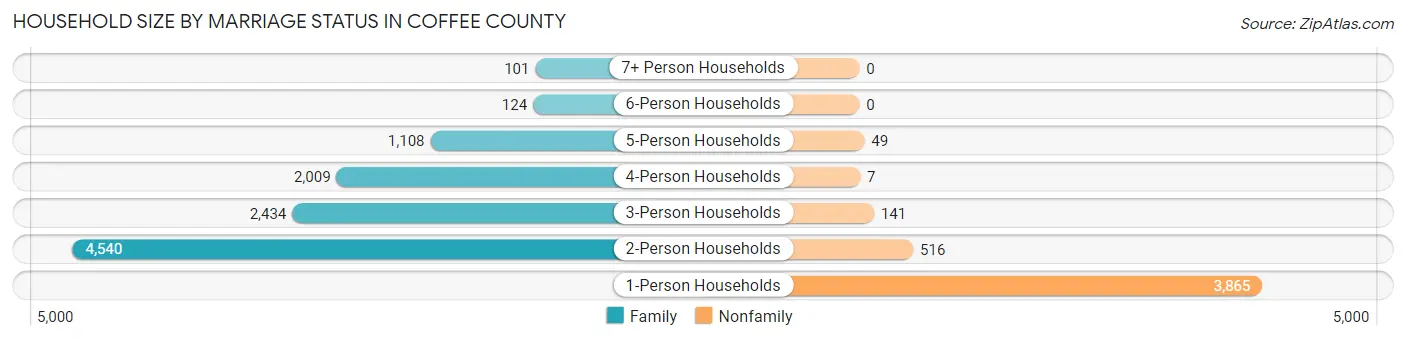
| Household Size | Family Households | Nonfamily Households |
| 1-Person Households | - | 3,865 (26.0%) |
| 2-Person Households | 4,540 (30.5%) | 516 (3.5%) |
| 3-Person Households | 2,434 (16.3%) | 141 (0.9%) |
| 4-Person Households | 2,009 (13.5%) | 7 (0.1%) |
| 5-Person Households | 1,108 (7.4%) | 49 (0.3%) |
| 6-Person Households | 124 (0.8%) | 0 (0.0%) |
| 7+ Person Households | 101 (0.7%) | 0 (0.0%) |
| Total | 10,316 (69.3%) | 4,578 (30.7%) |
Female Fertility in Coffee County
Fertility by Age in Coffee County
Average fertility rate in Coffee County is 93.0 births per 1,000 women. Women in the age bracket of 20 to 34 years have the highest fertility rate with 202.0 births per 1,000 women. Women in the age bracket of 20 to 34 years acount for 90.2% of all women with births.
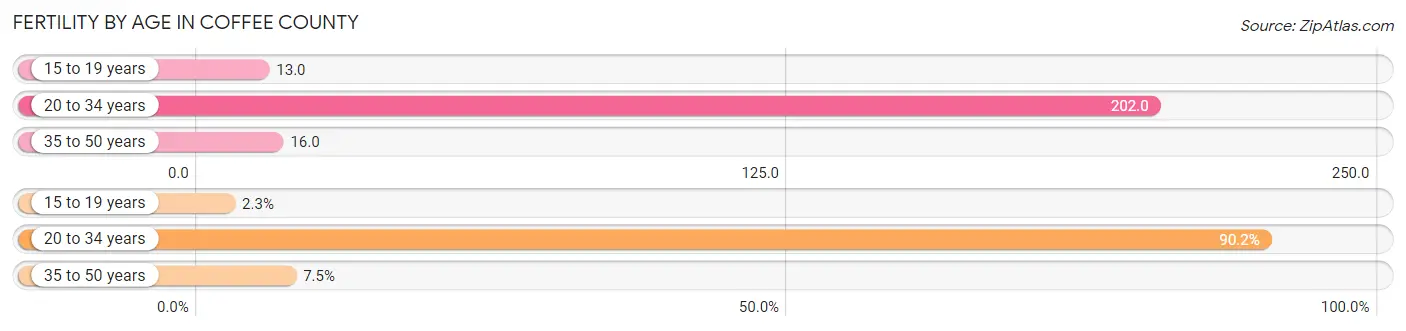
| Age Bracket | Women with Births | Births / 1,000 Women |
| 15 to 19 years | 20 (2.3%) | 13.0 |
| 20 to 34 years | 784 (90.2%) | 202.0 |
| 35 to 50 years | 65 (7.5%) | 16.0 |
| Total | 869 (100.0%) | 93.0 |
Fertility by Age by Marriage Status in Coffee County
61.2% of women with births (869) in Coffee County are married. The highest percentage of unmarried women with births falls into 15 to 19 years age bracket with 100.0% of them unmarried at the time of birth, while the lowest percentage of unmarried women with births belong to 35 to 50 years age bracket with 18.5% of them unmarried.
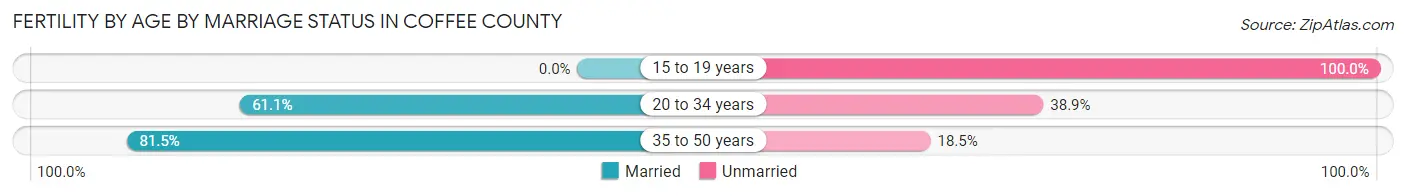
| Age Bracket | Married | Unmarried |
| 15 to 19 years | 0 (0.0%) | 20 (100.0%) |
| 20 to 34 years | 479 (61.1%) | 305 (38.9%) |
| 35 to 50 years | 53 (81.5%) | 12 (18.5%) |
| Total | 532 (61.2%) | 337 (38.8%) |
Fertility by Education in Coffee County
Average fertility rate in Coffee County is 93.0 births per 1,000 women. Women with the education attainment of high school diploma have the highest fertility rate of 128.0 births per 1,000 women, while women with the education attainment of graduate degree have the lowest fertility at 34.0 births per 1,000 women. Women with the education attainment of high school diploma represent 40.1% of all women with births.
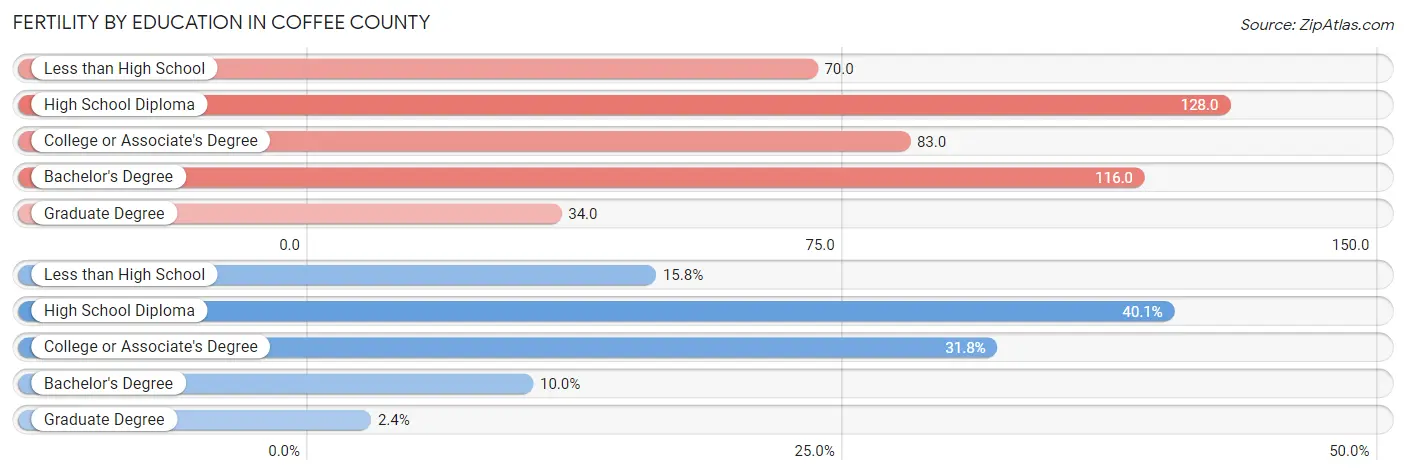
| Educational Attainment | Women with Births | Births / 1,000 Women |
| Less than High School | 137 (15.8%) | 70.0 |
| High School Diploma | 348 (40.1%) | 128.0 |
| College or Associate's Degree | 276 (31.8%) | 83.0 |
| Bachelor's Degree | 87 (10.0%) | 116.0 |
| Graduate Degree | 21 (2.4%) | 34.0 |
| Total | 869 (100.0%) | 93.0 |
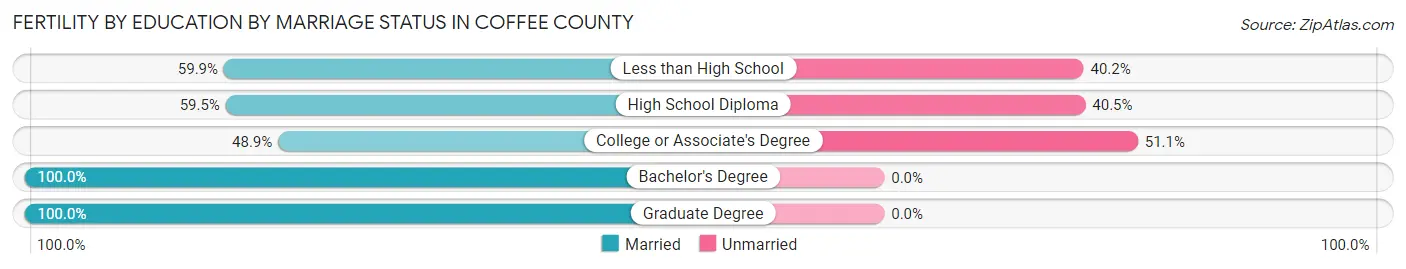
Fertility by Education by Marriage Status in Coffee County
38.8% of women with births in Coffee County are unmarried. Women with the educational attainment of bachelor's degree are most likely to be married with 100.0% of them married at childbirth, while women with the educational attainment of college or associate's degree are least likely to be married with 51.1% of them unmarried at childbirth.
| Educational Attainment | Married | Unmarried |
| Less than High School | 82 (59.9%) | 55 (40.2%) |
| High School Diploma | 207 (59.5%) | 141 (40.5%) |
| College or Associate's Degree | 135 (48.9%) | 141 (51.1%) |
| Bachelor's Degree | 87 (100.0%) | 0 (0.0%) |
| Graduate Degree | 21 (100.0%) | 0 (0.0%) |
| Total | 532 (61.2%) | 337 (38.8%) |
Employment Characteristics in Coffee County
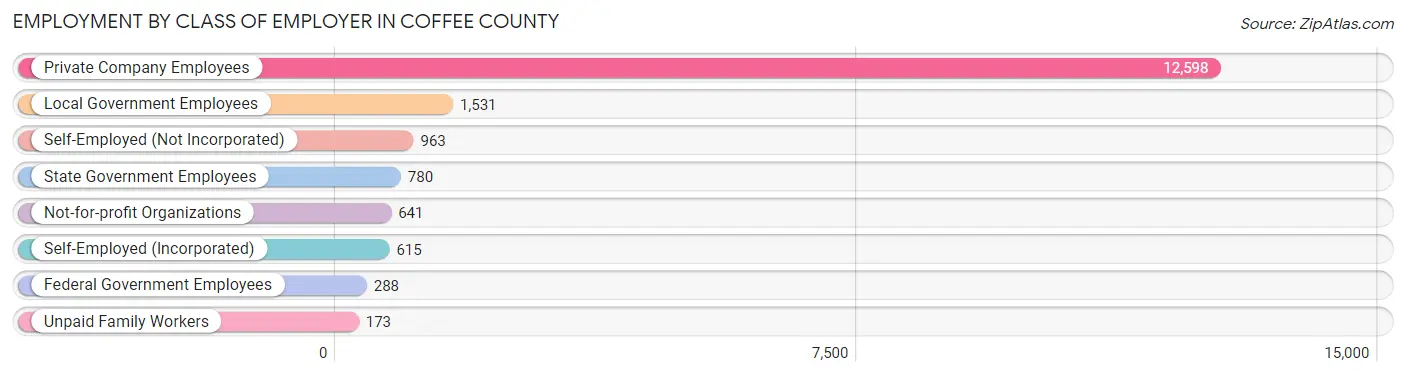
Employment by Class of Employer in Coffee County
Among the 17,589 employed individuals in Coffee County, private company employees (12,598 | 71.6%), local government employees (1,531 | 8.7%), and self-employed (not incorporated) (963 | 5.5%) make up the most common classes of employment.
| Employer Class | # Employees | % Employees |
| Private Company Employees | 12,598 | 71.6% |
| Self-Employed (Incorporated) | 615 | 3.5% |
| Self-Employed (Not Incorporated) | 963 | 5.5% |
| Not-for-profit Organizations | 641 | 3.6% |
| Local Government Employees | 1,531 | 8.7% |
| State Government Employees | 780 | 4.4% |
| Federal Government Employees | 288 | 1.6% |
| Unpaid Family Workers | 173 | 1.0% |
| Total | 17,589 | 100.0% |
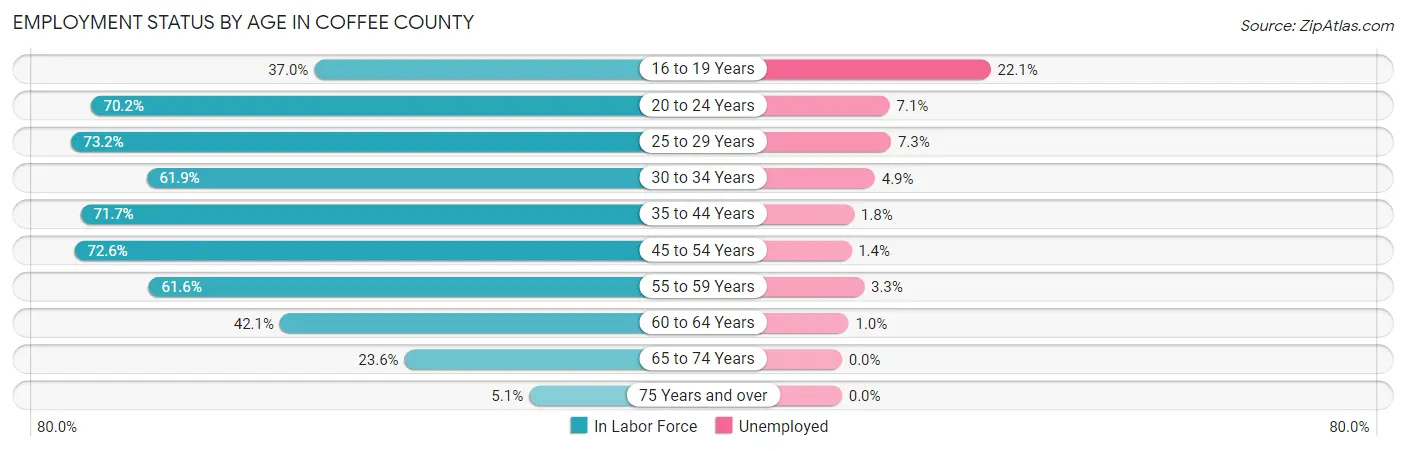
Employment Status by Age in Coffee County
According to the labor force statistics for Coffee County, out of the total population over 16 years of age (33,635), 55.3% or 18,600 individuals are in the labor force, with 4.3% or 800 of them unemployed. The age group with the highest labor force participation rate is 25 to 29 years, with 73.2% or 2,462 individuals in the labor force. Within the labor force, the 16 to 19 years age range has the highest percentage of unemployed individuals, with 22.1% or 213 of them being unemployed.
| Age Bracket | In Labor Force | Unemployed |
| 16 to 19 Years | 963 (37.0%) | 213 (22.1%) |
| 20 to 24 Years | 1,722 (70.2%) | 122 (7.1%) |
| 25 to 29 Years | 2,462 (73.2%) | 180 (7.3%) |
| 30 to 34 Years | 1,881 (61.9%) | 92 (4.9%) |
| 35 to 44 Years | 4,038 (71.7%) | 73 (1.8%) |
| 45 to 54 Years | 3,827 (72.6%) | 54 (1.4%) |
| 55 to 59 Years | 1,610 (61.6%) | 53 (3.3%) |
| 60 to 64 Years | 983 (42.1%) | 10 (1.0%) |
| 65 to 74 Years | 997 (23.6%) | 0 (0.0%) |
| 75 Years and over | 107 (5.1%) | 0 (0.0%) |
| Total | 18,600 (55.3%) | 800 (4.3%) |
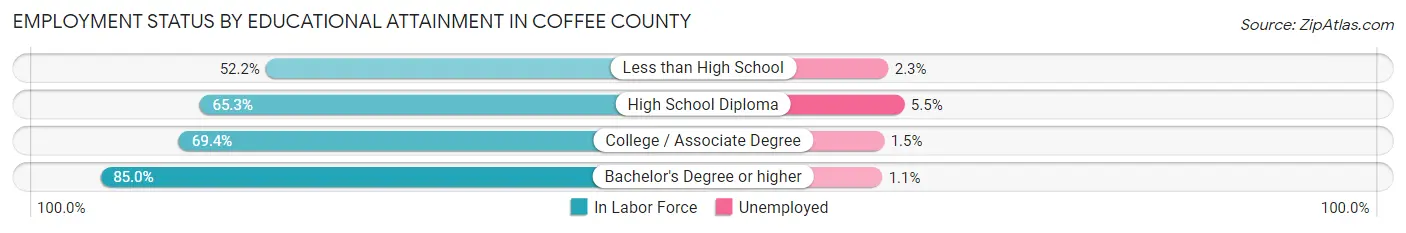
Employment Status by Educational Attainment in Coffee County
According to labor force statistics for Coffee County, 66.5% of individuals (14,799) out of the total population between 25 and 64 years of age (22,254) are in the labor force, with 3.1% or 459 of them being unemployed. The group with the highest labor force participation rate are those with the educational attainment of bachelor's degree or higher, with 85.0% or 2,597 individuals in the labor force. Within the labor force, individuals with high school diploma education have the highest percentage of unemployment, with 5.5% or 313 of them being unemployed.
| Educational Attainment | In Labor Force | Unemployed |
| Less than High School | 2,335 (52.2%) | 103 (2.3%) |
| High School Diploma | 5,697 (65.3%) | 480 (5.5%) |
| College / Associate Degree | 4,165 (69.4%) | 90 (1.5%) |
| Bachelor's Degree or higher | 2,597 (85.0%) | 34 (1.1%) |
| Total | 14,799 (66.5%) | 690 (3.1%) |
Employment Occupations by Sex in Coffee County
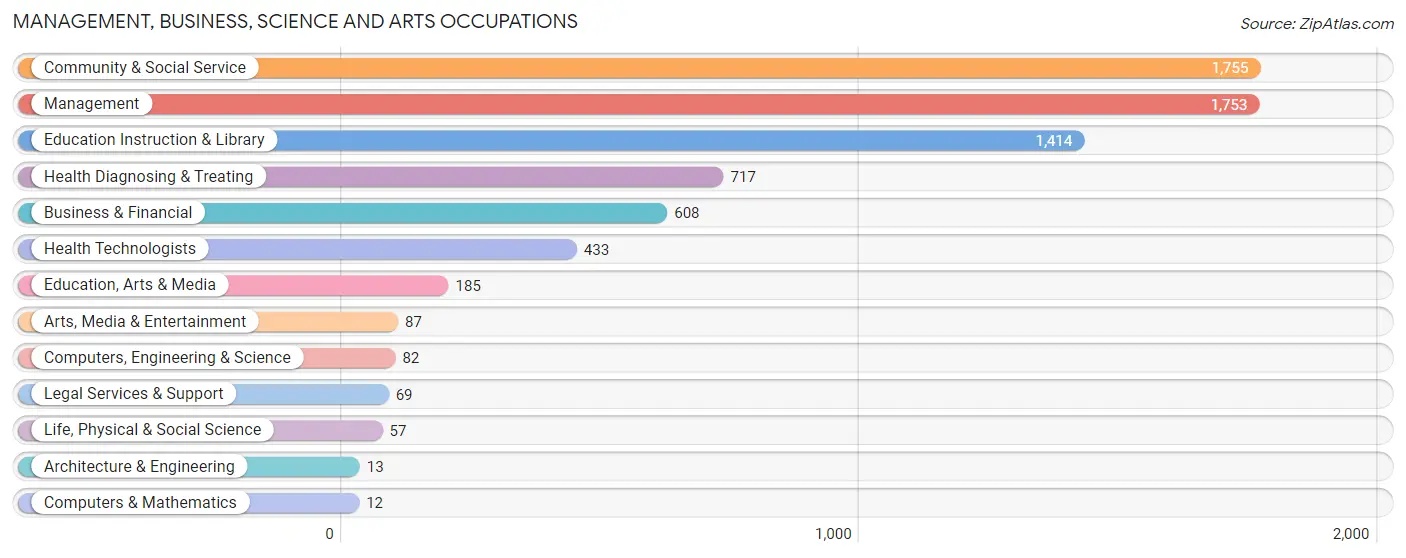
Management, Business, Science and Arts Occupations
The most common Management, Business, Science and Arts occupations in Coffee County are Community & Social Service (1,755 | 9.9%), Management (1,753 | 9.9%), Education Instruction & Library (1,414 | 8.0%), Health Diagnosing & Treating (717 | 4.1%), and Business & Financial (608 | 3.4%).
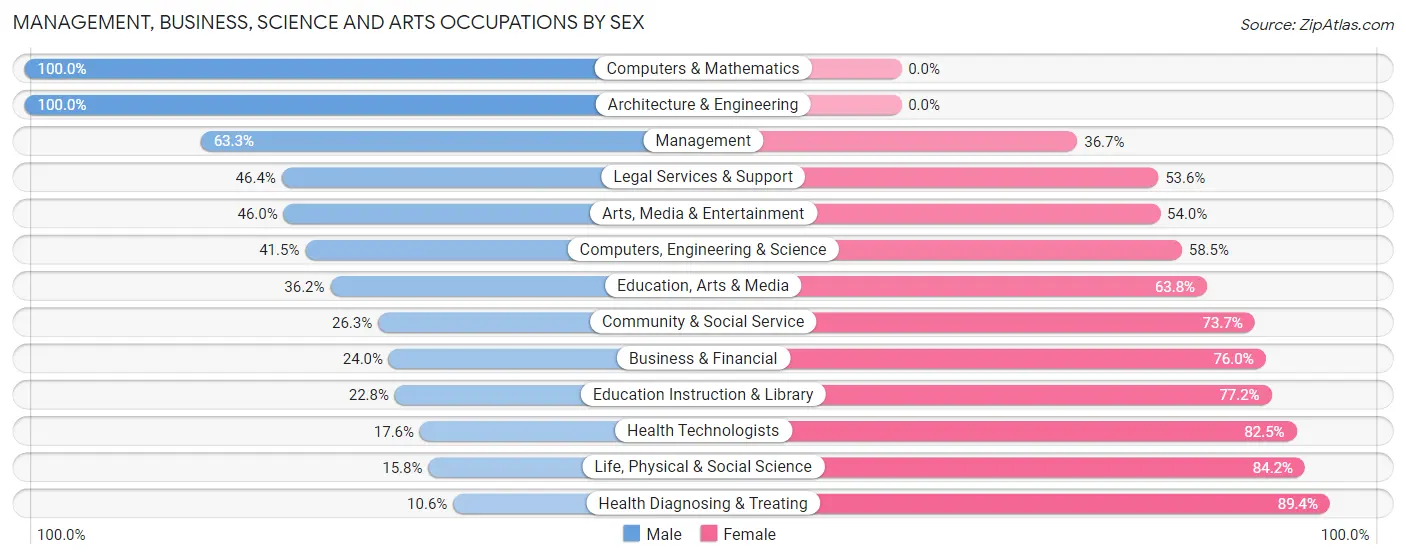
Management, Business, Science and Arts Occupations by Sex
Within the Management, Business, Science and Arts occupations in Coffee County, the most male-oriented occupations are Computers & Mathematics (100.0%), Architecture & Engineering (100.0%), and Management (63.3%), while the most female-oriented occupations are Health Diagnosing & Treating (89.4%), Life, Physical & Social Science (84.2%), and Health Technologists (82.5%).
| Occupation | Male | Female |
| Management | 1,109 (63.3%) | 644 (36.7%) |
| Business & Financial | 146 (24.0%) | 462 (76.0%) |
| Computers, Engineering & Science | 34 (41.5%) | 48 (58.5%) |
| Computers & Mathematics | 12 (100.0%) | 0 (0.0%) |
| Architecture & Engineering | 13 (100.0%) | 0 (0.0%) |
| Life, Physical & Social Science | 9 (15.8%) | 48 (84.2%) |
| Community & Social Service | 461 (26.3%) | 1,294 (73.7%) |
| Education, Arts & Media | 67 (36.2%) | 118 (63.8%) |
| Legal Services & Support | 32 (46.4%) | 37 (53.6%) |
| Education Instruction & Library | 322 (22.8%) | 1,092 (77.2%) |
| Arts, Media & Entertainment | 40 (46.0%) | 47 (54.0%) |
| Health Diagnosing & Treating | 76 (10.6%) | 641 (89.4%) |
| Health Technologists | 76 (17.5%) | 357 (82.5%) |
| Total (Category) | 1,826 (37.1%) | 3,089 (62.8%) |
| Total (Overall) | 9,659 (54.5%) | 8,051 (45.5%) |
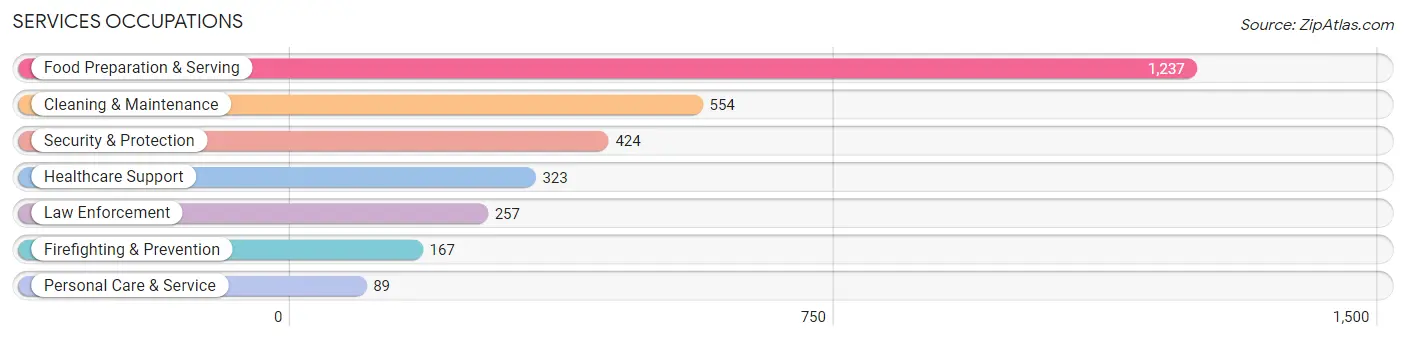
Services Occupations
The most common Services occupations in Coffee County are Food Preparation & Serving (1,237 | 7.0%), Cleaning & Maintenance (554 | 3.1%), Security & Protection (424 | 2.4%), Healthcare Support (323 | 1.8%), and Law Enforcement (257 | 1.5%).
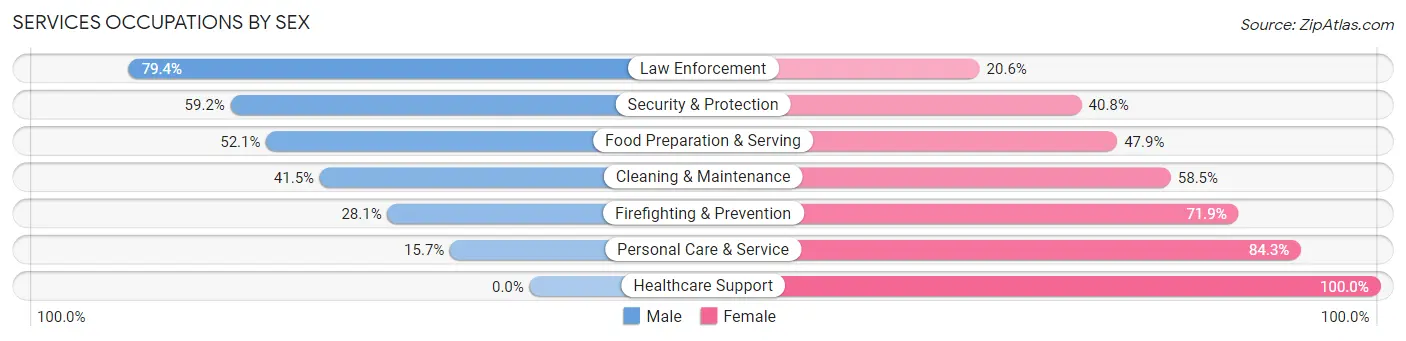
Services Occupations by Sex
Within the Services occupations in Coffee County, the most male-oriented occupations are Law Enforcement (79.4%), Security & Protection (59.2%), and Food Preparation & Serving (52.1%), while the most female-oriented occupations are Healthcare Support (100.0%), Personal Care & Service (84.3%), and Firefighting & Prevention (71.9%).
| Occupation | Male | Female |
| Healthcare Support | 0 (0.0%) | 323 (100.0%) |
| Security & Protection | 251 (59.2%) | 173 (40.8%) |
| Firefighting & Prevention | 47 (28.1%) | 120 (71.9%) |
| Law Enforcement | 204 (79.4%) | 53 (20.6%) |
| Food Preparation & Serving | 645 (52.1%) | 592 (47.9%) |
| Cleaning & Maintenance | 230 (41.5%) | 324 (58.5%) |
| Personal Care & Service | 14 (15.7%) | 75 (84.3%) |
| Total (Category) | 1,140 (43.4%) | 1,487 (56.6%) |
| Total (Overall) | 9,659 (54.5%) | 8,051 (45.5%) |
Sales and Office Occupations
The most common Sales and Office occupations in Coffee County are Office & Administration (2,272 | 12.8%), and Sales & Related (1,304 | 7.4%).
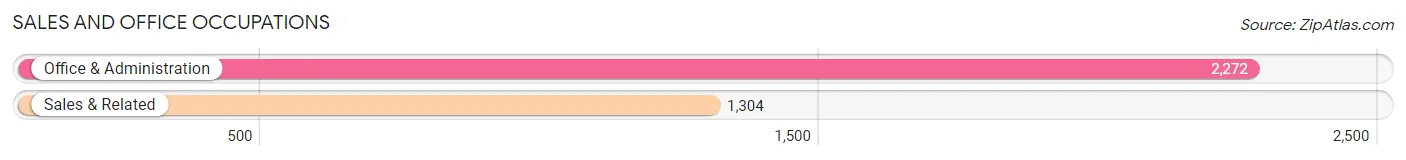
Sales and Office Occupations by Sex

| Occupation | Male | Female |
| Sales & Related | 786 (60.3%) | 518 (39.7%) |
| Office & Administration | 519 (22.8%) | 1,753 (77.2%) |
| Total (Category) | 1,305 (36.5%) | 2,271 (63.5%) |
| Total (Overall) | 9,659 (54.5%) | 8,051 (45.5%) |
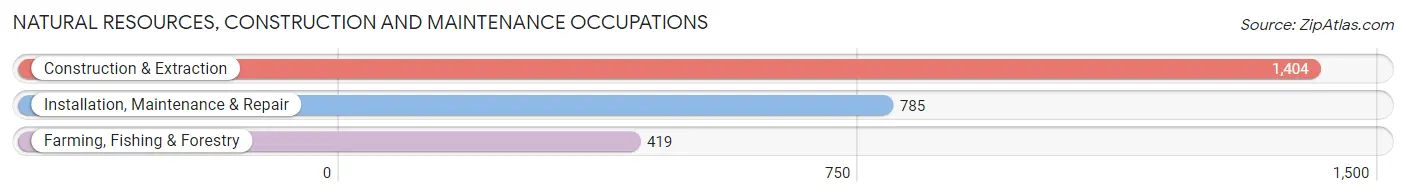
Natural Resources, Construction and Maintenance Occupations
The most common Natural Resources, Construction and Maintenance occupations in Coffee County are Construction & Extraction (1,404 | 7.9%), Installation, Maintenance & Repair (785 | 4.4%), and Farming, Fishing & Forestry (419 | 2.4%).
Natural Resources, Construction and Maintenance Occupations by Sex
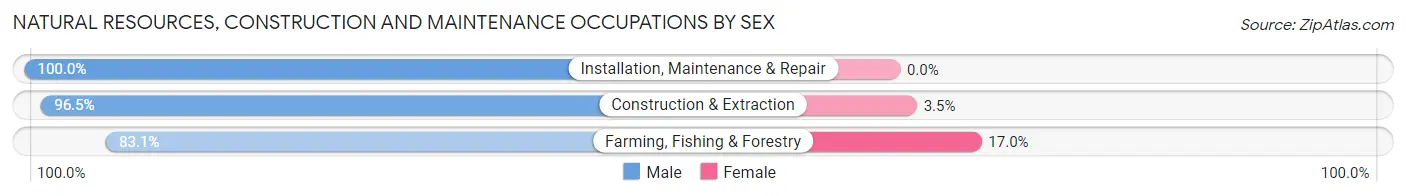
| Occupation | Male | Female |
| Farming, Fishing & Forestry | 348 (83.1%) | 71 (17.0%) |
| Construction & Extraction | 1,355 (96.5%) | 49 (3.5%) |
| Installation, Maintenance & Repair | 785 (100.0%) | 0 (0.0%) |
| Total (Category) | 2,488 (95.4%) | 120 (4.6%) |
| Total (Overall) | 9,659 (54.5%) | 8,051 (45.5%) |
Production, Transportation and Moving Occupations
The most common Production, Transportation and Moving occupations in Coffee County are Production (1,836 | 10.4%), Material Moving (1,284 | 7.2%), and Transportation (864 | 4.9%).
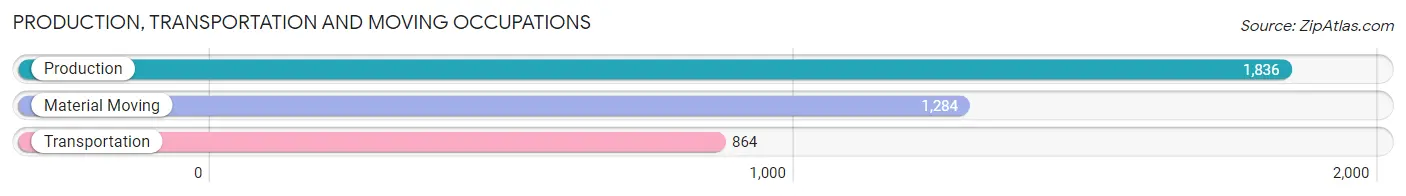
Production, Transportation and Moving Occupations by Sex
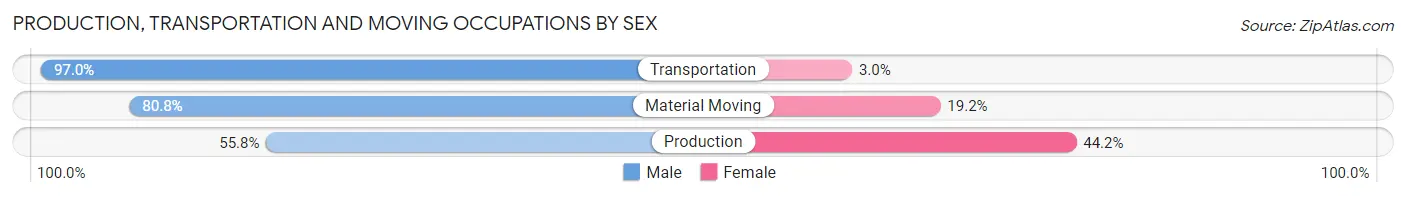
| Occupation | Male | Female |
| Production | 1,025 (55.8%) | 811 (44.2%) |
| Transportation | 838 (97.0%) | 26 (3.0%) |
| Material Moving | 1,037 (80.8%) | 247 (19.2%) |
| Total (Category) | 2,900 (72.8%) | 1,084 (27.2%) |
| Total (Overall) | 9,659 (54.5%) | 8,051 (45.5%) |
Employment Industries by Sex in Coffee County
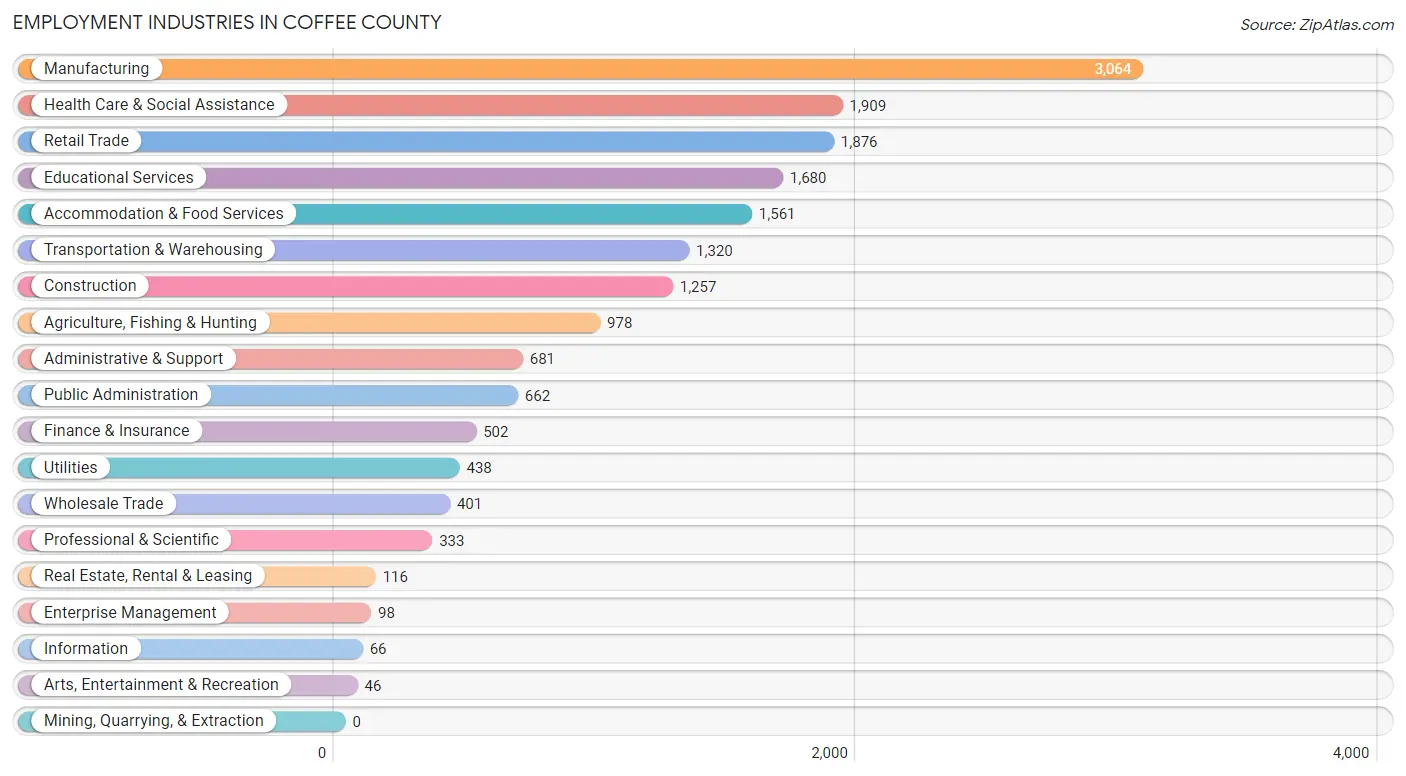
Employment Industries in Coffee County
The major employment industries in Coffee County include Manufacturing (3,064 | 17.3%), Health Care & Social Assistance (1,909 | 10.8%), Retail Trade (1,876 | 10.6%), Educational Services (1,680 | 9.5%), and Accommodation & Food Services (1,561 | 8.8%).
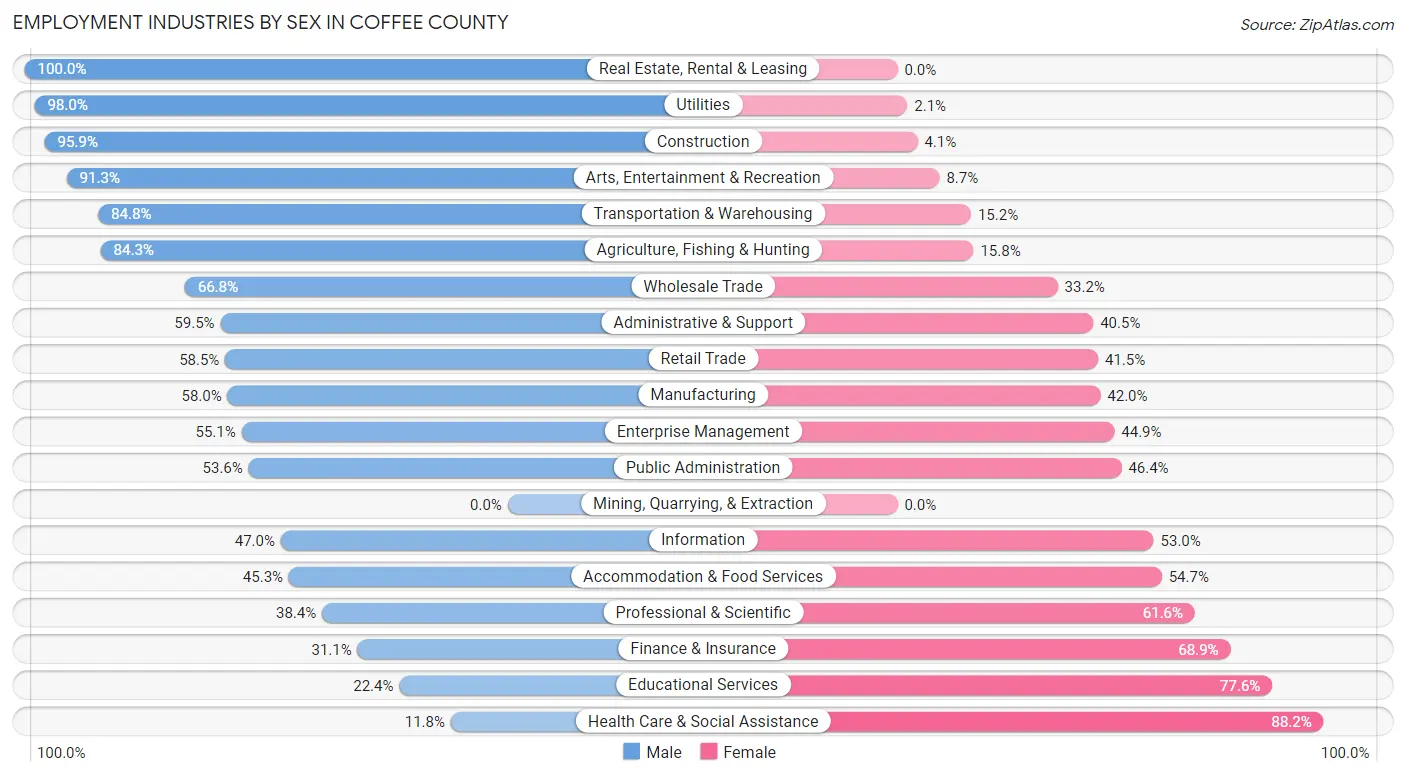
Employment Industries by Sex in Coffee County
The Coffee County industries that see more men than women are Real Estate, Rental & Leasing (100.0%), Utilities (98.0%), and Construction (95.9%), whereas the industries that tend to have a higher number of women are Health Care & Social Assistance (88.2%), Educational Services (77.6%), and Finance & Insurance (68.9%).
| Industry | Male | Female |
| Agriculture, Fishing & Hunting | 824 (84.3%) | 154 (15.8%) |
| Mining, Quarrying, & Extraction | 0 (0.0%) | 0 (0.0%) |
| Construction | 1,205 (95.9%) | 52 (4.1%) |
| Manufacturing | 1,777 (58.0%) | 1,287 (42.0%) |
| Wholesale Trade | 268 (66.8%) | 133 (33.2%) |
| Retail Trade | 1,097 (58.5%) | 779 (41.5%) |
| Transportation & Warehousing | 1,119 (84.8%) | 201 (15.2%) |
| Utilities | 429 (98.0%) | 9 (2.1%) |
| Information | 31 (47.0%) | 35 (53.0%) |
| Finance & Insurance | 156 (31.1%) | 346 (68.9%) |
| Real Estate, Rental & Leasing | 116 (100.0%) | 0 (0.0%) |
| Professional & Scientific | 128 (38.4%) | 205 (61.6%) |
| Enterprise Management | 54 (55.1%) | 44 (44.9%) |
| Administrative & Support | 405 (59.5%) | 276 (40.5%) |
| Educational Services | 377 (22.4%) | 1,303 (77.6%) |
| Health Care & Social Assistance | 225 (11.8%) | 1,684 (88.2%) |
| Arts, Entertainment & Recreation | 42 (91.3%) | 4 (8.7%) |
| Accommodation & Food Services | 707 (45.3%) | 854 (54.7%) |
| Public Administration | 355 (53.6%) | 307 (46.4%) |
| Total | 9,659 (54.5%) | 8,051 (45.5%) |
Education in Coffee County
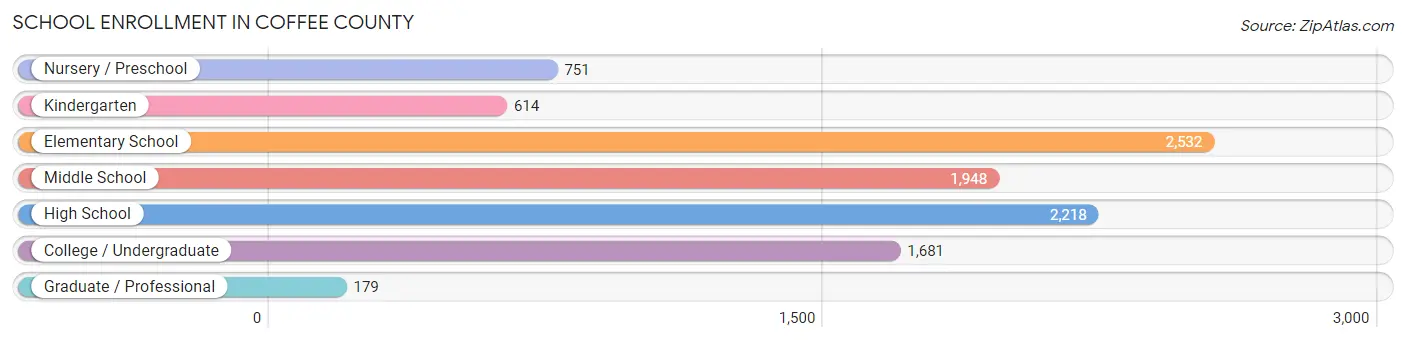
School Enrollment in Coffee County
The most common levels of schooling among the 9,923 students in Coffee County are elementary school (2,532 | 25.5%), high school (2,218 | 22.4%), and middle school (1,948 | 19.6%).
| School Level | # Students | % Students |
| Nursery / Preschool | 751 | 7.6% |
| Kindergarten | 614 | 6.2% |
| Elementary School | 2,532 | 25.5% |
| Middle School | 1,948 | 19.6% |
| High School | 2,218 | 22.4% |
| College / Undergraduate | 1,681 | 16.9% |
| Graduate / Professional | 179 | 1.8% |
| Total | 9,923 | 100.0% |
School Enrollment by Age by Funding Source in Coffee County
Out of a total of 9,923 students who are enrolled in schools in Coffee County, 982 (9.9%) attend a private institution, while the remaining 8,941 (90.1%) are enrolled in public schools. The age group of 25 to 34 year olds has the highest likelihood of being enrolled in private schools, with 155 (53.4% in the age bracket) enrolled. Conversely, the age group of 10 to 14 year olds has the lowest likelihood of being enrolled in a private school, with 2,204 (95.7% in the age bracket) attending a public institution.
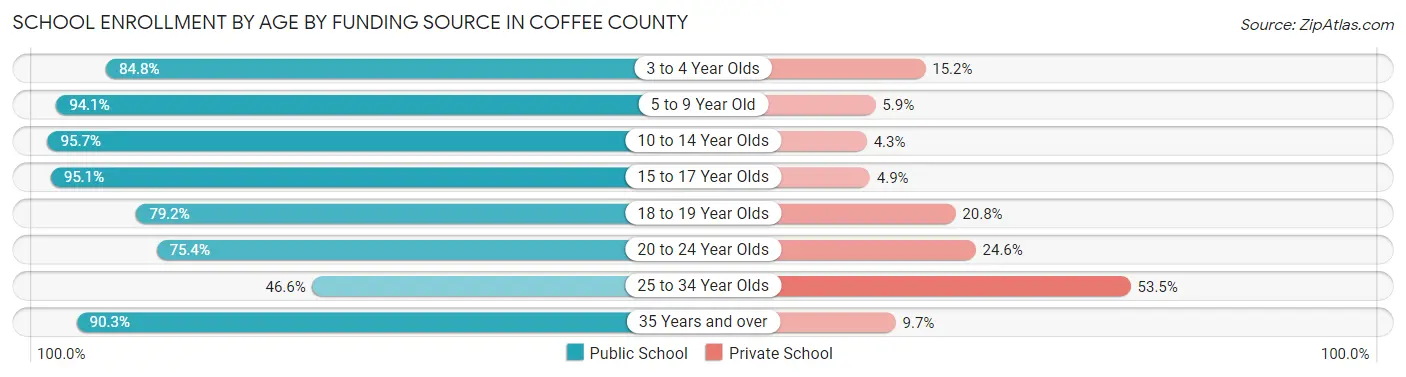
| Age Bracket | Public School | Private School |
| 3 to 4 Year Olds | 396 (84.8%) | 71 (15.2%) |
| 5 to 9 Year Old | 3,086 (94.1%) | 194 (5.9%) |
| 10 to 14 Year Olds | 2,204 (95.7%) | 99 (4.3%) |
| 15 to 17 Year Olds | 1,656 (95.1%) | 85 (4.9%) |
| 18 to 19 Year Olds | 761 (79.2%) | 200 (20.8%) |
| 20 to 24 Year Olds | 454 (75.4%) | 148 (24.6%) |
| 25 to 34 Year Olds | 135 (46.6%) | 155 (53.4%) |
| 35 Years and over | 252 (90.3%) | 27 (9.7%) |
| Total | 8,941 (90.1%) | 982 (9.9%) |
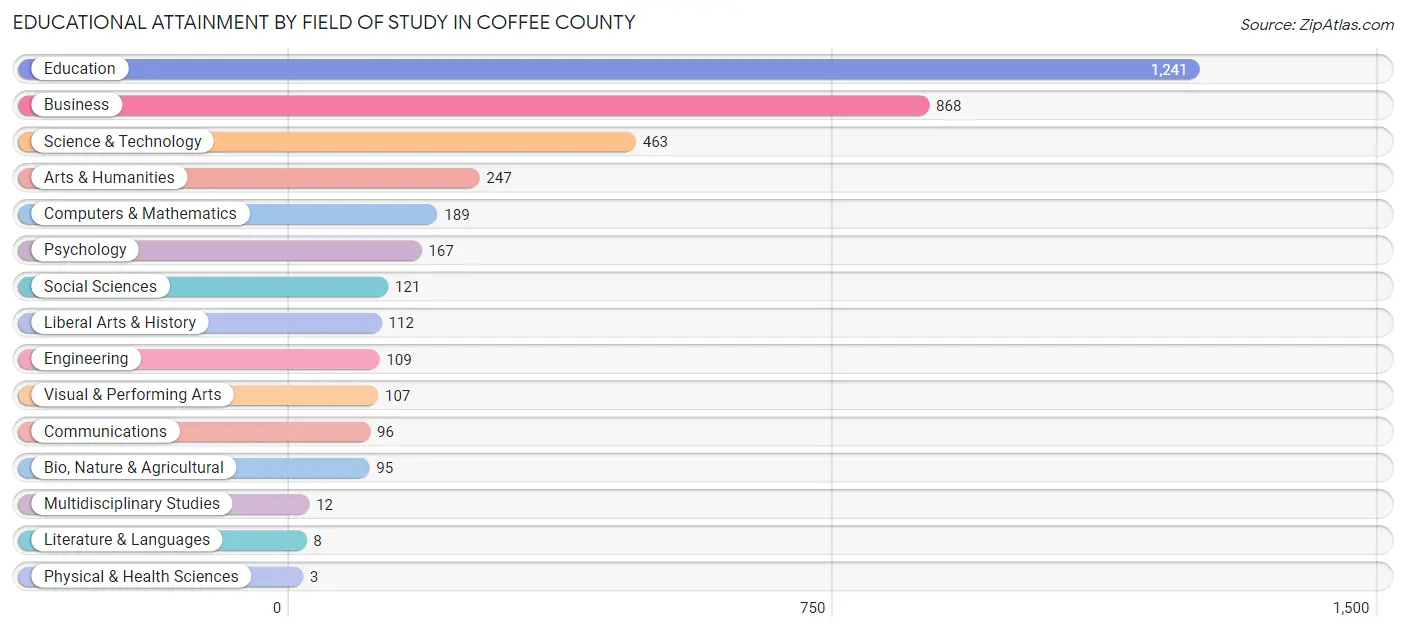
Educational Attainment by Field of Study in Coffee County
Education (1,241 | 32.3%), business (868 | 22.6%), science & technology (463 | 12.1%), arts & humanities (247 | 6.4%), and computers & mathematics (189 | 4.9%) are the most common fields of study among 3,838 individuals in Coffee County who have obtained a bachelor's degree or higher.
| Field of Study | # Graduates | % Graduates |
| Computers & Mathematics | 189 | 4.9% |
| Bio, Nature & Agricultural | 95 | 2.5% |
| Physical & Health Sciences | 3 | 0.1% |
| Psychology | 167 | 4.3% |
| Social Sciences | 121 | 3.2% |
| Engineering | 109 | 2.8% |
| Multidisciplinary Studies | 12 | 0.3% |
| Science & Technology | 463 | 12.1% |
| Business | 868 | 22.6% |
| Education | 1,241 | 32.3% |
| Literature & Languages | 8 | 0.2% |
| Liberal Arts & History | 112 | 2.9% |
| Visual & Performing Arts | 107 | 2.8% |
| Communications | 96 | 2.5% |
| Arts & Humanities | 247 | 6.4% |
| Total | 3,838 | 100.0% |
Transportation & Commute in Coffee County
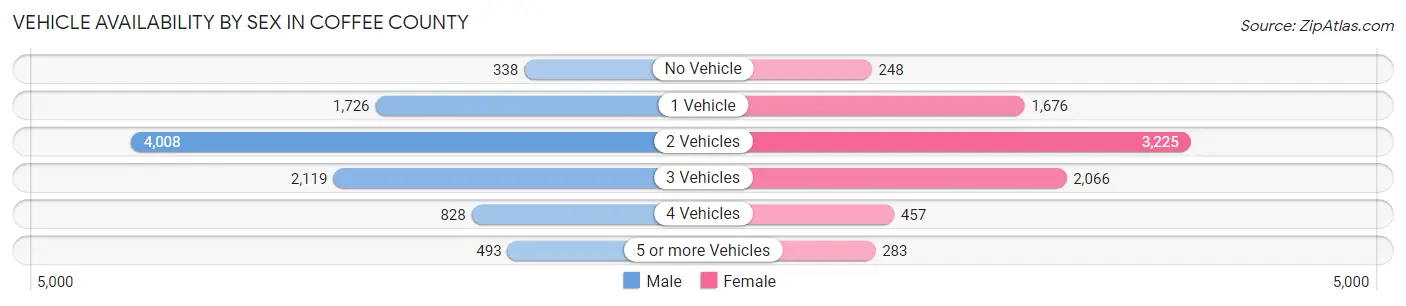
Vehicle Availability by Sex in Coffee County
The most prevalent vehicle ownership categories in Coffee County are males with 2 vehicles (4,008, accounting for 42.1%) and females with 2 vehicles (3,225, making up 50.4%).
| Vehicles Available | Male | Female |
| No Vehicle | 338 (3.5%) | 248 (3.1%) |
| 1 Vehicle | 1,726 (18.1%) | 1,676 (21.1%) |
| 2 Vehicles | 4,008 (42.1%) | 3,225 (40.5%) |
| 3 Vehicles | 2,119 (22.3%) | 2,066 (26.0%) |
| 4 Vehicles | 828 (8.7%) | 457 (5.7%) |
| 5 or more Vehicles | 493 (5.2%) | 283 (3.6%) |
| Total | 9,512 (100.0%) | 7,955 (100.0%) |
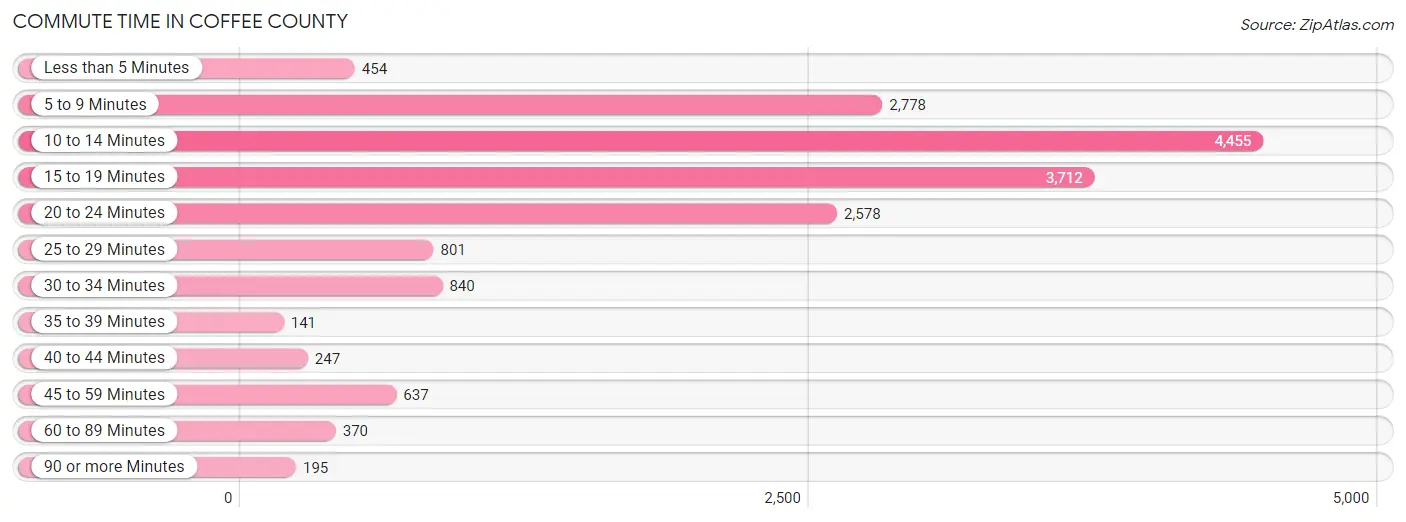
Commute Time in Coffee County
The most frequently occuring commute durations in Coffee County are 10 to 14 minutes (4,455 commuters, 25.9%), 15 to 19 minutes (3,712 commuters, 21.6%), and 5 to 9 minutes (2,778 commuters, 16.1%).
| Commute Time | # Commuters | % Commuters |
| Less than 5 Minutes | 454 | 2.6% |
| 5 to 9 Minutes | 2,778 | 16.1% |
| 10 to 14 Minutes | 4,455 | 25.9% |
| 15 to 19 Minutes | 3,712 | 21.6% |
| 20 to 24 Minutes | 2,578 | 15.0% |
| 25 to 29 Minutes | 801 | 4.6% |
| 30 to 34 Minutes | 840 | 4.9% |
| 35 to 39 Minutes | 141 | 0.8% |
| 40 to 44 Minutes | 247 | 1.4% |
| 45 to 59 Minutes | 637 | 3.7% |
| 60 to 89 Minutes | 370 | 2.1% |
| 90 or more Minutes | 195 | 1.1% |
Commute Time by Sex in Coffee County
The most common commute times in Coffee County are 10 to 14 minutes (1,890 commuters, 20.2%) for males and 10 to 14 minutes (2,565 commuters, 32.6%) for females.
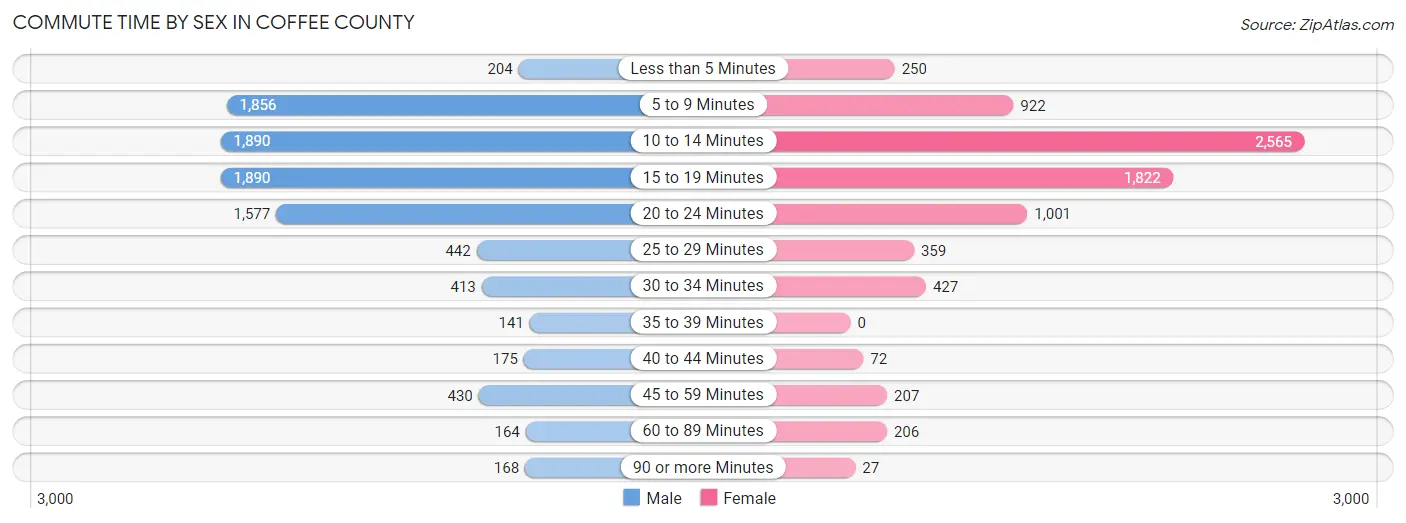
| Commute Time | Male | Female |
| Less than 5 Minutes | 204 (2.2%) | 250 (3.2%) |
| 5 to 9 Minutes | 1,856 (19.9%) | 922 (11.7%) |
| 10 to 14 Minutes | 1,890 (20.2%) | 2,565 (32.6%) |
| 15 to 19 Minutes | 1,890 (20.2%) | 1,822 (23.2%) |
| 20 to 24 Minutes | 1,577 (16.9%) | 1,001 (12.7%) |
| 25 to 29 Minutes | 442 (4.7%) | 359 (4.6%) |
| 30 to 34 Minutes | 413 (4.4%) | 427 (5.4%) |
| 35 to 39 Minutes | 141 (1.5%) | 0 (0.0%) |
| 40 to 44 Minutes | 175 (1.9%) | 72 (0.9%) |
| 45 to 59 Minutes | 430 (4.6%) | 207 (2.6%) |
| 60 to 89 Minutes | 164 (1.8%) | 206 (2.6%) |
| 90 or more Minutes | 168 (1.8%) | 27 (0.3%) |
Time of Departure to Work by Sex in Coffee County
The most frequent times of departure to work in Coffee County are 7:00 AM to 7:29 AM (1,689, 18.1%) for males and 7:00 AM to 7:29 AM (1,189, 15.1%) for females.
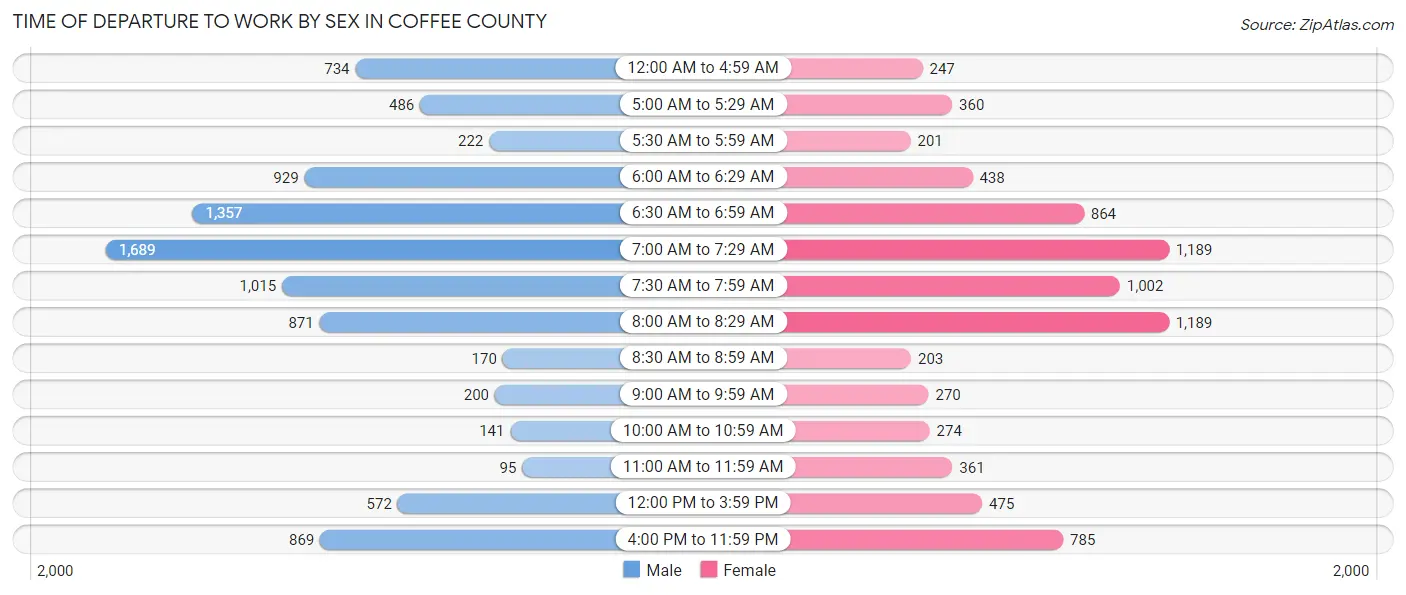
| Time of Departure | Male | Female |
| 12:00 AM to 4:59 AM | 734 (7.9%) | 247 (3.1%) |
| 5:00 AM to 5:29 AM | 486 (5.2%) | 360 (4.6%) |
| 5:30 AM to 5:59 AM | 222 (2.4%) | 201 (2.6%) |
| 6:00 AM to 6:29 AM | 929 (9.9%) | 438 (5.6%) |
| 6:30 AM to 6:59 AM | 1,357 (14.5%) | 864 (11.0%) |
| 7:00 AM to 7:29 AM | 1,689 (18.1%) | 1,189 (15.1%) |
| 7:30 AM to 7:59 AM | 1,015 (10.9%) | 1,002 (12.8%) |
| 8:00 AM to 8:29 AM | 871 (9.3%) | 1,189 (15.1%) |
| 8:30 AM to 8:59 AM | 170 (1.8%) | 203 (2.6%) |
| 9:00 AM to 9:59 AM | 200 (2.1%) | 270 (3.4%) |
| 10:00 AM to 10:59 AM | 141 (1.5%) | 274 (3.5%) |
| 11:00 AM to 11:59 AM | 95 (1.0%) | 361 (4.6%) |
| 12:00 PM to 3:59 PM | 572 (6.1%) | 475 (6.0%) |
| 4:00 PM to 11:59 PM | 869 (9.3%) | 785 (10.0%) |
| Total | 9,350 (100.0%) | 7,858 (100.0%) |
Housing Occupancy in Coffee County
Occupancy by Ownership in Coffee County
Of the total 14,894 dwellings in Coffee County, owner-occupied units account for 9,846 (66.1%), while renter-occupied units make up 5,048 (33.9%).
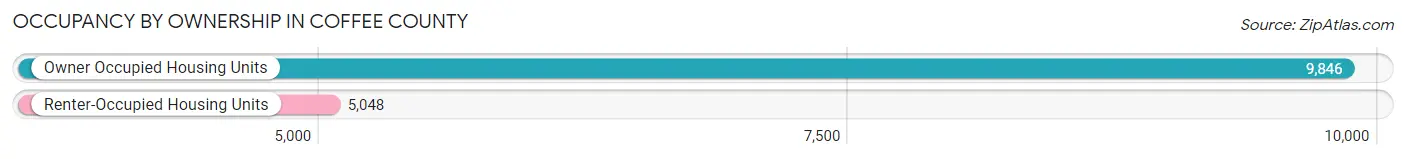
| Occupancy | # Housing Units | % Housing Units |
| Owner Occupied Housing Units | 9,846 | 66.1% |
| Renter-Occupied Housing Units | 5,048 | 33.9% |
| Total Occupied Housing Units | 14,894 | 100.0% |
Occupancy by Household Size in Coffee County
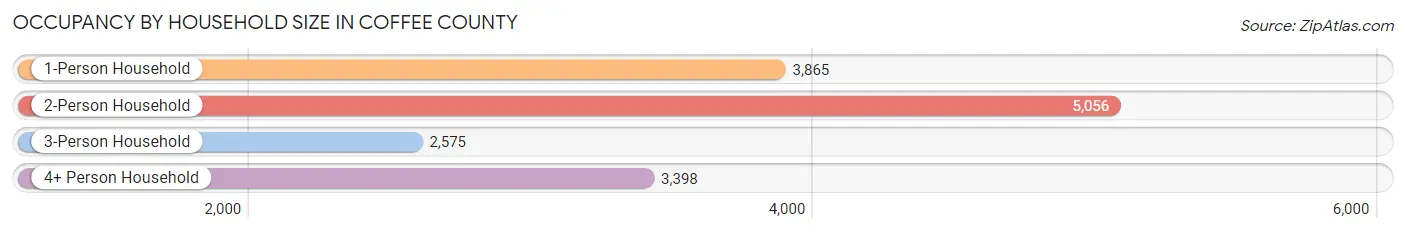
| Household Size | # Housing Units | % Housing Units |
| 1-Person Household | 3,865 | 26.0% |
| 2-Person Household | 5,056 | 34.0% |
| 3-Person Household | 2,575 | 17.3% |
| 4+ Person Household | 3,398 | 22.8% |
| Total Housing Units | 14,894 | 100.0% |
Occupancy by Ownership by Household Size in Coffee County
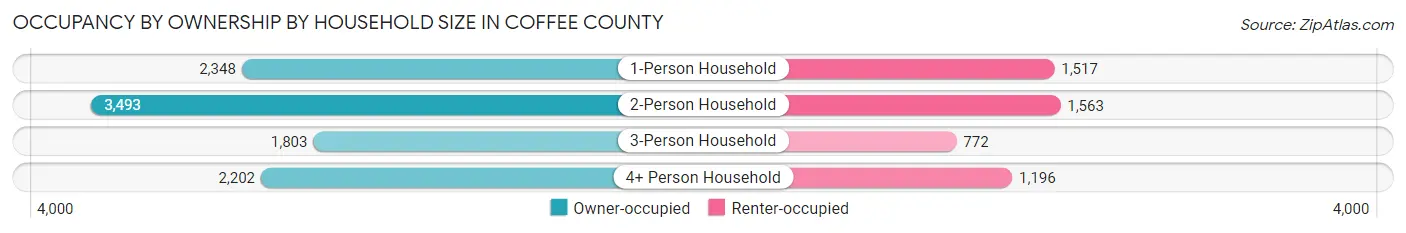
| Household Size | Owner-occupied | Renter-occupied |
| 1-Person Household | 2,348 (60.8%) | 1,517 (39.3%) |
| 2-Person Household | 3,493 (69.1%) | 1,563 (30.9%) |
| 3-Person Household | 1,803 (70.0%) | 772 (30.0%) |
| 4+ Person Household | 2,202 (64.8%) | 1,196 (35.2%) |
| Total Housing Units | 9,846 (66.1%) | 5,048 (33.9%) |
Occupancy by Educational Attainment in Coffee County
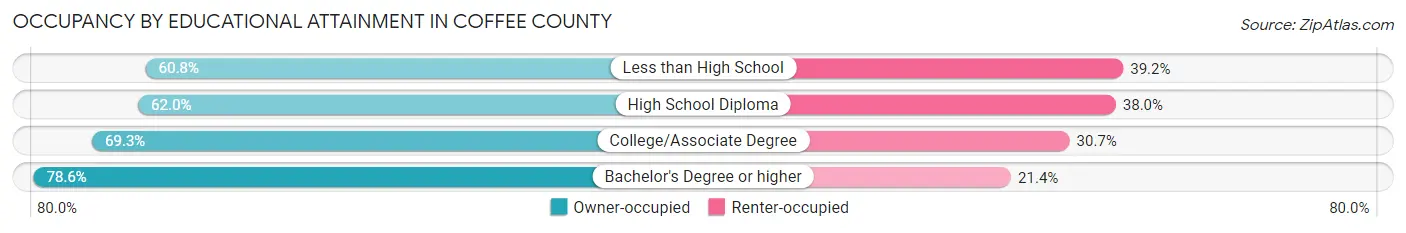
| Household Size | Owner-occupied | Renter-occupied |
| Less than High School | 1,849 (60.8%) | 1,192 (39.2%) |
| High School Diploma | 3,528 (62.0%) | 2,164 (38.0%) |
| College/Associate Degree | 2,784 (69.3%) | 1,233 (30.7%) |
| Bachelor's Degree or higher | 1,685 (78.6%) | 459 (21.4%) |
Occupancy by Age of Householder in Coffee County
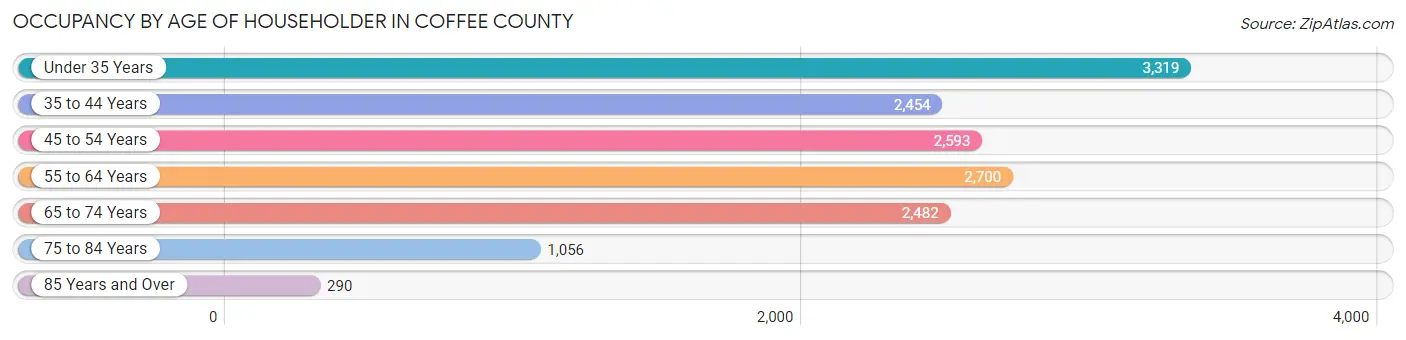
| Age Bracket | # Households | % Households |
| Under 35 Years | 3,319 | 22.3% |
| 35 to 44 Years | 2,454 | 16.5% |
| 45 to 54 Years | 2,593 | 17.4% |
| 55 to 64 Years | 2,700 | 18.1% |
| 65 to 74 Years | 2,482 | 16.7% |
| 75 to 84 Years | 1,056 | 7.1% |
| 85 Years and Over | 290 | 1.9% |
| Total | 14,894 | 100.0% |
Housing Finances in Coffee County
Median Income by Occupancy in Coffee County
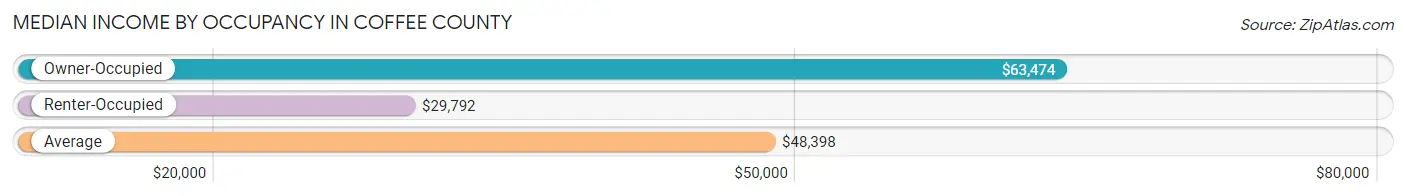
| Occupancy Type | # Households | Median Income |
| Owner-Occupied | 9,846 (66.1%) | $63,474 |
| Renter-Occupied | 5,048 (33.9%) | $29,792 |
| Average | 14,894 (100.0%) | $48,398 |
Occupancy by Householder Income Bracket in Coffee County
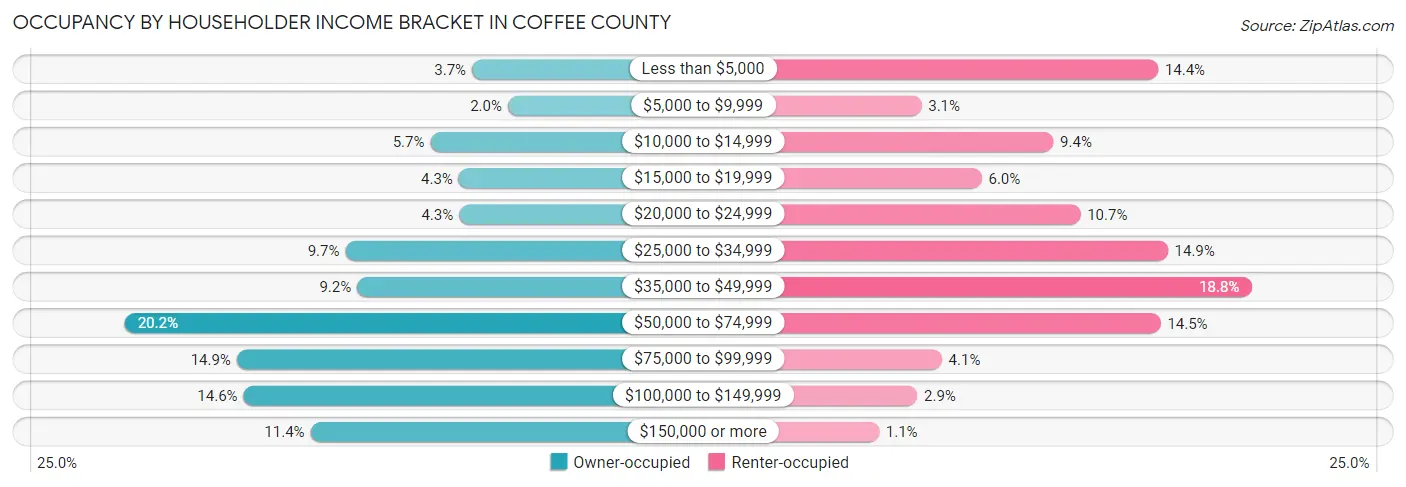
| Income Bracket | Owner-occupied | Renter-occupied |
| Less than $5,000 | 364 (3.7%) | 727 (14.4%) |
| $5,000 to $9,999 | 196 (2.0%) | 158 (3.1%) |
| $10,000 to $14,999 | 559 (5.7%) | 475 (9.4%) |
| $15,000 to $19,999 | 426 (4.3%) | 303 (6.0%) |
| $20,000 to $24,999 | 424 (4.3%) | 540 (10.7%) |
| $25,000 to $34,999 | 958 (9.7%) | 750 (14.9%) |
| $35,000 to $49,999 | 903 (9.2%) | 951 (18.8%) |
| $50,000 to $74,999 | 1,992 (20.2%) | 733 (14.5%) |
| $75,000 to $99,999 | 1,467 (14.9%) | 207 (4.1%) |
| $100,000 to $149,999 | 1,436 (14.6%) | 148 (2.9%) |
| $150,000 or more | 1,121 (11.4%) | 56 (1.1%) |
| Total | 9,846 (100.0%) | 5,048 (100.0%) |
Monthly Housing Cost Tiers in Coffee County
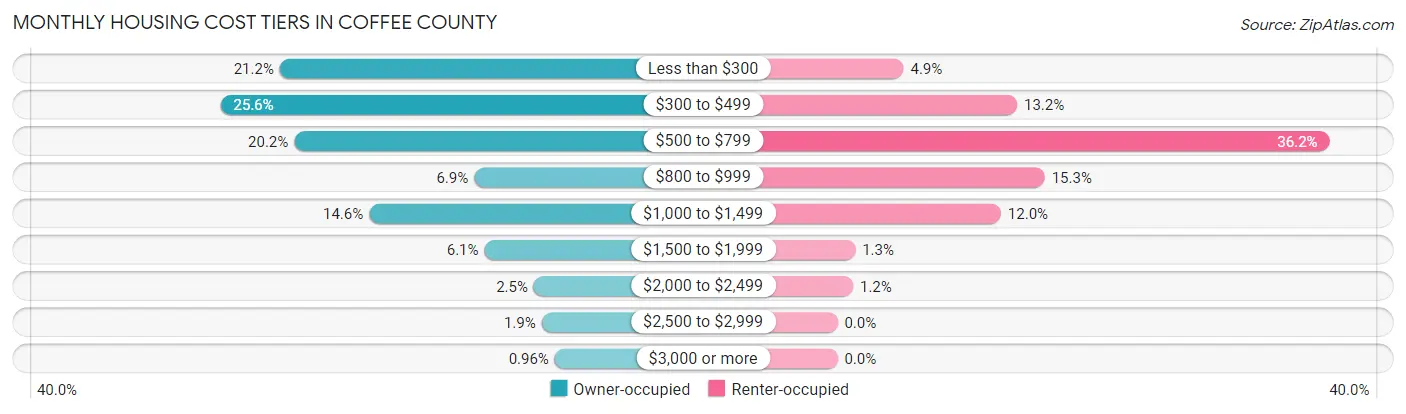
| Monthly Cost | Owner-occupied | Renter-occupied |
| Less than $300 | 2,088 (21.2%) | 246 (4.9%) |
| $300 to $499 | 2,519 (25.6%) | 668 (13.2%) |
| $500 to $799 | 1,984 (20.2%) | 1,829 (36.2%) |
| $800 to $999 | 679 (6.9%) | 771 (15.3%) |
| $1,000 to $1,499 | 1,440 (14.6%) | 608 (12.0%) |
| $1,500 to $1,999 | 605 (6.1%) | 66 (1.3%) |
| $2,000 to $2,499 | 246 (2.5%) | 58 (1.1%) |
| $2,500 to $2,999 | 190 (1.9%) | 0 (0.0%) |
| $3,000 or more | 95 (1.0%) | 0 (0.0%) |
| Total | 9,846 (100.0%) | 5,048 (100.0%) |
Physical Housing Characteristics in Coffee County
Housing Structures in Coffee County
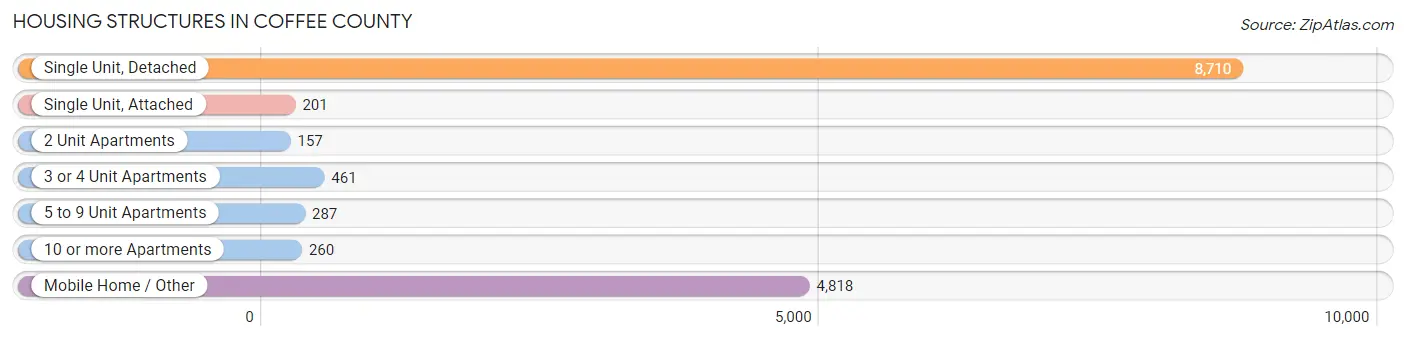
| Structure Type | # Housing Units | % Housing Units |
| Single Unit, Detached | 8,710 | 58.5% |
| Single Unit, Attached | 201 | 1.3% |
| 2 Unit Apartments | 157 | 1.1% |
| 3 or 4 Unit Apartments | 461 | 3.1% |
| 5 to 9 Unit Apartments | 287 | 1.9% |
| 10 or more Apartments | 260 | 1.8% |
| Mobile Home / Other | 4,818 | 32.4% |
| Total | 14,894 | 100.0% |
Housing Structures by Occupancy in Coffee County
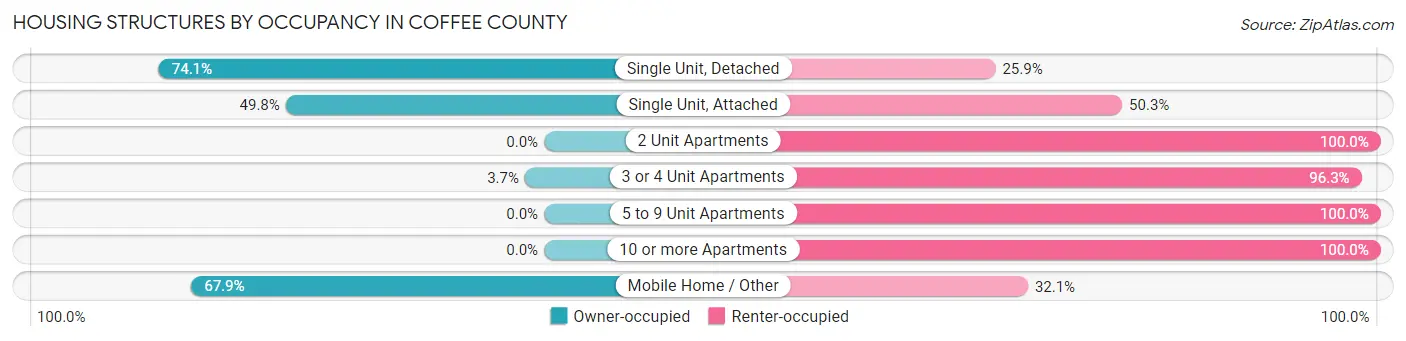
| Structure Type | Owner-occupied | Renter-occupied |
| Single Unit, Detached | 6,458 (74.1%) | 2,252 (25.9%) |
| Single Unit, Attached | 100 (49.7%) | 101 (50.2%) |
| 2 Unit Apartments | 0 (0.0%) | 157 (100.0%) |
| 3 or 4 Unit Apartments | 17 (3.7%) | 444 (96.3%) |
| 5 to 9 Unit Apartments | 0 (0.0%) | 287 (100.0%) |
| 10 or more Apartments | 0 (0.0%) | 260 (100.0%) |
| Mobile Home / Other | 3,271 (67.9%) | 1,547 (32.1%) |
| Total | 9,846 (66.1%) | 5,048 (33.9%) |
Housing Structures by Number of Rooms in Coffee County
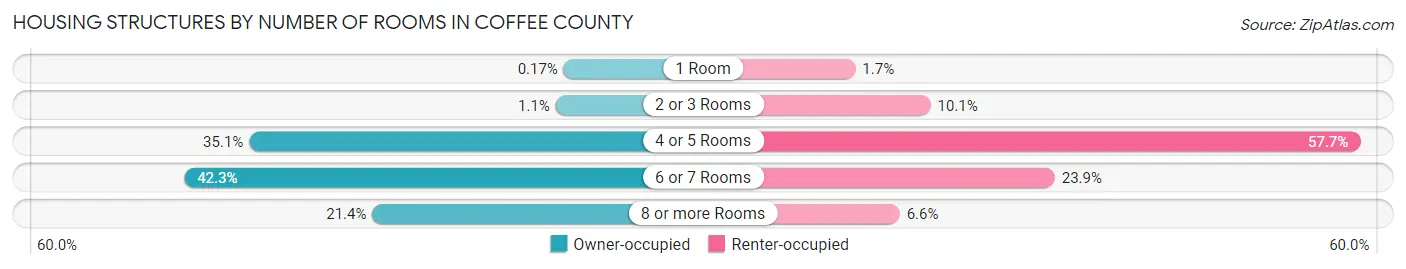
| Number of Rooms | Owner-occupied | Renter-occupied |
| 1 Room | 17 (0.2%) | 87 (1.7%) |
| 2 or 3 Rooms | 104 (1.1%) | 508 (10.1%) |
| 4 or 5 Rooms | 3,454 (35.1%) | 2,914 (57.7%) |
| 6 or 7 Rooms | 4,163 (42.3%) | 1,204 (23.8%) |
| 8 or more Rooms | 2,108 (21.4%) | 335 (6.6%) |
| Total | 9,846 (100.0%) | 5,048 (100.0%) |
Housing Structure by Heating Type in Coffee County
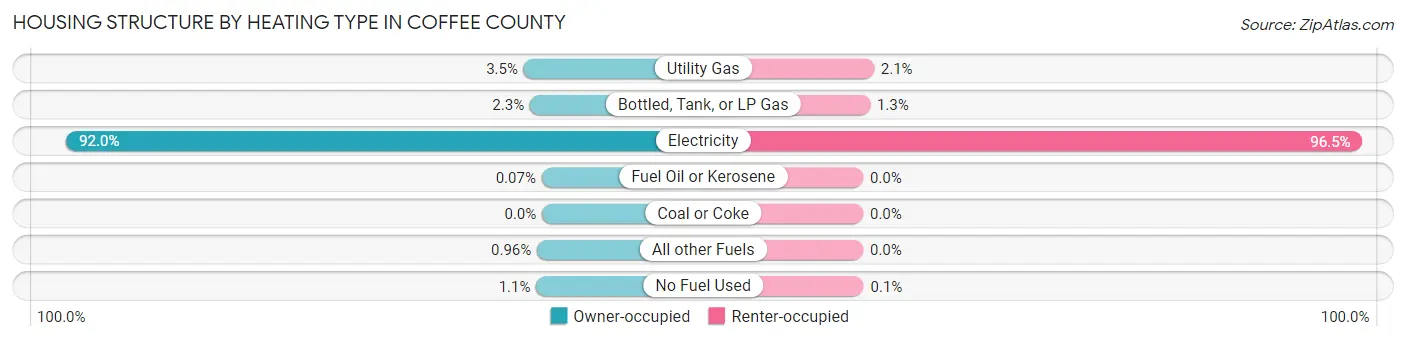
| Heating Type | Owner-occupied | Renter-occupied |
| Utility Gas | 348 (3.5%) | 105 (2.1%) |
| Bottled, Tank, or LP Gas | 230 (2.3%) | 67 (1.3%) |
| Electricity | 9,056 (92.0%) | 4,871 (96.5%) |
| Fuel Oil or Kerosene | 7 (0.1%) | 0 (0.0%) |
| Coal or Coke | 0 (0.0%) | 0 (0.0%) |
| All other Fuels | 95 (1.0%) | 0 (0.0%) |
| No Fuel Used | 110 (1.1%) | 5 (0.1%) |
| Total | 9,846 (100.0%) | 5,048 (100.0%) |
Household Vehicle Usage in Coffee County
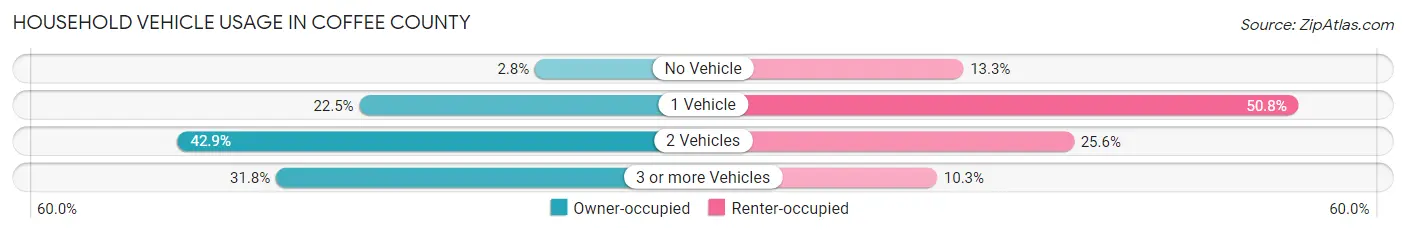
| Vehicles per Household | Owner-occupied | Renter-occupied |
| No Vehicle | 278 (2.8%) | 669 (13.3%) |
| 1 Vehicle | 2,214 (22.5%) | 2,565 (50.8%) |
| 2 Vehicles | 4,220 (42.9%) | 1,294 (25.6%) |
| 3 or more Vehicles | 3,134 (31.8%) | 520 (10.3%) |
| Total | 9,846 (100.0%) | 5,048 (100.0%) |
Real Estate & Mortgages in Coffee County
Real Estate and Mortgage Overview in Coffee County
| Characteristic | Without Mortgage | With Mortgage |
| Housing Units | 6,094 | 3,752 |
| Median Property Value | $88,800 | $148,900 |
| Median Household Income | $56,111 | $572 |
| Monthly Housing Costs | $375 | $95 |
| Real Estate Taxes | $678 | $54 |
Property Value by Mortgage Status in Coffee County
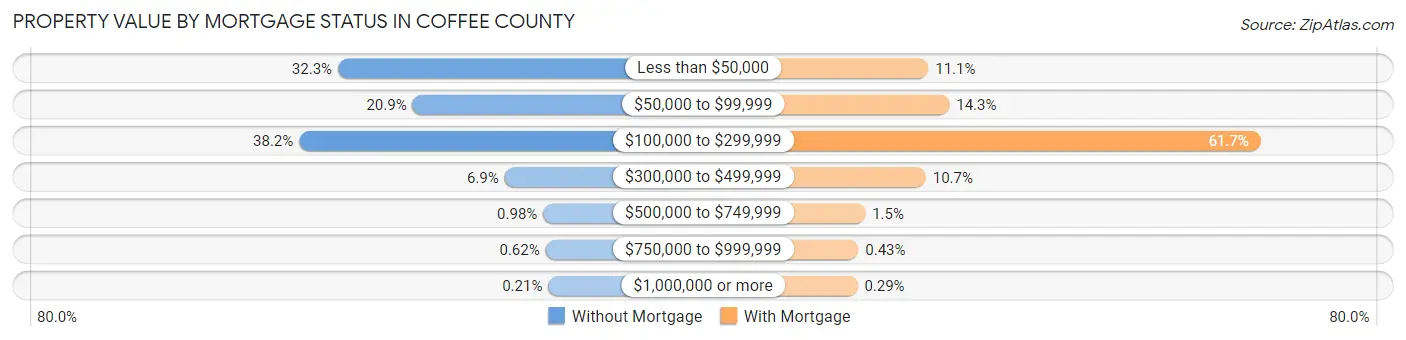
| Property Value | Without Mortgage | With Mortgage |
| Less than $50,000 | 1,966 (32.3%) | 416 (11.1%) |
| $50,000 to $99,999 | 1,273 (20.9%) | 536 (14.3%) |
| $100,000 to $299,999 | 2,326 (38.2%) | 2,316 (61.7%) |
| $300,000 to $499,999 | 418 (6.9%) | 402 (10.7%) |
| $500,000 to $749,999 | 60 (1.0%) | 55 (1.5%) |
| $750,000 to $999,999 | 38 (0.6%) | 16 (0.4%) |
| $1,000,000 or more | 13 (0.2%) | 11 (0.3%) |
| Total | 6,094 (100.0%) | 3,752 (100.0%) |
Household Income by Mortgage Status in Coffee County
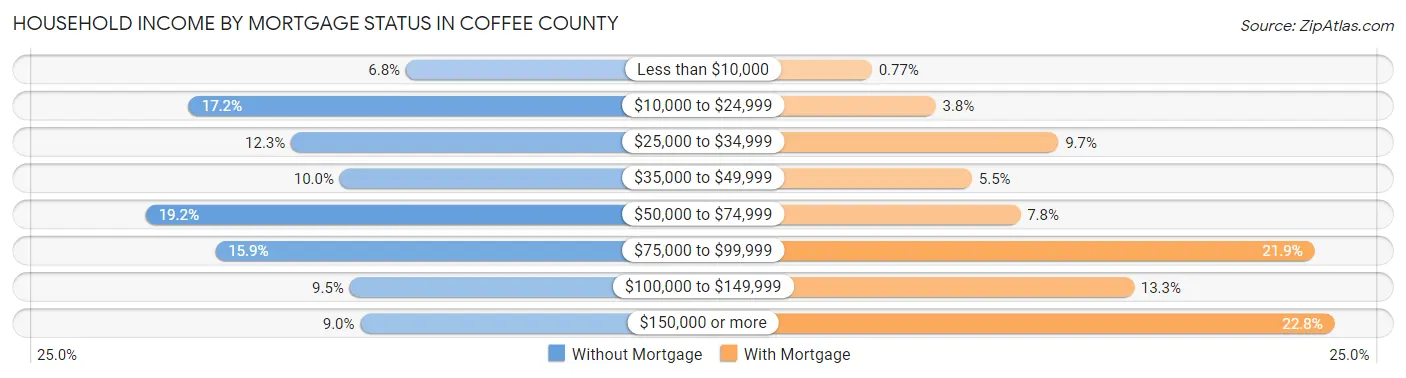
| Household Income | Without Mortgage | With Mortgage |
| Less than $10,000 | 417 (6.8%) | 29 (0.8%) |
| $10,000 to $24,999 | 1,047 (17.2%) | 143 (3.8%) |
| $25,000 to $34,999 | 750 (12.3%) | 362 (9.7%) |
| $35,000 to $49,999 | 609 (10.0%) | 208 (5.5%) |
| $50,000 to $74,999 | 1,172 (19.2%) | 294 (7.8%) |
| $75,000 to $99,999 | 970 (15.9%) | 820 (21.9%) |
| $100,000 to $149,999 | 580 (9.5%) | 497 (13.3%) |
| $150,000 or more | 549 (9.0%) | 856 (22.8%) |
| Total | 6,094 (100.0%) | 3,752 (100.0%) |
Property Value to Household Income Ratio in Coffee County
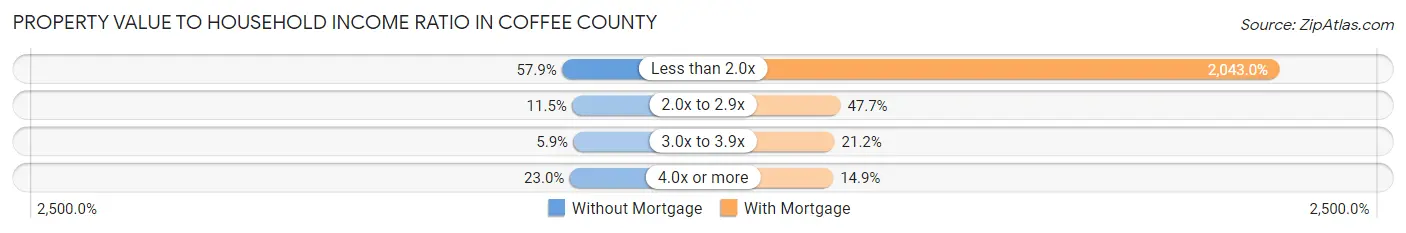
| Value-to-Income Ratio | Without Mortgage | With Mortgage |
| Less than 2.0x | 3,528 (57.9%) | 76,655 (2,043.0%) |
| 2.0x to 2.9x | 703 (11.5%) | 1,791 (47.7%) |
| 3.0x to 3.9x | 357 (5.9%) | 797 (21.2%) |
| 4.0x or more | 1,400 (23.0%) | 560 (14.9%) |
| Total | 6,094 (100.0%) | 3,752 (100.0%) |
Real Estate Taxes by Mortgage Status in Coffee County
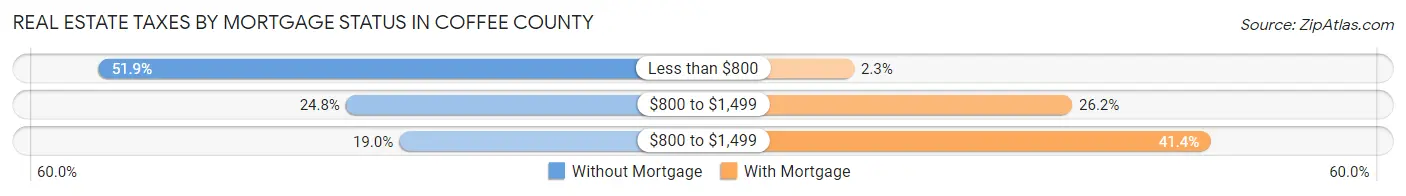
| Property Taxes | Without Mortgage | With Mortgage |
| Less than $800 | 3,161 (51.9%) | 86 (2.3%) |
| $800 to $1,499 | 1,512 (24.8%) | 983 (26.2%) |
| $800 to $1,499 | 1,156 (19.0%) | 1,554 (41.4%) |
| Total | 6,094 (100.0%) | 3,752 (100.0%) |
Health & Disability in Coffee County
Health Insurance Coverage by Age in Coffee County
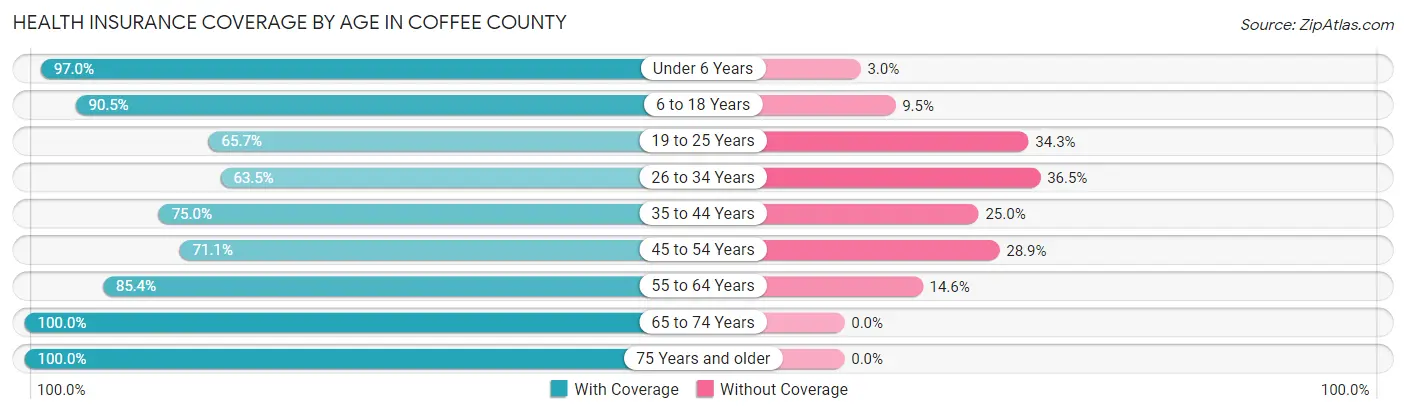
| Age Bracket | With Coverage | Without Coverage |
| Under 6 Years | 3,689 (97.0%) | 115 (3.0%) |
| 6 to 18 Years | 6,849 (90.5%) | 718 (9.5%) |
| 19 to 25 Years | 2,347 (65.7%) | 1,227 (34.3%) |
| 26 to 34 Years | 3,181 (63.5%) | 1,831 (36.5%) |
| 35 to 44 Years | 3,681 (75.0%) | 1,228 (25.0%) |
| 45 to 54 Years | 3,560 (71.1%) | 1,448 (28.9%) |
| 55 to 64 Years | 4,080 (85.4%) | 697 (14.6%) |
| 65 to 74 Years | 4,110 (100.0%) | 0 (0.0%) |
| 75 Years and older | 2,013 (100.0%) | 0 (0.0%) |
| Total | 33,510 (82.2%) | 7,264 (17.8%) |
Health Insurance Coverage by Citizenship Status in Coffee County
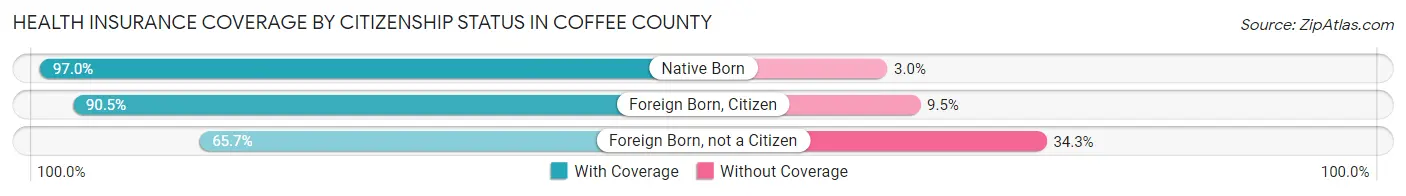
| Citizenship Status | With Coverage | Without Coverage |
| Native Born | 3,689 (97.0%) | 115 (3.0%) |
| Foreign Born, Citizen | 6,849 (90.5%) | 718 (9.5%) |
| Foreign Born, not a Citizen | 2,347 (65.7%) | 1,227 (34.3%) |
Health Insurance Coverage by Household Income in Coffee County
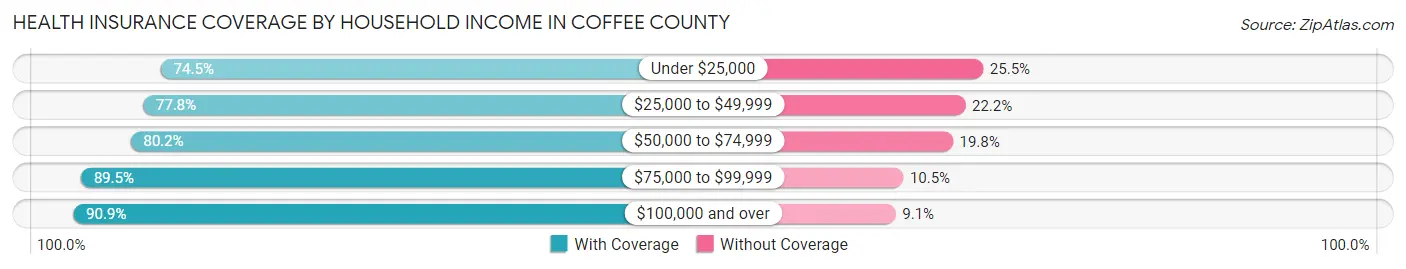
| Household Income | With Coverage | Without Coverage |
| Under $25,000 | 6,225 (74.5%) | 2,131 (25.5%) |
| $25,000 to $49,999 | 6,999 (77.8%) | 1,992 (22.2%) |
| $50,000 to $74,999 | 6,529 (80.2%) | 1,613 (19.8%) |
| $75,000 to $99,999 | 4,713 (89.5%) | 554 (10.5%) |
| $100,000 and over | 8,782 (90.9%) | 879 (9.1%) |
Public vs Private Health Insurance Coverage by Age in Coffee County
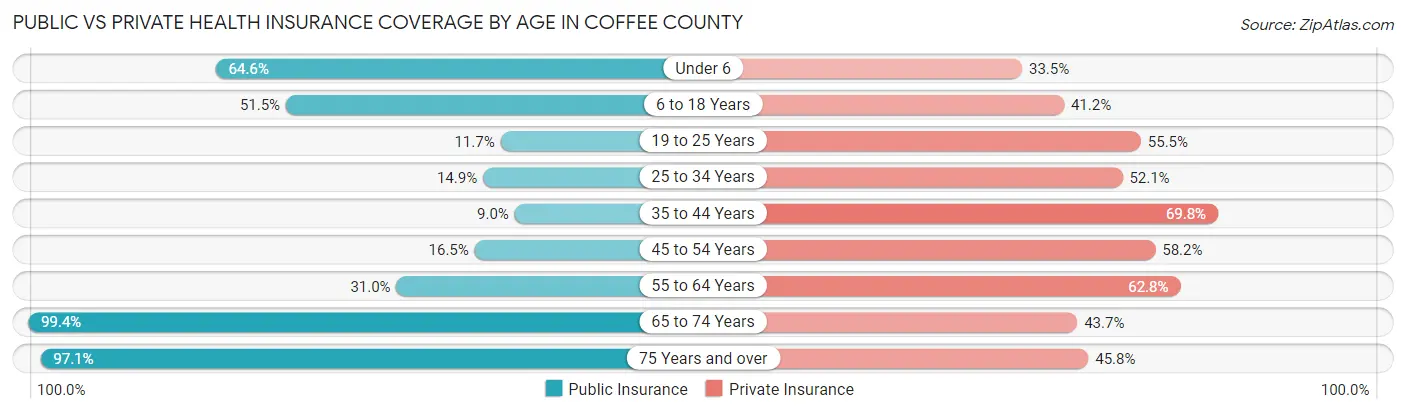
| Age Bracket | Public Insurance | Private Insurance |
| Under 6 | 2,456 (64.6%) | 1,273 (33.5%) |
| 6 to 18 Years | 3,896 (51.5%) | 3,121 (41.2%) |
| 19 to 25 Years | 417 (11.7%) | 1,984 (55.5%) |
| 25 to 34 Years | 748 (14.9%) | 2,611 (52.1%) |
| 35 to 44 Years | 444 (9.0%) | 3,427 (69.8%) |
| 45 to 54 Years | 825 (16.5%) | 2,914 (58.2%) |
| 55 to 64 Years | 1,480 (31.0%) | 3,001 (62.8%) |
| 65 to 74 Years | 4,084 (99.4%) | 1,796 (43.7%) |
| 75 Years and over | 1,954 (97.1%) | 921 (45.8%) |
| Total | 16,304 (40.0%) | 21,048 (51.6%) |
Disability Status by Sex by Age in Coffee County
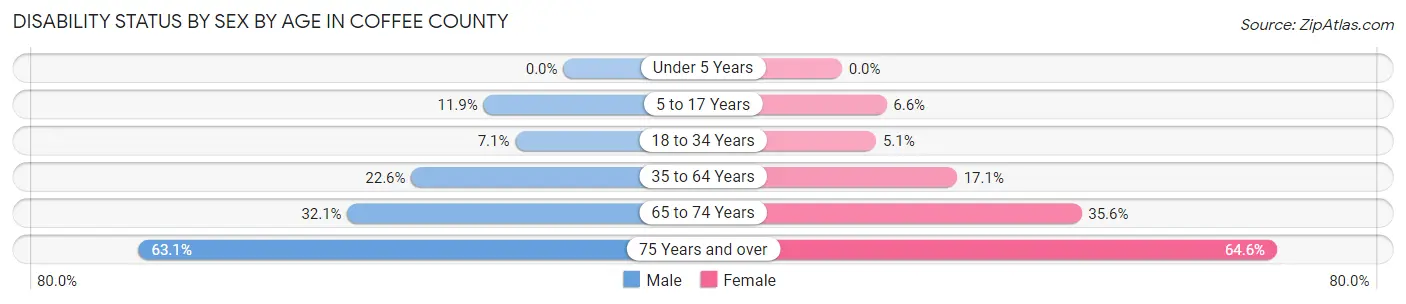
| Age Bracket | Male | Female |
| Under 5 Years | 0 (0.0%) | 0 (0.0%) |
| 5 to 17 Years | 469 (11.8%) | 241 (6.6%) |
| 18 to 34 Years | 348 (7.1%) | 234 (5.1%) |
| 35 to 64 Years | 1,615 (22.6%) | 1,287 (17.1%) |
| 65 to 74 Years | 563 (32.1%) | 837 (35.6%) |
| 75 Years and over | 555 (63.1%) | 732 (64.6%) |
Disability Class by Sex by Age in Coffee County
Disability Class: Hearing Difficulty
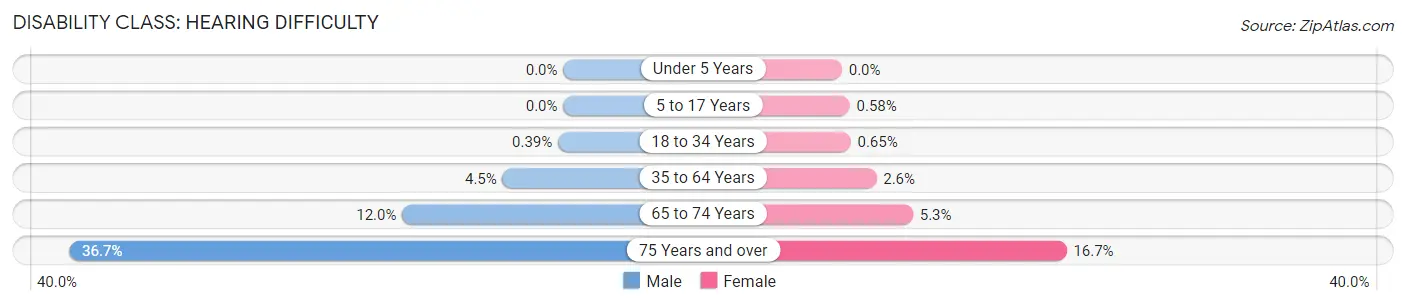
| Age Bracket | Male | Female |
| Under 5 Years | 0 (0.0%) | 0 (0.0%) |
| 5 to 17 Years | 0 (0.0%) | 21 (0.6%) |
| 18 to 34 Years | 19 (0.4%) | 30 (0.6%) |
| 35 to 64 Years | 323 (4.5%) | 193 (2.6%) |
| 65 to 74 Years | 210 (12.0%) | 124 (5.3%) |
| 75 Years and over | 323 (36.7%) | 189 (16.7%) |
Disability Class: Vision Difficulty
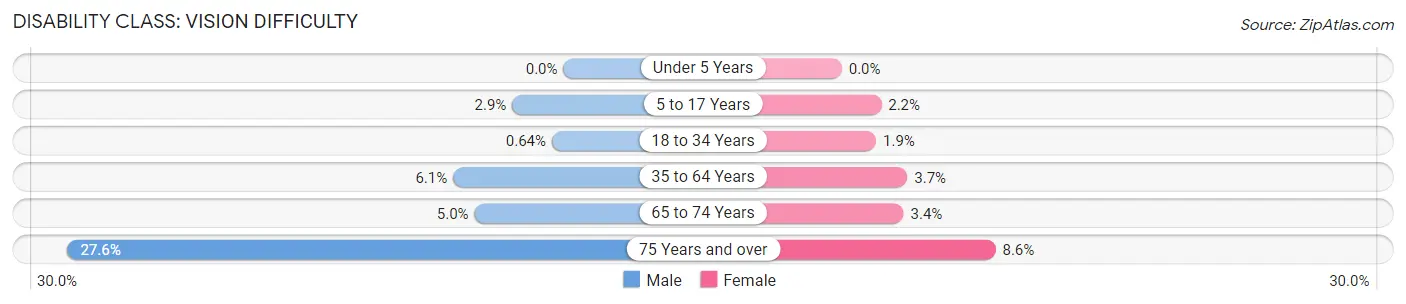
| Age Bracket | Male | Female |
| Under 5 Years | 0 (0.0%) | 0 (0.0%) |
| 5 to 17 Years | 113 (2.9%) | 80 (2.2%) |
| 18 to 34 Years | 31 (0.6%) | 88 (1.9%) |
| 35 to 64 Years | 439 (6.1%) | 275 (3.6%) |
| 65 to 74 Years | 87 (5.0%) | 81 (3.4%) |
| 75 Years and over | 243 (27.6%) | 97 (8.6%) |
Disability Class: Cognitive Difficulty
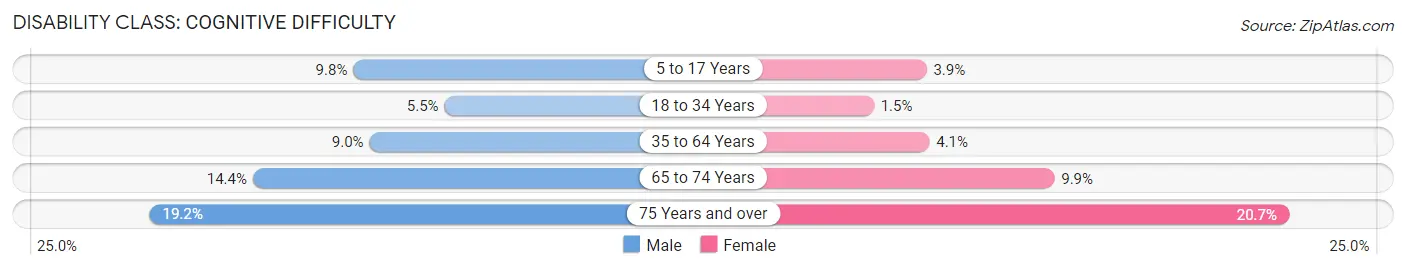
| Age Bracket | Male | Female |
| 5 to 17 Years | 386 (9.8%) | 143 (3.9%) |
| 18 to 34 Years | 269 (5.5%) | 68 (1.5%) |
| 35 to 64 Years | 644 (9.0%) | 306 (4.1%) |
| 65 to 74 Years | 253 (14.4%) | 232 (9.9%) |
| 75 Years and over | 169 (19.2%) | 235 (20.7%) |
Disability Class: Ambulatory Difficulty
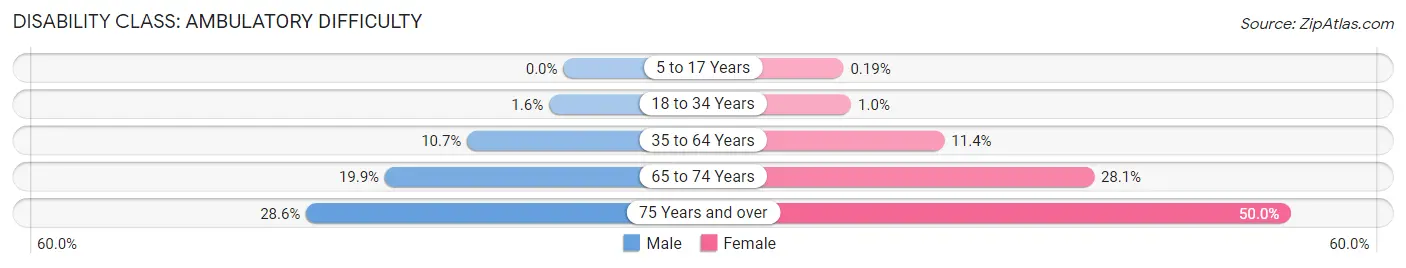
| Age Bracket | Male | Female |
| 5 to 17 Years | 0 (0.0%) | 7 (0.2%) |
| 18 to 34 Years | 78 (1.6%) | 48 (1.0%) |
| 35 to 64 Years | 766 (10.7%) | 862 (11.4%) |
| 65 to 74 Years | 349 (19.9%) | 661 (28.1%) |
| 75 Years and over | 252 (28.6%) | 567 (50.0%) |
Disability Class: Self-Care Difficulty
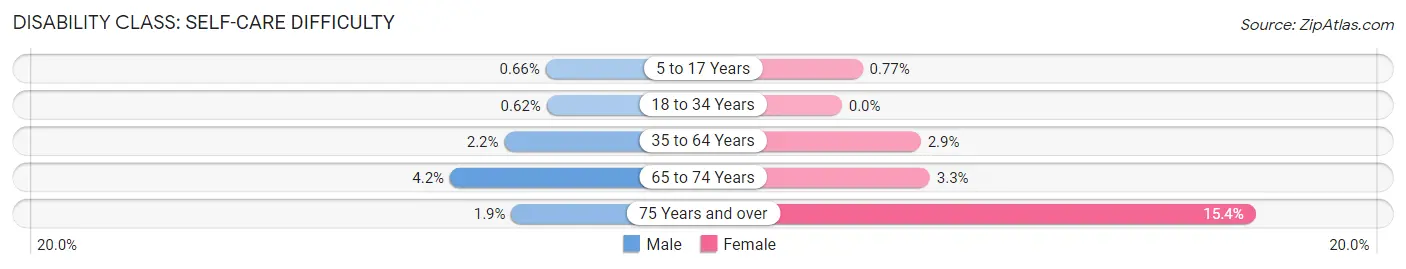
| Age Bracket | Male | Female |
| 5 to 17 Years | 26 (0.7%) | 28 (0.8%) |
| 18 to 34 Years | 30 (0.6%) | 0 (0.0%) |
| 35 to 64 Years | 157 (2.2%) | 221 (2.9%) |
| 65 to 74 Years | 74 (4.2%) | 77 (3.3%) |
| 75 Years and over | 17 (1.9%) | 174 (15.4%) |
Technology Access in Coffee County
Computing Device Access in Coffee County
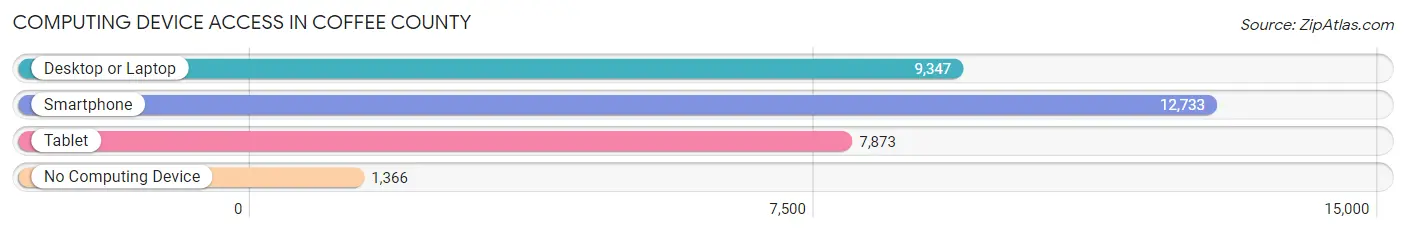
| Device Type | # Households | % Households |
| Desktop or Laptop | 9,347 | 62.8% |
| Smartphone | 12,733 | 85.5% |
| Tablet | 7,873 | 52.9% |
| No Computing Device | 1,366 | 9.2% |
| Total | 14,894 | 100.0% |
Internet Access in Coffee County
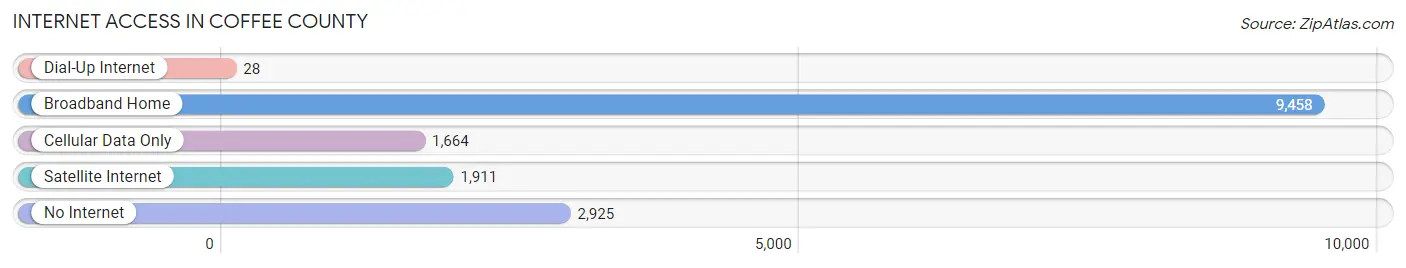
| Internet Type | # Households | % Households |
| Dial-Up Internet | 28 | 0.2% |
| Broadband Home | 9,458 | 63.5% |
| Cellular Data Only | 1,664 | 11.2% |
| Satellite Internet | 1,911 | 12.8% |
| No Internet | 2,925 | 19.6% |
| Total | 14,894 | 100.0% |
Coffee County Summary
Coffee County is located in the southeastern part of the U.S. state of Georgia. It is part of the Valdosta, Georgia Metropolitan Statistical Area. The county seat is Douglas. As of the 2010 census, the population was 42,356.
History
Coffee County was created in 1854 from parts of Clinch, Irwin, Telfair, and Ware counties. It was named for General John E. Coffee, a hero of the War of 1812 and a member of the Georgia General Assembly.
The first county seat was at Newman, but it was moved to Douglas in 1869. The county courthouse was built in 1871 and is still in use today.
Geography
Coffee County is located in the southeastern part of Georgia, about 100 miles south of Atlanta. It is bordered by Clinch County to the north, Atkinson County to the east, Ware County to the south, and Telfair and Irwin counties to the west.
The county has a total area of 441 square miles, of which 437 square miles is land and 4.2 square miles is water. The majority of the county is flat, with some rolling hills in the northern part. The Satilla River runs through the county, and there are several small lakes and ponds.
Economy
Coffee County is primarily an agricultural county, with the main crops being cotton, peanuts, corn, and soybeans. The county also has a thriving timber industry, and there are several poultry farms in the area.
The county is home to several manufacturing companies, including a paper mill, a furniture factory, and a plastics plant. There are also several retail stores and restaurants in the county.
Demographics
As of the 2010 census, there were 42,356 people, 15,945 households, and 11,541 families living in the county. The population density was 97.2 people per square mile. There were 17,845 housing units at an average density of 40.7 per square mile.
The racial makeup of the county was 68.2% White, 28.2% African American, 0.4% Native American, 0.7% Asian, 0.1% Pacific Islander, 0.9% from other races, and 1.5% from two or more races. Hispanic or Latino of any race were 2.7% of the population.
The median income for a household in the county was $33,945, and the median income for a family was $41,945. The per capita income for the county was $17,845. About 17.2% of families and 21.2% of the population were below the poverty line, including 28.2% of those under age 18 and 16.2% of those age 65 or over.
Common Questions
What is Per Capita Income in Coffee County?
Per Capita income in Coffee County is $23,839.
What is the Median Family Income in Coffee County?
Median Family Income in Coffee County is $58,229.
What is the Median Household income in Coffee County?
Median Household Income in Coffee County is $48,398.
What is Income or Wage Gap in Coffee County?
Income or Wage Gap in Coffee County is 14.7%.
Women in Coffee County earn 85.3 cents for every dollar earned by a man.
What is Family Income Deficit in Coffee County?
Family Income Deficit in Coffee County is $11,148.
Families that are below poverty line in Coffee County earn $11,148 less on average than the poverty threshold level.
What is Inequality or Gini Index in Coffee County?
Inequality or Gini Index in Coffee County is 0.47.
What is the Total Population of Coffee County?
Total Population of Coffee County is 43,056.
What is the Total Male Population of Coffee County?
Total Male Population of Coffee County is 22,197.
What is the Total Female Population of Coffee County?
Total Female Population of Coffee County is 20,859.
What is the Ratio of Males per 100 Females in Coffee County?
There are 106.41 Males per 100 Females in Coffee County.
What is the Ratio of Females per 100 Males in Coffee County?
There are 93.97 Females per 100 Males in Coffee County.
What is the Median Population Age in Coffee County?
Median Population Age in Coffee County is 36.4 Years.
What is the Average Family Size in Coffee County
Average Family Size in Coffee County is 3.3 People.
What is the Average Household Size in Coffee County
Average Household Size in Coffee County is 2.7 People.
How Large is the Labor Force in Coffee County?
There are 18,600 People in the Labor Forcein in Coffee County.
What is the Percentage of People in the Labor Force in Coffee County?
55.3% of People are in the Labor Force in Coffee County.
What is the Unemployment Rate in Coffee County?
Unemployment Rate in Coffee County is 4.3%.