Clinch County, GA Map & Demographics
Clinch County Map
Clinch County Overview
$20,294
PER CAPITA INCOME
$67,713
AVG FAMILY INCOME
$53,350
AVG HOUSEHOLD INCOME
9.9%
WAGE / INCOME GAP [ % ]
90.1¢/ $1
WAGE / INCOME GAP [ $ ]
0.46
INEQUALITY / GINI INDEX
6,713
TOTAL POPULATION
3,337
MALE POPULATION
3,376
FEMALE POPULATION
98.84
MALES / 100 FEMALES
101.17
FEMALES / 100 MALES
38.4
MEDIAN AGE
3.1
AVG FAMILY SIZE
2.6
AVG HOUSEHOLD SIZE
2,584
LABOR FORCE [ PEOPLE ]
48.8%
PERCENT IN LABOR FORCE
2.6%
UNEMPLOYMENT RATE
Clinch County Area Codes
Income in Clinch County
Income Overview in Clinch County
Per Capita Income in Clinch County is $20,294, while median incomes of families and households are $67,713 and $53,350 respectively.
| Characteristic | Number | Measure |
| Per Capita Income | 6,713 | $20,294 |
| Median Family Income | 1,715 | $67,713 |
| Mean Family Income | 1,715 | $67,848 |
| Median Household Income | 2,385 | $53,350 |
| Mean Household Income | 2,385 | $57,046 |
| Income Deficit | 1,715 | $0 |
| Wage / Income Gap (%) | 6,713 | 9.92% |
| Wage / Income Gap ($) | 6,713 | 90.08¢ per $1 |
| Gini / Inequality Index | 6,713 | 0.46 |
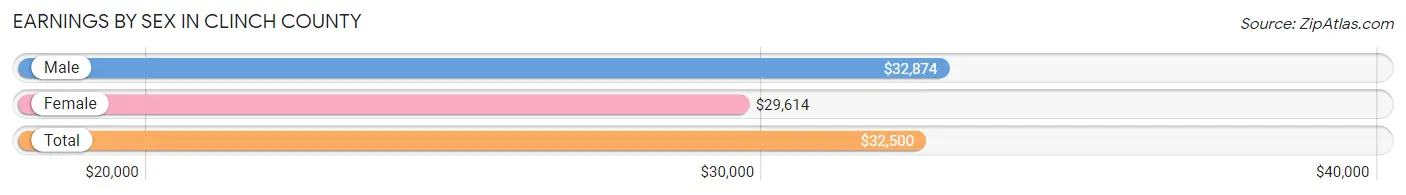
Earnings by Sex in Clinch County
Average Earnings in Clinch County are $32,500, $32,874 for men and $29,614 for women, a difference of 9.9%.
| Sex | Number | Average Earnings |
| Male | 1,610 (57.3%) | $32,874 |
| Female | 1,200 (42.7%) | $29,614 |
| Total | 2,810 (100.0%) | $32,500 |
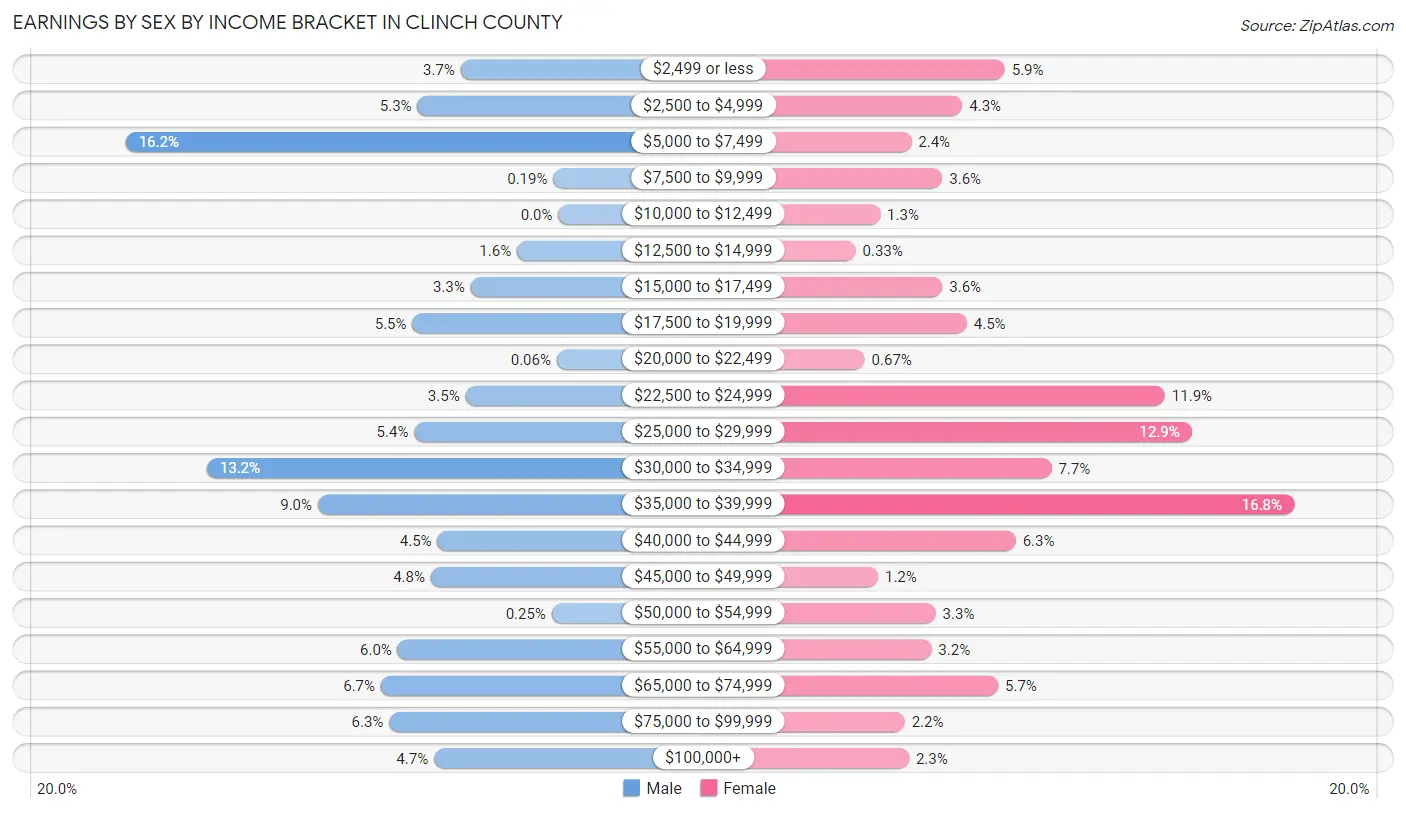
Earnings by Sex by Income Bracket in Clinch County
The most common earnings brackets in Clinch County are $5,000 to $7,499 for men (261 | 16.2%) and $35,000 to $39,999 for women (201 | 16.8%).
| Income | Male | Female |
| $2,499 or less | 59 (3.7%) | 71 (5.9%) |
| $2,500 to $4,999 | 85 (5.3%) | 52 (4.3%) |
| $5,000 to $7,499 | 261 (16.2%) | 29 (2.4%) |
| $7,500 to $9,999 | 3 (0.2%) | 43 (3.6%) |
| $10,000 to $12,499 | 0 (0.0%) | 15 (1.3%) |
| $12,500 to $14,999 | 25 (1.5%) | 4 (0.3%) |
| $15,000 to $17,499 | 53 (3.3%) | 43 (3.6%) |
| $17,500 to $19,999 | 88 (5.5%) | 54 (4.5%) |
| $20,000 to $22,499 | 1 (0.1%) | 8 (0.7%) |
| $22,500 to $24,999 | 56 (3.5%) | 143 (11.9%) |
| $25,000 to $29,999 | 87 (5.4%) | 155 (12.9%) |
| $30,000 to $34,999 | 212 (13.2%) | 92 (7.7%) |
| $35,000 to $39,999 | 145 (9.0%) | 201 (16.8%) |
| $40,000 to $44,999 | 73 (4.5%) | 76 (6.3%) |
| $45,000 to $49,999 | 77 (4.8%) | 14 (1.2%) |
| $50,000 to $54,999 | 4 (0.3%) | 40 (3.3%) |
| $55,000 to $64,999 | 97 (6.0%) | 38 (3.2%) |
| $65,000 to $74,999 | 107 (6.7%) | 68 (5.7%) |
| $75,000 to $99,999 | 102 (6.3%) | 26 (2.2%) |
| $100,000+ | 75 (4.7%) | 28 (2.3%) |
| Total | 1,610 (100.0%) | 1,200 (100.0%) |
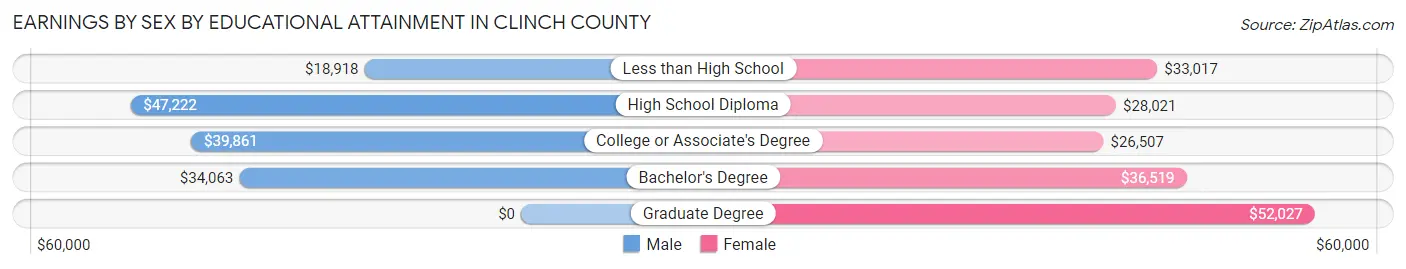
Earnings by Sex by Educational Attainment in Clinch County
Average earnings in Clinch County are $34,284 for men and $33,851 for women, a difference of 1.3%. Men with an educational attainment of high school diploma enjoy the highest average annual earnings of $47,222, while those with less than high school education earn the least with $18,918. Women with an educational attainment of graduate degree earn the most with the average annual earnings of $52,027, while those with college or associate's degree education have the smallest earnings of $26,507.
| Educational Attainment | Male Income | Female Income |
| Less than High School | $18,918 | $33,017 |
| High School Diploma | $47,222 | $28,021 |
| College or Associate's Degree | $39,861 | $26,507 |
| Bachelor's Degree | $34,063 | $36,519 |
| Graduate Degree | - | - |
| Total | $34,284 | $33,851 |
Family Income in Clinch County
Family Income Brackets in Clinch County
According to the Clinch County family income data, there are 460 families falling into the $50,000 to $74,999 income range, which is the most common income bracket and makes up 26.8% of all families. Conversely, the $200,000+ income bracket is the least frequent group with only 21 families (1.2%) belonging to this category.
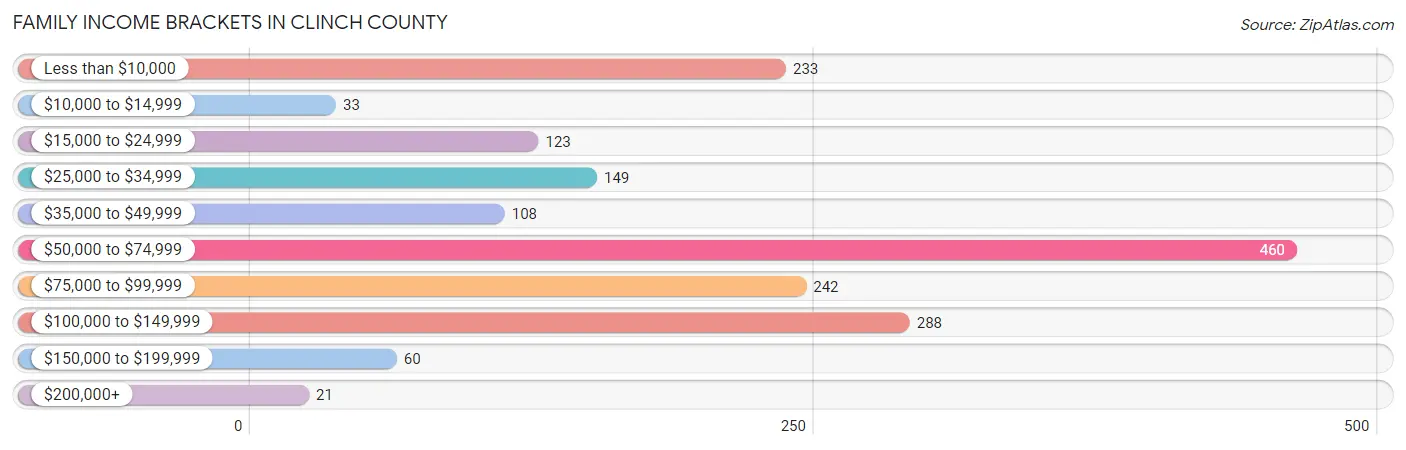
| Income Bracket | # Families | % Families |
| Less than $10,000 | 233 | 13.6% |
| $10,000 to $14,999 | 33 | 1.9% |
| $15,000 to $24,999 | 123 | 7.2% |
| $25,000 to $34,999 | 149 | 8.7% |
| $35,000 to $49,999 | 108 | 6.3% |
| $50,000 to $74,999 | 460 | 26.8% |
| $75,000 to $99,999 | 242 | 14.1% |
| $100,000 to $149,999 | 288 | 16.8% |
| $150,000 to $199,999 | 60 | 3.5% |
| $200,000+ | 21 | 1.2% |
Family Income by Famaliy Size in Clinch County
5-person families (201 | 11.7%) account for the highest median family income in Clinch County with $74,480 per family, while 2-person families (788 | 46.0%) have the highest median income of $27,500 per family member.
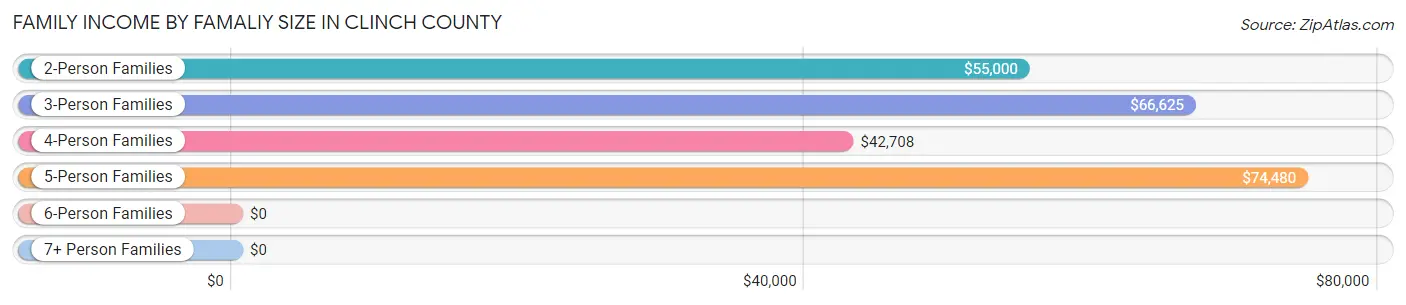
| Income Bracket | # Families | Median Income |
| 2-Person Families | 788 (46.0%) | $55,000 |
| 3-Person Families | 424 (24.7%) | $66,625 |
| 4-Person Families | 249 (14.5%) | $42,708 |
| 5-Person Families | 201 (11.7%) | $74,480 |
| 6-Person Families | 28 (1.6%) | $0 |
| 7+ Person Families | 25 (1.5%) | $0 |
| Total | 1,715 (100.0%) | $67,713 |
Family Income by Number of Earners in Clinch County
The median family income in Clinch County is $67,713, with families comprising 2 earners (345) having the highest median family income of $79,345, while families with no earners (508) have the lowest median family income of $14,886, accounting for 20.1% and 29.6% of families, respectively.
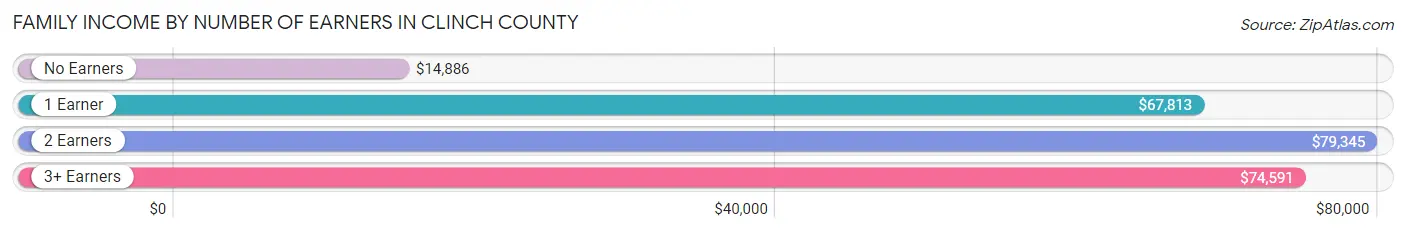
| Number of Earners | # Families | Median Income |
| No Earners | 508 (29.6%) | $14,886 |
| 1 Earner | 575 (33.5%) | $67,813 |
| 2 Earners | 345 (20.1%) | $79,345 |
| 3+ Earners | 287 (16.7%) | $74,591 |
| Total | 1,715 (100.0%) | $67,713 |
Household Income in Clinch County
Household Income Brackets in Clinch County
With 577 households falling in the category, the $50,000 to $74,999 income range is the most frequent in Clinch County, accounting for 24.2% of all households. In contrast, only 24 households (1.0%) fall into the $200,000+ income bracket, making it the least populous group.
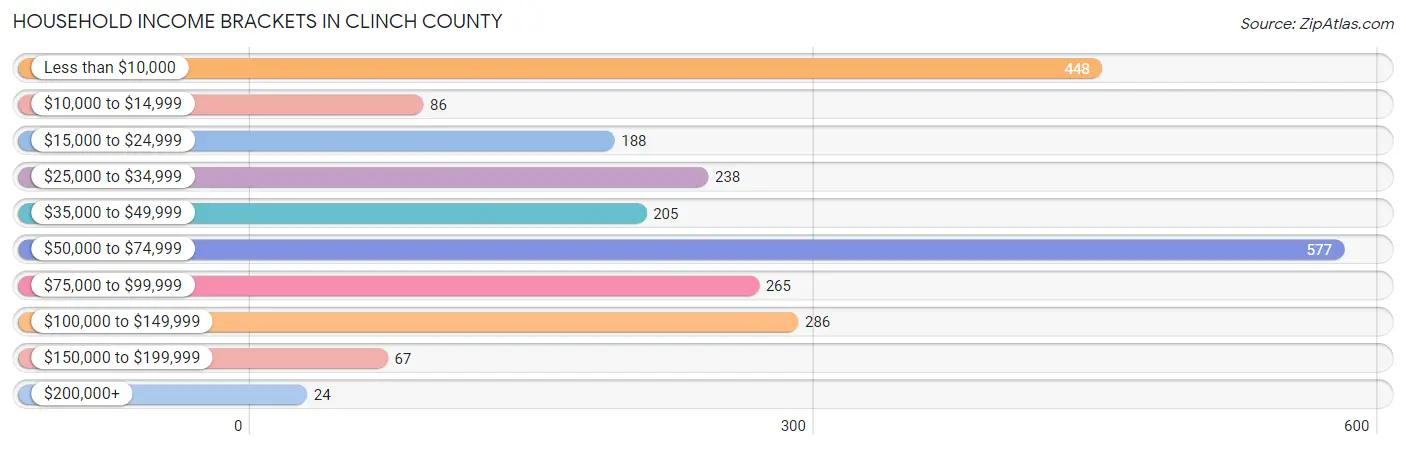
| Income Bracket | # Households | % Households |
| Less than $10,000 | 448 | 18.8% |
| $10,000 to $14,999 | 86 | 3.6% |
| $15,000 to $24,999 | 188 | 7.9% |
| $25,000 to $34,999 | 238 | 10.0% |
| $35,000 to $49,999 | 205 | 8.6% |
| $50,000 to $74,999 | 577 | 24.2% |
| $75,000 to $99,999 | 265 | 11.1% |
| $100,000 to $149,999 | 286 | 12.0% |
| $150,000 to $199,999 | 67 | 2.8% |
| $200,000+ | 24 | 1.0% |
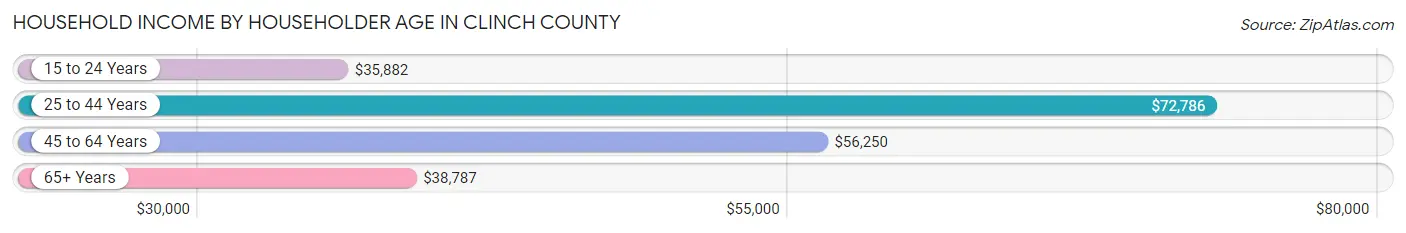
Household Income by Householder Age in Clinch County
The median household income in Clinch County is $53,350, with the highest median household income of $72,786 found in the 25 to 44 years age bracket for the primary householder. A total of 761 households (31.9%) fall into this category. Meanwhile, the 15 to 24 years age bracket for the primary householder has the lowest median household income of $35,882, with 88 households (3.7%) in this group.
| Income Bracket | # Households | Median Income |
| 15 to 24 Years | 88 (3.7%) | $35,882 |
| 25 to 44 Years | 761 (31.9%) | $72,786 |
| 45 to 64 Years | 901 (37.8%) | $56,250 |
| 65+ Years | 635 (26.6%) | $38,787 |
| Total | 2,385 (100.0%) | $53,350 |
Poverty in Clinch County
Income Below Poverty by Sex and Age in Clinch County
With 32.4% poverty level for males and 32.6% for females among the residents of Clinch County, 15 year old males and 12 to 14 year old females are the most vulnerable to poverty, with 63 males (75.9%) and 179 females (100.0%) in their respective age groups living below the poverty level.
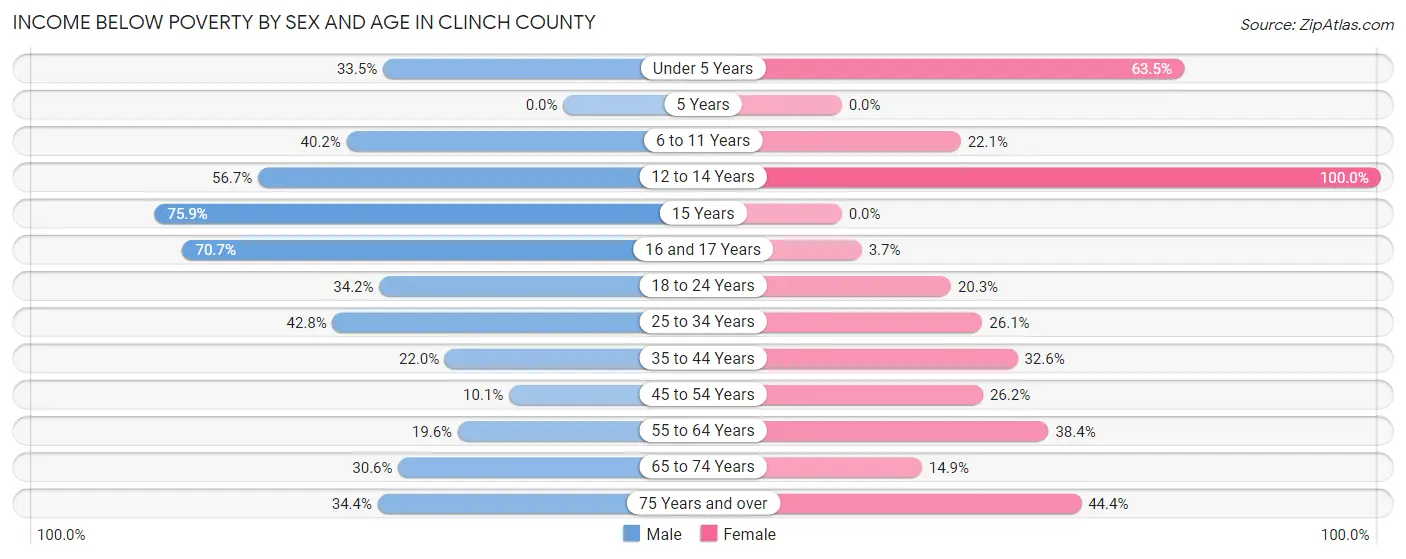
| Age Bracket | Male | Female |
| Under 5 Years | 75 (33.5%) | 132 (63.5%) |
| 5 Years | 0 (0.0%) | 0 (0.0%) |
| 6 to 11 Years | 173 (40.2%) | 17 (22.1%) |
| 12 to 14 Years | 51 (56.7%) | 179 (100.0%) |
| 15 Years | 63 (75.9%) | 0 (0.0%) |
| 16 and 17 Years | 53 (70.7%) | 7 (3.7%) |
| 18 to 24 Years | 97 (34.2%) | 47 (20.3%) |
| 25 to 34 Years | 197 (42.8%) | 113 (26.1%) |
| 35 to 44 Years | 99 (22.0%) | 196 (32.6%) |
| 45 to 54 Years | 34 (10.1%) | 76 (26.2%) |
| 55 to 64 Years | 81 (19.6%) | 178 (38.4%) |
| 65 to 74 Years | 83 (30.6%) | 48 (14.9%) |
| 75 Years and over | 62 (34.4%) | 88 (44.4%) |
| Total | 1,068 (32.4%) | 1,081 (32.6%) |
Income Above Poverty by Sex and Age in Clinch County
According to the poverty statistics in Clinch County, males aged 45 to 54 years and females aged 5 years are the age groups that are most secure financially, with 89.9% of males and 100.0% of females in these age groups living above the poverty line.
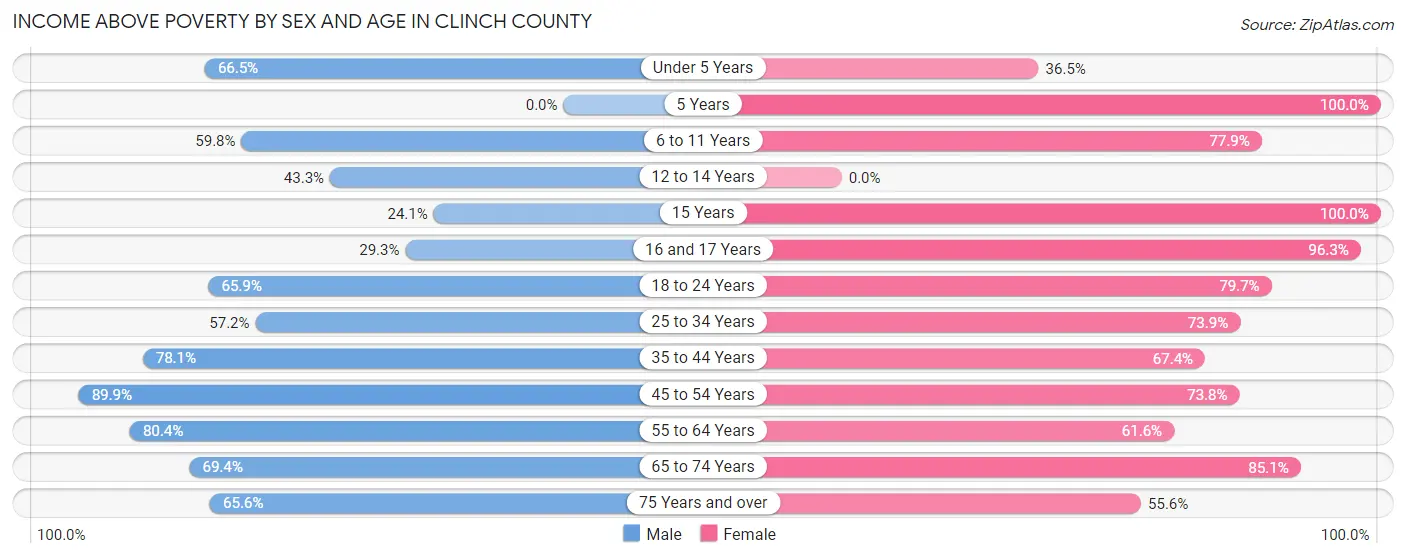
| Age Bracket | Male | Female |
| Under 5 Years | 149 (66.5%) | 76 (36.5%) |
| 5 Years | 0 (0.0%) | 72 (100.0%) |
| 6 to 11 Years | 257 (59.8%) | 60 (77.9%) |
| 12 to 14 Years | 39 (43.3%) | 0 (0.0%) |
| 15 Years | 20 (24.1%) | 55 (100.0%) |
| 16 and 17 Years | 22 (29.3%) | 182 (96.3%) |
| 18 to 24 Years | 187 (65.8%) | 185 (79.7%) |
| 25 to 34 Years | 263 (57.2%) | 320 (73.9%) |
| 35 to 44 Years | 352 (78.0%) | 405 (67.4%) |
| 45 to 54 Years | 304 (89.9%) | 214 (73.8%) |
| 55 to 64 Years | 333 (80.4%) | 286 (61.6%) |
| 65 to 74 Years | 188 (69.4%) | 275 (85.1%) |
| 75 Years and over | 118 (65.6%) | 110 (55.6%) |
| Total | 2,232 (67.6%) | 2,240 (67.4%) |
Income Below Poverty Among Married-Couple Families in Clinch County
The poverty statistics for married-couple families in Clinch County show that 12.2% or 162 of the total 1,322 families live below the poverty line. Families with 3 or 4 children have the highest poverty rate of 30.0%, comprising of 30 families. On the other hand, families with 1 or 2 children have the lowest poverty rate of 4.5%, which includes 15 families.
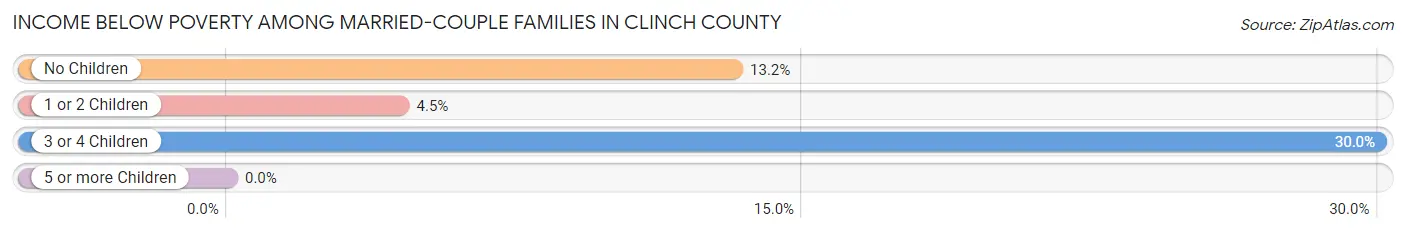
| Children | Above Poverty | Below Poverty |
| No Children | 770 (86.8%) | 117 (13.2%) |
| 1 or 2 Children | 320 (95.5%) | 15 (4.5%) |
| 3 or 4 Children | 70 (70.0%) | 30 (30.0%) |
| 5 or more Children | 0 (0.0%) | 0 (0.0%) |
| Total | 1,160 (87.7%) | 162 (12.2%) |
Income Below Poverty Among Single-Parent Households in Clinch County
According to the poverty data in Clinch County, 48.4% or 47 single-father households and 63.8% or 189 single-mother households are living below the poverty line. Among single-father households, those with 3 or 4 children have the highest poverty rate, with 14 households (100.0%) experiencing poverty. Likewise, among single-mother households, those with 3 or 4 children have the highest poverty rate, with 34 households (100.0%) falling below the poverty line.
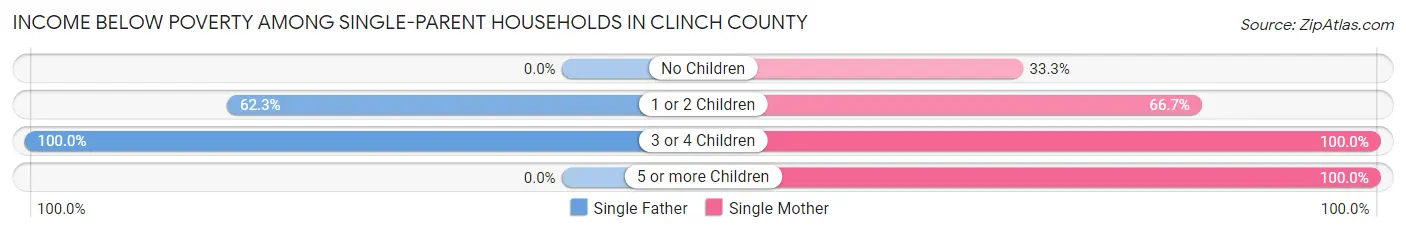
| Children | Single Father | Single Mother |
| No Children | 0 (0.0%) | 22 (33.3%) |
| 1 or 2 Children | 33 (62.3%) | 126 (66.7%) |
| 3 or 4 Children | 14 (100.0%) | 34 (100.0%) |
| 5 or more Children | 0 (0.0%) | 7 (100.0%) |
| Total | 47 (48.4%) | 189 (63.8%) |
Income Below Poverty Among Married-Couple vs Single-Parent Households in Clinch County
The poverty data for Clinch County shows that 162 of the married-couple family households (12.2%) and 236 of the single-parent households (60.1%) are living below the poverty level. Within the married-couple family households, those with 3 or 4 children have the highest poverty rate, with 30 households (30.0%) falling below the poverty line. Among the single-parent households, those with 3 or 4 children have the highest poverty rate, with 48 household (100.0%) living below poverty.
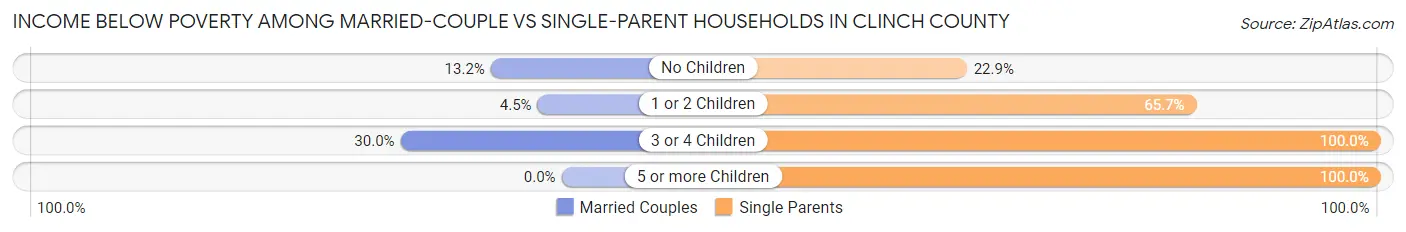
| Children | Married-Couple Families | Single-Parent Households |
| No Children | 117 (13.2%) | 22 (22.9%) |
| 1 or 2 Children | 15 (4.5%) | 159 (65.7%) |
| 3 or 4 Children | 30 (30.0%) | 48 (100.0%) |
| 5 or more Children | 0 (0.0%) | 7 (100.0%) |
| Total | 162 (12.2%) | 236 (60.1%) |
Race in Clinch County
The most populous races in Clinch County are White / Caucasian (4,383 | 65.3%), Black / African American (1,778 | 26.5%), and Hispanic or Latino (384 | 5.7%).
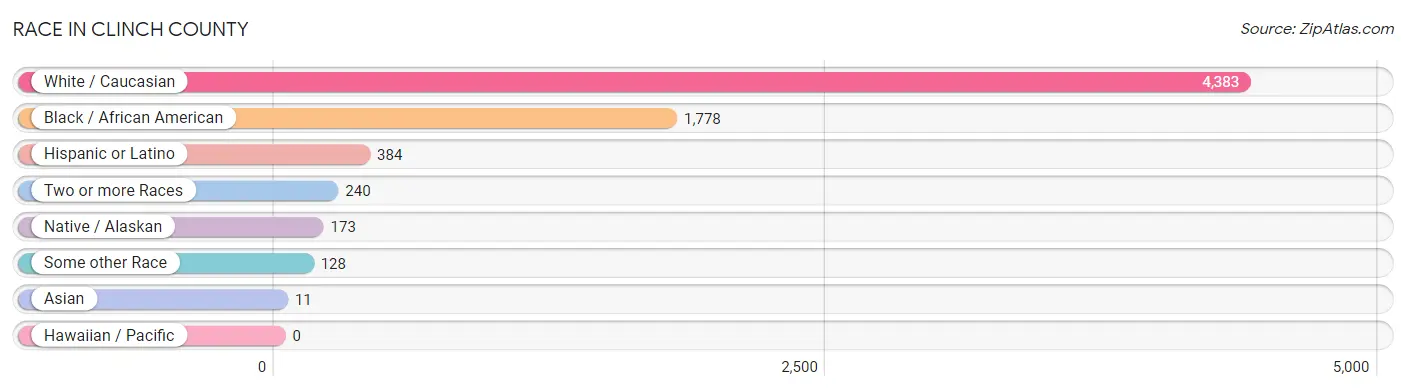
| Race | # Population | % Population |
| Asian | 11 | 0.2% |
| Black / African American | 1,778 | 26.5% |
| Hawaiian / Pacific | 0 | 0.0% |
| Hispanic or Latino | 384 | 5.7% |
| Native / Alaskan | 173 | 2.6% |
| White / Caucasian | 4,383 | 65.3% |
| Two or more Races | 240 | 3.6% |
| Some other Race | 128 | 1.9% |
| Total | 6,713 | 100.0% |
Ancestry in Clinch County
The most populous ancestries reported in Clinch County are American (675 | 10.1%), English (393 | 5.9%), Irish (330 | 4.9%), German (228 | 3.4%), and Mexican (170 | 2.5%), together accounting for 26.8% of all Clinch County residents.
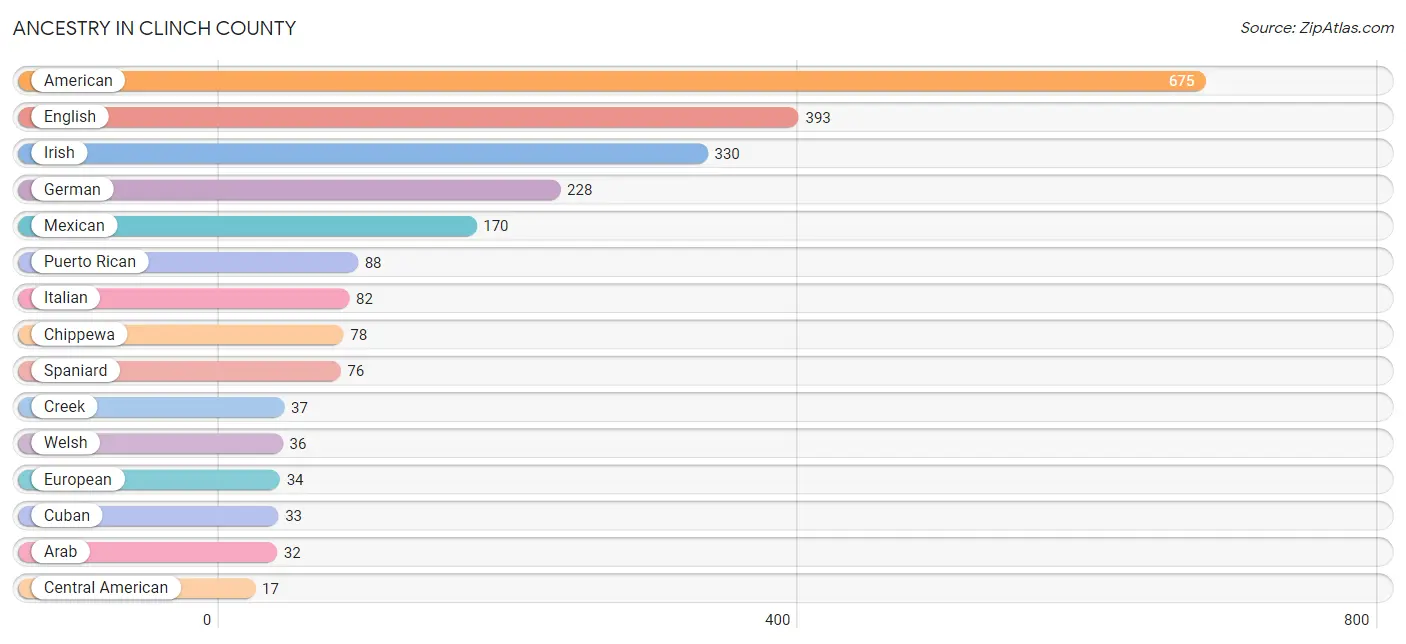
| Ancestry | # Population | % Population |
| American | 675 | 10.1% |
| Arab | 32 | 0.5% |
| British | 12 | 0.2% |
| Central American | 17 | 0.3% |
| Cherokee | 4 | 0.1% |
| Chippewa | 78 | 1.2% |
| Creek | 37 | 0.5% |
| Cuban | 33 | 0.5% |
| Dutch | 3 | 0.0% |
| English | 393 | 5.9% |
| European | 34 | 0.5% |
| French | 11 | 0.2% |
| German | 228 | 3.4% |
| Indian (Asian) | 3 | 0.0% |
| Irish | 330 | 4.9% |
| Italian | 82 | 1.2% |
| Korean | 8 | 0.1% |
| Mexican | 170 | 2.5% |
| Native Hawaiian | 3 | 0.0% |
| Norwegian | 8 | 0.1% |
| Puerto Rican | 88 | 1.3% |
| Salvadoran | 17 | 0.3% |
| Scotch-Irish | 9 | 0.1% |
| Scottish | 1 | 0.0% |
| Seminole | 1 | 0.0% |
| Spaniard | 76 | 1.1% |
| Sri Lankan | 3 | 0.0% |
| Welsh | 36 | 0.5% | View All 28 Rows |
Immigrants in Clinch County
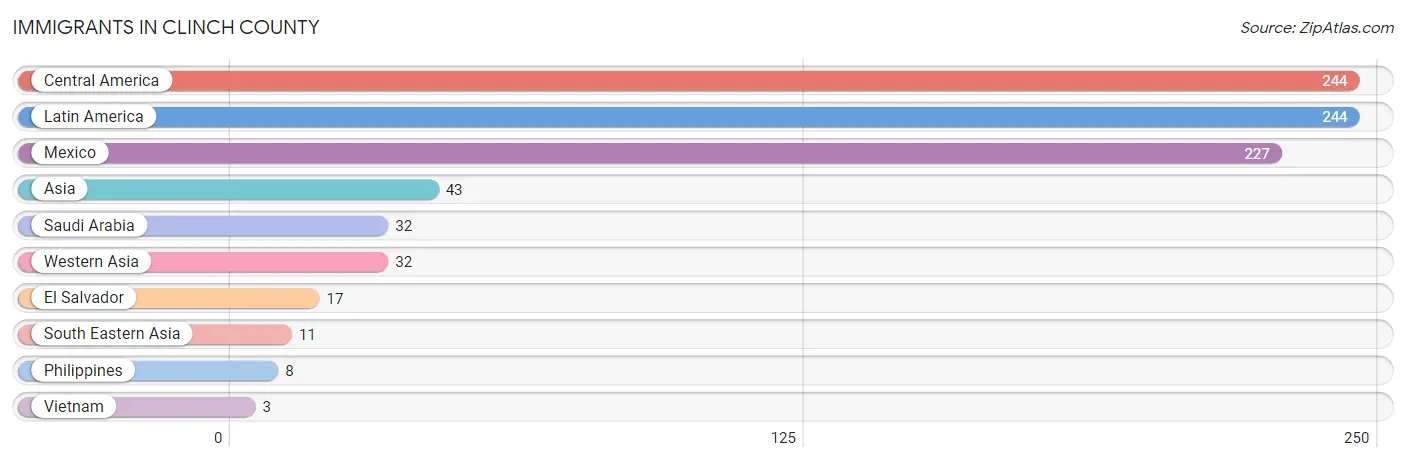
The most numerous immigrant groups reported in Clinch County came from Central America (244 | 3.6%), Latin America (244 | 3.6%), Mexico (227 | 3.4%), Asia (43 | 0.6%), and Saudi Arabia (32 | 0.5%), together accounting for 11.8% of all Clinch County residents.
| Immigration Origin | # Population | % Population |
| Asia | 43 | 0.6% |
| Central America | 244 | 3.6% |
| El Salvador | 17 | 0.3% |
| Latin America | 244 | 3.6% |
| Mexico | 227 | 3.4% |
| Philippines | 8 | 0.1% |
| Saudi Arabia | 32 | 0.5% |
| South Eastern Asia | 11 | 0.2% |
| Vietnam | 3 | 0.0% |
| Western Asia | 32 | 0.5% | View All 10 Rows |
Sex and Age in Clinch County
Sex and Age in Clinch County
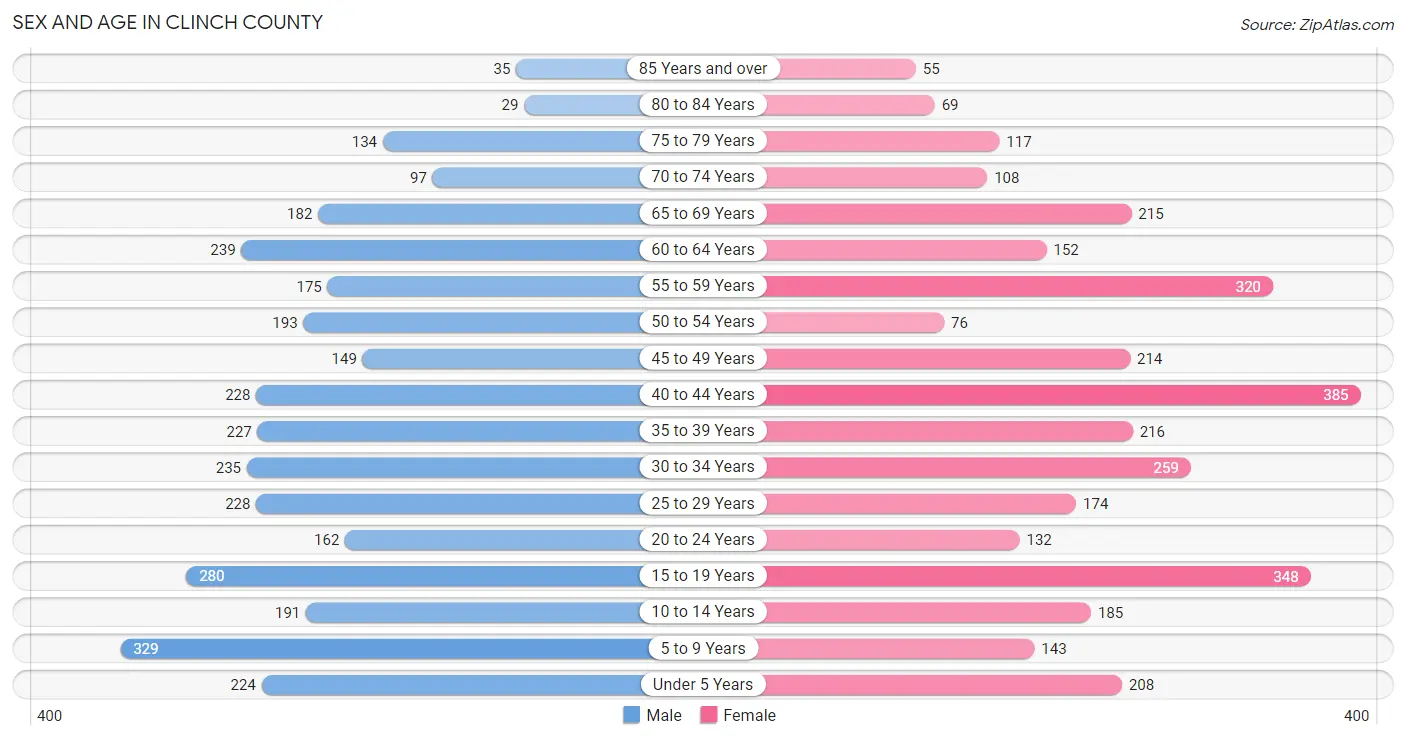
The most populous age groups in Clinch County are 5 to 9 Years (329 | 9.9%) for men and 40 to 44 Years (385 | 11.4%) for women.
| Age Bracket | Male | Female |
| Under 5 Years | 224 (6.7%) | 208 (6.2%) |
| 5 to 9 Years | 329 (9.9%) | 143 (4.2%) |
| 10 to 14 Years | 191 (5.7%) | 185 (5.5%) |
| 15 to 19 Years | 280 (8.4%) | 348 (10.3%) |
| 20 to 24 Years | 162 (4.9%) | 132 (3.9%) |
| 25 to 29 Years | 228 (6.8%) | 174 (5.1%) |
| 30 to 34 Years | 235 (7.0%) | 259 (7.7%) |
| 35 to 39 Years | 227 (6.8%) | 216 (6.4%) |
| 40 to 44 Years | 228 (6.8%) | 385 (11.4%) |
| 45 to 49 Years | 149 (4.5%) | 214 (6.3%) |
| 50 to 54 Years | 193 (5.8%) | 76 (2.2%) |
| 55 to 59 Years | 175 (5.2%) | 320 (9.5%) |
| 60 to 64 Years | 239 (7.2%) | 152 (4.5%) |
| 65 to 69 Years | 182 (5.4%) | 215 (6.4%) |
| 70 to 74 Years | 97 (2.9%) | 108 (3.2%) |
| 75 to 79 Years | 134 (4.0%) | 117 (3.5%) |
| 80 to 84 Years | 29 (0.9%) | 69 (2.0%) |
| 85 Years and over | 35 (1.1%) | 55 (1.6%) |
| Total | 3,337 (100.0%) | 3,376 (100.0%) |
Families and Households in Clinch County
Median Family Size in Clinch County
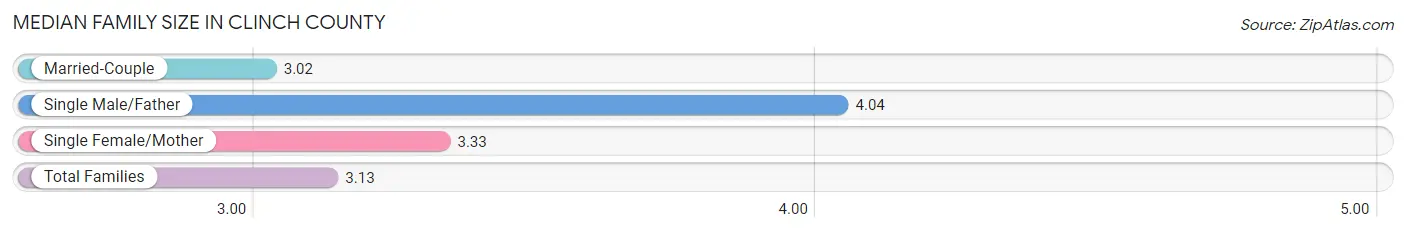
The median family size in Clinch County is 3.13 persons per family, with single male/father families (97 | 5.7%) accounting for the largest median family size of 4.04 persons per family. On the other hand, married-couple families (1,322 | 77.1%) represent the smallest median family size with 3.02 persons per family.
| Family Type | # Families | Family Size |
| Married-Couple | 1,322 (77.1%) | 3.02 |
| Single Male/Father | 97 (5.7%) | 4.04 |
| Single Female/Mother | 296 (17.3%) | 3.33 |
| Total Families | 1,715 (100.0%) | 3.13 |
Median Household Size in Clinch County
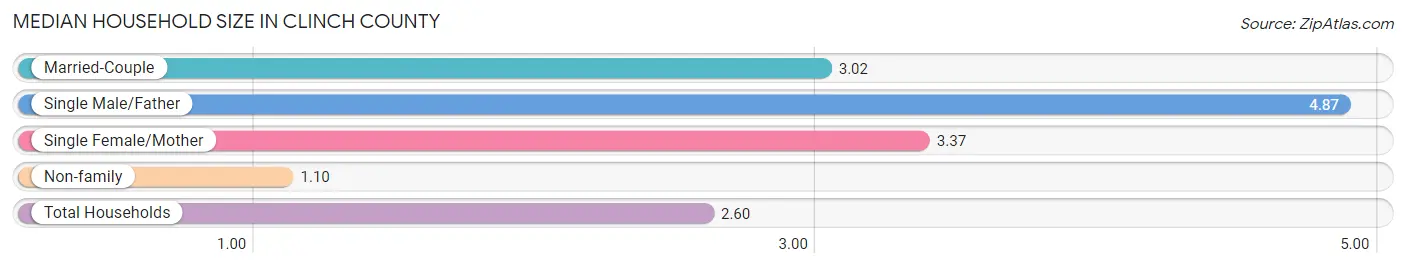
The median household size in Clinch County is 2.60 persons per household, with single male/father households (97 | 4.1%) accounting for the largest median household size of 4.87 persons per household. non-family households (670 | 28.1%) represent the smallest median household size with 1.10 persons per household.
| Household Type | # Households | Household Size |
| Married-Couple | 1,322 (55.4%) | 3.02 |
| Single Male/Father | 97 (4.1%) | 4.87 |
| Single Female/Mother | 296 (12.4%) | 3.37 |
| Non-family | 670 (28.1%) | 1.10 |
| Total Households | 2,385 (100.0%) | 2.60 |
Household Size by Marriage Status in Clinch County
Out of a total of 2,385 households in Clinch County, 1,715 (71.9%) are family households, while 670 (28.1%) are nonfamily households. The most numerous type of family households are 2-person households, comprising 745, and the most common type of nonfamily households are 1-person households, comprising 604.
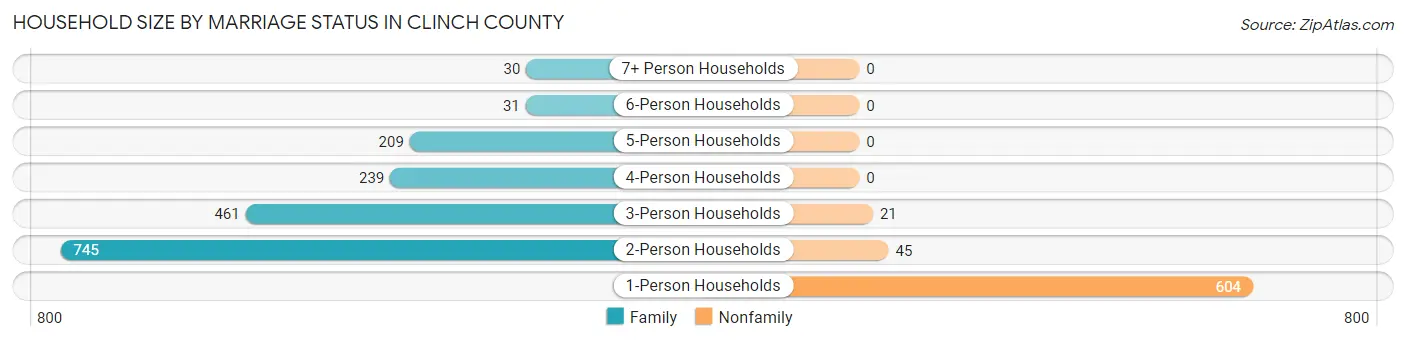
| Household Size | Family Households | Nonfamily Households |
| 1-Person Households | - | 604 (25.3%) |
| 2-Person Households | 745 (31.2%) | 45 (1.9%) |
| 3-Person Households | 461 (19.3%) | 21 (0.9%) |
| 4-Person Households | 239 (10.0%) | 0 (0.0%) |
| 5-Person Households | 209 (8.8%) | 0 (0.0%) |
| 6-Person Households | 31 (1.3%) | 0 (0.0%) |
| 7+ Person Households | 30 (1.3%) | 0 (0.0%) |
| Total | 1,715 (71.9%) | 670 (28.1%) |
Female Fertility in Clinch County
Fertility by Age in Clinch County
Average fertility rate in Clinch County is 64.0 births per 1,000 women. Women in the age bracket of 20 to 34 years have the highest fertility rate with 191.0 births per 1,000 women. Women in the age bracket of 20 to 34 years acount for 97.3% of all women with births.
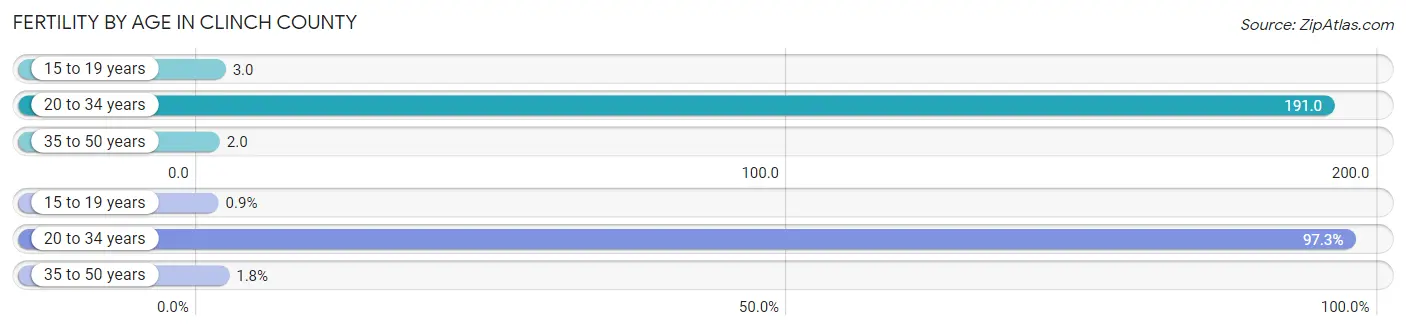
| Age Bracket | Women with Births | Births / 1,000 Women |
| 15 to 19 years | 1 (0.9%) | 3.0 |
| 20 to 34 years | 108 (97.3%) | 191.0 |
| 35 to 50 years | 2 (1.8%) | 2.0 |
| Total | 111 (100.0%) | 64.0 |
Fertility by Age by Marriage Status in Clinch County
64.9% of women with births (111) in Clinch County are married. The highest percentage of unmarried women with births falls into 15 to 19 years age bracket with 100.0% of them unmarried at the time of birth, while the lowest percentage of unmarried women with births belong to 20 to 34 years age bracket with 33.3% of them unmarried.
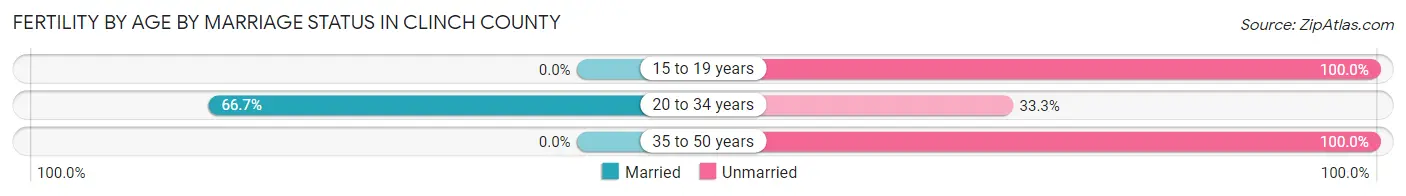
| Age Bracket | Married | Unmarried |
| 15 to 19 years | 0 (0.0%) | 1 (100.0%) |
| 20 to 34 years | 72 (66.7%) | 36 (33.3%) |
| 35 to 50 years | 0 (0.0%) | 2 (100.0%) |
| Total | 72 (64.9%) | 39 (35.1%) |
Fertility by Education in Clinch County
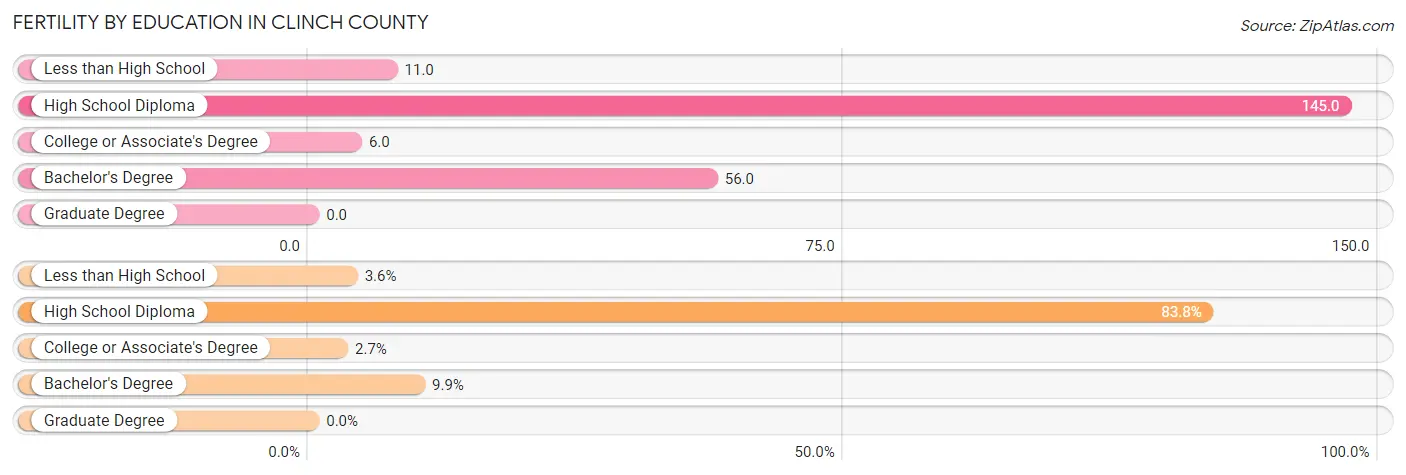
| Educational Attainment | Women with Births | Births / 1,000 Women |
| Less than High School | 4 (3.6%) | 11.0 |
| High School Diploma | 93 (83.8%) | 145.0 |
| College or Associate's Degree | 3 (2.7%) | 6.0 |
| Bachelor's Degree | 11 (9.9%) | 56.0 |
| Graduate Degree | 0 (0.0%) | 0.0 |
| Total | 111 (100.0%) | 64.0 |
Fertility by Education by Marriage Status in Clinch County
35.1% of women with births in Clinch County are unmarried. Women with the educational attainment of less than high school are most likely to be married with 100.0% of them married at childbirth, while women with the educational attainment of high school diploma are least likely to be married with 41.9% of them unmarried at childbirth.
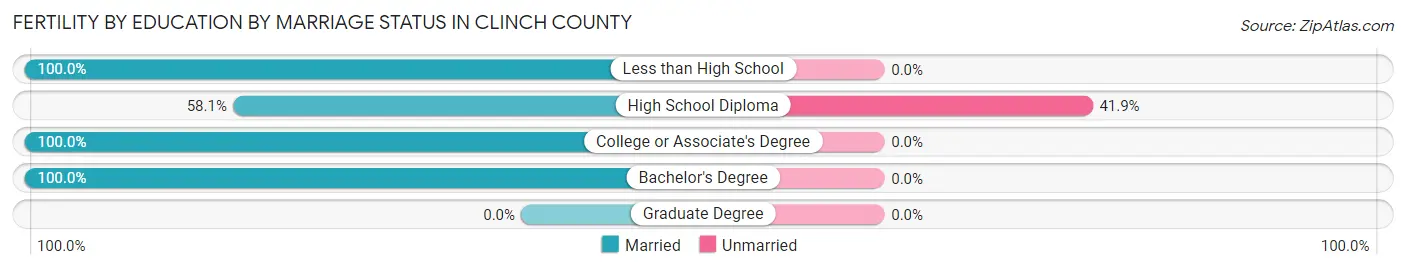
| Educational Attainment | Married | Unmarried |
| Less than High School | 4 (100.0%) | 0 (0.0%) |
| High School Diploma | 54 (58.1%) | 39 (41.9%) |
| College or Associate's Degree | 3 (100.0%) | 0 (0.0%) |
| Bachelor's Degree | 11 (100.0%) | 0 (0.0%) |
| Graduate Degree | 0 (0.0%) | 0 (0.0%) |
| Total | 72 (64.9%) | 39 (35.1%) |
Employment Characteristics in Clinch County
Employment by Class of Employer in Clinch County
Among the 2,512 employed individuals in Clinch County, private company employees (1,402 | 55.8%), not-for-profit organizations (328 | 13.1%), and state government employees (286 | 11.4%) make up the most common classes of employment.
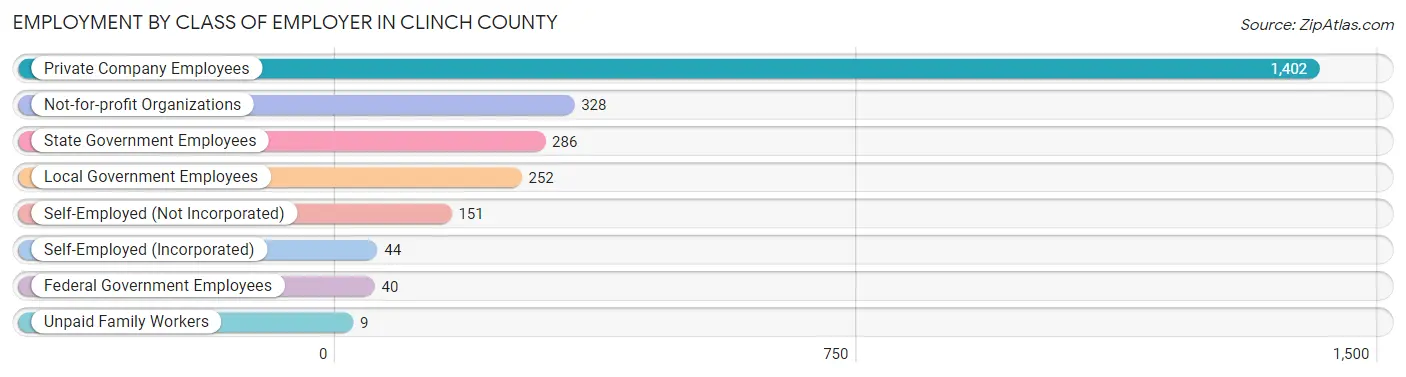
| Employer Class | # Employees | % Employees |
| Private Company Employees | 1,402 | 55.8% |
| Self-Employed (Incorporated) | 44 | 1.8% |
| Self-Employed (Not Incorporated) | 151 | 6.0% |
| Not-for-profit Organizations | 328 | 13.1% |
| Local Government Employees | 252 | 10.0% |
| State Government Employees | 286 | 11.4% |
| Federal Government Employees | 40 | 1.6% |
| Unpaid Family Workers | 9 | 0.4% |
| Total | 2,512 | 100.0% |
Employment Status by Age in Clinch County
According to the labor force statistics for Clinch County, out of the total population over 16 years of age (5,295), 48.8% or 2,584 individuals are in the labor force, with 2.6% or 67 of them unemployed. The age group with the highest labor force participation rate is 20 to 24 years, with 74.8% or 220 individuals in the labor force. Within the labor force, the 30 to 34 years age range has the highest percentage of unemployed individuals, with 14.2% or 47 of them being unemployed.
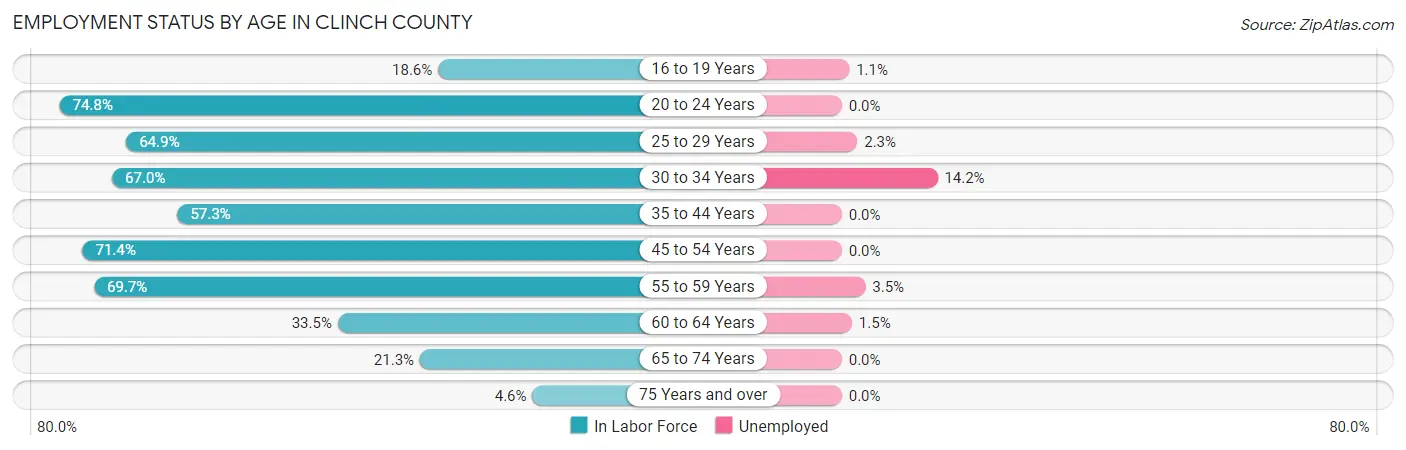
| Age Bracket | In Labor Force | Unemployed |
| 16 to 19 Years | 91 (18.6%) | 1 (1.1%) |
| 20 to 24 Years | 220 (74.8%) | 0 (0.0%) |
| 25 to 29 Years | 261 (64.9%) | 6 (2.3%) |
| 30 to 34 Years | 331 (67.0%) | 47 (14.2%) |
| 35 to 44 Years | 605 (57.3%) | 0 (0.0%) |
| 45 to 54 Years | 451 (71.4%) | 0 (0.0%) |
| 55 to 59 Years | 345 (69.7%) | 12 (3.5%) |
| 60 to 64 Years | 131 (33.5%) | 2 (1.5%) |
| 65 to 74 Years | 128 (21.3%) | 0 (0.0%) |
| 75 Years and over | 20 (4.6%) | 0 (0.0%) |
| Total | 2,584 (48.8%) | 67 (2.6%) |
Employment Status by Educational Attainment in Clinch County
According to labor force statistics for Clinch County, 61.2% of individuals (2,124) out of the total population between 25 and 64 years of age (3,470) are in the labor force, with 3.2% or 68 of them being unemployed. The group with the highest labor force participation rate are those with the educational attainment of bachelor's degree or higher, with 84.1% or 333 individuals in the labor force. Within the labor force, individuals with high school diploma education have the highest percentage of unemployment, with 6.4% or 49 of them being unemployed.
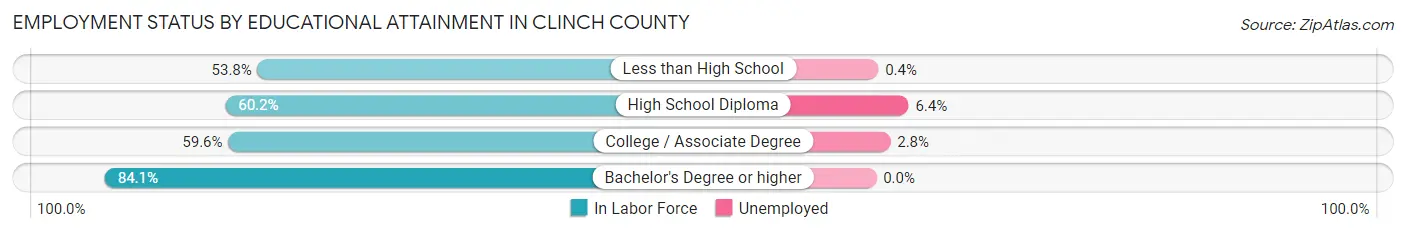
| Educational Attainment | In Labor Force | Unemployed |
| Less than High School | 454 (53.8%) | 3 (0.4%) |
| High School Diploma | 771 (60.2%) | 82 (6.4%) |
| College / Associate Degree | 566 (59.6%) | 27 (2.8%) |
| Bachelor's Degree or higher | 333 (84.1%) | 0 (0.0%) |
| Total | 2,124 (61.2%) | 111 (3.2%) |
Employment Occupations by Sex in Clinch County
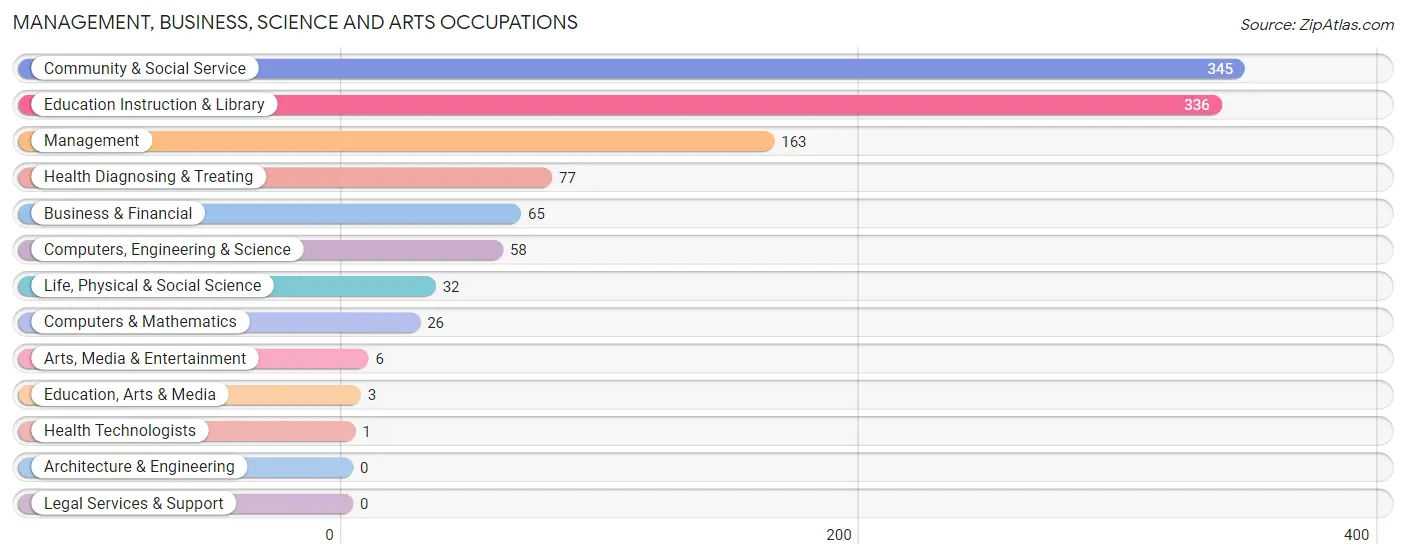
Management, Business, Science and Arts Occupations
The most common Management, Business, Science and Arts occupations in Clinch County are Community & Social Service (345 | 13.7%), Education Instruction & Library (336 | 13.4%), Management (163 | 6.5%), Health Diagnosing & Treating (77 | 3.1%), and Business & Financial (65 | 2.6%).
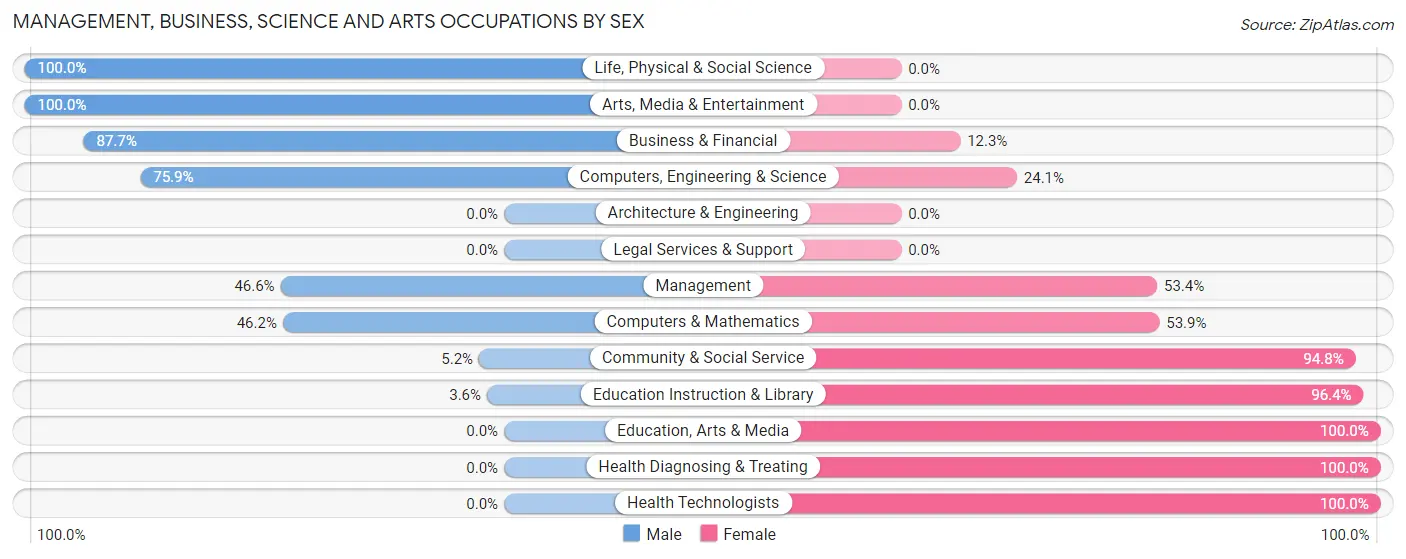
Management, Business, Science and Arts Occupations by Sex
Within the Management, Business, Science and Arts occupations in Clinch County, the most male-oriented occupations are Life, Physical & Social Science (100.0%), Arts, Media & Entertainment (100.0%), and Business & Financial (87.7%), while the most female-oriented occupations are Education, Arts & Media (100.0%), Health Diagnosing & Treating (100.0%), and Health Technologists (100.0%).
| Occupation | Male | Female |
| Management | 76 (46.6%) | 87 (53.4%) |
| Business & Financial | 57 (87.7%) | 8 (12.3%) |
| Computers, Engineering & Science | 44 (75.9%) | 14 (24.1%) |
| Computers & Mathematics | 12 (46.2%) | 14 (53.8%) |
| Architecture & Engineering | 0 (0.0%) | 0 (0.0%) |
| Life, Physical & Social Science | 32 (100.0%) | 0 (0.0%) |
| Community & Social Service | 18 (5.2%) | 327 (94.8%) |
| Education, Arts & Media | 0 (0.0%) | 3 (100.0%) |
| Legal Services & Support | 0 (0.0%) | 0 (0.0%) |
| Education Instruction & Library | 12 (3.6%) | 324 (96.4%) |
| Arts, Media & Entertainment | 6 (100.0%) | 0 (0.0%) |
| Health Diagnosing & Treating | 0 (0.0%) | 77 (100.0%) |
| Health Technologists | 0 (0.0%) | 1 (100.0%) |
| Total (Category) | 195 (27.5%) | 513 (72.5%) |
| Total (Overall) | 1,406 (55.9%) | 1,109 (44.1%) |
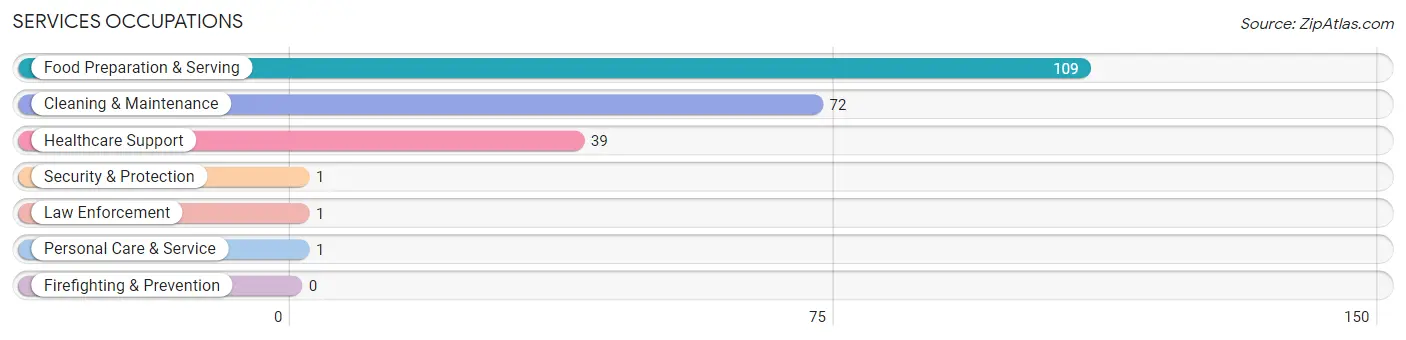
Services Occupations
The most common Services occupations in Clinch County are Food Preparation & Serving (109 | 4.3%), Cleaning & Maintenance (72 | 2.9%), Healthcare Support (39 | 1.5%), Security & Protection (1 | 0.0%), and Law Enforcement (1 | 0.0%).
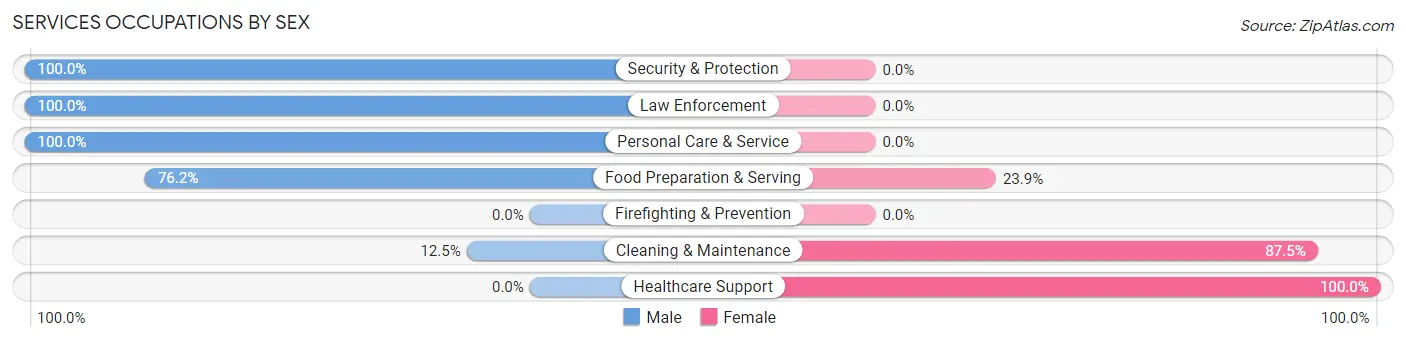
Services Occupations by Sex
Within the Services occupations in Clinch County, the most male-oriented occupations are Security & Protection (100.0%), Law Enforcement (100.0%), and Personal Care & Service (100.0%), while the most female-oriented occupations are Healthcare Support (100.0%), Cleaning & Maintenance (87.5%), and Food Preparation & Serving (23.8%).
| Occupation | Male | Female |
| Healthcare Support | 0 (0.0%) | 39 (100.0%) |
| Security & Protection | 1 (100.0%) | 0 (0.0%) |
| Firefighting & Prevention | 0 (0.0%) | 0 (0.0%) |
| Law Enforcement | 1 (100.0%) | 0 (0.0%) |
| Food Preparation & Serving | 83 (76.1%) | 26 (23.8%) |
| Cleaning & Maintenance | 9 (12.5%) | 63 (87.5%) |
| Personal Care & Service | 1 (100.0%) | 0 (0.0%) |
| Total (Category) | 94 (42.3%) | 128 (57.7%) |
| Total (Overall) | 1,406 (55.9%) | 1,109 (44.1%) |
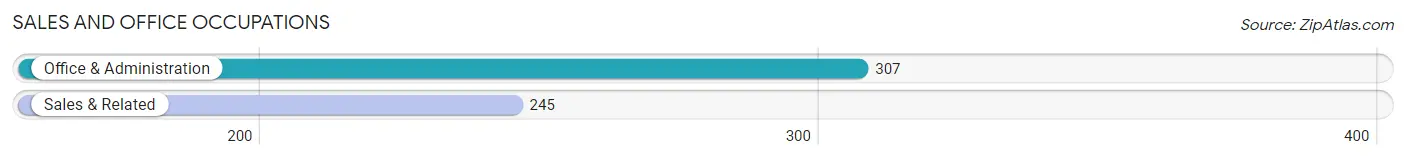
Sales and Office Occupations
The most common Sales and Office occupations in Clinch County are Office & Administration (307 | 12.2%), and Sales & Related (245 | 9.7%).
Sales and Office Occupations by Sex
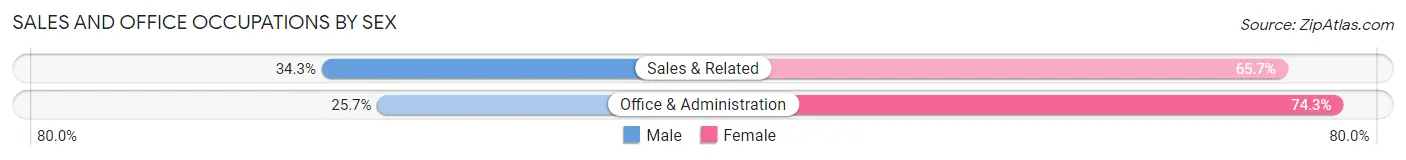
| Occupation | Male | Female |
| Sales & Related | 84 (34.3%) | 161 (65.7%) |
| Office & Administration | 79 (25.7%) | 228 (74.3%) |
| Total (Category) | 163 (29.5%) | 389 (70.5%) |
| Total (Overall) | 1,406 (55.9%) | 1,109 (44.1%) |
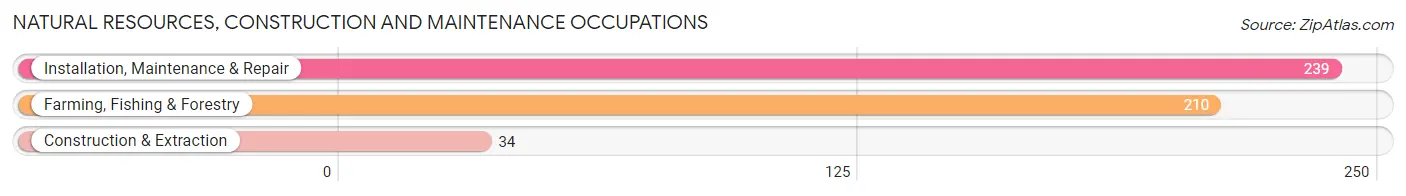
Natural Resources, Construction and Maintenance Occupations
The most common Natural Resources, Construction and Maintenance occupations in Clinch County are Installation, Maintenance & Repair (239 | 9.5%), Farming, Fishing & Forestry (210 | 8.4%), and Construction & Extraction (34 | 1.3%).
Natural Resources, Construction and Maintenance Occupations by Sex
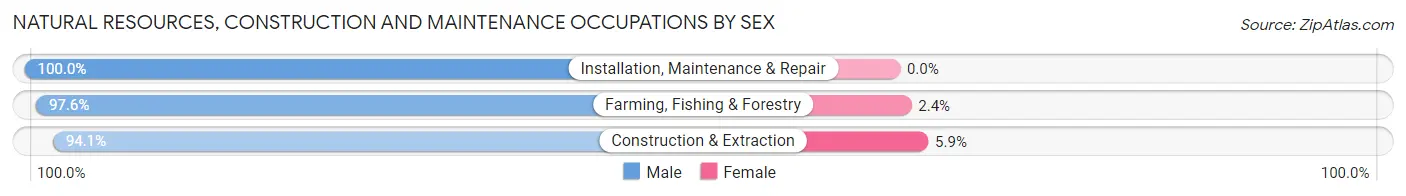
| Occupation | Male | Female |
| Farming, Fishing & Forestry | 205 (97.6%) | 5 (2.4%) |
| Construction & Extraction | 32 (94.1%) | 2 (5.9%) |
| Installation, Maintenance & Repair | 239 (100.0%) | 0 (0.0%) |
| Total (Category) | 476 (98.6%) | 7 (1.5%) |
| Total (Overall) | 1,406 (55.9%) | 1,109 (44.1%) |
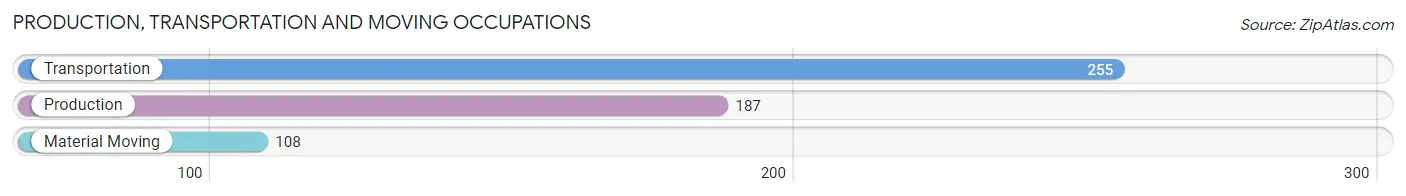
Production, Transportation and Moving Occupations
The most common Production, Transportation and Moving occupations in Clinch County are Transportation (255 | 10.1%), Production (187 | 7.4%), and Material Moving (108 | 4.3%).
Production, Transportation and Moving Occupations by Sex
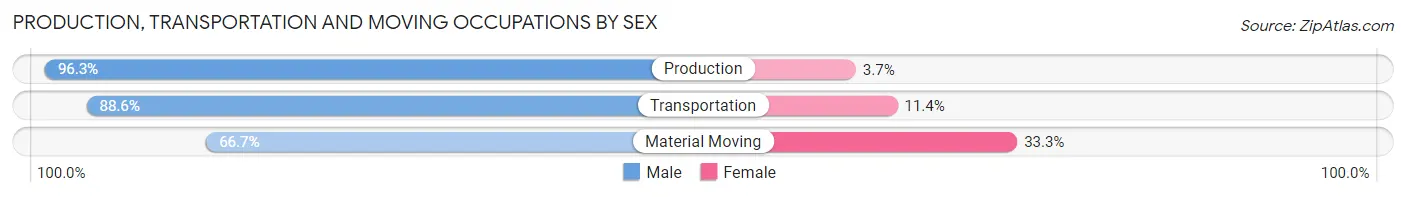
| Occupation | Male | Female |
| Production | 180 (96.3%) | 7 (3.7%) |
| Transportation | 226 (88.6%) | 29 (11.4%) |
| Material Moving | 72 (66.7%) | 36 (33.3%) |
| Total (Category) | 478 (86.9%) | 72 (13.1%) |
| Total (Overall) | 1,406 (55.9%) | 1,109 (44.1%) |
Employment Industries by Sex in Clinch County
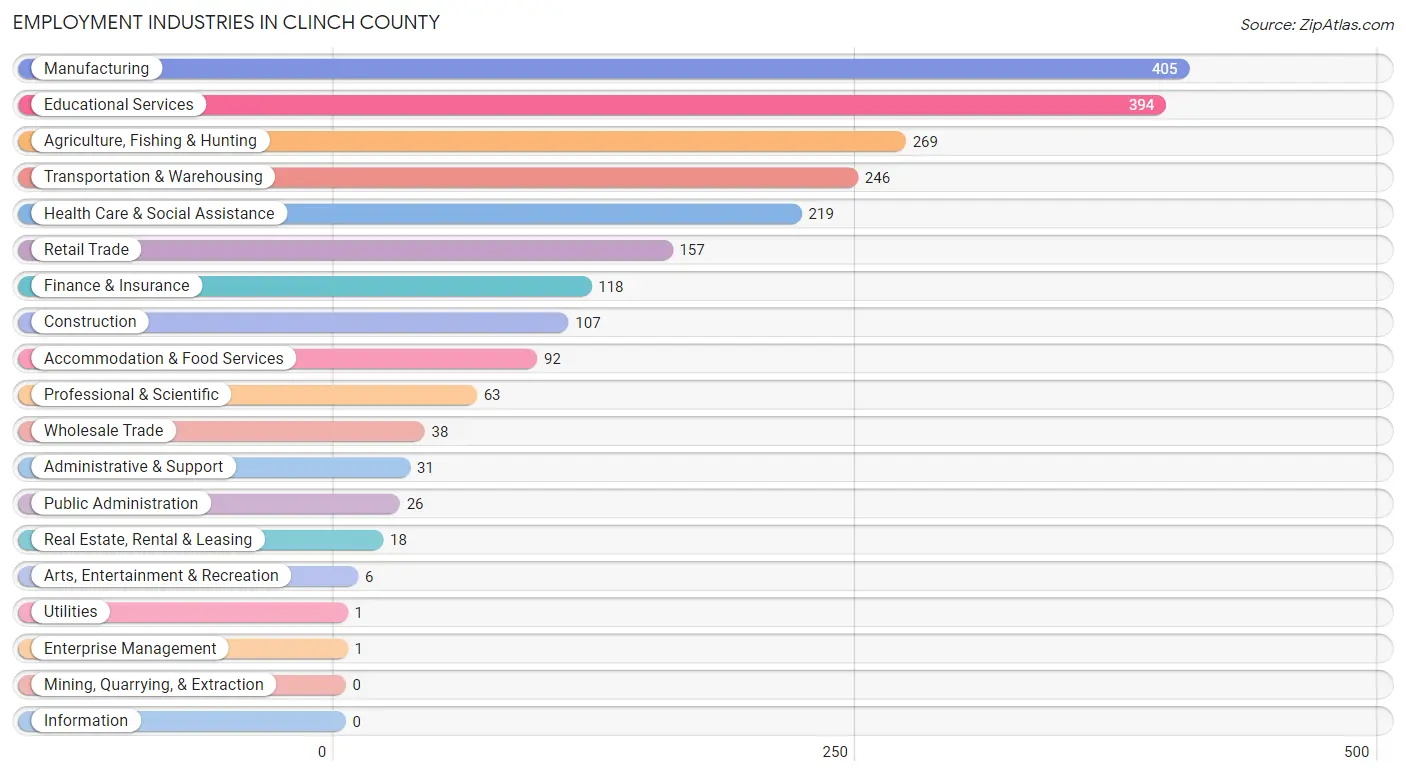
Employment Industries in Clinch County
The major employment industries in Clinch County include Manufacturing (405 | 16.1%), Educational Services (394 | 15.7%), Agriculture, Fishing & Hunting (269 | 10.7%), Transportation & Warehousing (246 | 9.8%), and Health Care & Social Assistance (219 | 8.7%).
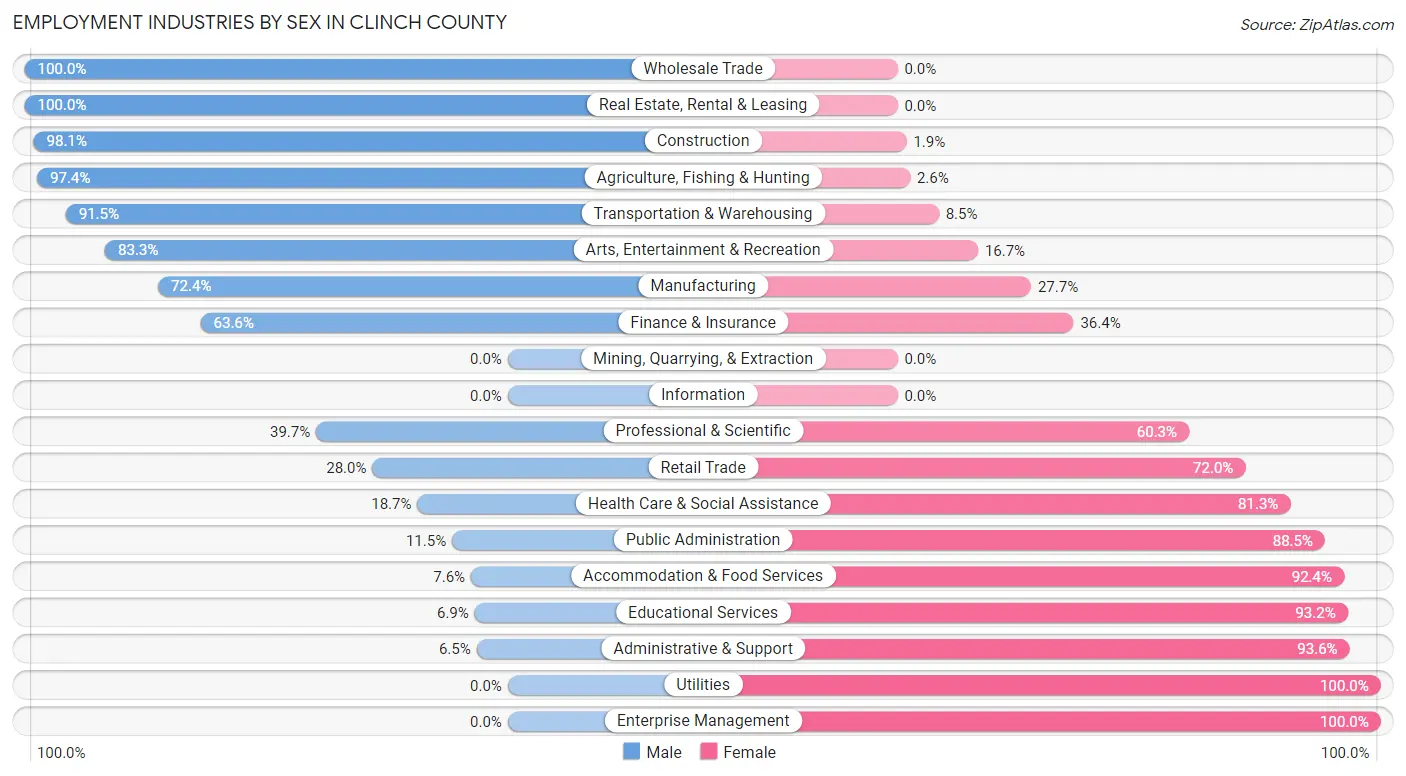
Employment Industries by Sex in Clinch County
The Clinch County industries that see more men than women are Wholesale Trade (100.0%), Real Estate, Rental & Leasing (100.0%), and Construction (98.1%), whereas the industries that tend to have a higher number of women are Utilities (100.0%), Enterprise Management (100.0%), and Administrative & Support (93.5%).
| Industry | Male | Female |
| Agriculture, Fishing & Hunting | 262 (97.4%) | 7 (2.6%) |
| Mining, Quarrying, & Extraction | 0 (0.0%) | 0 (0.0%) |
| Construction | 105 (98.1%) | 2 (1.9%) |
| Manufacturing | 293 (72.4%) | 112 (27.7%) |
| Wholesale Trade | 38 (100.0%) | 0 (0.0%) |
| Retail Trade | 44 (28.0%) | 113 (72.0%) |
| Transportation & Warehousing | 225 (91.5%) | 21 (8.5%) |
| Utilities | 0 (0.0%) | 1 (100.0%) |
| Information | 0 (0.0%) | 0 (0.0%) |
| Finance & Insurance | 75 (63.6%) | 43 (36.4%) |
| Real Estate, Rental & Leasing | 18 (100.0%) | 0 (0.0%) |
| Professional & Scientific | 25 (39.7%) | 38 (60.3%) |
| Enterprise Management | 0 (0.0%) | 1 (100.0%) |
| Administrative & Support | 2 (6.5%) | 29 (93.5%) |
| Educational Services | 27 (6.9%) | 367 (93.1%) |
| Health Care & Social Assistance | 41 (18.7%) | 178 (81.3%) |
| Arts, Entertainment & Recreation | 5 (83.3%) | 1 (16.7%) |
| Accommodation & Food Services | 7 (7.6%) | 85 (92.4%) |
| Public Administration | 3 (11.5%) | 23 (88.5%) |
| Total | 1,406 (55.9%) | 1,109 (44.1%) |
Education in Clinch County
School Enrollment in Clinch County
The most common levels of schooling among the 1,593 students in Clinch County are high school (475 | 29.8%), middle school (383 | 24.0%), and elementary school (377 | 23.7%).
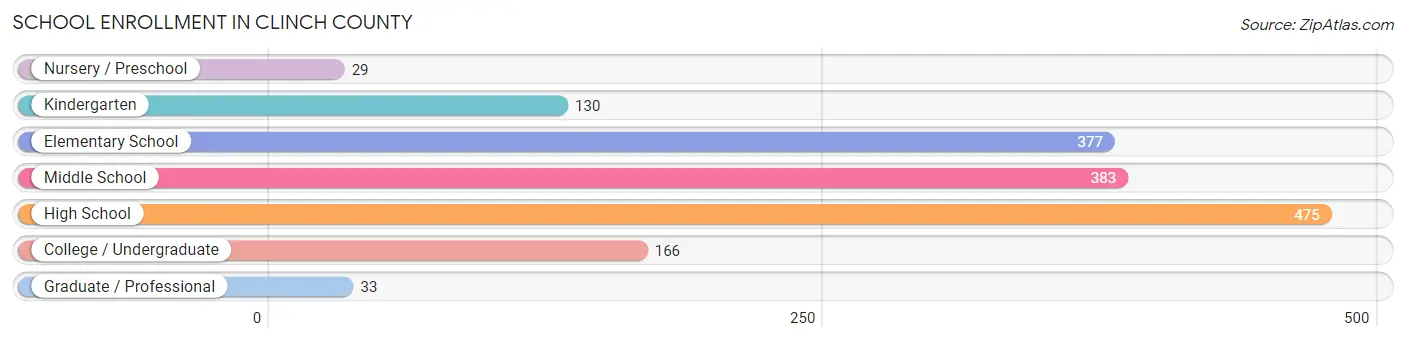
| School Level | # Students | % Students |
| Nursery / Preschool | 29 | 1.8% |
| Kindergarten | 130 | 8.2% |
| Elementary School | 377 | 23.7% |
| Middle School | 383 | 24.0% |
| High School | 475 | 29.8% |
| College / Undergraduate | 166 | 10.4% |
| Graduate / Professional | 33 | 2.1% |
| Total | 1,593 | 100.0% |
School Enrollment by Age by Funding Source in Clinch County
Out of a total of 1,593 students who are enrolled in schools in Clinch County, 25 (1.6%) attend a private institution, while the remaining 1,568 (98.4%) are enrolled in public schools. The age group of 5 to 9 year old has the highest likelihood of being enrolled in private schools, with 21 (4.4% in the age bracket) enrolled. Conversely, the age group of 3 to 4 year olds has the lowest likelihood of being enrolled in a private school, with 29 (100.0% in the age bracket) attending a public institution.
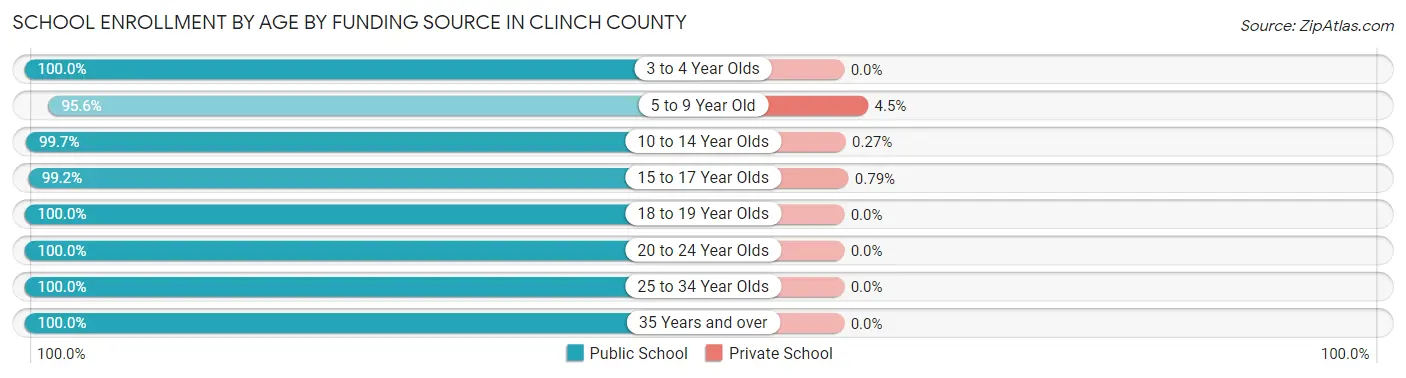
| Age Bracket | Public School | Private School |
| 3 to 4 Year Olds | 29 (100.0%) | 0 (0.0%) |
| 5 to 9 Year Old | 451 (95.6%) | 21 (4.4%) |
| 10 to 14 Year Olds | 375 (99.7%) | 1 (0.3%) |
| 15 to 17 Year Olds | 379 (99.2%) | 3 (0.8%) |
| 18 to 19 Year Olds | 138 (100.0%) | 0 (0.0%) |
| 20 to 24 Year Olds | 71 (100.0%) | 0 (0.0%) |
| 25 to 34 Year Olds | 20 (100.0%) | 0 (0.0%) |
| 35 Years and over | 105 (100.0%) | 0 (0.0%) |
| Total | 1,568 (98.4%) | 25 (1.6%) |
Educational Attainment by Field of Study in Clinch County
Education (267 | 45.6%), computers & mathematics (59 | 10.1%), arts & humanities (52 | 8.9%), bio, nature & agricultural (51 | 8.7%), and business (37 | 6.3%) are the most common fields of study among 586 individuals in Clinch County who have obtained a bachelor's degree or higher.
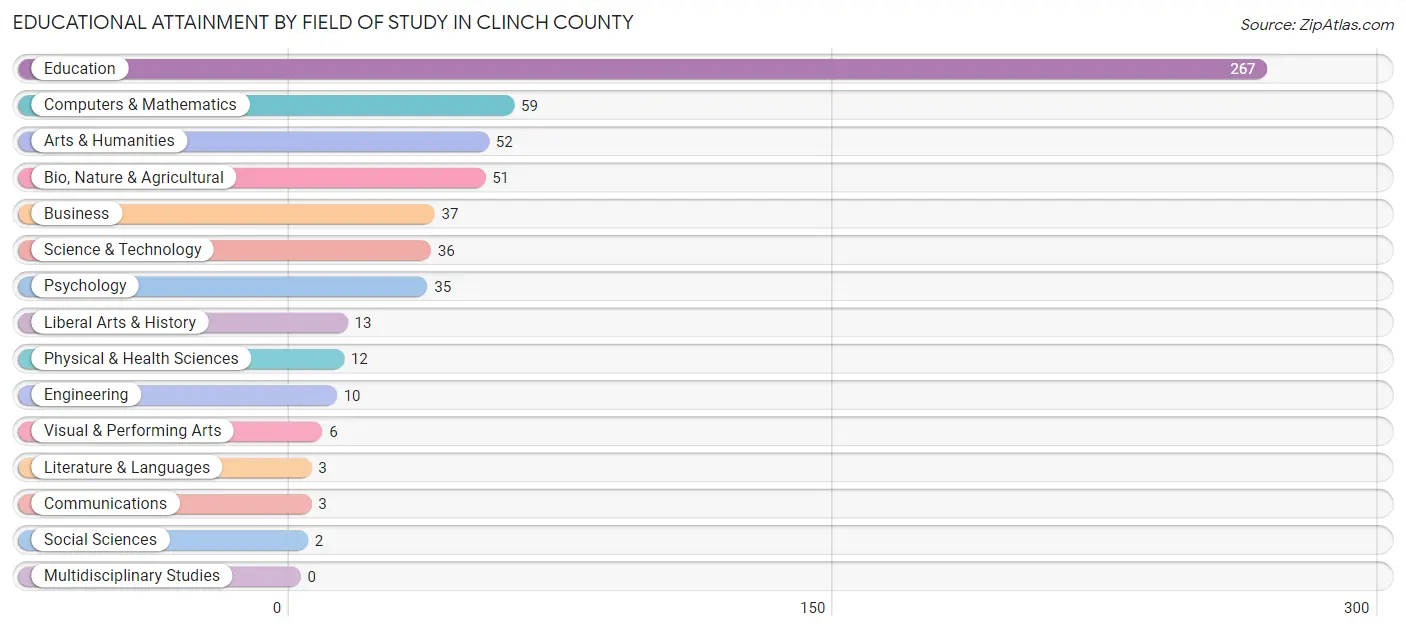
| Field of Study | # Graduates | % Graduates |
| Computers & Mathematics | 59 | 10.1% |
| Bio, Nature & Agricultural | 51 | 8.7% |
| Physical & Health Sciences | 12 | 2.1% |
| Psychology | 35 | 6.0% |
| Social Sciences | 2 | 0.3% |
| Engineering | 10 | 1.7% |
| Multidisciplinary Studies | 0 | 0.0% |
| Science & Technology | 36 | 6.1% |
| Business | 37 | 6.3% |
| Education | 267 | 45.6% |
| Literature & Languages | 3 | 0.5% |
| Liberal Arts & History | 13 | 2.2% |
| Visual & Performing Arts | 6 | 1.0% |
| Communications | 3 | 0.5% |
| Arts & Humanities | 52 | 8.9% |
| Total | 586 | 100.0% |
Transportation & Commute in Clinch County
Vehicle Availability by Sex in Clinch County
The most prevalent vehicle ownership categories in Clinch County are males with 3 vehicles (452, accounting for 38.8%) and females with 3 vehicles (410, making up 40.9%).
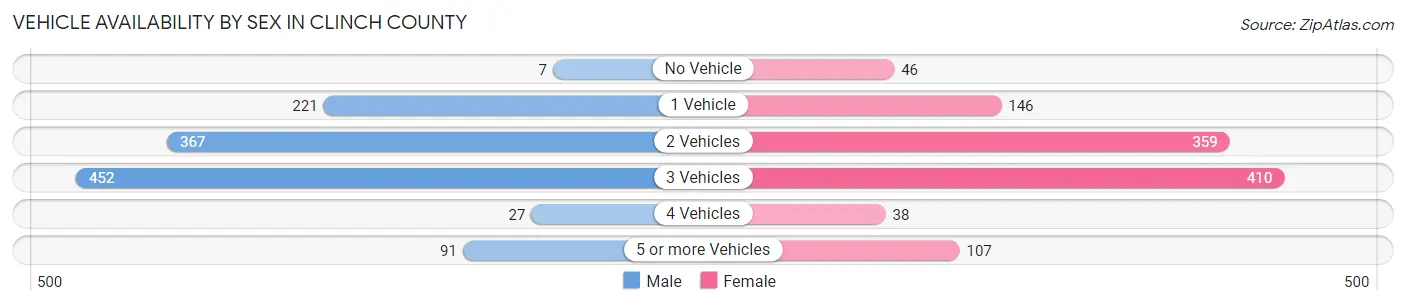
| Vehicles Available | Male | Female |
| No Vehicle | 7 (0.6%) | 46 (4.2%) |
| 1 Vehicle | 221 (19.0%) | 146 (13.2%) |
| 2 Vehicles | 367 (31.5%) | 359 (32.5%) |
| 3 Vehicles | 452 (38.8%) | 410 (37.1%) |
| 4 Vehicles | 27 (2.3%) | 38 (3.4%) |
| 5 or more Vehicles | 91 (7.8%) | 107 (9.7%) |
| Total | 1,165 (100.0%) | 1,106 (100.0%) |
Commute Time in Clinch County
The most frequently occuring commute durations in Clinch County are 5 to 9 minutes (520 commuters, 21.5%), 15 to 19 minutes (361 commuters, 14.9%), and 10 to 14 minutes (285 commuters, 11.8%).
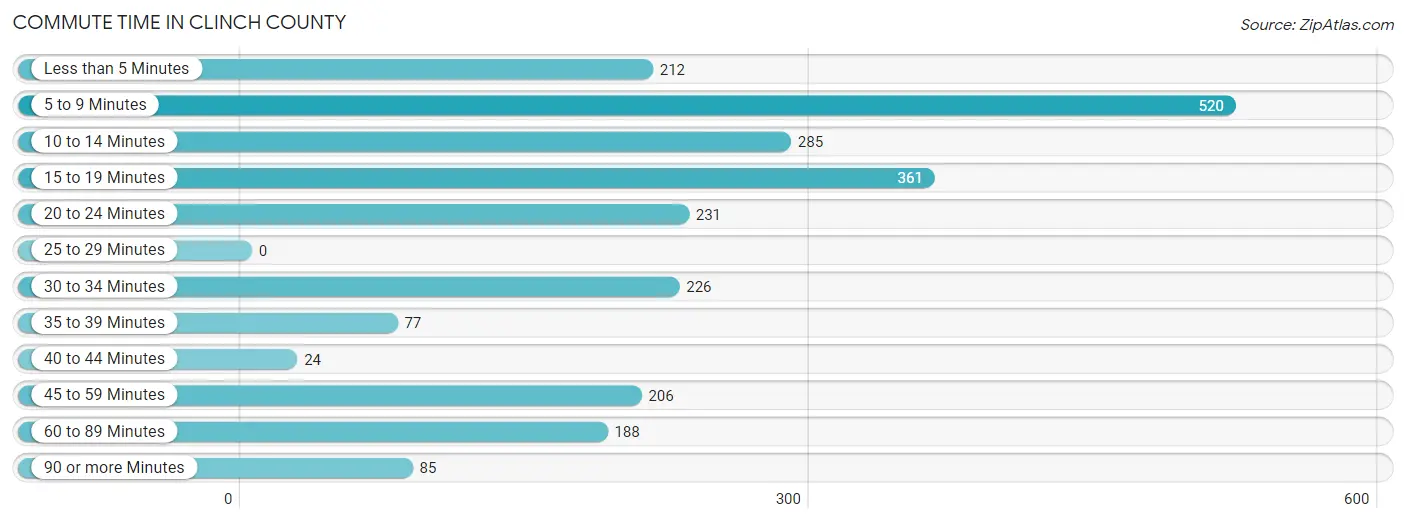
| Commute Time | # Commuters | % Commuters |
| Less than 5 Minutes | 212 | 8.8% |
| 5 to 9 Minutes | 520 | 21.5% |
| 10 to 14 Minutes | 285 | 11.8% |
| 15 to 19 Minutes | 361 | 14.9% |
| 20 to 24 Minutes | 231 | 9.6% |
| 25 to 29 Minutes | 0 | 0.0% |
| 30 to 34 Minutes | 226 | 9.4% |
| 35 to 39 Minutes | 77 | 3.2% |
| 40 to 44 Minutes | 24 | 1.0% |
| 45 to 59 Minutes | 206 | 8.5% |
| 60 to 89 Minutes | 188 | 7.8% |
| 90 or more Minutes | 85 | 3.5% |
Commute Time by Sex in Clinch County
The most common commute times in Clinch County are 5 to 9 minutes (280 commuters, 21.3%) for males and 15 to 19 minutes (305 commuters, 27.8%) for females.
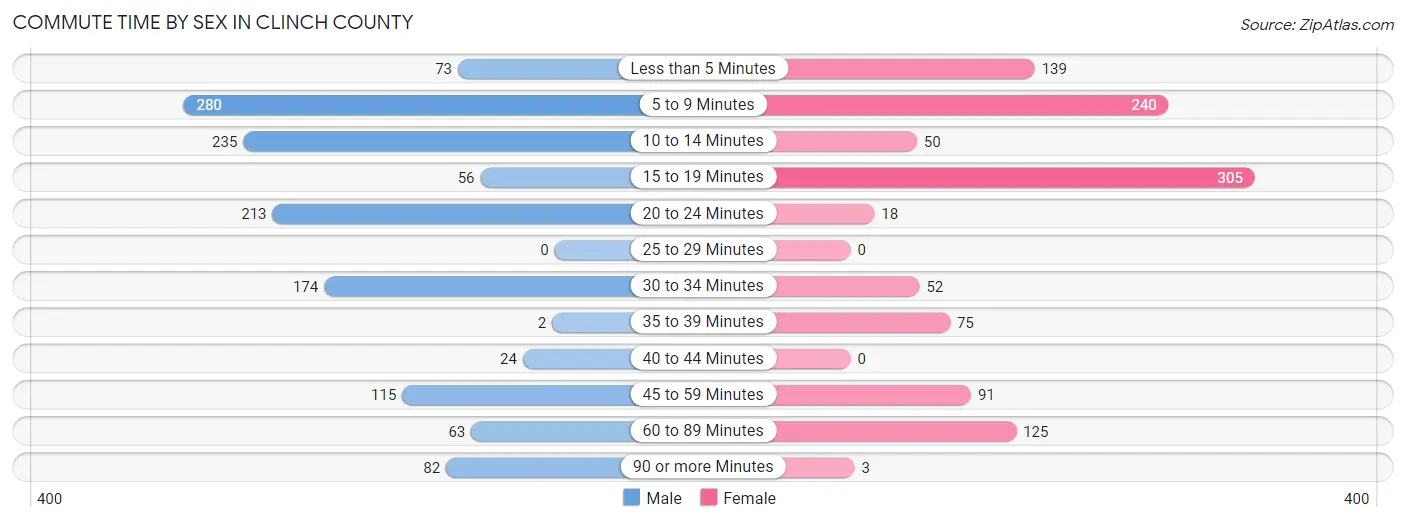
| Commute Time | Male | Female |
| Less than 5 Minutes | 73 (5.5%) | 139 (12.7%) |
| 5 to 9 Minutes | 280 (21.3%) | 240 (21.9%) |
| 10 to 14 Minutes | 235 (17.8%) | 50 (4.5%) |
| 15 to 19 Minutes | 56 (4.3%) | 305 (27.8%) |
| 20 to 24 Minutes | 213 (16.2%) | 18 (1.6%) |
| 25 to 29 Minutes | 0 (0.0%) | 0 (0.0%) |
| 30 to 34 Minutes | 174 (13.2%) | 52 (4.7%) |
| 35 to 39 Minutes | 2 (0.2%) | 75 (6.8%) |
| 40 to 44 Minutes | 24 (1.8%) | 0 (0.0%) |
| 45 to 59 Minutes | 115 (8.7%) | 91 (8.3%) |
| 60 to 89 Minutes | 63 (4.8%) | 125 (11.4%) |
| 90 or more Minutes | 82 (6.2%) | 3 (0.3%) |
Time of Departure to Work by Sex in Clinch County
The most frequent times of departure to work in Clinch County are 6:00 AM to 6:29 AM (341, 25.9%) for males and 6:30 AM to 6:59 AM (229, 20.9%) for females.
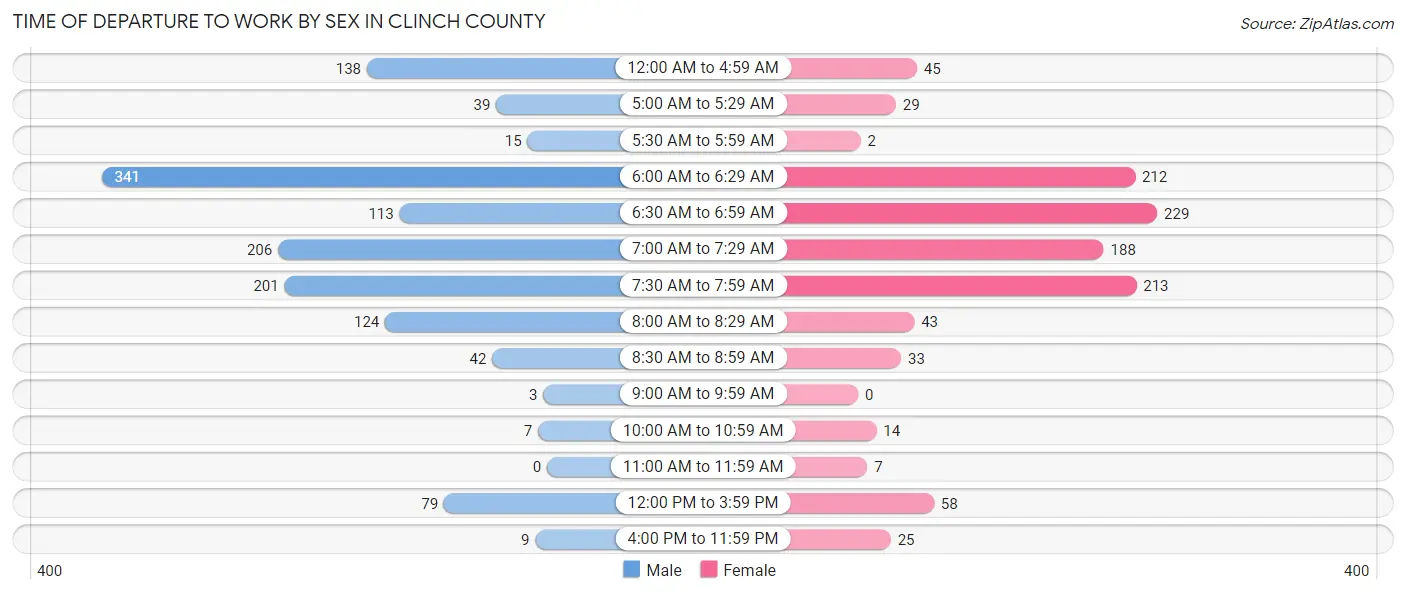
| Time of Departure | Male | Female |
| 12:00 AM to 4:59 AM | 138 (10.5%) | 45 (4.1%) |
| 5:00 AM to 5:29 AM | 39 (3.0%) | 29 (2.6%) |
| 5:30 AM to 5:59 AM | 15 (1.1%) | 2 (0.2%) |
| 6:00 AM to 6:29 AM | 341 (25.9%) | 212 (19.3%) |
| 6:30 AM to 6:59 AM | 113 (8.6%) | 229 (20.9%) |
| 7:00 AM to 7:29 AM | 206 (15.6%) | 188 (17.1%) |
| 7:30 AM to 7:59 AM | 201 (15.3%) | 213 (19.4%) |
| 8:00 AM to 8:29 AM | 124 (9.4%) | 43 (3.9%) |
| 8:30 AM to 8:59 AM | 42 (3.2%) | 33 (3.0%) |
| 9:00 AM to 9:59 AM | 3 (0.2%) | 0 (0.0%) |
| 10:00 AM to 10:59 AM | 7 (0.5%) | 14 (1.3%) |
| 11:00 AM to 11:59 AM | 0 (0.0%) | 7 (0.6%) |
| 12:00 PM to 3:59 PM | 79 (6.0%) | 58 (5.3%) |
| 4:00 PM to 11:59 PM | 9 (0.7%) | 25 (2.3%) |
| Total | 1,317 (100.0%) | 1,098 (100.0%) |
Housing Occupancy in Clinch County
Occupancy by Ownership in Clinch County
Of the total 2,385 dwellings in Clinch County, owner-occupied units account for 1,735 (72.8%), while renter-occupied units make up 650 (27.3%).
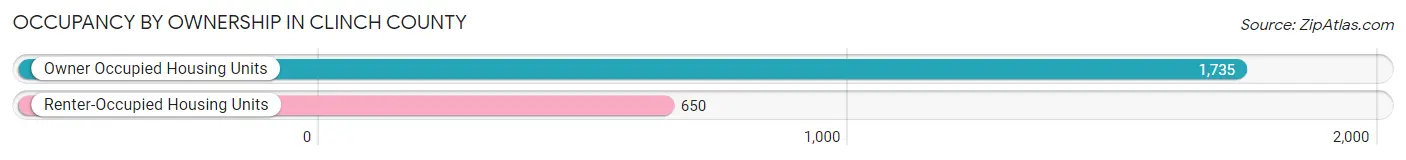
| Occupancy | # Housing Units | % Housing Units |
| Owner Occupied Housing Units | 1,735 | 72.8% |
| Renter-Occupied Housing Units | 650 | 27.3% |
| Total Occupied Housing Units | 2,385 | 100.0% |
Occupancy by Household Size in Clinch County
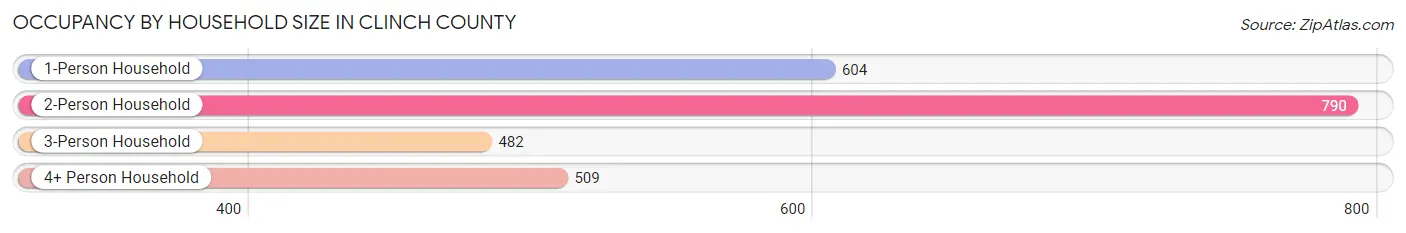
| Household Size | # Housing Units | % Housing Units |
| 1-Person Household | 604 | 25.3% |
| 2-Person Household | 790 | 33.1% |
| 3-Person Household | 482 | 20.2% |
| 4+ Person Household | 509 | 21.3% |
| Total Housing Units | 2,385 | 100.0% |
Occupancy by Ownership by Household Size in Clinch County
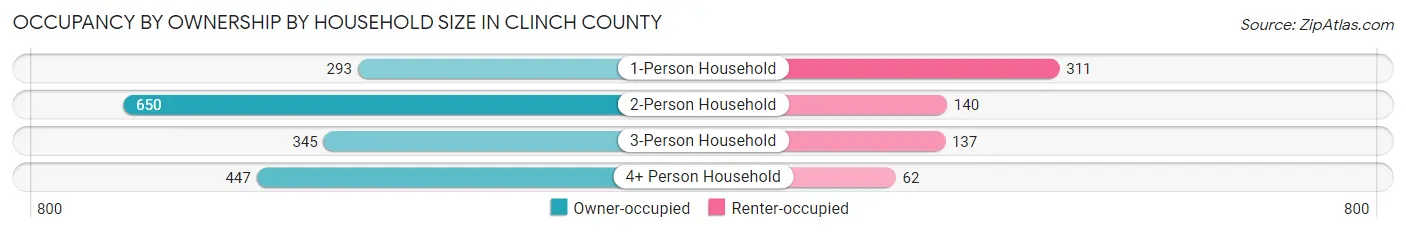
| Household Size | Owner-occupied | Renter-occupied |
| 1-Person Household | 293 (48.5%) | 311 (51.5%) |
| 2-Person Household | 650 (82.3%) | 140 (17.7%) |
| 3-Person Household | 345 (71.6%) | 137 (28.4%) |
| 4+ Person Household | 447 (87.8%) | 62 (12.2%) |
| Total Housing Units | 1,735 (72.8%) | 650 (27.3%) |
Occupancy by Educational Attainment in Clinch County
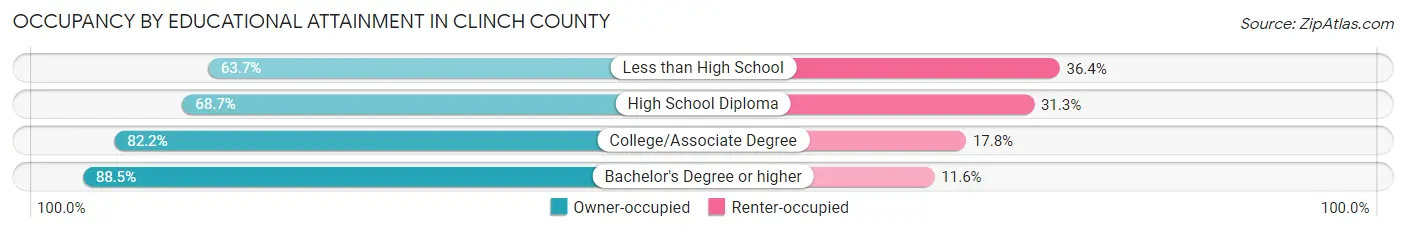
| Household Size | Owner-occupied | Renter-occupied |
| Less than High School | 338 (63.6%) | 193 (36.3%) |
| High School Diploma | 727 (68.7%) | 331 (31.3%) |
| College/Associate Degree | 448 (82.2%) | 97 (17.8%) |
| Bachelor's Degree or higher | 222 (88.4%) | 29 (11.6%) |
Occupancy by Age of Householder in Clinch County
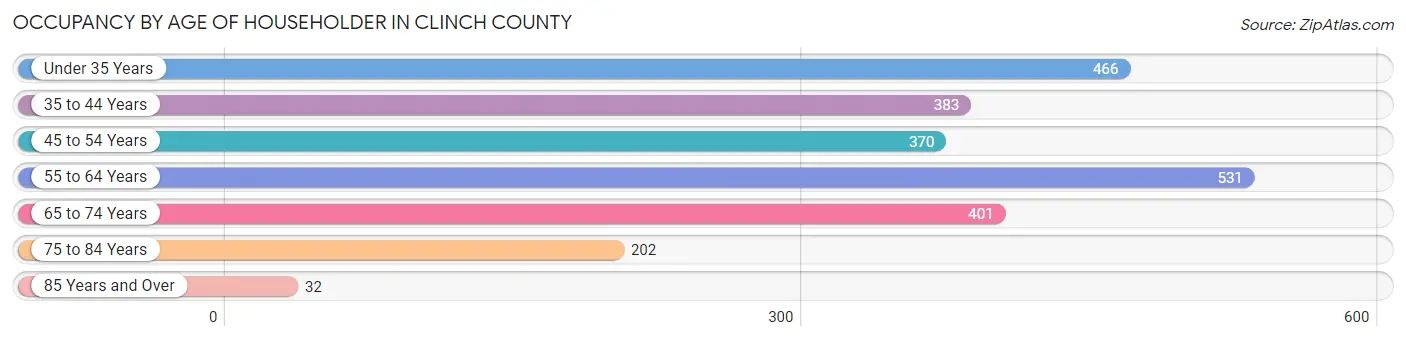
| Age Bracket | # Households | % Households |
| Under 35 Years | 466 | 19.5% |
| 35 to 44 Years | 383 | 16.1% |
| 45 to 54 Years | 370 | 15.5% |
| 55 to 64 Years | 531 | 22.3% |
| 65 to 74 Years | 401 | 16.8% |
| 75 to 84 Years | 202 | 8.5% |
| 85 Years and Over | 32 | 1.3% |
| Total | 2,385 | 100.0% |
Housing Finances in Clinch County
Median Income by Occupancy in Clinch County
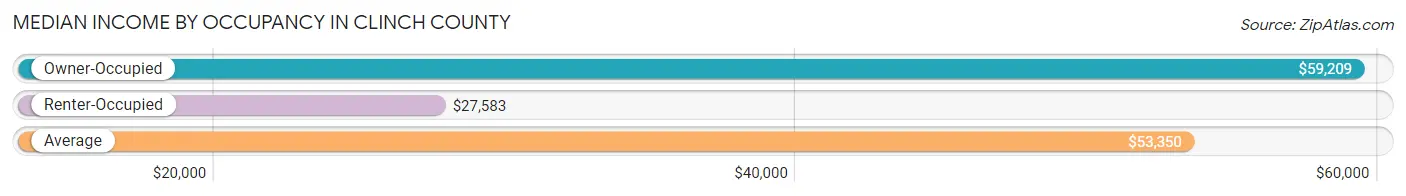
| Occupancy Type | # Households | Median Income |
| Owner-Occupied | 1,735 (72.8%) | $59,209 |
| Renter-Occupied | 650 (27.3%) | $27,583 |
| Average | 2,385 (100.0%) | $53,350 |
Occupancy by Householder Income Bracket in Clinch County
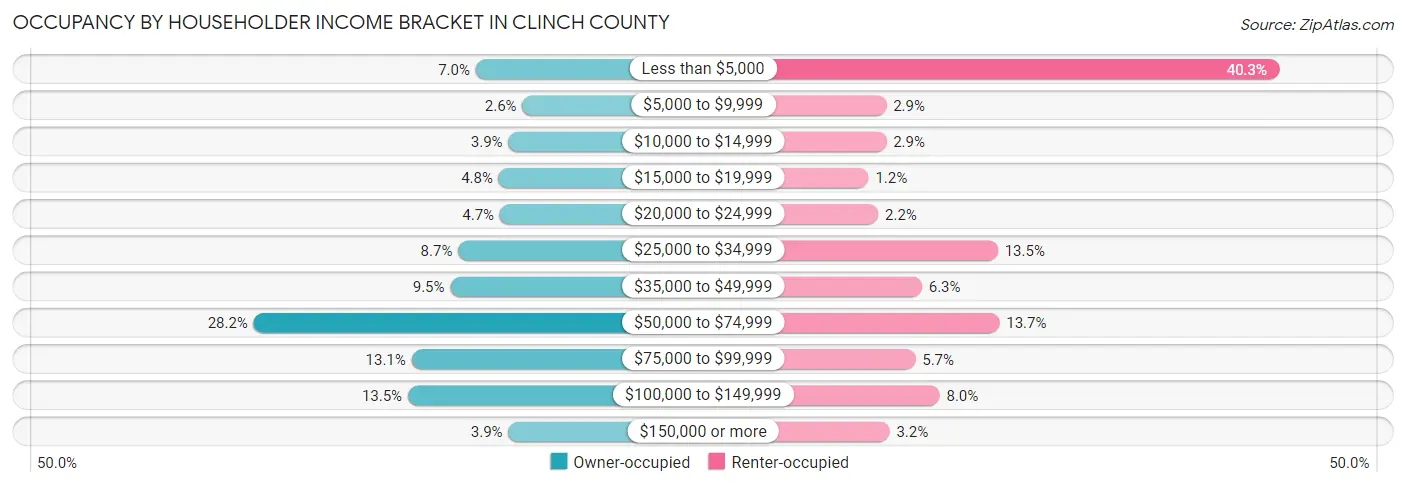
| Income Bracket | Owner-occupied | Renter-occupied |
| Less than $5,000 | 122 (7.0%) | 262 (40.3%) |
| $5,000 to $9,999 | 45 (2.6%) | 19 (2.9%) |
| $10,000 to $14,999 | 68 (3.9%) | 19 (2.9%) |
| $15,000 to $19,999 | 84 (4.8%) | 8 (1.2%) |
| $20,000 to $24,999 | 82 (4.7%) | 14 (2.1%) |
| $25,000 to $34,999 | 151 (8.7%) | 88 (13.5%) |
| $35,000 to $49,999 | 164 (9.5%) | 41 (6.3%) |
| $50,000 to $74,999 | 489 (28.2%) | 89 (13.7%) |
| $75,000 to $99,999 | 228 (13.1%) | 37 (5.7%) |
| $100,000 to $149,999 | 234 (13.5%) | 52 (8.0%) |
| $150,000 or more | 68 (3.9%) | 21 (3.2%) |
| Total | 1,735 (100.0%) | 650 (100.0%) |
Monthly Housing Cost Tiers in Clinch County
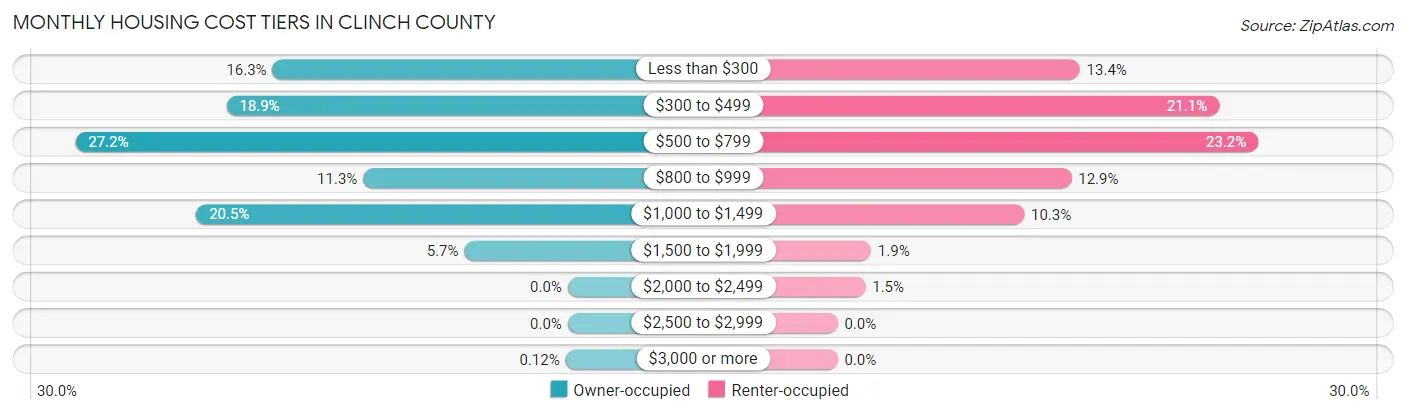
| Monthly Cost | Owner-occupied | Renter-occupied |
| Less than $300 | 283 (16.3%) | 87 (13.4%) |
| $300 to $499 | 327 (18.9%) | 137 (21.1%) |
| $500 to $799 | 472 (27.2%) | 151 (23.2%) |
| $800 to $999 | 196 (11.3%) | 84 (12.9%) |
| $1,000 to $1,499 | 356 (20.5%) | 67 (10.3%) |
| $1,500 to $1,999 | 99 (5.7%) | 12 (1.8%) |
| $2,000 to $2,499 | 0 (0.0%) | 10 (1.5%) |
| $2,500 to $2,999 | 0 (0.0%) | 0 (0.0%) |
| $3,000 or more | 2 (0.1%) | 0 (0.0%) |
| Total | 1,735 (100.0%) | 650 (100.0%) |
Physical Housing Characteristics in Clinch County
Housing Structures in Clinch County
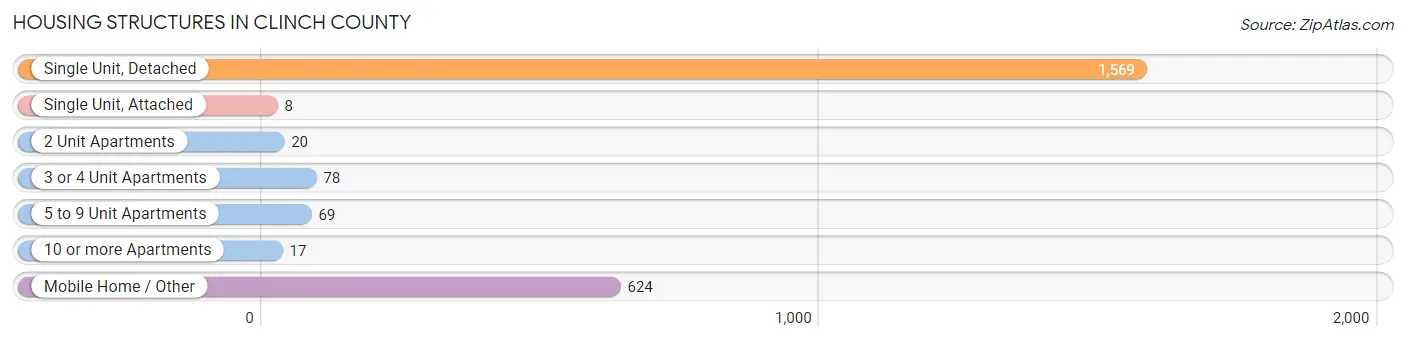
| Structure Type | # Housing Units | % Housing Units |
| Single Unit, Detached | 1,569 | 65.8% |
| Single Unit, Attached | 8 | 0.3% |
| 2 Unit Apartments | 20 | 0.8% |
| 3 or 4 Unit Apartments | 78 | 3.3% |
| 5 to 9 Unit Apartments | 69 | 2.9% |
| 10 or more Apartments | 17 | 0.7% |
| Mobile Home / Other | 624 | 26.2% |
| Total | 2,385 | 100.0% |
Housing Structures by Occupancy in Clinch County
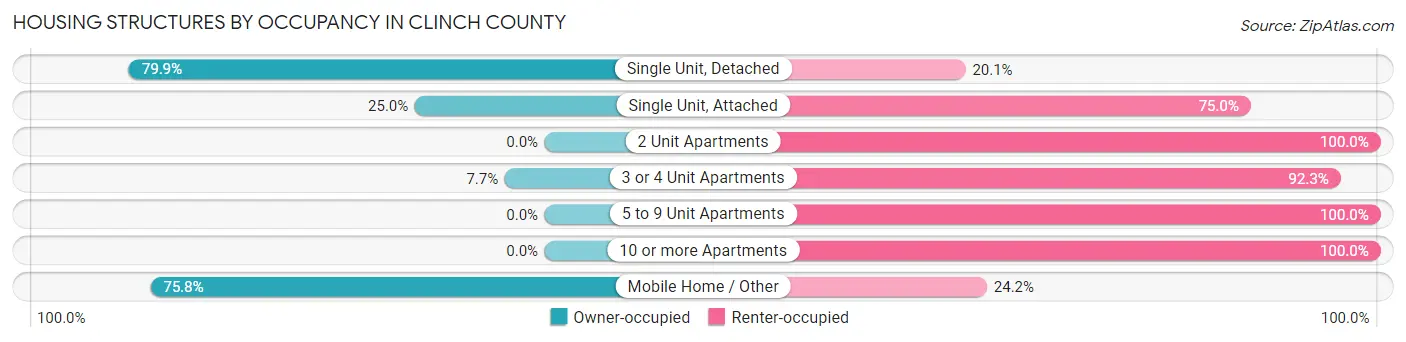
| Structure Type | Owner-occupied | Renter-occupied |
| Single Unit, Detached | 1,254 (79.9%) | 315 (20.1%) |
| Single Unit, Attached | 2 (25.0%) | 6 (75.0%) |
| 2 Unit Apartments | 0 (0.0%) | 20 (100.0%) |
| 3 or 4 Unit Apartments | 6 (7.7%) | 72 (92.3%) |
| 5 to 9 Unit Apartments | 0 (0.0%) | 69 (100.0%) |
| 10 or more Apartments | 0 (0.0%) | 17 (100.0%) |
| Mobile Home / Other | 473 (75.8%) | 151 (24.2%) |
| Total | 1,735 (72.8%) | 650 (27.3%) |
Housing Structures by Number of Rooms in Clinch County
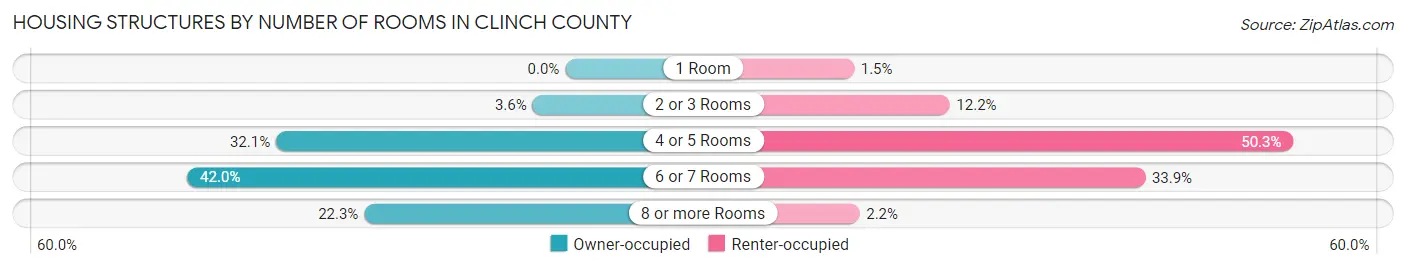
| Number of Rooms | Owner-occupied | Renter-occupied |
| 1 Room | 0 (0.0%) | 10 (1.5%) |
| 2 or 3 Rooms | 63 (3.6%) | 79 (12.1%) |
| 4 or 5 Rooms | 557 (32.1%) | 327 (50.3%) |
| 6 or 7 Rooms | 728 (42.0%) | 220 (33.9%) |
| 8 or more Rooms | 387 (22.3%) | 14 (2.1%) |
| Total | 1,735 (100.0%) | 650 (100.0%) |
Housing Structure by Heating Type in Clinch County
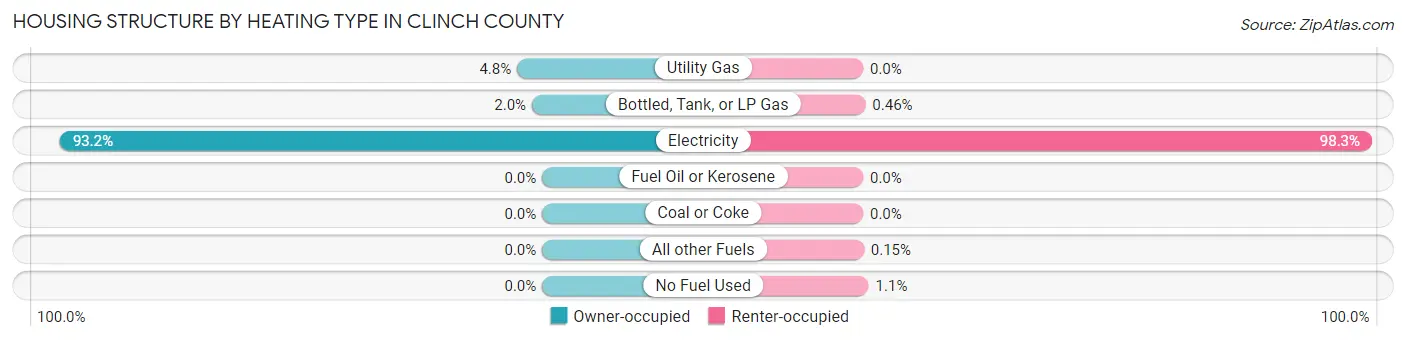
| Heating Type | Owner-occupied | Renter-occupied |
| Utility Gas | 84 (4.8%) | 0 (0.0%) |
| Bottled, Tank, or LP Gas | 34 (2.0%) | 3 (0.5%) |
| Electricity | 1,617 (93.2%) | 639 (98.3%) |
| Fuel Oil or Kerosene | 0 (0.0%) | 0 (0.0%) |
| Coal or Coke | 0 (0.0%) | 0 (0.0%) |
| All other Fuels | 0 (0.0%) | 1 (0.2%) |
| No Fuel Used | 0 (0.0%) | 7 (1.1%) |
| Total | 1,735 (100.0%) | 650 (100.0%) |
Household Vehicle Usage in Clinch County
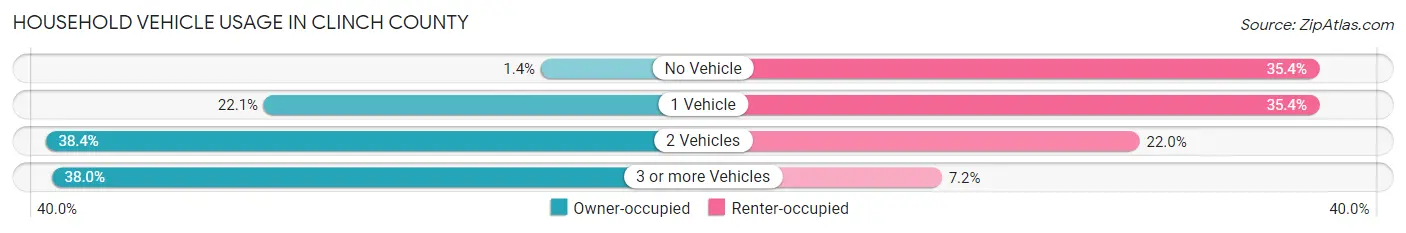
| Vehicles per Household | Owner-occupied | Renter-occupied |
| No Vehicle | 25 (1.4%) | 230 (35.4%) |
| 1 Vehicle | 384 (22.1%) | 230 (35.4%) |
| 2 Vehicles | 667 (38.4%) | 143 (22.0%) |
| 3 or more Vehicles | 659 (38.0%) | 47 (7.2%) |
| Total | 1,735 (100.0%) | 650 (100.0%) |
Real Estate & Mortgages in Clinch County
Real Estate and Mortgage Overview in Clinch County
| Characteristic | Without Mortgage | With Mortgage |
| Housing Units | 907 | 828 |
| Median Property Value | $57,400 | $97,700 |
| Median Household Income | $53,648 | $8 |
| Monthly Housing Costs | $363 | $2 |
| Real Estate Taxes | $1,043 | $55 |
Property Value by Mortgage Status in Clinch County
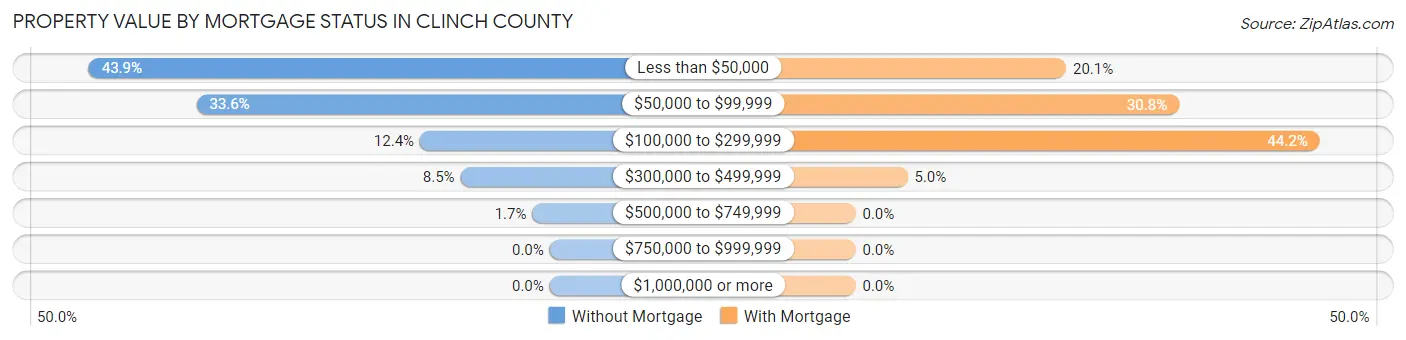
| Property Value | Without Mortgage | With Mortgage |
| Less than $50,000 | 398 (43.9%) | 166 (20.1%) |
| $50,000 to $99,999 | 305 (33.6%) | 255 (30.8%) |
| $100,000 to $299,999 | 112 (12.3%) | 366 (44.2%) |
| $300,000 to $499,999 | 77 (8.5%) | 41 (5.0%) |
| $500,000 to $749,999 | 15 (1.7%) | 0 (0.0%) |
| $750,000 to $999,999 | 0 (0.0%) | 0 (0.0%) |
| $1,000,000 or more | 0 (0.0%) | 0 (0.0%) |
| Total | 907 (100.0%) | 828 (100.0%) |
Household Income by Mortgage Status in Clinch County
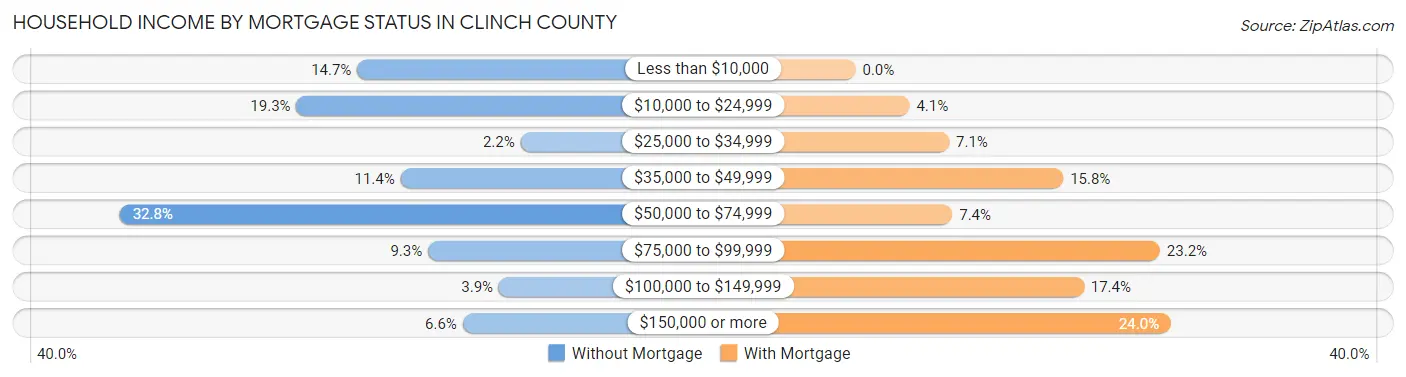
| Household Income | Without Mortgage | With Mortgage |
| Less than $10,000 | 133 (14.7%) | 0 (0.0%) |
| $10,000 to $24,999 | 175 (19.3%) | 34 (4.1%) |
| $25,000 to $34,999 | 20 (2.2%) | 59 (7.1%) |
| $35,000 to $49,999 | 103 (11.4%) | 131 (15.8%) |
| $50,000 to $74,999 | 297 (32.8%) | 61 (7.4%) |
| $75,000 to $99,999 | 84 (9.3%) | 192 (23.2%) |
| $100,000 to $149,999 | 35 (3.9%) | 144 (17.4%) |
| $150,000 or more | 60 (6.6%) | 199 (24.0%) |
| Total | 907 (100.0%) | 828 (100.0%) |
Property Value to Household Income Ratio in Clinch County
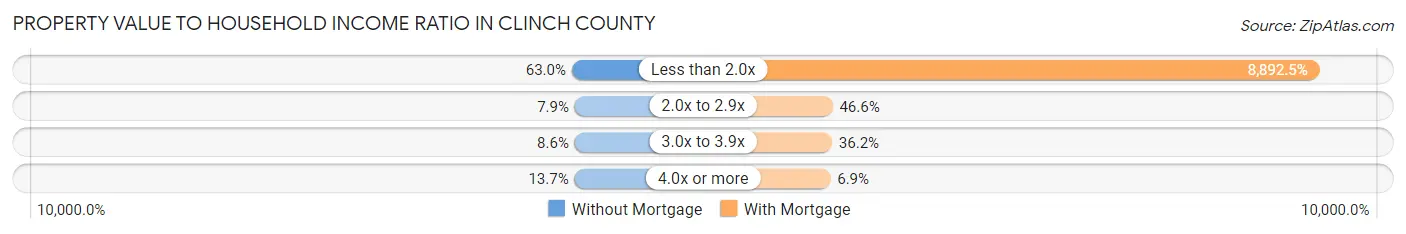
| Value-to-Income Ratio | Without Mortgage | With Mortgage |
| Less than 2.0x | 571 (62.9%) | 73,630 (8,892.5%) |
| 2.0x to 2.9x | 72 (7.9%) | 386 (46.6%) |
| 3.0x to 3.9x | 78 (8.6%) | 300 (36.2%) |
| 4.0x or more | 124 (13.7%) | 57 (6.9%) |
| Total | 907 (100.0%) | 828 (100.0%) |
Real Estate Taxes by Mortgage Status in Clinch County
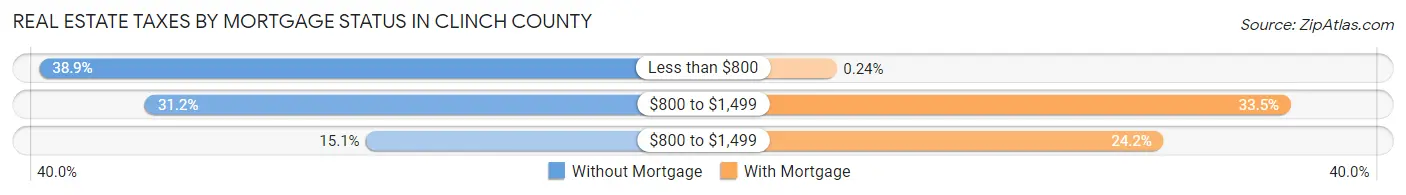
| Property Taxes | Without Mortgage | With Mortgage |
| Less than $800 | 353 (38.9%) | 2 (0.2%) |
| $800 to $1,499 | 283 (31.2%) | 277 (33.5%) |
| $800 to $1,499 | 137 (15.1%) | 200 (24.1%) |
| Total | 907 (100.0%) | 828 (100.0%) |
Health & Disability in Clinch County
Health Insurance Coverage by Age in Clinch County
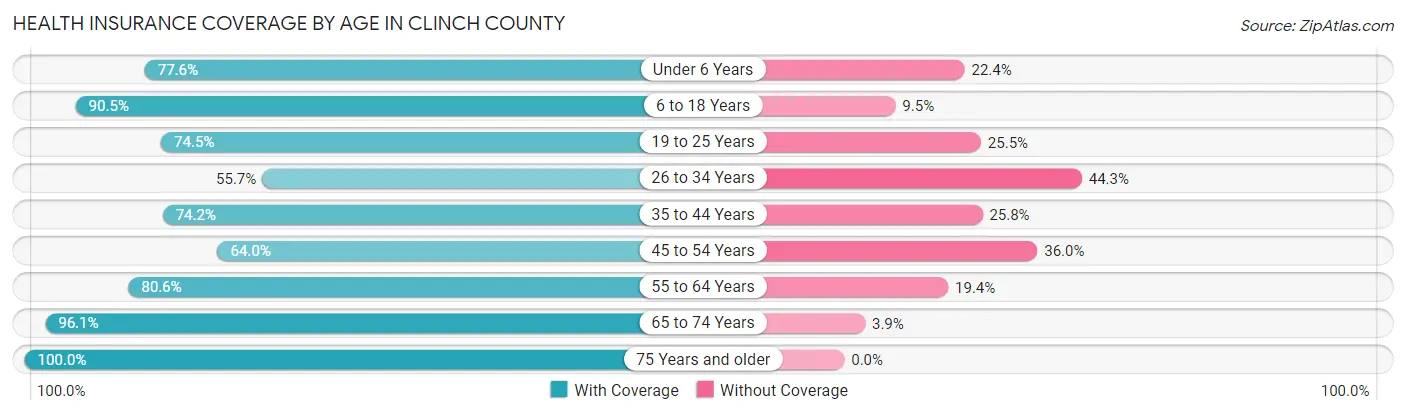
| Age Bracket | With Coverage | Without Coverage |
| Under 6 Years | 391 (77.6%) | 113 (22.4%) |
| 6 to 18 Years | 1,224 (90.5%) | 129 (9.5%) |
| 19 to 25 Years | 319 (74.5%) | 109 (25.5%) |
| 26 to 34 Years | 449 (55.7%) | 357 (44.3%) |
| 35 to 44 Years | 781 (74.2%) | 271 (25.8%) |
| 45 to 54 Years | 402 (64.0%) | 226 (36.0%) |
| 55 to 64 Years | 708 (80.6%) | 170 (19.4%) |
| 65 to 74 Years | 571 (96.1%) | 23 (3.9%) |
| 75 Years and older | 378 (100.0%) | 0 (0.0%) |
| Total | 5,223 (78.9%) | 1,398 (21.1%) |
Health Insurance Coverage by Citizenship Status in Clinch County
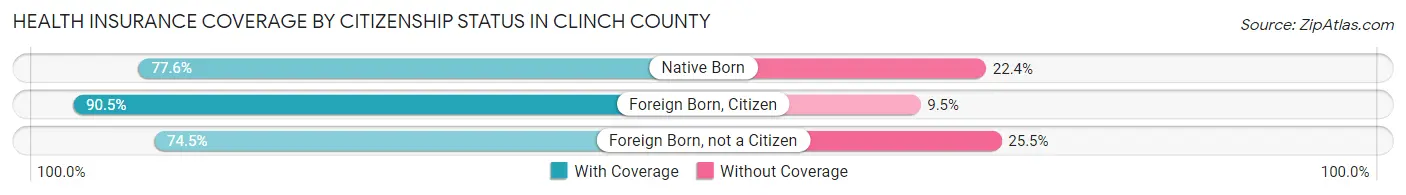
| Citizenship Status | With Coverage | Without Coverage |
| Native Born | 391 (77.6%) | 113 (22.4%) |
| Foreign Born, Citizen | 1,224 (90.5%) | 129 (9.5%) |
| Foreign Born, not a Citizen | 319 (74.5%) | 109 (25.5%) |
Health Insurance Coverage by Household Income in Clinch County
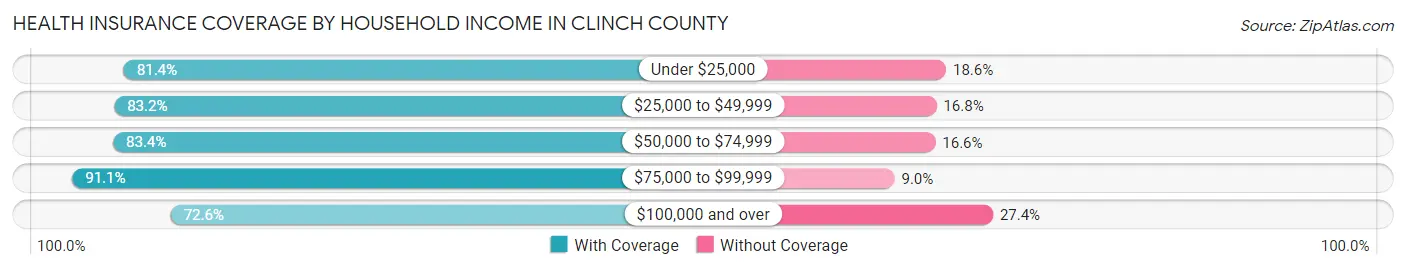
| Household Income | With Coverage | Without Coverage |
| Under $25,000 | 1,335 (81.4%) | 305 (18.6%) |
| $25,000 to $49,999 | 1,134 (83.2%) | 229 (16.8%) |
| $50,000 to $74,999 | 1,161 (83.4%) | 231 (16.6%) |
| $75,000 to $99,999 | 600 (91.0%) | 59 (8.9%) |
| $100,000 and over | 830 (72.6%) | 313 (27.4%) |
Public vs Private Health Insurance Coverage by Age in Clinch County
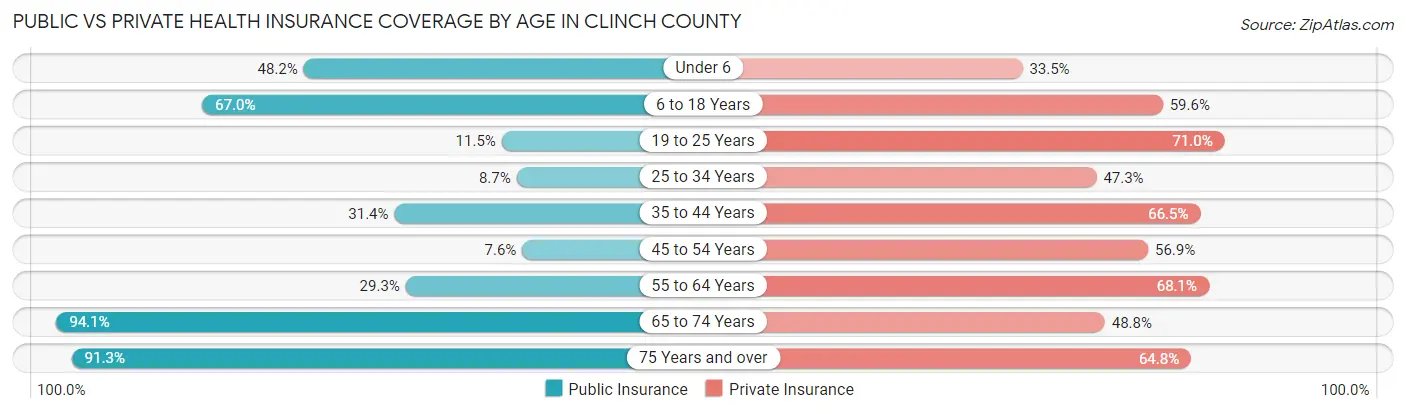
| Age Bracket | Public Insurance | Private Insurance |
| Under 6 | 243 (48.2%) | 169 (33.5%) |
| 6 to 18 Years | 907 (67.0%) | 806 (59.6%) |
| 19 to 25 Years | 49 (11.5%) | 304 (71.0%) |
| 25 to 34 Years | 70 (8.7%) | 381 (47.3%) |
| 35 to 44 Years | 330 (31.4%) | 700 (66.5%) |
| 45 to 54 Years | 48 (7.6%) | 357 (56.9%) |
| 55 to 64 Years | 257 (29.3%) | 598 (68.1%) |
| 65 to 74 Years | 559 (94.1%) | 290 (48.8%) |
| 75 Years and over | 345 (91.3%) | 245 (64.8%) |
| Total | 2,808 (42.4%) | 3,850 (58.2%) |
Disability Status by Sex by Age in Clinch County
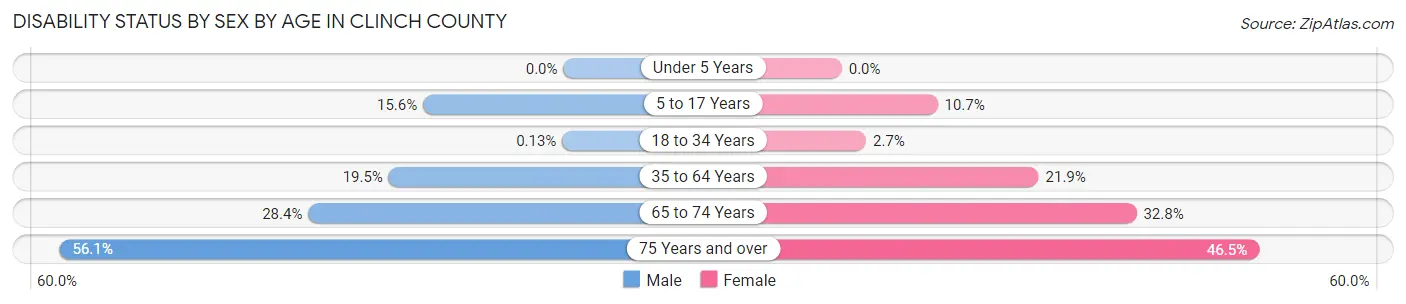
| Age Bracket | Male | Female |
| Under 5 Years | 0 (0.0%) | 0 (0.0%) |
| 5 to 17 Years | 106 (15.6%) | 61 (10.7%) |
| 18 to 34 Years | 1 (0.1%) | 18 (2.7%) |
| 35 to 64 Years | 234 (19.5%) | 297 (21.9%) |
| 65 to 74 Years | 77 (28.4%) | 106 (32.8%) |
| 75 Years and over | 101 (56.1%) | 92 (46.5%) |
Disability Class by Sex by Age in Clinch County
Disability Class: Hearing Difficulty
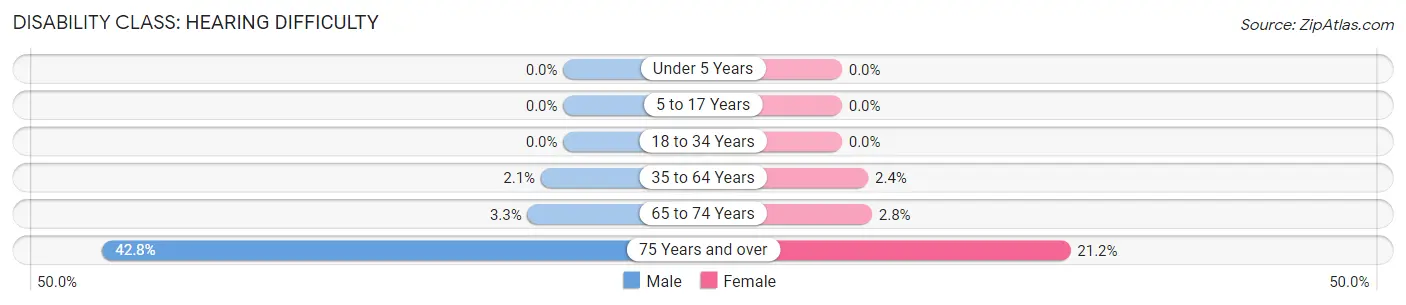
| Age Bracket | Male | Female |
| Under 5 Years | 0 (0.0%) | 0 (0.0%) |
| 5 to 17 Years | 0 (0.0%) | 0 (0.0%) |
| 18 to 34 Years | 0 (0.0%) | 0 (0.0%) |
| 35 to 64 Years | 25 (2.1%) | 33 (2.4%) |
| 65 to 74 Years | 9 (3.3%) | 9 (2.8%) |
| 75 Years and over | 77 (42.8%) | 42 (21.2%) |
Disability Class: Vision Difficulty
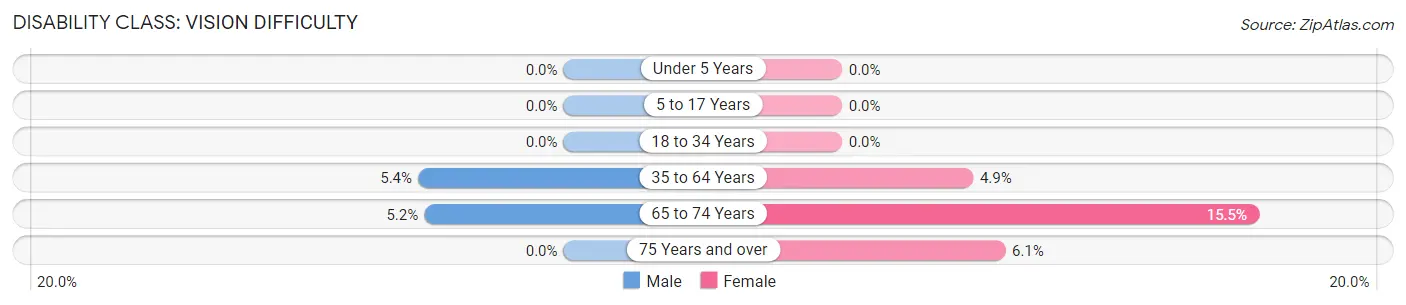
| Age Bracket | Male | Female |
| Under 5 Years | 0 (0.0%) | 0 (0.0%) |
| 5 to 17 Years | 0 (0.0%) | 0 (0.0%) |
| 18 to 34 Years | 0 (0.0%) | 0 (0.0%) |
| 35 to 64 Years | 65 (5.4%) | 66 (4.9%) |
| 65 to 74 Years | 14 (5.2%) | 50 (15.5%) |
| 75 Years and over | 0 (0.0%) | 12 (6.1%) |
Disability Class: Cognitive Difficulty
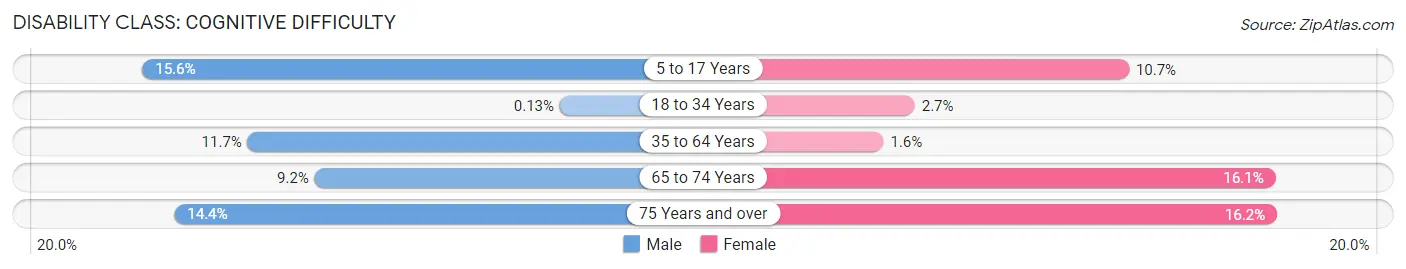
| Age Bracket | Male | Female |
| 5 to 17 Years | 106 (15.6%) | 61 (10.7%) |
| 18 to 34 Years | 1 (0.1%) | 18 (2.7%) |
| 35 to 64 Years | 141 (11.7%) | 21 (1.5%) |
| 65 to 74 Years | 25 (9.2%) | 52 (16.1%) |
| 75 Years and over | 26 (14.4%) | 32 (16.2%) |
Disability Class: Ambulatory Difficulty
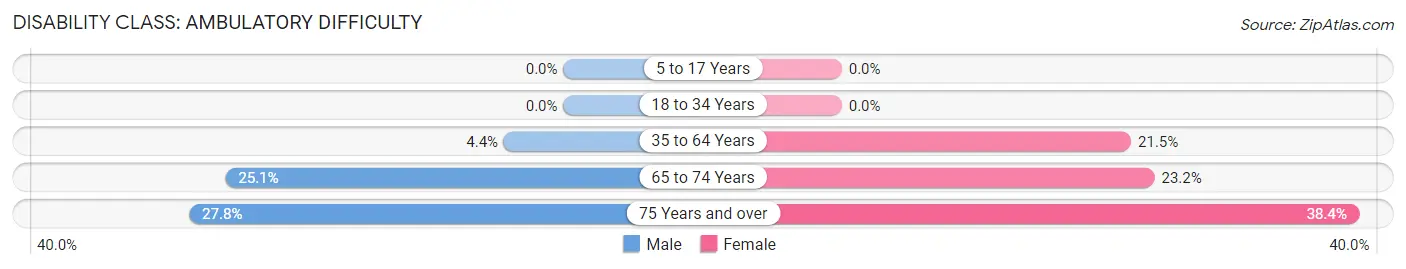
| Age Bracket | Male | Female |
| 5 to 17 Years | 0 (0.0%) | 0 (0.0%) |
| 18 to 34 Years | 0 (0.0%) | 0 (0.0%) |
| 35 to 64 Years | 53 (4.4%) | 291 (21.5%) |
| 65 to 74 Years | 68 (25.1%) | 75 (23.2%) |
| 75 Years and over | 50 (27.8%) | 76 (38.4%) |
Disability Class: Self-Care Difficulty
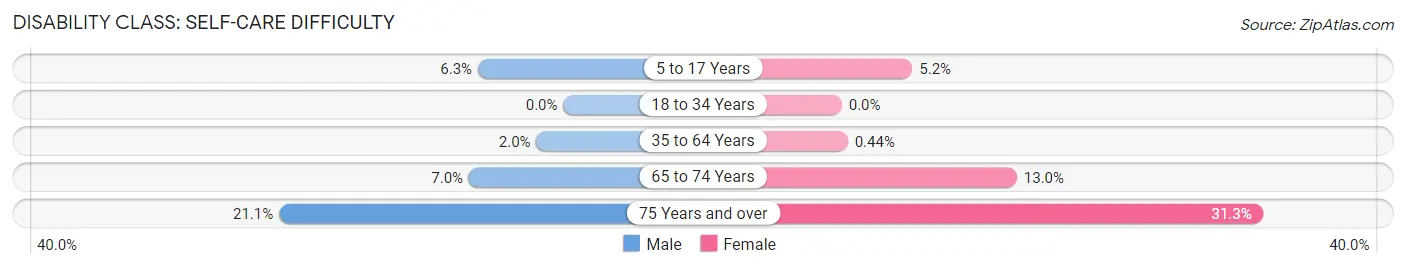
| Age Bracket | Male | Female |
| 5 to 17 Years | 43 (6.3%) | 30 (5.2%) |
| 18 to 34 Years | 0 (0.0%) | 0 (0.0%) |
| 35 to 64 Years | 24 (2.0%) | 6 (0.4%) |
| 65 to 74 Years | 19 (7.0%) | 42 (13.0%) |
| 75 Years and over | 38 (21.1%) | 62 (31.3%) |
Technology Access in Clinch County
Computing Device Access in Clinch County
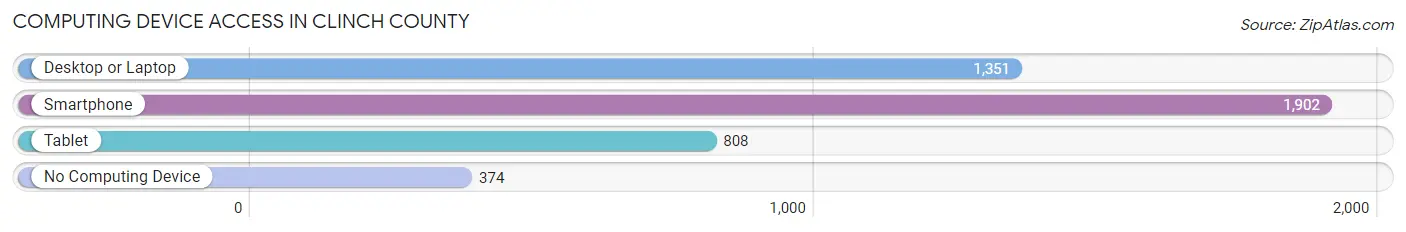
| Device Type | # Households | % Households |
| Desktop or Laptop | 1,351 | 56.7% |
| Smartphone | 1,902 | 79.7% |
| Tablet | 808 | 33.9% |
| No Computing Device | 374 | 15.7% |
| Total | 2,385 | 100.0% |
Internet Access in Clinch County
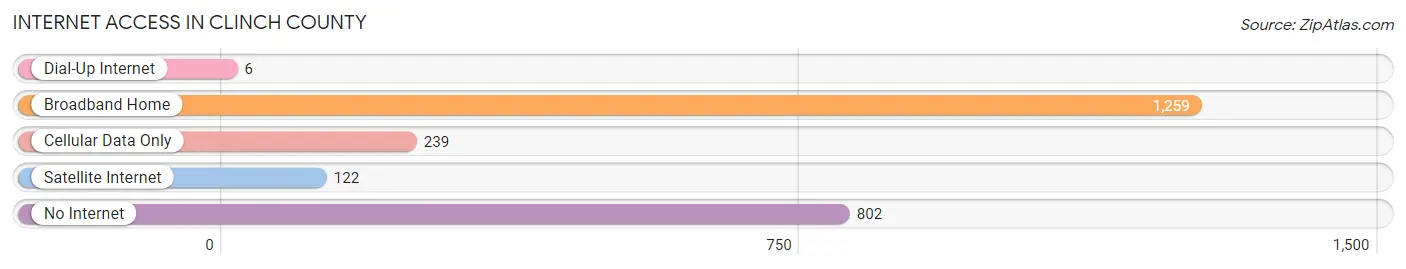
| Internet Type | # Households | % Households |
| Dial-Up Internet | 6 | 0.3% |
| Broadband Home | 1,259 | 52.8% |
| Cellular Data Only | 239 | 10.0% |
| Satellite Internet | 122 | 5.1% |
| No Internet | 802 | 33.6% |
| Total | 2,385 | 100.0% |
Clinch County Summary
Clinch County is a county located in the southeastern part of the U.S. state of Georgia. As of the 2010 census, the population was 6,798. The county seat is Homerville. The county was created on February 20, 1850 and named for General Duncan Lamont Clinch, a hero of the War of 1812.
Geography
Clinch County is located in the southeastern corner of Georgia, with the Suwannee River forming its western border. The county is bordered by Lowndes County to the north, Lanier County to the east, and the state of Florida to the south and west. The county has a total area of 441 square miles, of which 437 square miles is land and 4.2 square miles (1.0%) is water.
The county is located in the Okefenokee Swamp region of Georgia, and is home to the Okefenokee National Wildlife Refuge. The Suwannee River forms the western border of the county, and the Withlacoochee River forms the eastern border.
Demographics
As of the 2010 United States Census, there were 6,798 people, 2,619 households, and 1,845 families residing in the county. The population density was 15.5 inhabitants per square mile (6.0/km2). There were 3,093 housing units at an average density of 7.1 per square mile (2.7/km2). The racial makeup of the county was 68.2% white, 28.2% black or African American, 0.5% Asian, 0.3% American Indian, 0.7% from other races, and 2.1% from two or more races. Those of Hispanic or Latino origin made up 2.2% of the population. In terms of ancestry, 15.2% were American, 8.2% were English, and 6.2% were Irish.
Of the 2,619 households, 33.2% had children under the age of 18 living with them, 48.2% were married couples living together, 17.3% had a female householder with no husband present, 28.7% were non-families, and 24.7% of all households were made up of individuals. The average household size was 2.58 and the average family size was 3.06. The median age was 39.7 years.
The median income for a household in the county was $30,945 and the median income for a family was $37,917. Males had a median income of $30,945 versus $22,813 for females. The per capita income for the county was $15,845. About 17.2% of families and 20.7% of the population were below the poverty line, including 28.2% of those under age 18 and 16.2% of those age 65 or over.
Economy
The economy of Clinch County is largely based on agriculture and timber. The county is home to several large timber companies, including Rayonier, Georgia-Pacific, and International Paper. The county is also home to several large farms, including the Clinch County Farm Bureau, which is the largest farm in the county.
The county is also home to several small businesses, including restaurants, retail stores, and service providers. The county is also home to several manufacturing companies, including a paper mill and a wood products plant.
The county is served by the Homerville-Clinch County Airport, which is located in Homerville. The airport is used for general aviation and is home to several small businesses, including a flight school and a charter service.
Conclusion
Clinch County is a rural county located in the southeastern corner of Georgia. The county is home to the Okefenokee National Wildlife Refuge and is bordered by the Suwannee and Withlacoochee Rivers. The county has a population of 6,798 and is largely agricultural and timber-based. The county is home to several large timber companies, farms, and small businesses. The county is served by the Homerville-Clinch County Airport, which is used for general aviation.
Common Questions
What is Per Capita Income in Clinch County?
Per Capita income in Clinch County is $20,294.
What is the Median Family Income in Clinch County?
Median Family Income in Clinch County is $67,713.
What is the Median Household income in Clinch County?
Median Household Income in Clinch County is $53,350.
What is Income or Wage Gap in Clinch County?
Income or Wage Gap in Clinch County is 9.9%.
Women in Clinch County earn 90.1 cents for every dollar earned by a man.
What is Inequality or Gini Index in Clinch County?
Inequality or Gini Index in Clinch County is 0.46.
What is the Total Population of Clinch County?
Total Population of Clinch County is 6,713.
What is the Total Male Population of Clinch County?
Total Male Population of Clinch County is 3,337.
What is the Total Female Population of Clinch County?
Total Female Population of Clinch County is 3,376.
What is the Ratio of Males per 100 Females in Clinch County?
There are 98.84 Males per 100 Females in Clinch County.
What is the Ratio of Females per 100 Males in Clinch County?
There are 101.17 Females per 100 Males in Clinch County.
What is the Median Population Age in Clinch County?
Median Population Age in Clinch County is 38.4 Years.
What is the Average Family Size in Clinch County
Average Family Size in Clinch County is 3.1 People.
What is the Average Household Size in Clinch County
Average Household Size in Clinch County is 2.6 People.
How Large is the Labor Force in Clinch County?
There are 2,584 People in the Labor Forcein in Clinch County.
What is the Percentage of People in the Labor Force in Clinch County?
48.8% of People are in the Labor Force in Clinch County.
What is the Unemployment Rate in Clinch County?
Unemployment Rate in Clinch County is 2.6%.