Charlton County, GA Map & Demographics
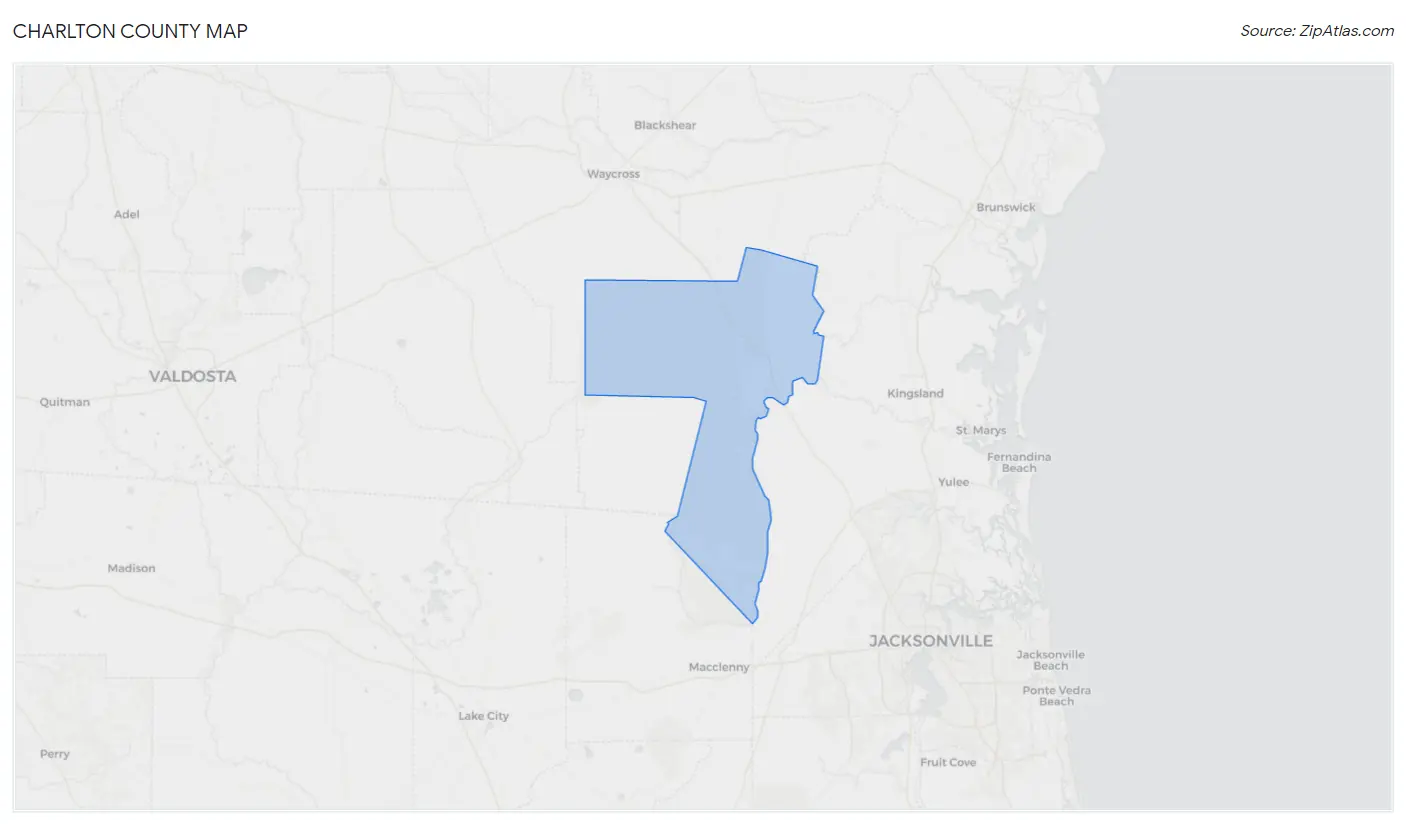
Charlton County Map
Charlton County Overview
$22,742
PER CAPITA INCOME
$55,237
AVG FAMILY INCOME
$45,770
AVG HOUSEHOLD INCOME
8.1%
WAGE / INCOME GAP [ % ]
91.9¢/ $1
WAGE / INCOME GAP [ $ ]
0.45
INEQUALITY / GINI INDEX
12,547
TOTAL POPULATION
7,331
MALE POPULATION
5,216
FEMALE POPULATION
140.55
MALES / 100 FEMALES
71.15
FEMALES / 100 MALES
39.4
MEDIAN AGE
3.6
AVG FAMILY SIZE
2.9
AVG HOUSEHOLD SIZE
5,468
LABOR FORCE [ PEOPLE ]
52.0%
PERCENT IN LABOR FORCE
8.3%
UNEMPLOYMENT RATE
Charlton County Area Codes
Income in Charlton County
Income Overview in Charlton County
Per Capita Income in Charlton County is $22,742, while median incomes of families and households are $55,237 and $45,770 respectively.
| Characteristic | Number | Measure |
| Per Capita Income | 12,547 | $22,742 |
| Median Family Income | 2,642 | $55,237 |
| Mean Family Income | 2,642 | $69,395 |
| Median Household Income | 4,043 | $45,770 |
| Mean Household Income | 4,043 | $60,178 |
| Income Deficit | 2,642 | $0 |
| Wage / Income Gap (%) | 12,547 | 8.14% |
| Wage / Income Gap ($) | 12,547 | 91.86¢ per $1 |
| Gini / Inequality Index | 12,547 | 0.45 |
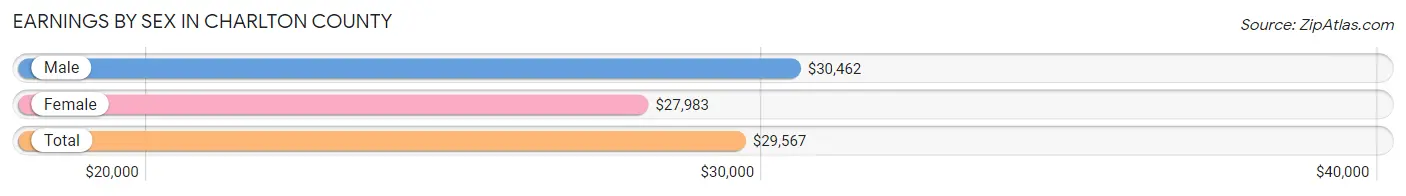
Earnings by Sex in Charlton County
Average Earnings in Charlton County are $29,567, $30,462 for men and $27,983 for women, a difference of 8.1%.
| Sex | Number | Average Earnings |
| Male | 3,827 (67.6%) | $30,462 |
| Female | 1,835 (32.4%) | $27,983 |
| Total | 5,662 (100.0%) | $29,567 |
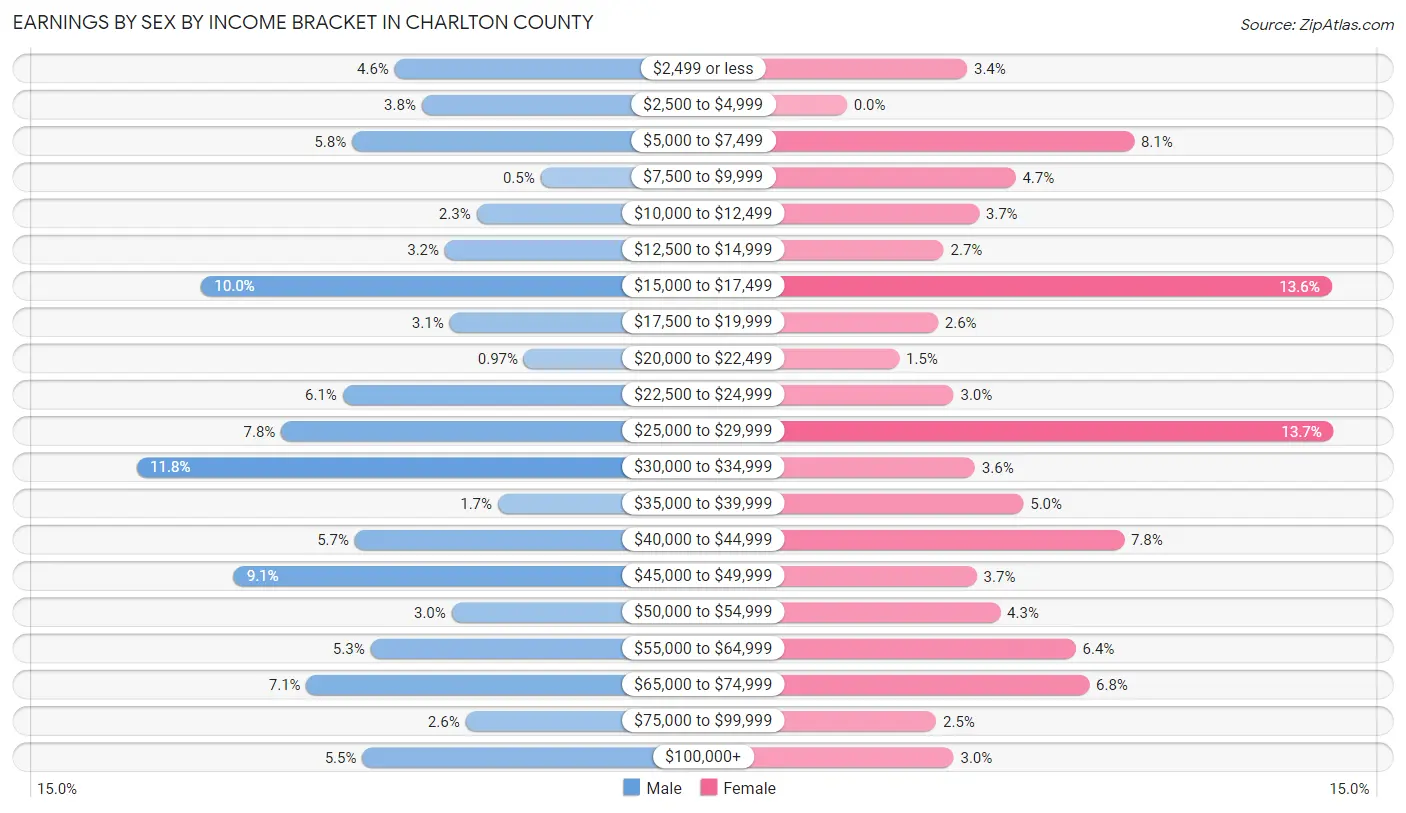
Earnings by Sex by Income Bracket in Charlton County
The most common earnings brackets in Charlton County are $30,000 to $34,999 for men (453 | 11.8%) and $25,000 to $29,999 for women (251 | 13.7%).
| Income | Male | Female |
| $2,499 or less | 176 (4.6%) | 62 (3.4%) |
| $2,500 to $4,999 | 147 (3.8%) | 0 (0.0%) |
| $5,000 to $7,499 | 222 (5.8%) | 148 (8.1%) |
| $7,500 to $9,999 | 19 (0.5%) | 87 (4.7%) |
| $10,000 to $12,499 | 88 (2.3%) | 68 (3.7%) |
| $12,500 to $14,999 | 122 (3.2%) | 50 (2.7%) |
| $15,000 to $17,499 | 384 (10.0%) | 250 (13.6%) |
| $17,500 to $19,999 | 117 (3.1%) | 47 (2.6%) |
| $20,000 to $22,499 | 37 (1.0%) | 27 (1.5%) |
| $22,500 to $24,999 | 232 (6.1%) | 55 (3.0%) |
| $25,000 to $29,999 | 298 (7.8%) | 251 (13.7%) |
| $30,000 to $34,999 | 453 (11.8%) | 66 (3.6%) |
| $35,000 to $39,999 | 65 (1.7%) | 91 (5.0%) |
| $40,000 to $44,999 | 219 (5.7%) | 143 (7.8%) |
| $45,000 to $49,999 | 349 (9.1%) | 67 (3.6%) |
| $50,000 to $54,999 | 115 (3.0%) | 79 (4.3%) |
| $55,000 to $64,999 | 202 (5.3%) | 118 (6.4%) |
| $65,000 to $74,999 | 271 (7.1%) | 125 (6.8%) |
| $75,000 to $99,999 | 100 (2.6%) | 46 (2.5%) |
| $100,000+ | 211 (5.5%) | 55 (3.0%) |
| Total | 3,827 (100.0%) | 1,835 (100.0%) |
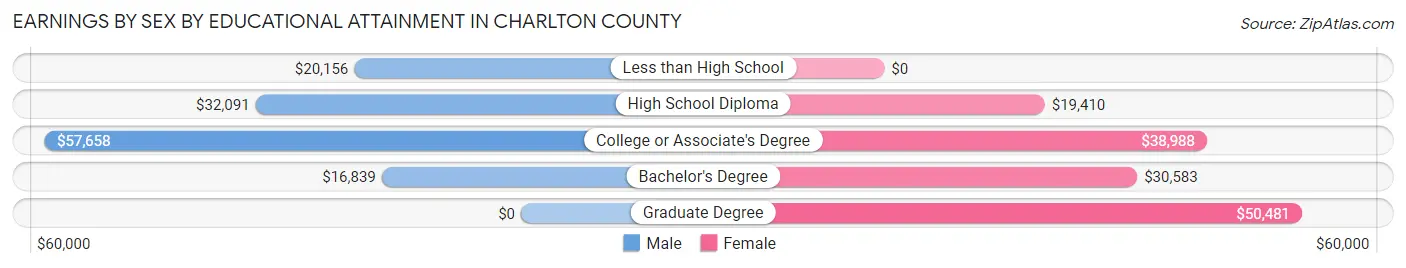
Earnings by Sex by Educational Attainment in Charlton County
Average earnings in Charlton County are $31,527 for men and $28,663 for women, a difference of 9.1%. Men with an educational attainment of college or associate's degree enjoy the highest average annual earnings of $57,658, while those with bachelor's degree education earn the least with $16,839. Women with an educational attainment of graduate degree earn the most with the average annual earnings of $50,481, while those with high school diploma education have the smallest earnings of $19,410.
| Educational Attainment | Male Income | Female Income |
| Less than High School | $20,156 | $0 |
| High School Diploma | $32,091 | $19,410 |
| College or Associate's Degree | $57,658 | $38,988 |
| Bachelor's Degree | $16,839 | $30,583 |
| Graduate Degree | - | - |
| Total | $31,527 | $28,663 |
Family Income in Charlton County
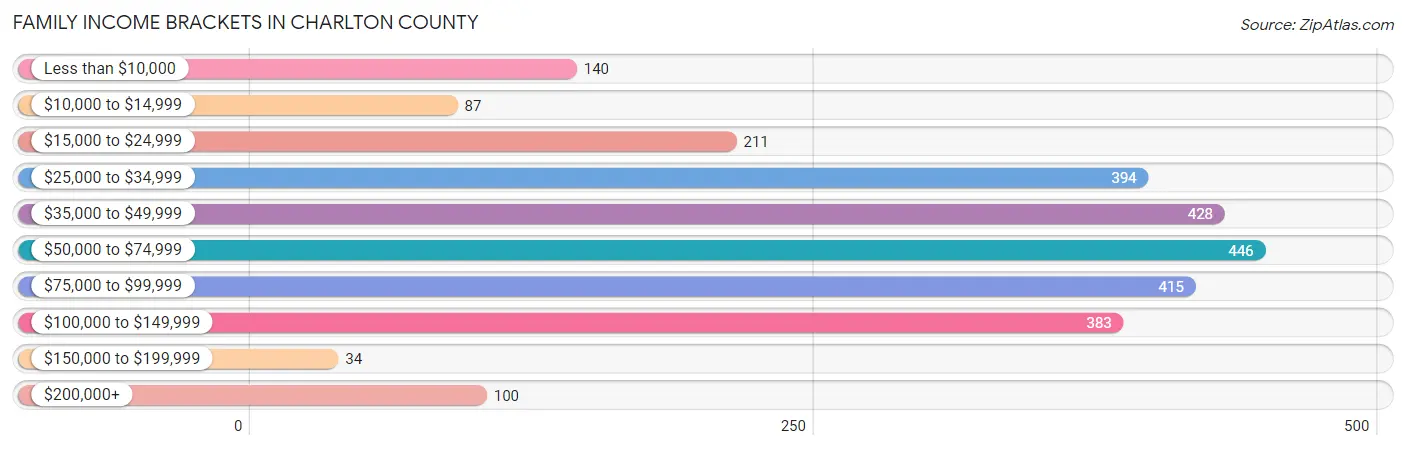
Family Income Brackets in Charlton County
According to the Charlton County family income data, there are 446 families falling into the $50,000 to $74,999 income range, which is the most common income bracket and makes up 16.9% of all families. Conversely, the $150,000 to $199,999 income bracket is the least frequent group with only 34 families (1.3%) belonging to this category.
| Income Bracket | # Families | % Families |
| Less than $10,000 | 140 | 5.3% |
| $10,000 to $14,999 | 87 | 3.3% |
| $15,000 to $24,999 | 211 | 8.0% |
| $25,000 to $34,999 | 394 | 14.9% |
| $35,000 to $49,999 | 428 | 16.2% |
| $50,000 to $74,999 | 446 | 16.9% |
| $75,000 to $99,999 | 415 | 15.7% |
| $100,000 to $149,999 | 383 | 14.5% |
| $150,000 to $199,999 | 34 | 1.3% |
| $200,000+ | 100 | 3.8% |
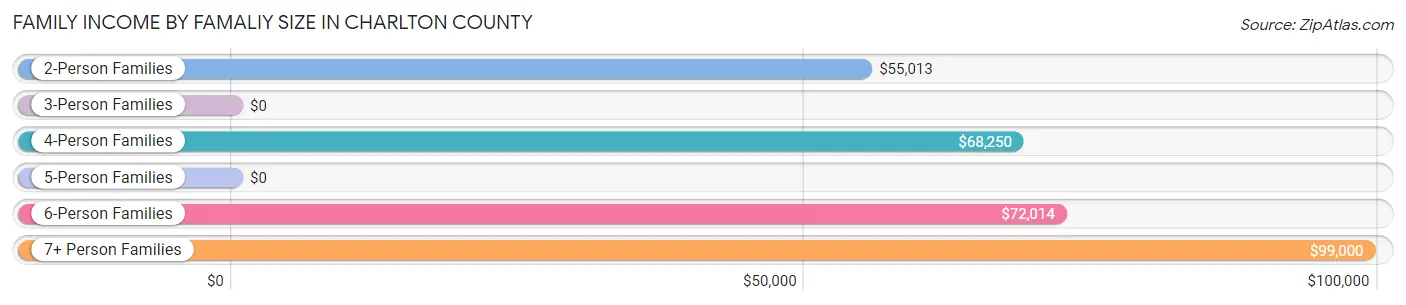
Family Income by Famaliy Size in Charlton County
7+ person families (50 | 1.9%) account for the highest median family income in Charlton County with $99,000 per family, while 2-person families (1,263 | 47.8%) have the highest median income of $27,506 per family member.
| Income Bracket | # Families | Median Income |
| 2-Person Families | 1,263 (47.8%) | $55,013 |
| 3-Person Families | 717 (27.1%) | $0 |
| 4-Person Families | 312 (11.8%) | $68,250 |
| 5-Person Families | 229 (8.7%) | $0 |
| 6-Person Families | 71 (2.7%) | $72,014 |
| 7+ Person Families | 50 (1.9%) | $99,000 |
| Total | 2,642 (100.0%) | $55,237 |
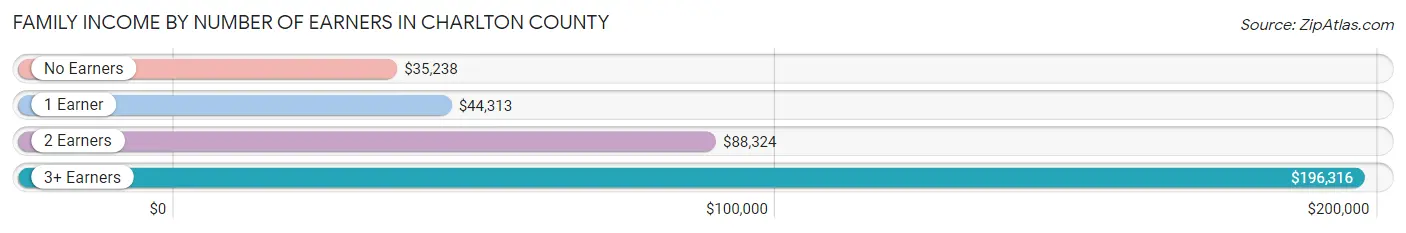
Family Income by Number of Earners in Charlton County
The median family income in Charlton County is $55,237, with families comprising 3+ earners (148) having the highest median family income of $196,316, while families with no earners (522) have the lowest median family income of $35,238, accounting for 5.6% and 19.8% of families, respectively.
| Number of Earners | # Families | Median Income |
| No Earners | 522 (19.8%) | $35,238 |
| 1 Earner | 1,085 (41.1%) | $44,313 |
| 2 Earners | 887 (33.6%) | $88,324 |
| 3+ Earners | 148 (5.6%) | $196,316 |
| Total | 2,642 (100.0%) | $55,237 |
Household Income in Charlton County
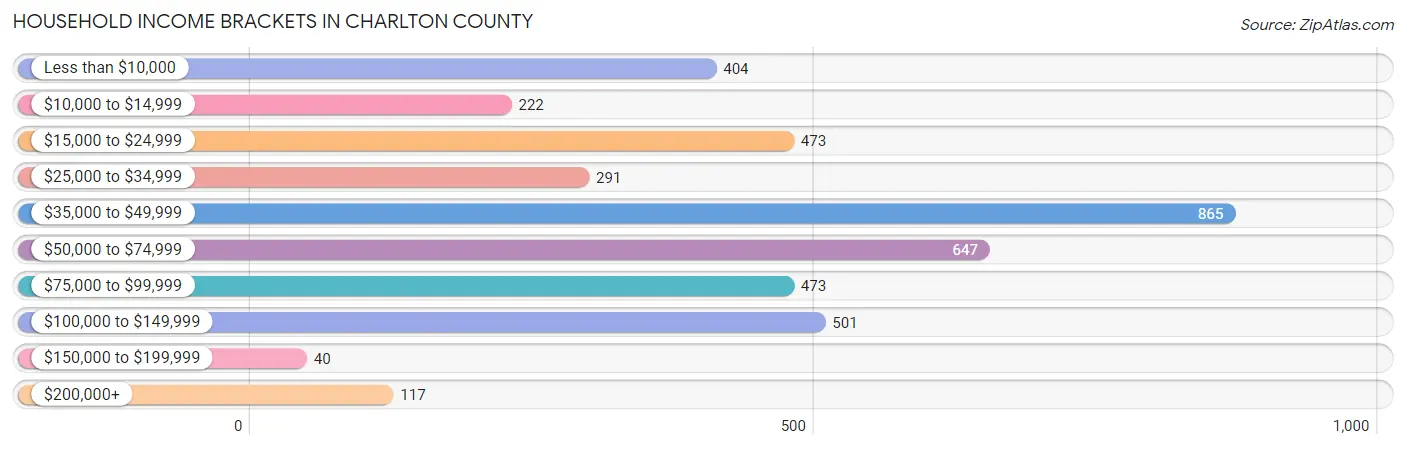
Household Income Brackets in Charlton County
With 865 households falling in the category, the $35,000 to $49,999 income range is the most frequent in Charlton County, accounting for 21.4% of all households. In contrast, only 40 households (1.0%) fall into the $150,000 to $199,999 income bracket, making it the least populous group.
| Income Bracket | # Households | % Households |
| Less than $10,000 | 404 | 10.0% |
| $10,000 to $14,999 | 222 | 5.5% |
| $15,000 to $24,999 | 473 | 11.7% |
| $25,000 to $34,999 | 291 | 7.2% |
| $35,000 to $49,999 | 865 | 21.4% |
| $50,000 to $74,999 | 647 | 16.0% |
| $75,000 to $99,999 | 473 | 11.7% |
| $100,000 to $149,999 | 501 | 12.4% |
| $150,000 to $199,999 | 40 | 1.0% |
| $200,000+ | 117 | 2.9% |
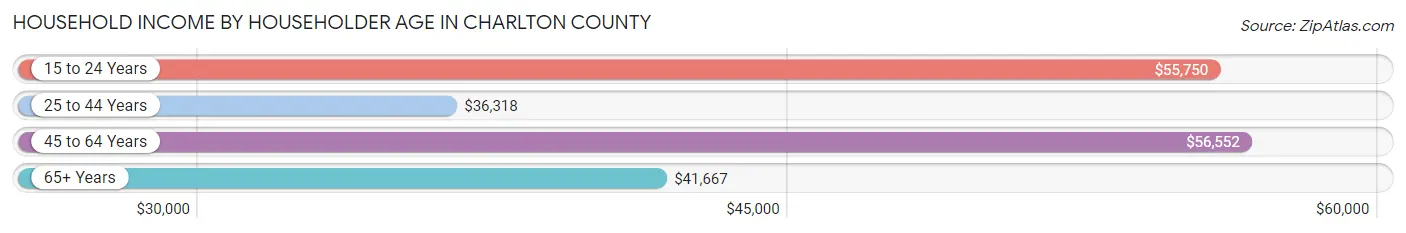
Household Income by Householder Age in Charlton County
The median household income in Charlton County is $45,770, with the highest median household income of $56,552 found in the 45 to 64 years age bracket for the primary householder. A total of 1,374 households (34.0%) fall into this category. Meanwhile, the 25 to 44 years age bracket for the primary householder has the lowest median household income of $36,318, with 1,279 households (31.6%) in this group.
| Income Bracket | # Households | Median Income |
| 15 to 24 Years | 144 (3.6%) | $55,750 |
| 25 to 44 Years | 1,279 (31.6%) | $36,318 |
| 45 to 64 Years | 1,374 (34.0%) | $56,552 |
| 65+ Years | 1,246 (30.8%) | $41,667 |
| Total | 4,043 (100.0%) | $45,770 |
Poverty in Charlton County
Income Below Poverty by Sex and Age in Charlton County
With 14.1% poverty level for males and 28.5% for females among the residents of Charlton County, under 5 year old males and 5 year old females are the most vulnerable to poverty, with 56 males (42.7%) and 53 females (100.0%) in their respective age groups living below the poverty level.
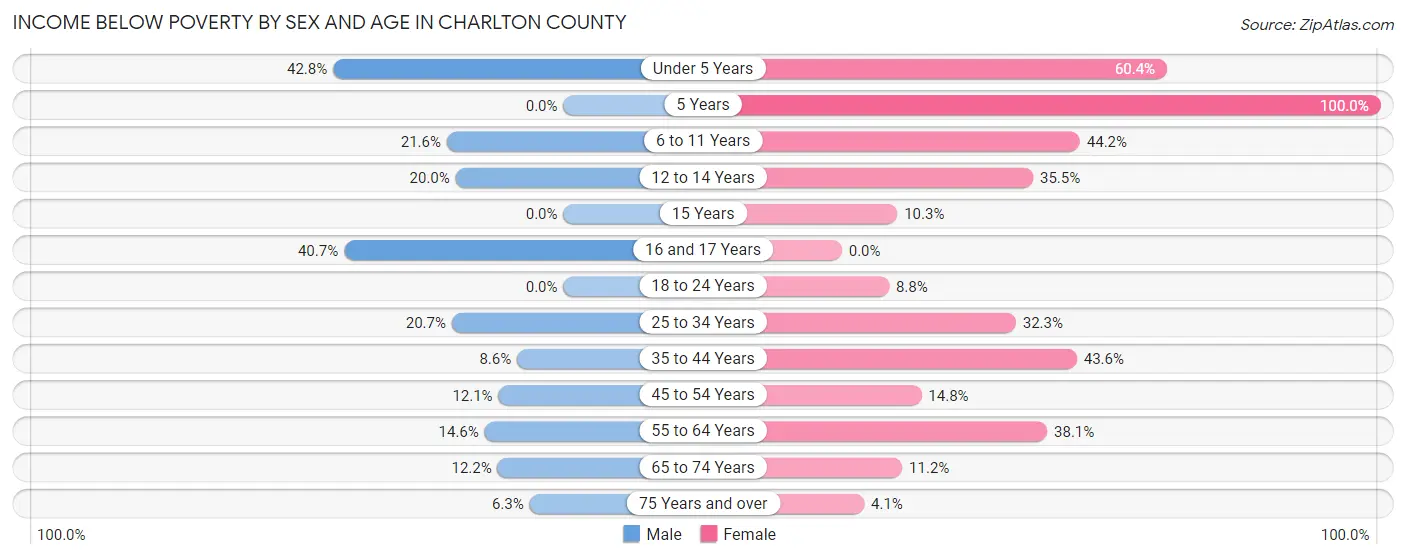
| Age Bracket | Male | Female |
| Under 5 Years | 56 (42.7%) | 242 (60.4%) |
| 5 Years | 0 (0.0%) | 53 (100.0%) |
| 6 to 11 Years | 79 (21.6%) | 175 (44.2%) |
| 12 to 14 Years | 40 (20.0%) | 82 (35.5%) |
| 15 Years | 0 (0.0%) | 7 (10.3%) |
| 16 and 17 Years | 68 (40.7%) | 0 (0.0%) |
| 18 to 24 Years | 0 (0.0%) | 51 (8.8%) |
| 25 to 34 Years | 281 (20.7%) | 146 (32.3%) |
| 35 to 44 Years | 74 (8.6%) | 253 (43.6%) |
| 45 to 54 Years | 126 (12.0%) | 81 (14.8%) |
| 55 to 64 Years | 94 (14.6%) | 298 (38.1%) |
| 65 to 74 Years | 74 (12.2%) | 57 (11.2%) |
| 75 Years and over | 26 (6.3%) | 18 (4.1%) |
| Total | 918 (14.1%) | 1,463 (28.5%) |
Income Above Poverty by Sex and Age in Charlton County
According to the poverty statistics in Charlton County, males aged 5 years and females aged 16 and 17 years are the age groups that are most secure financially, with 100.0% of males and 100.0% of females in these age groups living above the poverty line.
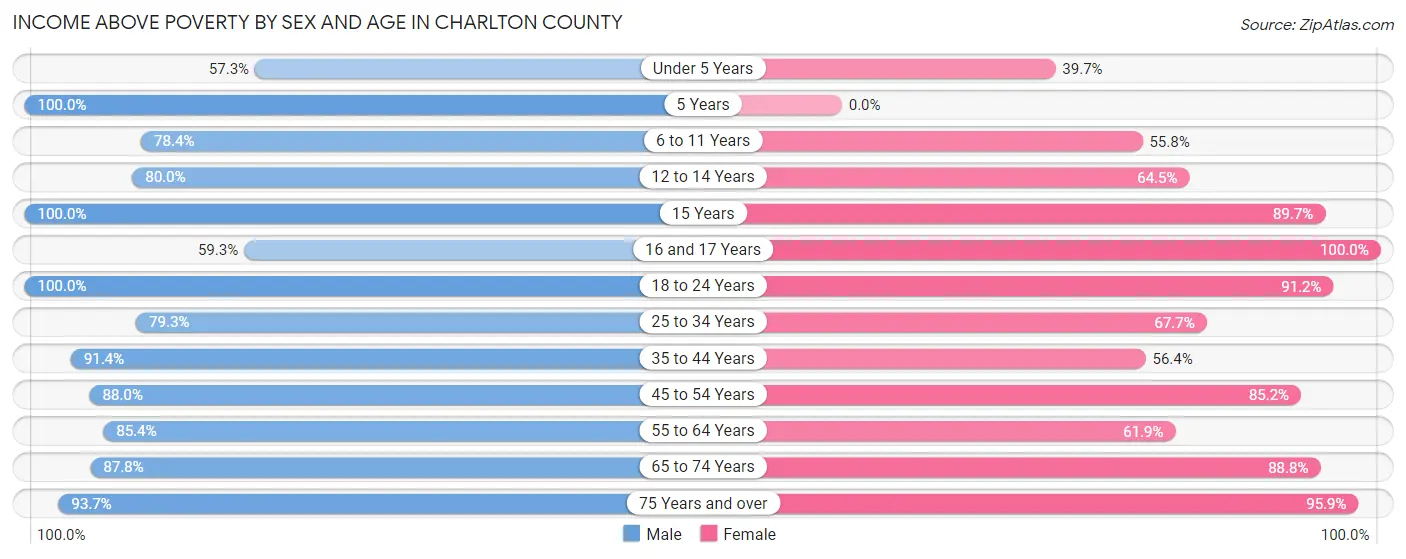
| Age Bracket | Male | Female |
| Under 5 Years | 75 (57.3%) | 159 (39.7%) |
| 5 Years | 40 (100.0%) | 0 (0.0%) |
| 6 to 11 Years | 286 (78.4%) | 221 (55.8%) |
| 12 to 14 Years | 160 (80.0%) | 149 (64.5%) |
| 15 Years | 58 (100.0%) | 61 (89.7%) |
| 16 and 17 Years | 99 (59.3%) | 96 (100.0%) |
| 18 to 24 Years | 602 (100.0%) | 531 (91.2%) |
| 25 to 34 Years | 1,076 (79.3%) | 306 (67.7%) |
| 35 to 44 Years | 787 (91.4%) | 327 (56.4%) |
| 45 to 54 Years | 920 (87.9%) | 467 (85.2%) |
| 55 to 64 Years | 549 (85.4%) | 484 (61.9%) |
| 65 to 74 Years | 532 (87.8%) | 452 (88.8%) |
| 75 Years and over | 388 (93.7%) | 417 (95.9%) |
| Total | 5,572 (85.9%) | 3,670 (71.5%) |
Income Below Poverty Among Married-Couple Families in Charlton County
The poverty statistics for married-couple families in Charlton County show that 6.8% or 117 of the total 1,718 families live below the poverty line. Families with 1 or 2 children have the highest poverty rate of 22.9%, comprising of 92 families. On the other hand, families with no children have the lowest poverty rate of 0.2%, which includes 2 families.
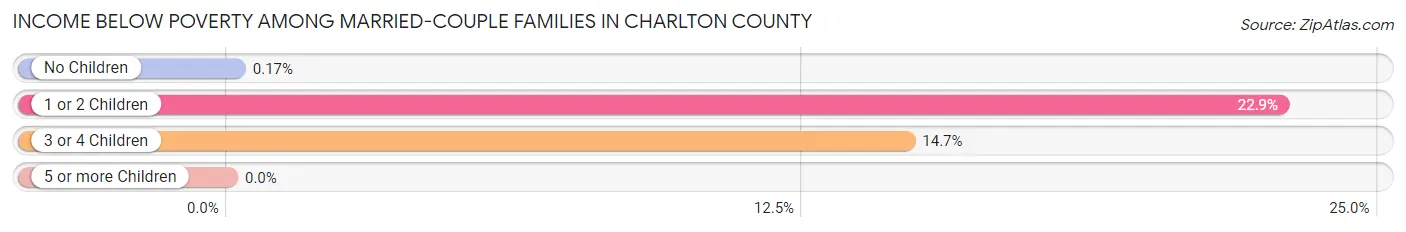
| Children | Above Poverty | Below Poverty |
| No Children | 1,158 (99.8%) | 2 (0.2%) |
| 1 or 2 Children | 310 (77.1%) | 92 (22.9%) |
| 3 or 4 Children | 133 (85.3%) | 23 (14.7%) |
| 5 or more Children | 0 (0.0%) | 0 (0.0%) |
| Total | 1,601 (93.2%) | 117 (6.8%) |
Income Below Poverty Among Single-Parent Households in Charlton County
According to the poverty data in Charlton County, 19.2% or 84 single-father households and 41.4% or 201 single-mother households are living below the poverty line. Among single-father households, those with no children have the highest poverty rate, with 72 households (45.0%) experiencing poverty. Likewise, among single-mother households, those with 3 or 4 children have the highest poverty rate, with 17 households (100.0%) falling below the poverty line.
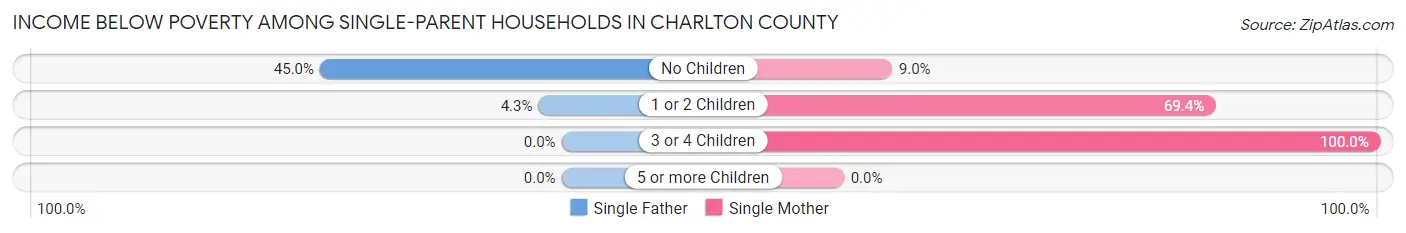
| Children | Single Father | Single Mother |
| No Children | 72 (45.0%) | 21 (9.0%) |
| 1 or 2 Children | 12 (4.3%) | 163 (69.4%) |
| 3 or 4 Children | 0 (0.0%) | 17 (100.0%) |
| 5 or more Children | 0 (0.0%) | 0 (0.0%) |
| Total | 84 (19.2%) | 201 (41.4%) |
Income Below Poverty Among Married-Couple vs Single-Parent Households in Charlton County
The poverty data for Charlton County shows that 117 of the married-couple family households (6.8%) and 285 of the single-parent households (30.8%) are living below the poverty level. Within the married-couple family households, those with 1 or 2 children have the highest poverty rate, with 92 households (22.9%) falling below the poverty line. Among the single-parent households, those with 3 or 4 children have the highest poverty rate, with 17 household (100.0%) living below poverty.
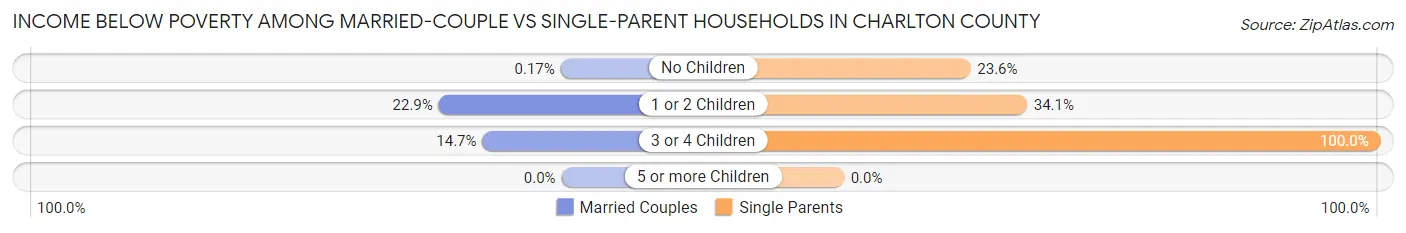
| Children | Married-Couple Families | Single-Parent Households |
| No Children | 2 (0.2%) | 93 (23.6%) |
| 1 or 2 Children | 92 (22.9%) | 175 (34.1%) |
| 3 or 4 Children | 23 (14.7%) | 17 (100.0%) |
| 5 or more Children | 0 (0.0%) | 0 (0.0%) |
| Total | 117 (6.8%) | 285 (30.8%) |
Race in Charlton County
The most populous races in Charlton County are White / Caucasian (7,897 | 62.9%), Black / African American (3,601 | 28.7%), and Hispanic or Latino (754 | 6.0%).
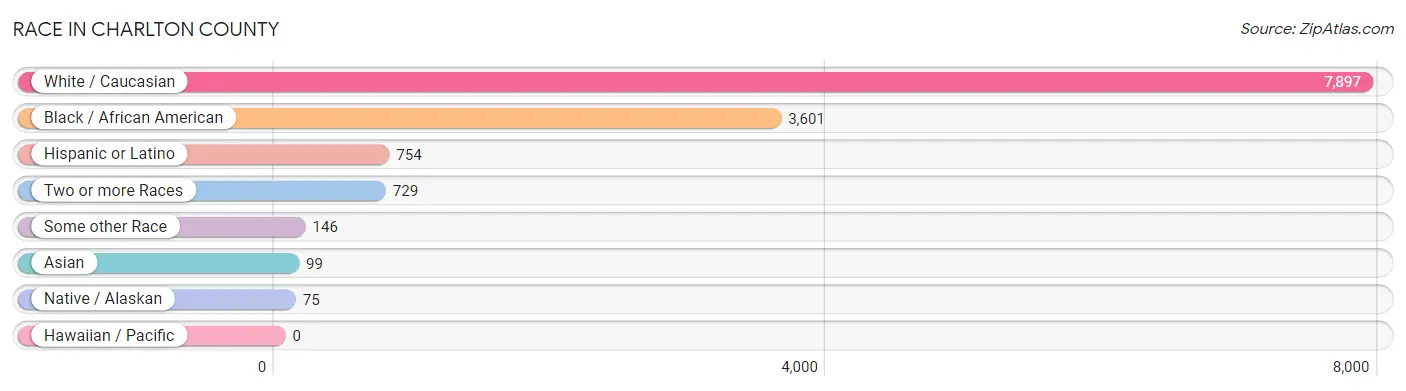
| Race | # Population | % Population |
| Asian | 99 | 0.8% |
| Black / African American | 3,601 | 28.7% |
| Hawaiian / Pacific | 0 | 0.0% |
| Hispanic or Latino | 754 | 6.0% |
| Native / Alaskan | 75 | 0.6% |
| White / Caucasian | 7,897 | 62.9% |
| Two or more Races | 729 | 5.8% |
| Some other Race | 146 | 1.2% |
| Total | 12,547 | 100.0% |
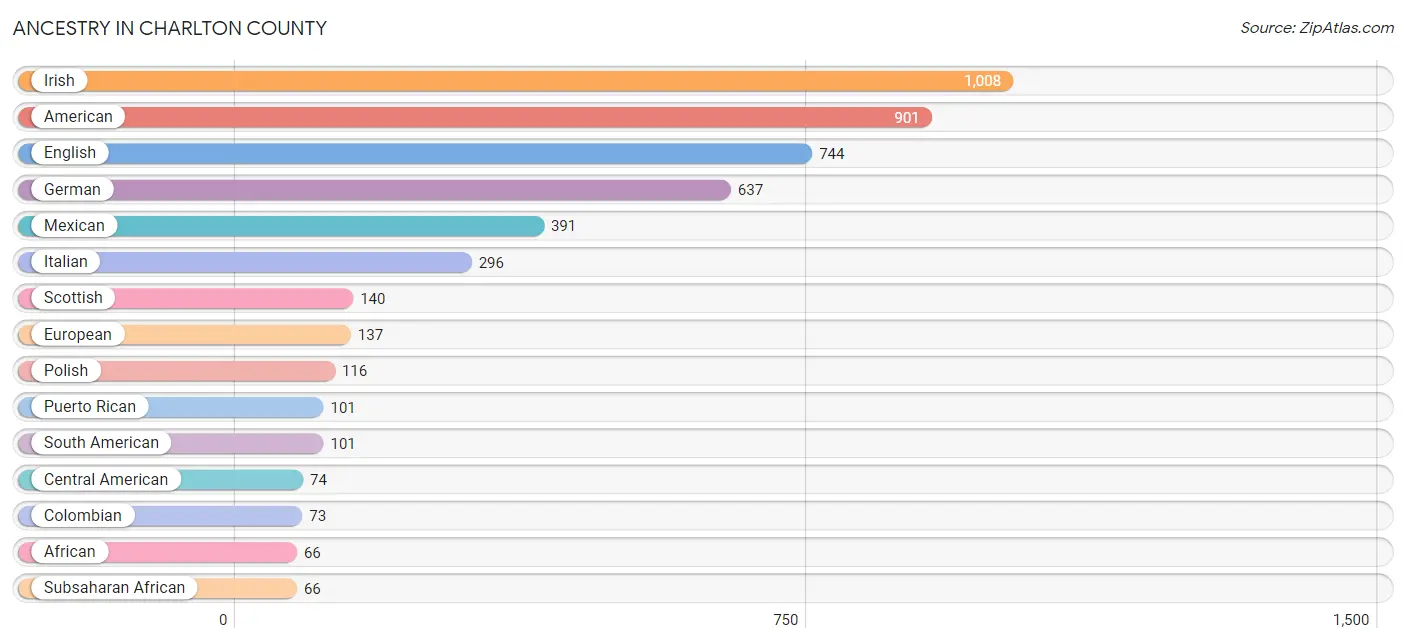
Ancestry in Charlton County
The most populous ancestries reported in Charlton County are Irish (1,008 | 8.0%), American (901 | 7.2%), English (744 | 5.9%), German (637 | 5.1%), and Mexican (391 | 3.1%), together accounting for 29.3% of all Charlton County residents.
| Ancestry | # Population | % Population |
| African | 66 | 0.5% |
| Alaska Native | 33 | 0.3% |
| American | 901 | 7.2% |
| Arab | 16 | 0.1% |
| Bhutanese | 7 | 0.1% |
| Blackfeet | 39 | 0.3% |
| British | 28 | 0.2% |
| Burmese | 13 | 0.1% |
| Central American | 74 | 0.6% |
| Cherokee | 51 | 0.4% |
| Colombian | 73 | 0.6% |
| Costa Rican | 42 | 0.3% |
| Cuban | 19 | 0.2% |
| Dominican | 22 | 0.2% |
| Dutch | 21 | 0.2% |
| Eastern European | 4 | 0.0% |
| Ecuadorian | 28 | 0.2% |
| English | 744 | 5.9% |
| European | 137 | 1.1% |
| French | 25 | 0.2% |
| German | 637 | 5.1% |
| Haitian | 21 | 0.2% |
| Honduran | 22 | 0.2% |
| Irish | 1,008 | 8.0% |
| Italian | 296 | 2.4% |
| Korean | 32 | 0.3% |
| Mexican | 391 | 3.1% |
| Native Hawaiian | 29 | 0.2% |
| Northern European | 11 | 0.1% |
| Polish | 116 | 0.9% |
| Puerto Rican | 101 | 0.8% |
| Salvadoran | 10 | 0.1% |
| Scotch-Irish | 46 | 0.4% |
| Scottish | 140 | 1.1% |
| Seminole | 15 | 0.1% |
| South American | 101 | 0.8% |
| Subsaharan African | 66 | 0.5% |
| Swedish | 6 | 0.1% |
| Thai | 65 | 0.5% |
| Ukrainian | 13 | 0.1% |
| Welsh | 35 | 0.3% | View All 41 Rows |
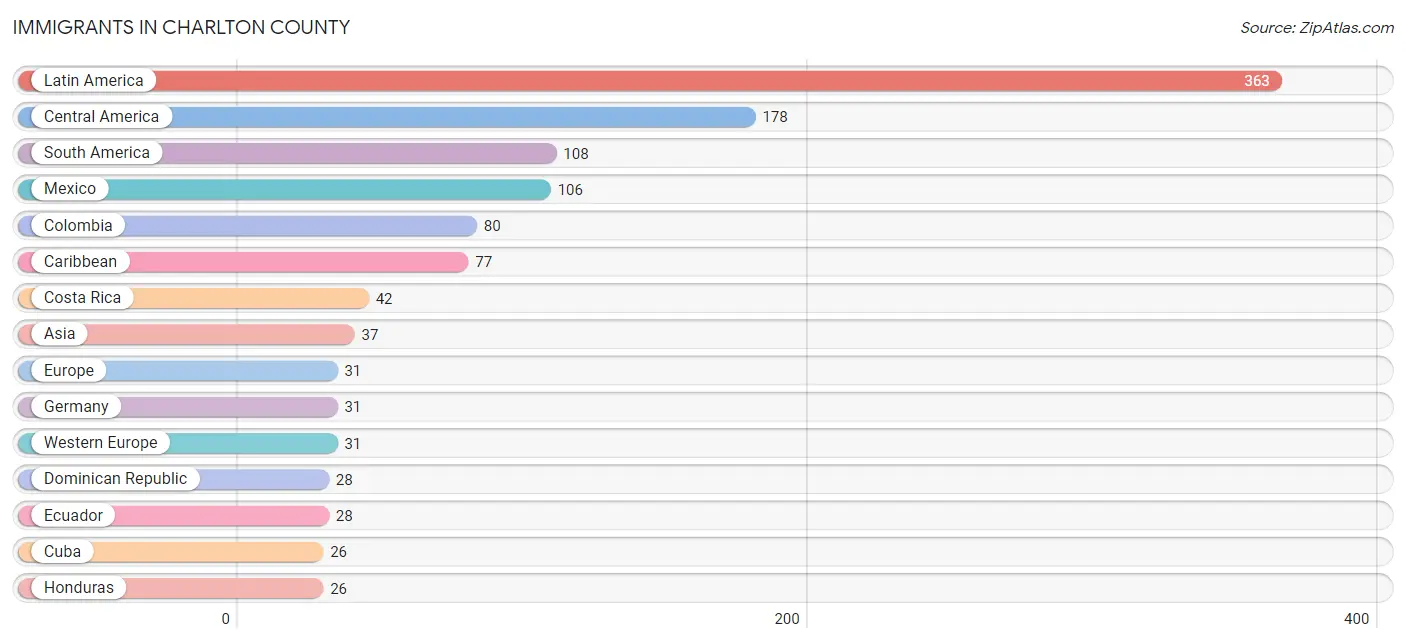
Immigrants in Charlton County
The most numerous immigrant groups reported in Charlton County came from Latin America (363 | 2.9%), Central America (178 | 1.4%), South America (108 | 0.9%), Mexico (106 | 0.8%), and Colombia (80 | 0.6%), together accounting for 6.6% of all Charlton County residents.
| Immigration Origin | # Population | % Population |
| Asia | 37 | 0.3% |
| Caribbean | 77 | 0.6% |
| Central America | 178 | 1.4% |
| Colombia | 80 | 0.6% |
| Costa Rica | 42 | 0.3% |
| Cuba | 26 | 0.2% |
| Dominican Republic | 28 | 0.2% |
| Ecuador | 28 | 0.2% |
| Europe | 31 | 0.3% |
| Germany | 31 | 0.3% |
| Guatemala | 4 | 0.0% |
| Haiti | 10 | 0.1% |
| Honduras | 26 | 0.2% |
| India | 14 | 0.1% |
| Iraq | 16 | 0.1% |
| Jamaica | 13 | 0.1% |
| Latin America | 363 | 2.9% |
| Mexico | 106 | 0.8% |
| Pakistan | 7 | 0.1% |
| South America | 108 | 0.9% |
| South Central Asia | 21 | 0.2% |
| Western Asia | 16 | 0.1% |
| Western Europe | 31 | 0.3% | View All 23 Rows |
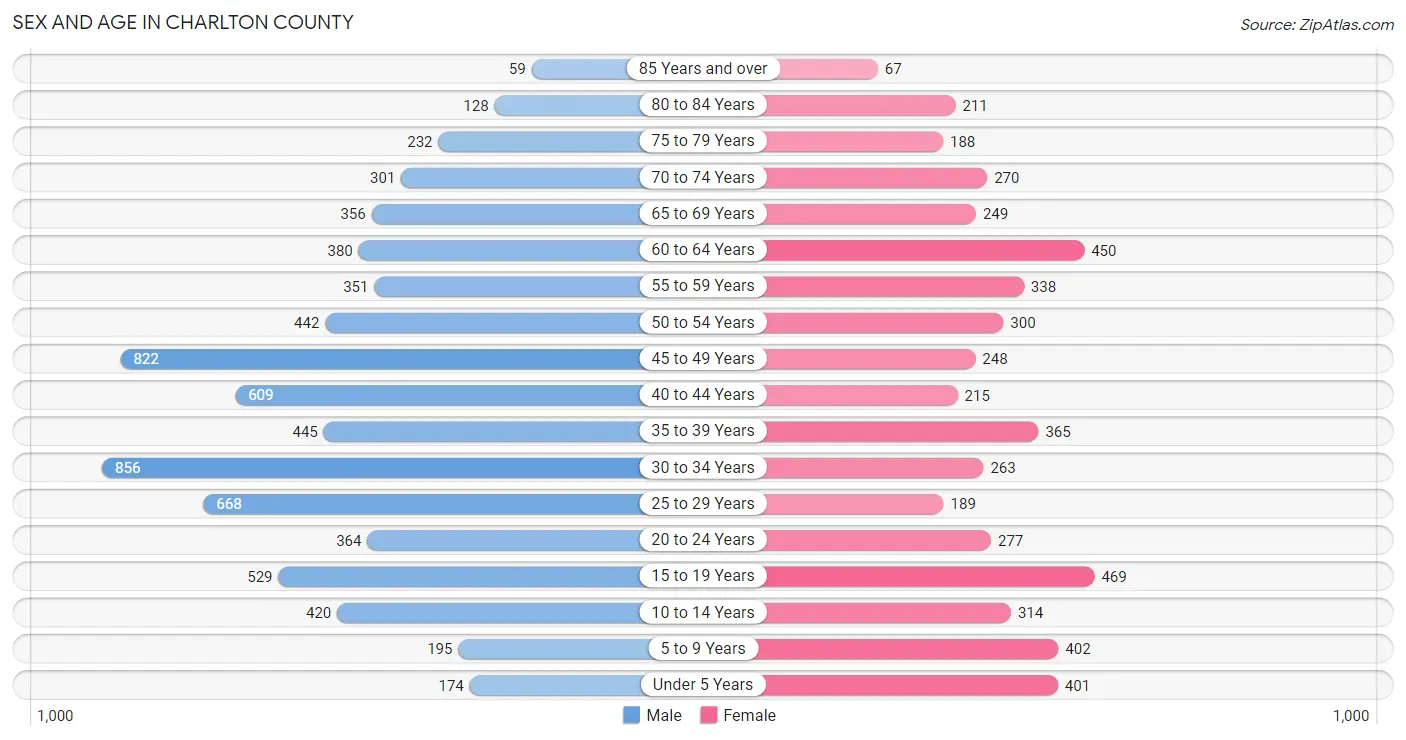
Sex and Age in Charlton County
Sex and Age in Charlton County
The most populous age groups in Charlton County are 30 to 34 Years (856 | 11.7%) for men and 15 to 19 Years (469 | 9.0%) for women.
| Age Bracket | Male | Female |
| Under 5 Years | 174 (2.4%) | 401 (7.7%) |
| 5 to 9 Years | 195 (2.7%) | 402 (7.7%) |
| 10 to 14 Years | 420 (5.7%) | 314 (6.0%) |
| 15 to 19 Years | 529 (7.2%) | 469 (9.0%) |
| 20 to 24 Years | 364 (5.0%) | 277 (5.3%) |
| 25 to 29 Years | 668 (9.1%) | 189 (3.6%) |
| 30 to 34 Years | 856 (11.7%) | 263 (5.0%) |
| 35 to 39 Years | 445 (6.1%) | 365 (7.0%) |
| 40 to 44 Years | 609 (8.3%) | 215 (4.1%) |
| 45 to 49 Years | 822 (11.2%) | 248 (4.8%) |
| 50 to 54 Years | 442 (6.0%) | 300 (5.8%) |
| 55 to 59 Years | 351 (4.8%) | 338 (6.5%) |
| 60 to 64 Years | 380 (5.2%) | 450 (8.6%) |
| 65 to 69 Years | 356 (4.9%) | 249 (4.8%) |
| 70 to 74 Years | 301 (4.1%) | 270 (5.2%) |
| 75 to 79 Years | 232 (3.2%) | 188 (3.6%) |
| 80 to 84 Years | 128 (1.8%) | 211 (4.1%) |
| 85 Years and over | 59 (0.8%) | 67 (1.3%) |
| Total | 7,331 (100.0%) | 5,216 (100.0%) |
Families and Households in Charlton County
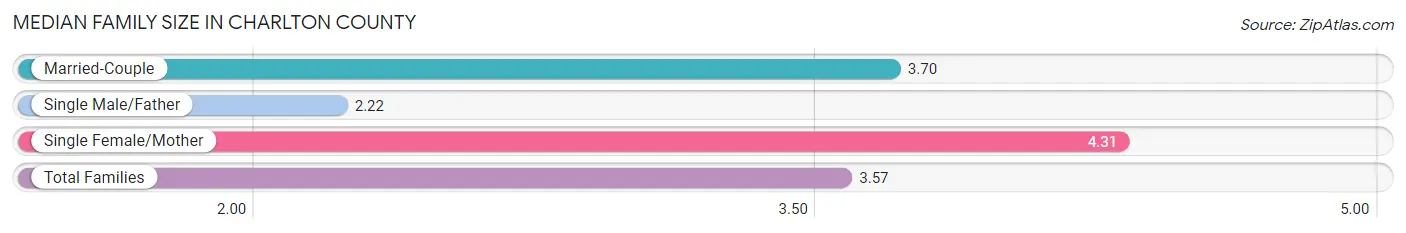
Median Family Size in Charlton County
The median family size in Charlton County is 3.57 persons per family, with single female/mother families (486 | 18.4%) accounting for the largest median family size of 4.31 persons per family. On the other hand, single male/father families (438 | 16.6%) represent the smallest median family size with 2.22 persons per family.
| Family Type | # Families | Family Size |
| Married-Couple | 1,718 (65.0%) | 3.70 |
| Single Male/Father | 438 (16.6%) | 2.22 |
| Single Female/Mother | 486 (18.4%) | 4.31 |
| Total Families | 2,642 (100.0%) | 3.57 |
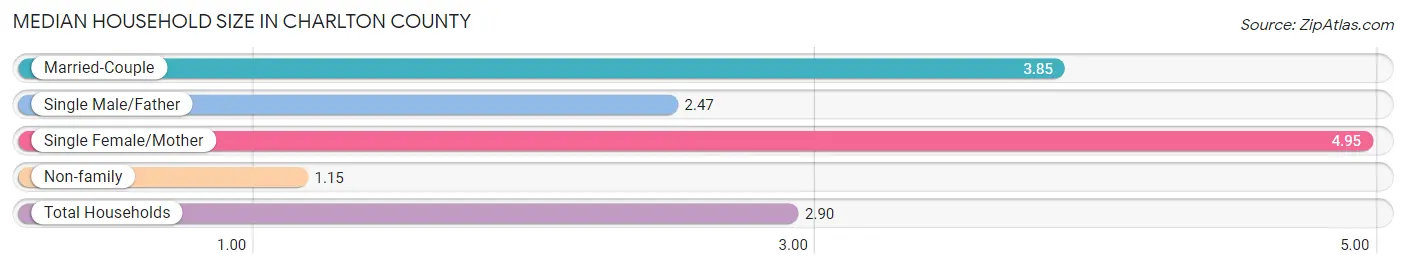
Median Household Size in Charlton County
The median household size in Charlton County is 2.90 persons per household, with single female/mother households (486 | 12.0%) accounting for the largest median household size of 4.95 persons per household. non-family households (1,401 | 34.6%) represent the smallest median household size with 1.15 persons per household.
| Household Type | # Households | Household Size |
| Married-Couple | 1,718 (42.5%) | 3.85 |
| Single Male/Father | 438 (10.8%) | 2.47 |
| Single Female/Mother | 486 (12.0%) | 4.95 |
| Non-family | 1,401 (34.6%) | 1.15 |
| Total Households | 4,043 (100.0%) | 2.90 |
Household Size by Marriage Status in Charlton County
Out of a total of 4,043 households in Charlton County, 2,642 (65.3%) are family households, while 1,401 (34.6%) are nonfamily households. The most numerous type of family households are 2-person households, comprising 1,223, and the most common type of nonfamily households are 1-person households, comprising 1,233.
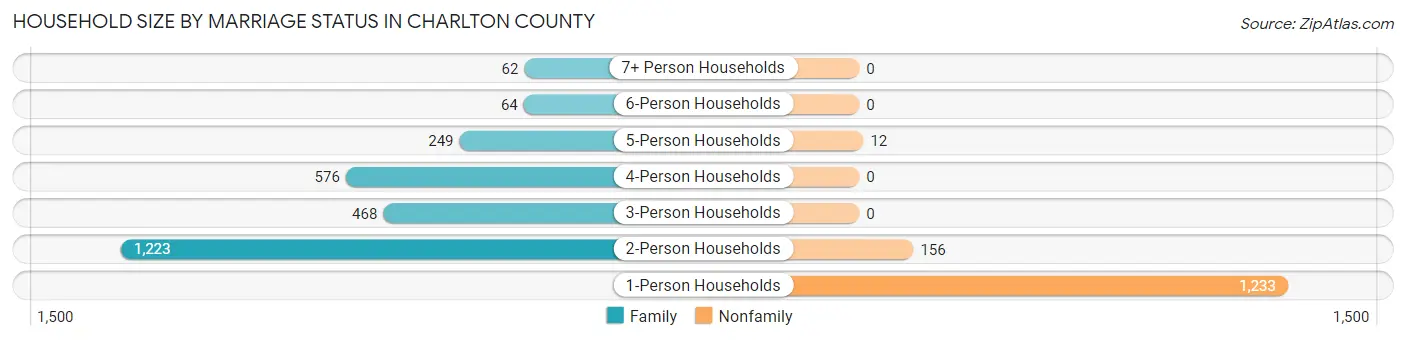
| Household Size | Family Households | Nonfamily Households |
| 1-Person Households | - | 1,233 (30.5%) |
| 2-Person Households | 1,223 (30.2%) | 156 (3.9%) |
| 3-Person Households | 468 (11.6%) | 0 (0.0%) |
| 4-Person Households | 576 (14.2%) | 0 (0.0%) |
| 5-Person Households | 249 (6.2%) | 12 (0.3%) |
| 6-Person Households | 64 (1.6%) | 0 (0.0%) |
| 7+ Person Households | 62 (1.5%) | 0 (0.0%) |
| Total | 2,642 (65.3%) | 1,401 (34.6%) |
Female Fertility in Charlton County
Fertility by Age in Charlton County
Average fertility rate in Charlton County is 77.0 births per 1,000 women. Women in the age bracket of 20 to 34 years have the highest fertility rate with 103.0 births per 1,000 women. Women in the age bracket of 35 to 50 years acount for 53.1% of all women with births.
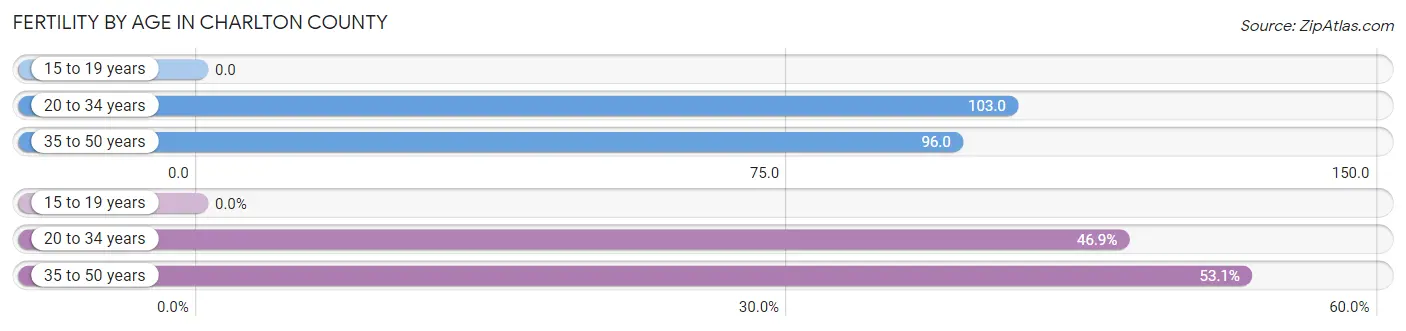
| Age Bracket | Women with Births | Births / 1,000 Women |
| 15 to 19 years | 0 (0.0%) | 0.0 |
| 20 to 34 years | 75 (46.9%) | 103.0 |
| 35 to 50 years | 85 (53.1%) | 96.0 |
| Total | 160 (100.0%) | 77.0 |
Fertility by Age by Marriage Status in Charlton County
12.5% of women with births (160) in Charlton County are married. The highest percentage of unmarried women with births falls into 35 to 50 years age bracket with 95.3% of them unmarried at the time of birth, while the lowest percentage of unmarried women with births belong to 20 to 34 years age bracket with 78.7% of them unmarried.
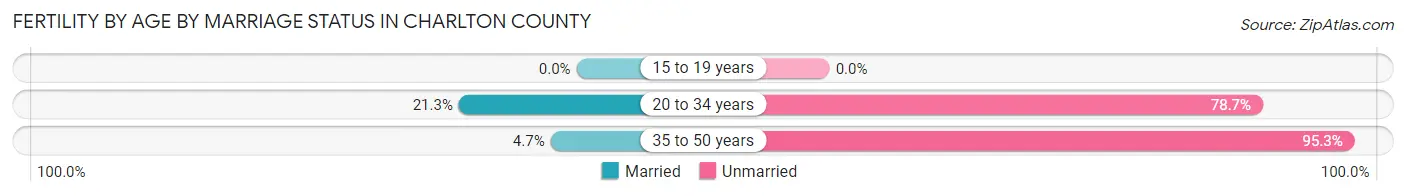
| Age Bracket | Married | Unmarried |
| 15 to 19 years | 0 (0.0%) | 0 (0.0%) |
| 20 to 34 years | 16 (21.3%) | 59 (78.7%) |
| 35 to 50 years | 4 (4.7%) | 81 (95.3%) |
| Total | 20 (12.5%) | 140 (87.5%) |
Fertility by Education in Charlton County
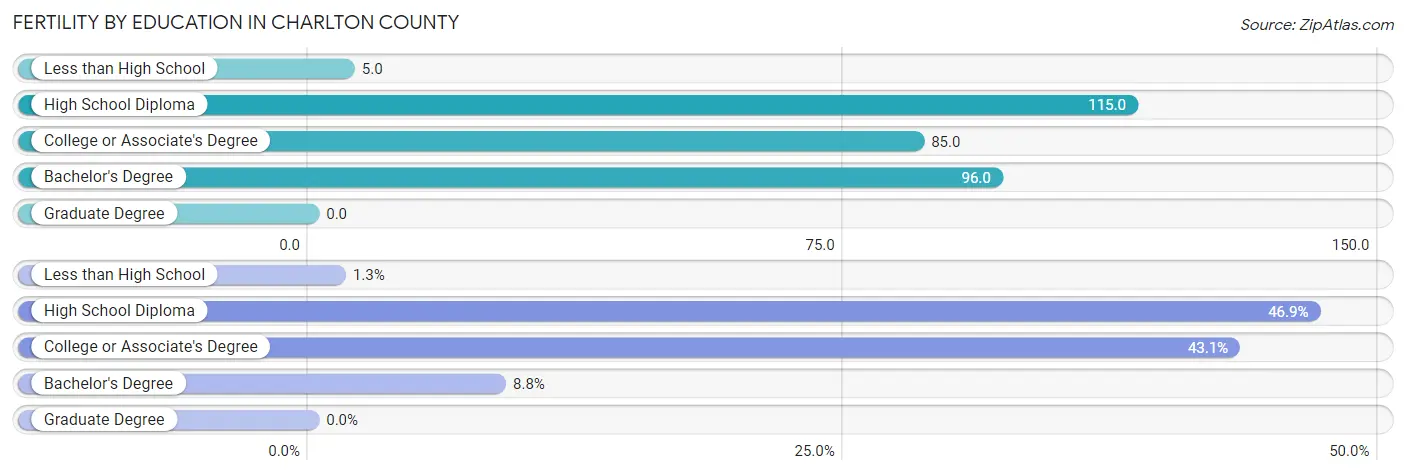
| Educational Attainment | Women with Births | Births / 1,000 Women |
| Less than High School | 2 (1.3%) | 5.0 |
| High School Diploma | 75 (46.9%) | 115.0 |
| College or Associate's Degree | 69 (43.1%) | 85.0 |
| Bachelor's Degree | 14 (8.7%) | 96.0 |
| Graduate Degree | 0 (0.0%) | 0.0 |
| Total | 160 (100.0%) | 77.0 |
Fertility by Education by Marriage Status in Charlton County
87.5% of women with births in Charlton County are unmarried. Women with the educational attainment of less than high school are most likely to be married with 100.0% of them married at childbirth, while women with the educational attainment of college or associate's degree are least likely to be married with 100.0% of them unmarried at childbirth.
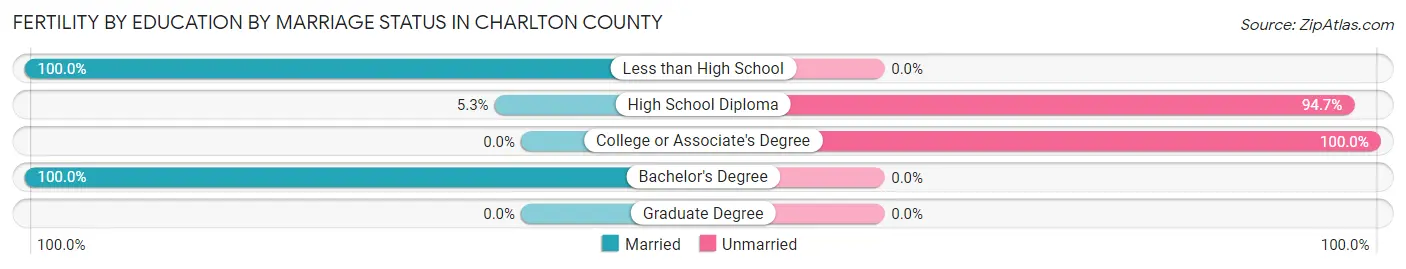
| Educational Attainment | Married | Unmarried |
| Less than High School | 2 (100.0%) | 0 (0.0%) |
| High School Diploma | 4 (5.3%) | 71 (94.7%) |
| College or Associate's Degree | 0 (0.0%) | 69 (100.0%) |
| Bachelor's Degree | 14 (100.0%) | 0 (0.0%) |
| Graduate Degree | 0 (0.0%) | 0 (0.0%) |
| Total | 20 (12.5%) | 140 (87.5%) |
Employment Characteristics in Charlton County
Employment by Class of Employer in Charlton County
Among the 4,961 employed individuals in Charlton County, private company employees (3,518 | 70.9%), local government employees (480 | 9.7%), and state government employees (317 | 6.4%) make up the most common classes of employment.
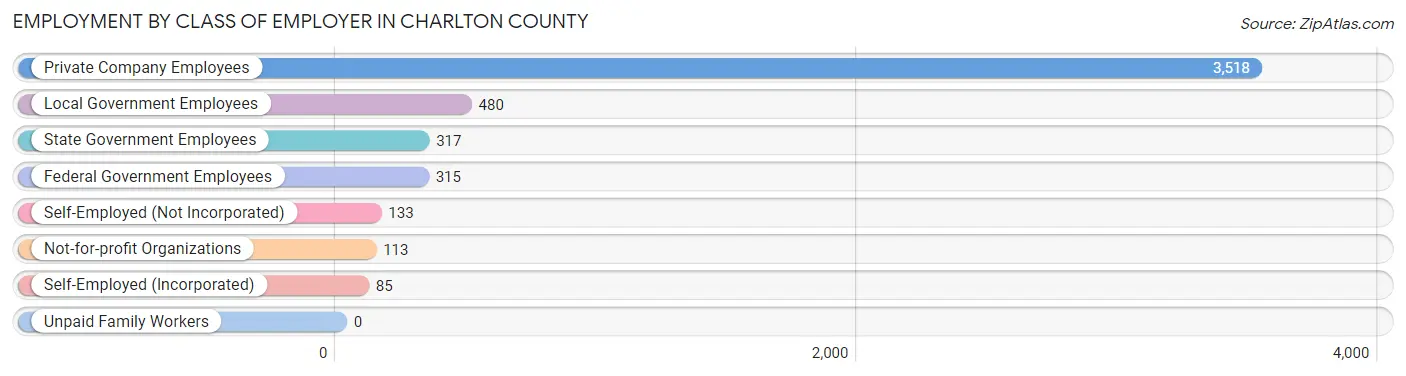
| Employer Class | # Employees | % Employees |
| Private Company Employees | 3,518 | 70.9% |
| Self-Employed (Incorporated) | 85 | 1.7% |
| Self-Employed (Not Incorporated) | 133 | 2.7% |
| Not-for-profit Organizations | 113 | 2.3% |
| Local Government Employees | 480 | 9.7% |
| State Government Employees | 317 | 6.4% |
| Federal Government Employees | 315 | 6.4% |
| Unpaid Family Workers | 0 | 0.0% |
| Total | 4,961 | 100.0% |
Employment Status by Age in Charlton County
According to the labor force statistics for Charlton County, out of the total population over 16 years of age (10,515), 52.0% or 5,468 individuals are in the labor force, with 8.3% or 454 of them unemployed. The age group with the highest labor force participation rate is 25 to 29 years, with 81.2% or 696 individuals in the labor force. Within the labor force, the 16 to 19 years age range has the highest percentage of unemployed individuals, with 26.9% or 64 of them being unemployed.
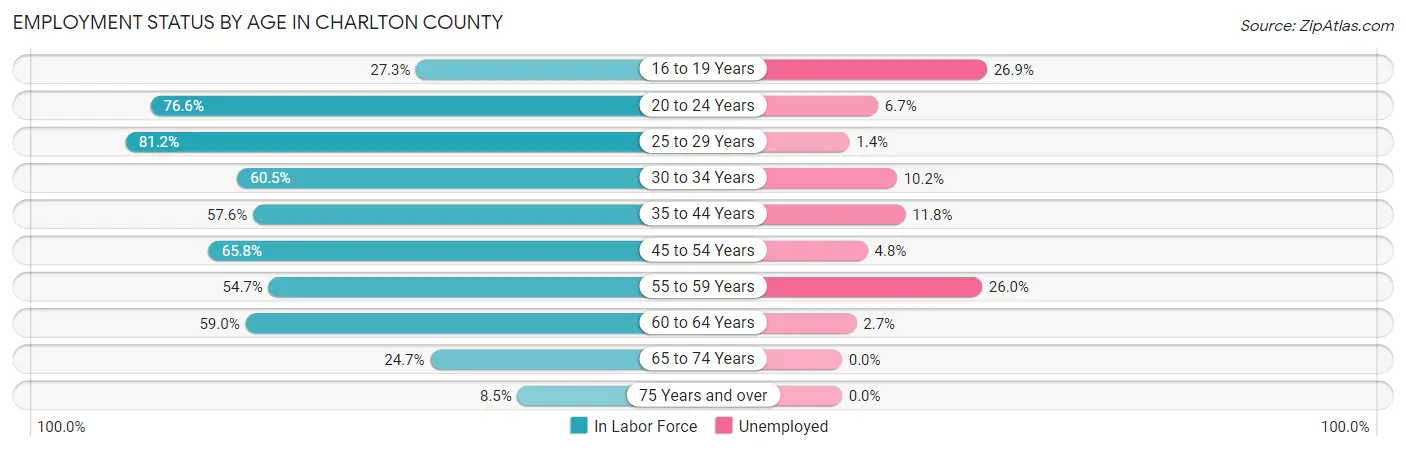
| Age Bracket | In Labor Force | Unemployed |
| 16 to 19 Years | 238 (27.3%) | 64 (26.9%) |
| 20 to 24 Years | 491 (76.6%) | 33 (6.7%) |
| 25 to 29 Years | 696 (81.2%) | 10 (1.4%) |
| 30 to 34 Years | 677 (60.5%) | 69 (10.2%) |
| 35 to 44 Years | 941 (57.6%) | 111 (11.8%) |
| 45 to 54 Years | 1,192 (65.8%) | 57 (4.8%) |
| 55 to 59 Years | 377 (54.7%) | 98 (26.0%) |
| 60 to 64 Years | 490 (59.0%) | 13 (2.7%) |
| 65 to 74 Years | 290 (24.7%) | 0 (0.0%) |
| 75 Years and over | 75 (8.5%) | 0 (0.0%) |
| Total | 5,468 (52.0%) | 454 (8.3%) |
Employment Status by Educational Attainment in Charlton County
According to labor force statistics for Charlton County, 63.0% of individuals (4,373) out of the total population between 25 and 64 years of age (6,941) are in the labor force, with 8.2% or 359 of them being unemployed. The group with the highest labor force participation rate are those with the educational attainment of bachelor's degree or higher, with 93.7% or 726 individuals in the labor force. Within the labor force, individuals with less than high school education have the highest percentage of unemployment, with 18.6% or 85 of them being unemployed.
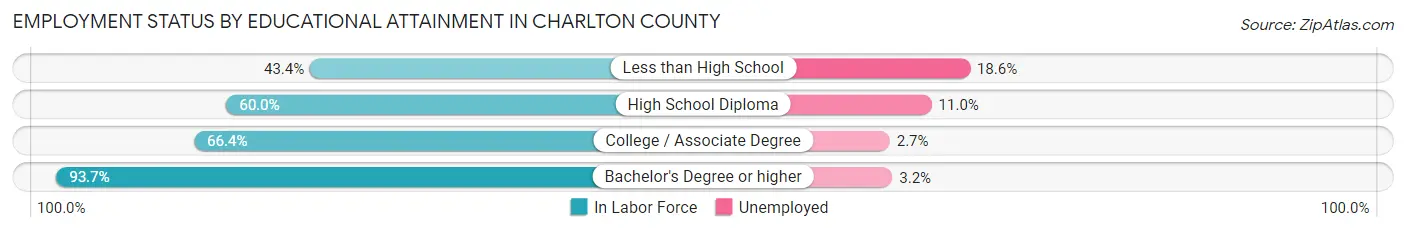
| Educational Attainment | In Labor Force | Unemployed |
| Less than High School | 456 (43.4%) | 195 (18.6%) |
| High School Diploma | 1,940 (60.0%) | 356 (11.0%) |
| College / Associate Degree | 1,250 (66.4%) | 51 (2.7%) |
| Bachelor's Degree or higher | 726 (93.7%) | 25 (3.2%) |
| Total | 4,373 (63.0%) | 569 (8.2%) |
Employment Occupations by Sex in Charlton County
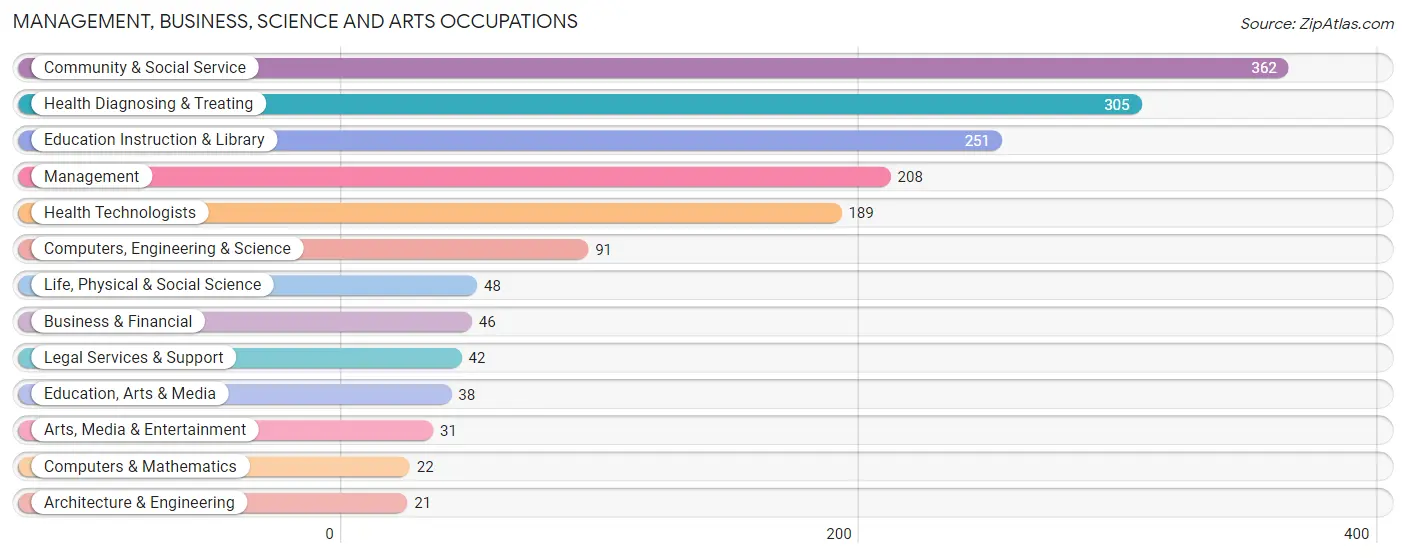
Management, Business, Science and Arts Occupations
The most common Management, Business, Science and Arts occupations in Charlton County are Community & Social Service (362 | 7.2%), Health Diagnosing & Treating (305 | 6.1%), Education Instruction & Library (251 | 5.0%), Management (208 | 4.2%), and Health Technologists (189 | 3.8%).
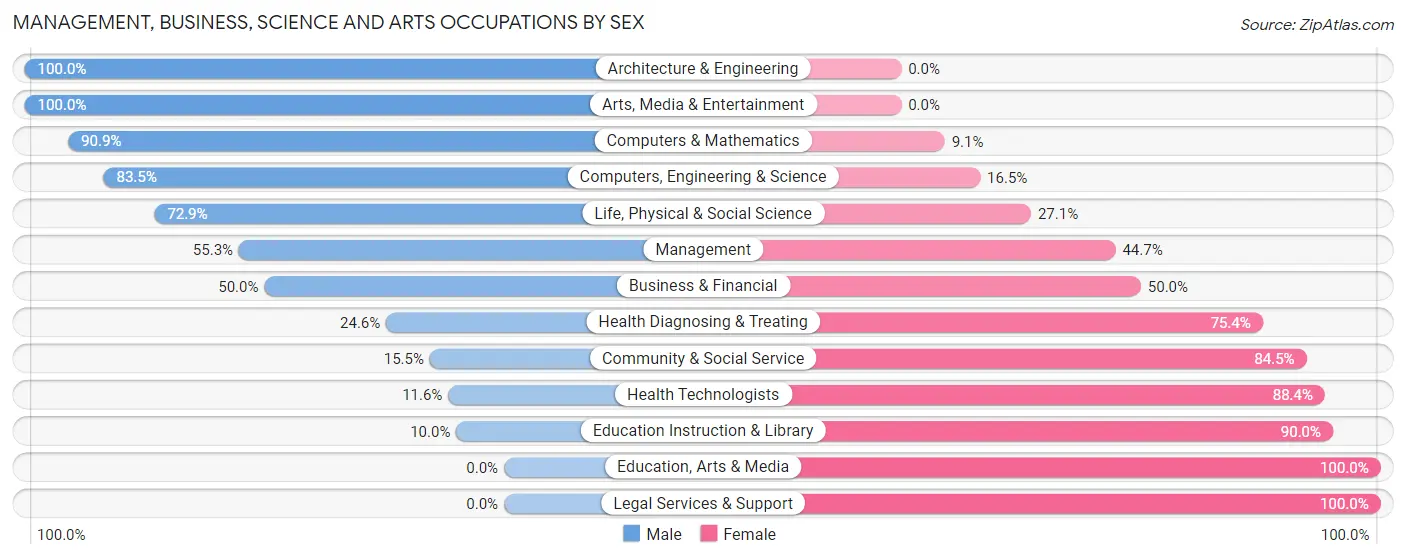
Management, Business, Science and Arts Occupations by Sex
Within the Management, Business, Science and Arts occupations in Charlton County, the most male-oriented occupations are Architecture & Engineering (100.0%), Arts, Media & Entertainment (100.0%), and Computers & Mathematics (90.9%), while the most female-oriented occupations are Education, Arts & Media (100.0%), Legal Services & Support (100.0%), and Education Instruction & Library (90.0%).
| Occupation | Male | Female |
| Management | 115 (55.3%) | 93 (44.7%) |
| Business & Financial | 23 (50.0%) | 23 (50.0%) |
| Computers, Engineering & Science | 76 (83.5%) | 15 (16.5%) |
| Computers & Mathematics | 20 (90.9%) | 2 (9.1%) |
| Architecture & Engineering | 21 (100.0%) | 0 (0.0%) |
| Life, Physical & Social Science | 35 (72.9%) | 13 (27.1%) |
| Community & Social Service | 56 (15.5%) | 306 (84.5%) |
| Education, Arts & Media | 0 (0.0%) | 38 (100.0%) |
| Legal Services & Support | 0 (0.0%) | 42 (100.0%) |
| Education Instruction & Library | 25 (10.0%) | 226 (90.0%) |
| Arts, Media & Entertainment | 31 (100.0%) | 0 (0.0%) |
| Health Diagnosing & Treating | 75 (24.6%) | 230 (75.4%) |
| Health Technologists | 22 (11.6%) | 167 (88.4%) |
| Total (Category) | 345 (34.1%) | 667 (65.9%) |
| Total (Overall) | 3,284 (65.8%) | 1,709 (34.2%) |
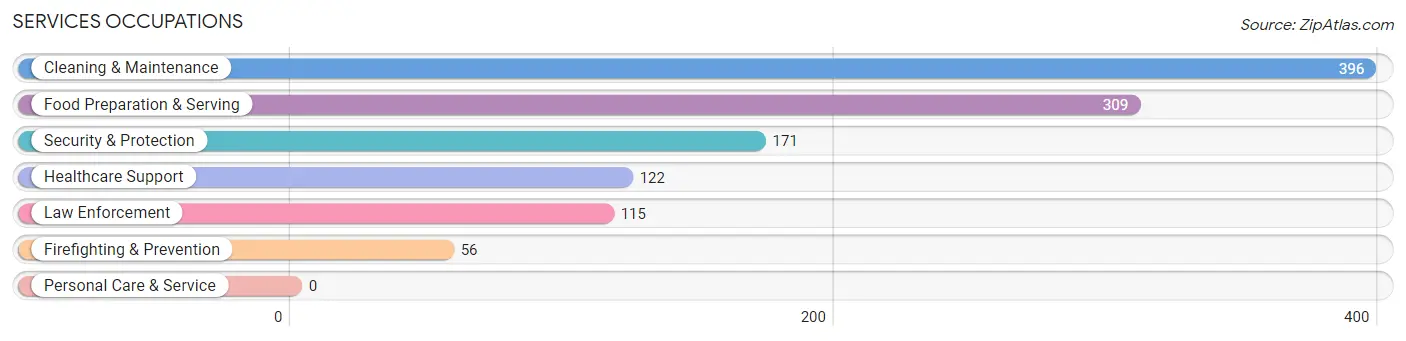
Services Occupations
The most common Services occupations in Charlton County are Cleaning & Maintenance (396 | 7.9%), Food Preparation & Serving (309 | 6.2%), Security & Protection (171 | 3.4%), Healthcare Support (122 | 2.4%), and Law Enforcement (115 | 2.3%).
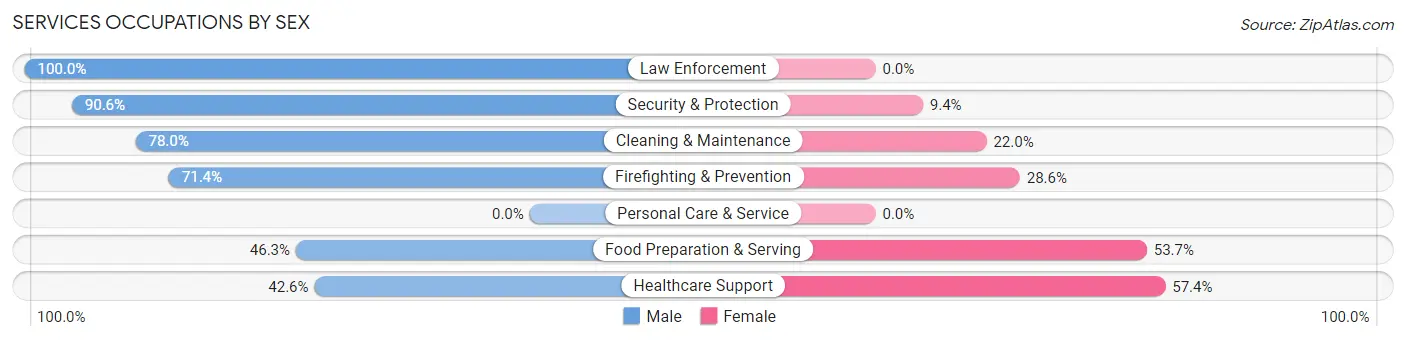
Services Occupations by Sex
Within the Services occupations in Charlton County, the most male-oriented occupations are Law Enforcement (100.0%), Security & Protection (90.6%), and Cleaning & Maintenance (78.0%), while the most female-oriented occupations are Healthcare Support (57.4%), Food Preparation & Serving (53.7%), and Firefighting & Prevention (28.6%).
| Occupation | Male | Female |
| Healthcare Support | 52 (42.6%) | 70 (57.4%) |
| Security & Protection | 155 (90.6%) | 16 (9.4%) |
| Firefighting & Prevention | 40 (71.4%) | 16 (28.6%) |
| Law Enforcement | 115 (100.0%) | 0 (0.0%) |
| Food Preparation & Serving | 143 (46.3%) | 166 (53.7%) |
| Cleaning & Maintenance | 309 (78.0%) | 87 (22.0%) |
| Personal Care & Service | 0 (0.0%) | 0 (0.0%) |
| Total (Category) | 659 (66.0%) | 339 (34.0%) |
| Total (Overall) | 3,284 (65.8%) | 1,709 (34.2%) |
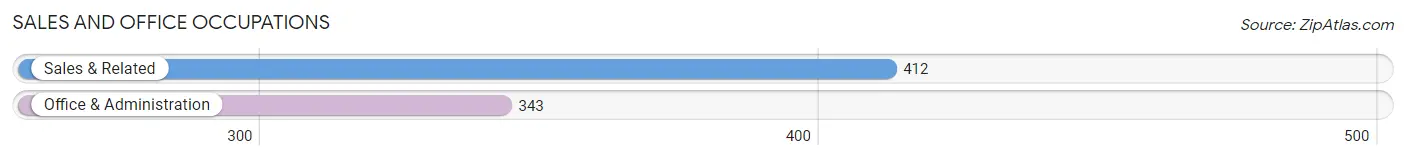
Sales and Office Occupations
The most common Sales and Office occupations in Charlton County are Sales & Related (412 | 8.3%), and Office & Administration (343 | 6.9%).
Sales and Office Occupations by Sex
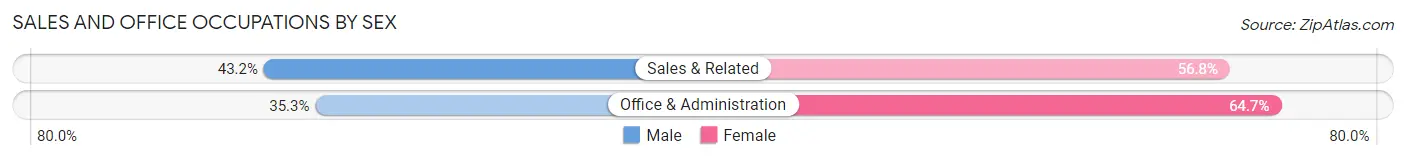
| Occupation | Male | Female |
| Sales & Related | 178 (43.2%) | 234 (56.8%) |
| Office & Administration | 121 (35.3%) | 222 (64.7%) |
| Total (Category) | 299 (39.6%) | 456 (60.4%) |
| Total (Overall) | 3,284 (65.8%) | 1,709 (34.2%) |
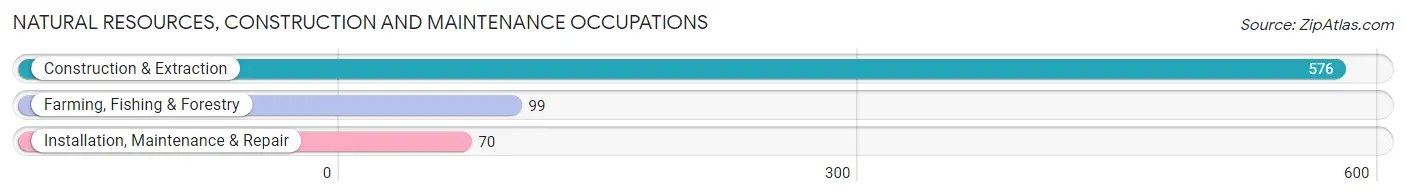
Natural Resources, Construction and Maintenance Occupations
The most common Natural Resources, Construction and Maintenance occupations in Charlton County are Construction & Extraction (576 | 11.5%), Farming, Fishing & Forestry (99 | 2.0%), and Installation, Maintenance & Repair (70 | 1.4%).
Natural Resources, Construction and Maintenance Occupations by Sex
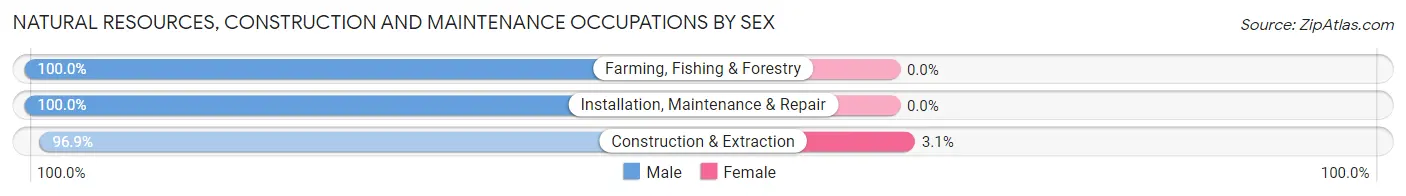
| Occupation | Male | Female |
| Farming, Fishing & Forestry | 99 (100.0%) | 0 (0.0%) |
| Construction & Extraction | 558 (96.9%) | 18 (3.1%) |
| Installation, Maintenance & Repair | 70 (100.0%) | 0 (0.0%) |
| Total (Category) | 727 (97.6%) | 18 (2.4%) |
| Total (Overall) | 3,284 (65.8%) | 1,709 (34.2%) |
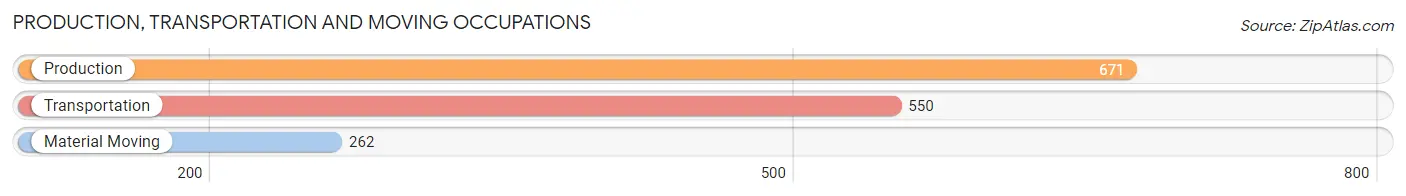
Production, Transportation and Moving Occupations
The most common Production, Transportation and Moving occupations in Charlton County are Production (671 | 13.4%), Transportation (550 | 11.0%), and Material Moving (262 | 5.2%).
Production, Transportation and Moving Occupations by Sex
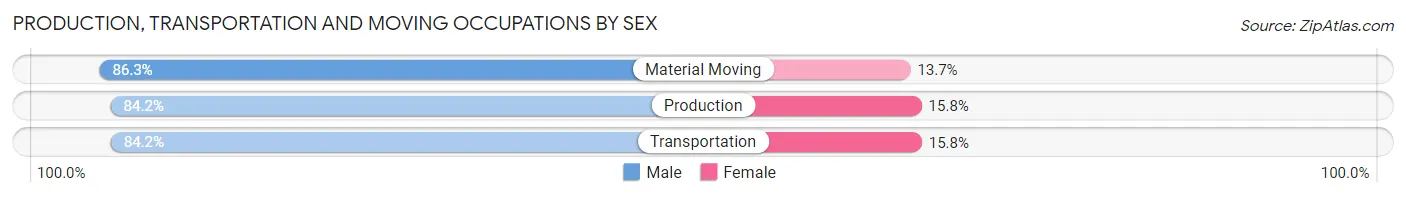
| Occupation | Male | Female |
| Production | 565 (84.2%) | 106 (15.8%) |
| Transportation | 463 (84.2%) | 87 (15.8%) |
| Material Moving | 226 (86.3%) | 36 (13.7%) |
| Total (Category) | 1,254 (84.6%) | 229 (15.4%) |
| Total (Overall) | 3,284 (65.8%) | 1,709 (34.2%) |
Employment Industries by Sex in Charlton County
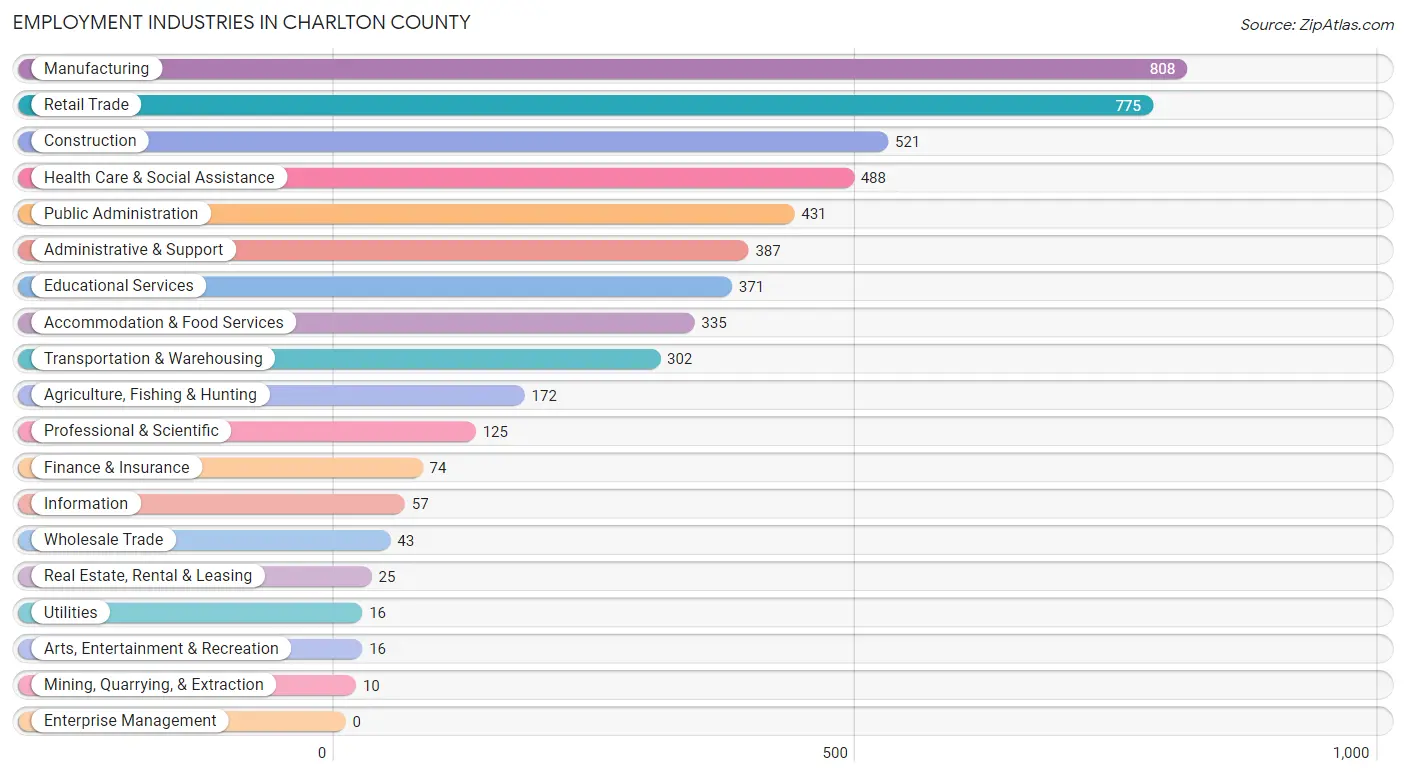
Employment Industries in Charlton County
The major employment industries in Charlton County include Manufacturing (808 | 16.2%), Retail Trade (775 | 15.5%), Construction (521 | 10.4%), Health Care & Social Assistance (488 | 9.8%), and Public Administration (431 | 8.6%).
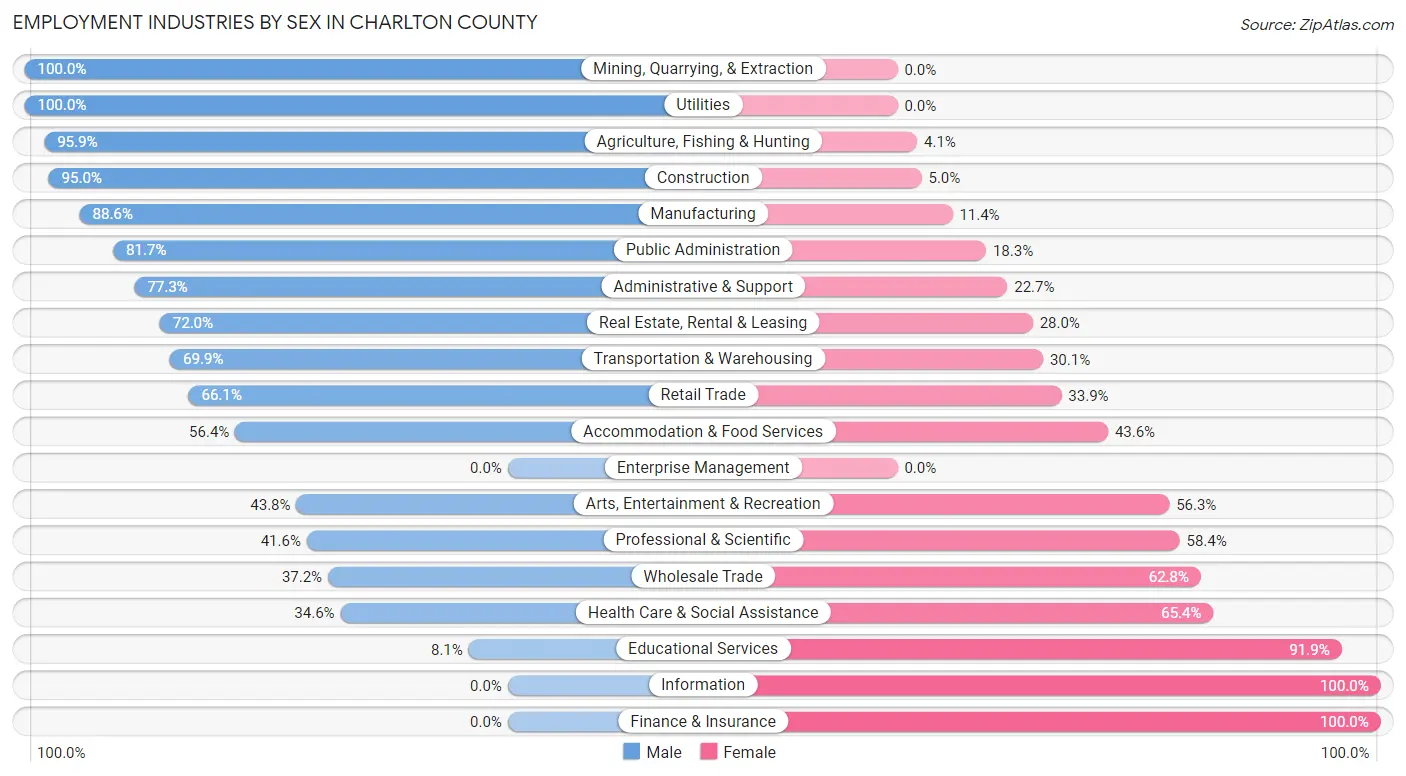
Employment Industries by Sex in Charlton County
The Charlton County industries that see more men than women are Mining, Quarrying, & Extraction (100.0%), Utilities (100.0%), and Agriculture, Fishing & Hunting (95.9%), whereas the industries that tend to have a higher number of women are Information (100.0%), Finance & Insurance (100.0%), and Educational Services (91.9%).
| Industry | Male | Female |
| Agriculture, Fishing & Hunting | 165 (95.9%) | 7 (4.1%) |
| Mining, Quarrying, & Extraction | 10 (100.0%) | 0 (0.0%) |
| Construction | 495 (95.0%) | 26 (5.0%) |
| Manufacturing | 716 (88.6%) | 92 (11.4%) |
| Wholesale Trade | 16 (37.2%) | 27 (62.8%) |
| Retail Trade | 512 (66.1%) | 263 (33.9%) |
| Transportation & Warehousing | 211 (69.9%) | 91 (30.1%) |
| Utilities | 16 (100.0%) | 0 (0.0%) |
| Information | 0 (0.0%) | 57 (100.0%) |
| Finance & Insurance | 0 (0.0%) | 74 (100.0%) |
| Real Estate, Rental & Leasing | 18 (72.0%) | 7 (28.0%) |
| Professional & Scientific | 52 (41.6%) | 73 (58.4%) |
| Enterprise Management | 0 (0.0%) | 0 (0.0%) |
| Administrative & Support | 299 (77.3%) | 88 (22.7%) |
| Educational Services | 30 (8.1%) | 341 (91.9%) |
| Health Care & Social Assistance | 169 (34.6%) | 319 (65.4%) |
| Arts, Entertainment & Recreation | 7 (43.8%) | 9 (56.2%) |
| Accommodation & Food Services | 189 (56.4%) | 146 (43.6%) |
| Public Administration | 352 (81.7%) | 79 (18.3%) |
| Total | 3,284 (65.8%) | 1,709 (34.2%) |
Education in Charlton County
School Enrollment in Charlton County
The most common levels of schooling among the 2,432 students in Charlton County are middle school (601 | 24.7%), college / undergraduate (532 | 21.9%), and high school (518 | 21.3%).
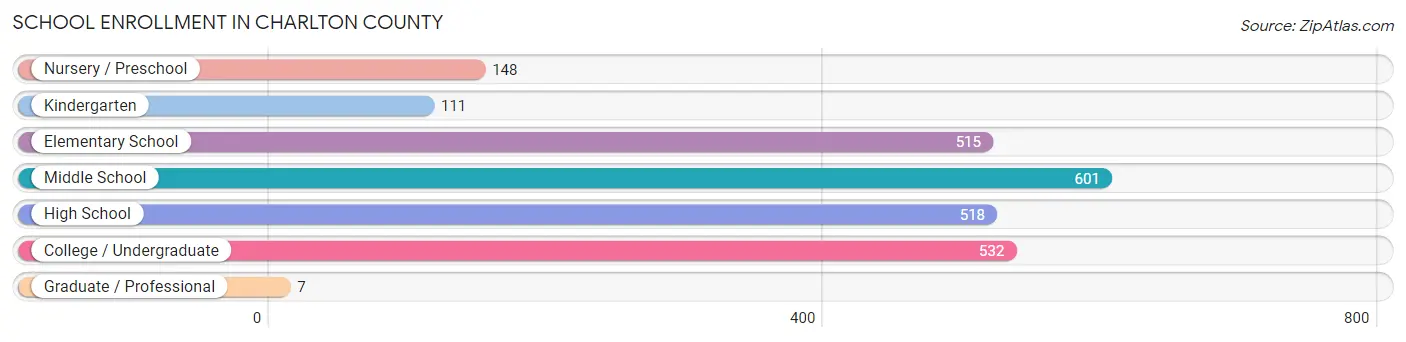
| School Level | # Students | % Students |
| Nursery / Preschool | 148 | 6.1% |
| Kindergarten | 111 | 4.6% |
| Elementary School | 515 | 21.2% |
| Middle School | 601 | 24.7% |
| High School | 518 | 21.3% |
| College / Undergraduate | 532 | 21.9% |
| Graduate / Professional | 7 | 0.3% |
| Total | 2,432 | 100.0% |
School Enrollment by Age by Funding Source in Charlton County
Out of a total of 2,432 students who are enrolled in schools in Charlton County, 197 (8.1%) attend a private institution, while the remaining 2,235 (91.9%) are enrolled in public schools. The age group of 20 to 24 year olds has the highest likelihood of being enrolled in private schools, with 44 (29.9% in the age bracket) enrolled. Conversely, the age group of 3 to 4 year olds has the lowest likelihood of being enrolled in a private school, with 112 (100.0% in the age bracket) attending a public institution.
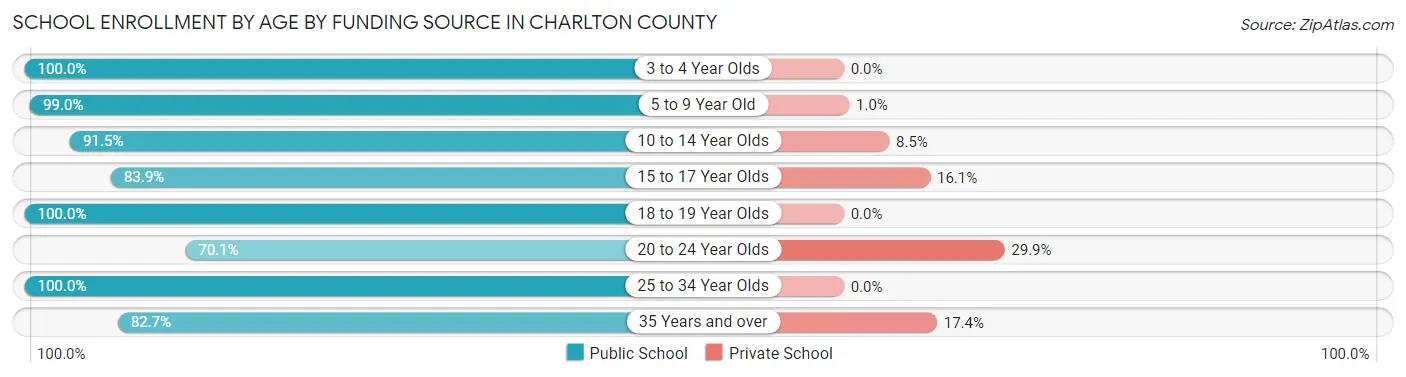
| Age Bracket | Public School | Private School |
| 3 to 4 Year Olds | 112 (100.0%) | 0 (0.0%) |
| 5 to 9 Year Old | 591 (99.0%) | 6 (1.0%) |
| 10 to 14 Year Olds | 595 (91.5%) | 55 (8.5%) |
| 15 to 17 Year Olds | 308 (83.9%) | 59 (16.1%) |
| 18 to 19 Year Olds | 321 (100.0%) | 0 (0.0%) |
| 20 to 24 Year Olds | 103 (70.1%) | 44 (29.9%) |
| 25 to 34 Year Olds | 42 (100.0%) | 0 (0.0%) |
| 35 Years and over | 162 (82.7%) | 34 (17.3%) |
| Total | 2,235 (91.9%) | 197 (8.1%) |
Educational Attainment by Field of Study in Charlton County
Social sciences (332 | 29.0%), science & technology (207 | 18.1%), education (185 | 16.1%), business (149 | 13.0%), and psychology (64 | 5.6%) are the most common fields of study among 1,146 individuals in Charlton County who have obtained a bachelor's degree or higher.
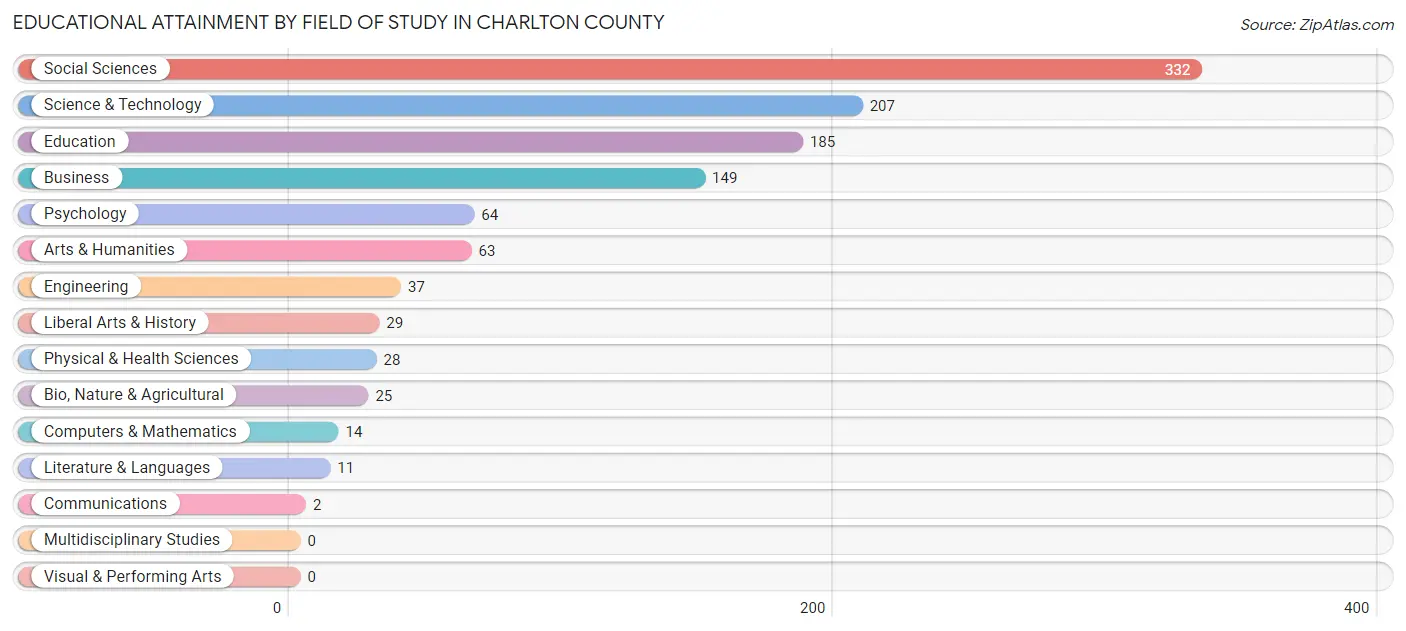
| Field of Study | # Graduates | % Graduates |
| Computers & Mathematics | 14 | 1.2% |
| Bio, Nature & Agricultural | 25 | 2.2% |
| Physical & Health Sciences | 28 | 2.4% |
| Psychology | 64 | 5.6% |
| Social Sciences | 332 | 29.0% |
| Engineering | 37 | 3.2% |
| Multidisciplinary Studies | 0 | 0.0% |
| Science & Technology | 207 | 18.1% |
| Business | 149 | 13.0% |
| Education | 185 | 16.1% |
| Literature & Languages | 11 | 1.0% |
| Liberal Arts & History | 29 | 2.5% |
| Visual & Performing Arts | 0 | 0.0% |
| Communications | 2 | 0.2% |
| Arts & Humanities | 63 | 5.5% |
| Total | 1,146 | 100.0% |
Transportation & Commute in Charlton County
Vehicle Availability by Sex in Charlton County
The most prevalent vehicle ownership categories in Charlton County are males with 2 vehicles (1,078, accounting for 32.8%) and females with 2 vehicles (553, making up 64.4%).
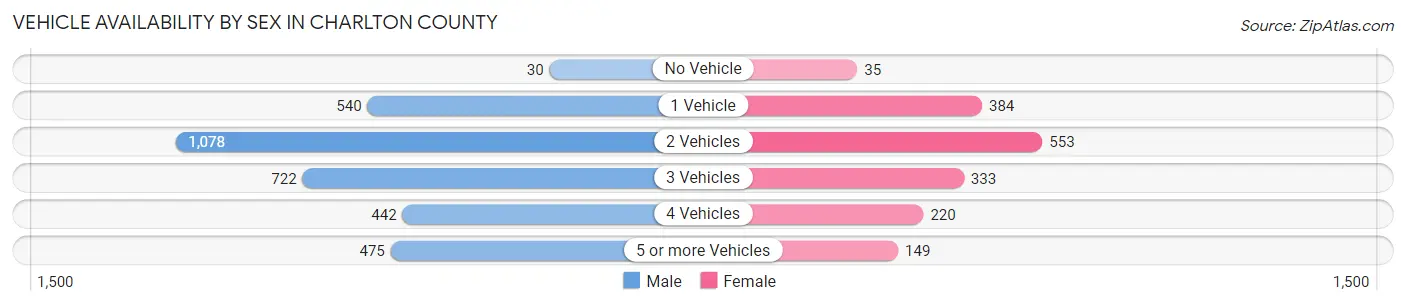
| Vehicles Available | Male | Female |
| No Vehicle | 30 (0.9%) | 35 (2.1%) |
| 1 Vehicle | 540 (16.4%) | 384 (22.9%) |
| 2 Vehicles | 1,078 (32.8%) | 553 (33.0%) |
| 3 Vehicles | 722 (22.0%) | 333 (19.9%) |
| 4 Vehicles | 442 (13.5%) | 220 (13.1%) |
| 5 or more Vehicles | 475 (14.4%) | 149 (8.9%) |
| Total | 3,287 (100.0%) | 1,674 (100.0%) |
Commute Time in Charlton County
The most frequently occuring commute durations in Charlton County are 10 to 14 minutes (820 commuters, 16.8%), 5 to 9 minutes (771 commuters, 15.8%), and 45 to 59 minutes (722 commuters, 14.8%).
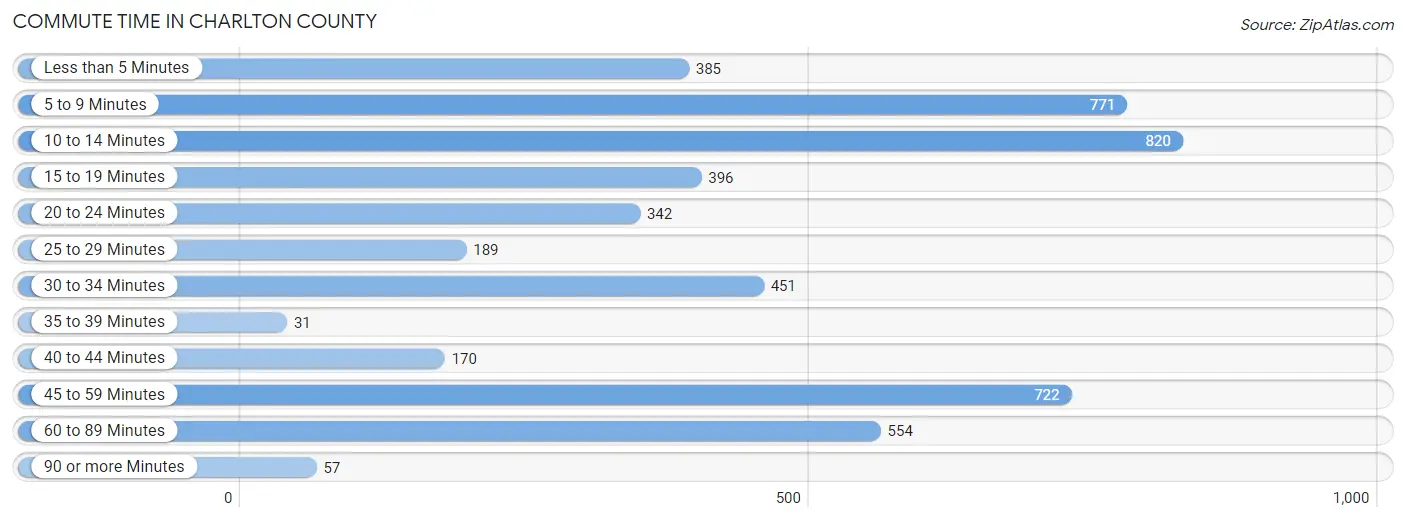
| Commute Time | # Commuters | % Commuters |
| Less than 5 Minutes | 385 | 7.9% |
| 5 to 9 Minutes | 771 | 15.8% |
| 10 to 14 Minutes | 820 | 16.8% |
| 15 to 19 Minutes | 396 | 8.1% |
| 20 to 24 Minutes | 342 | 7.0% |
| 25 to 29 Minutes | 189 | 3.9% |
| 30 to 34 Minutes | 451 | 9.2% |
| 35 to 39 Minutes | 31 | 0.6% |
| 40 to 44 Minutes | 170 | 3.5% |
| 45 to 59 Minutes | 722 | 14.8% |
| 60 to 89 Minutes | 554 | 11.3% |
| 90 or more Minutes | 57 | 1.2% |
Commute Time by Sex in Charlton County
The most common commute times in Charlton County are 45 to 59 minutes (634 commuters, 19.4%) for males and 5 to 9 minutes (355 commuters, 21.9%) for females.
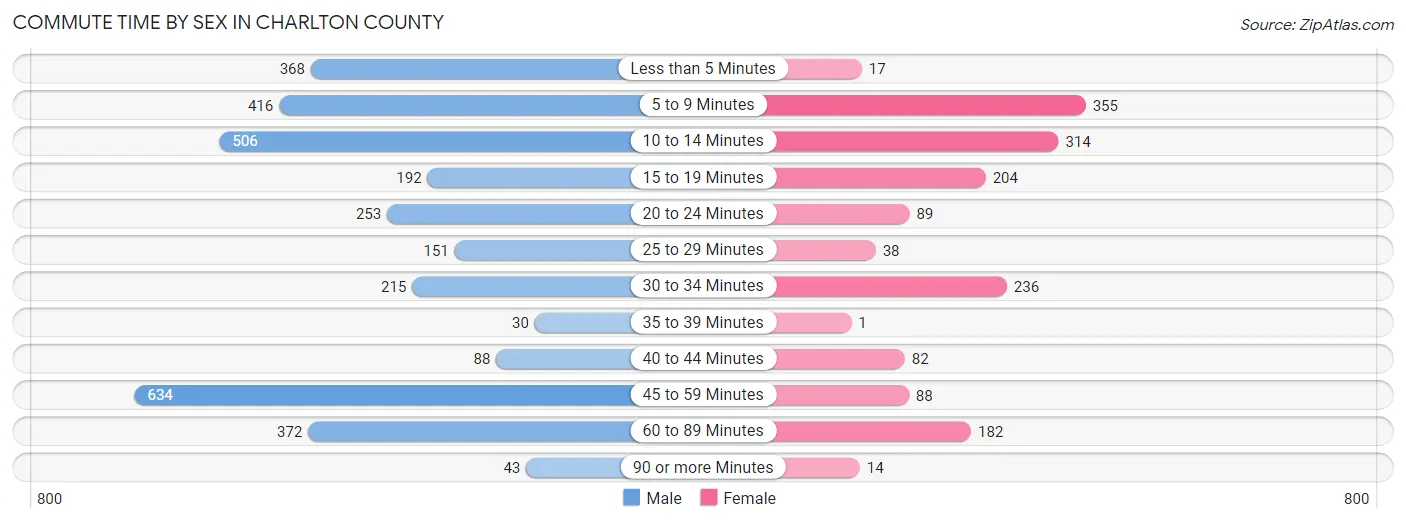
| Commute Time | Male | Female |
| Less than 5 Minutes | 368 (11.3%) | 17 (1.1%) |
| 5 to 9 Minutes | 416 (12.7%) | 355 (21.9%) |
| 10 to 14 Minutes | 506 (15.5%) | 314 (19.4%) |
| 15 to 19 Minutes | 192 (5.9%) | 204 (12.6%) |
| 20 to 24 Minutes | 253 (7.7%) | 89 (5.5%) |
| 25 to 29 Minutes | 151 (4.6%) | 38 (2.4%) |
| 30 to 34 Minutes | 215 (6.6%) | 236 (14.6%) |
| 35 to 39 Minutes | 30 (0.9%) | 1 (0.1%) |
| 40 to 44 Minutes | 88 (2.7%) | 82 (5.1%) |
| 45 to 59 Minutes | 634 (19.4%) | 88 (5.4%) |
| 60 to 89 Minutes | 372 (11.4%) | 182 (11.2%) |
| 90 or more Minutes | 43 (1.3%) | 14 (0.9%) |
Time of Departure to Work by Sex in Charlton County
The most frequent times of departure to work in Charlton County are 7:00 AM to 7:29 AM (564, 17.3%) for males and 7:00 AM to 7:29 AM (352, 21.7%) for females.
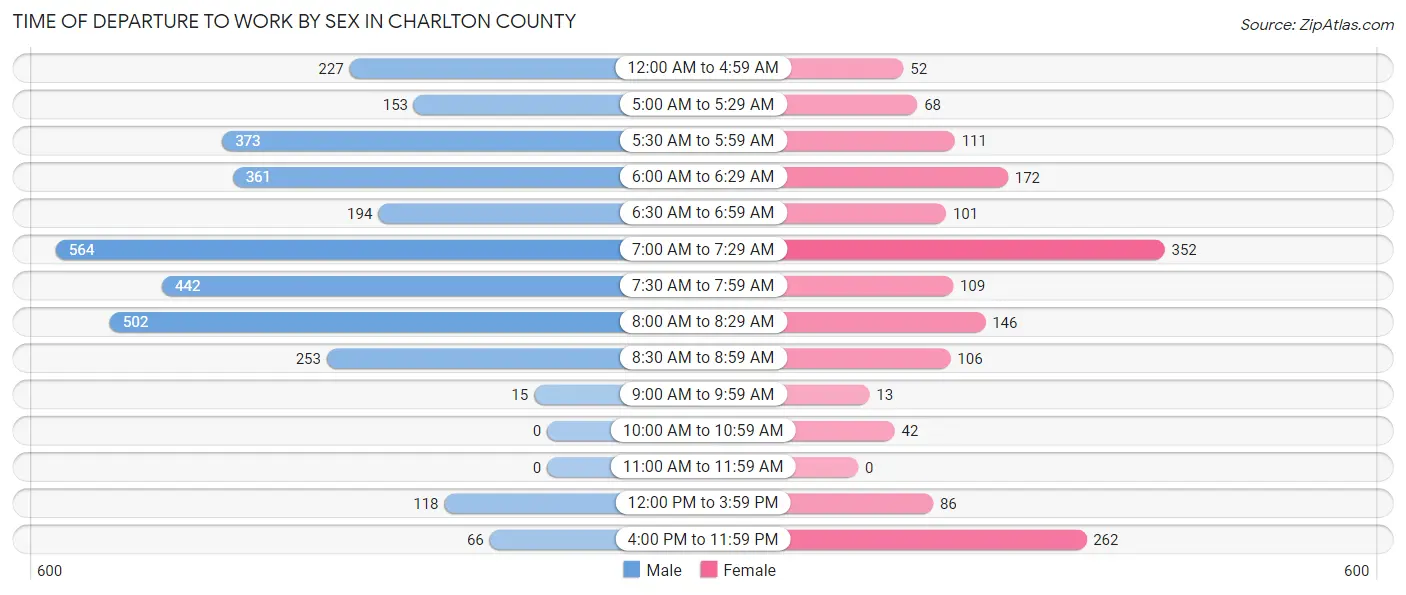
| Time of Departure | Male | Female |
| 12:00 AM to 4:59 AM | 227 (7.0%) | 52 (3.2%) |
| 5:00 AM to 5:29 AM | 153 (4.7%) | 68 (4.2%) |
| 5:30 AM to 5:59 AM | 373 (11.4%) | 111 (6.9%) |
| 6:00 AM to 6:29 AM | 361 (11.1%) | 172 (10.6%) |
| 6:30 AM to 6:59 AM | 194 (5.9%) | 101 (6.2%) |
| 7:00 AM to 7:29 AM | 564 (17.3%) | 352 (21.7%) |
| 7:30 AM to 7:59 AM | 442 (13.5%) | 109 (6.7%) |
| 8:00 AM to 8:29 AM | 502 (15.4%) | 146 (9.0%) |
| 8:30 AM to 8:59 AM | 253 (7.7%) | 106 (6.5%) |
| 9:00 AM to 9:59 AM | 15 (0.5%) | 13 (0.8%) |
| 10:00 AM to 10:59 AM | 0 (0.0%) | 42 (2.6%) |
| 11:00 AM to 11:59 AM | 0 (0.0%) | 0 (0.0%) |
| 12:00 PM to 3:59 PM | 118 (3.6%) | 86 (5.3%) |
| 4:00 PM to 11:59 PM | 66 (2.0%) | 262 (16.2%) |
| Total | 3,268 (100.0%) | 1,620 (100.0%) |
Housing Occupancy in Charlton County
Occupancy by Ownership in Charlton County
Of the total 4,043 dwellings in Charlton County, owner-occupied units account for 2,989 (73.9%), while renter-occupied units make up 1,054 (26.1%).
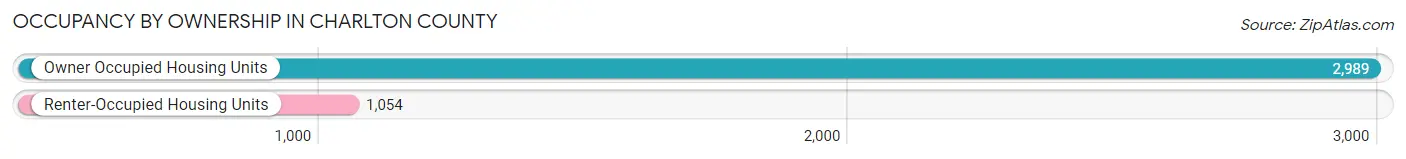
| Occupancy | # Housing Units | % Housing Units |
| Owner Occupied Housing Units | 2,989 | 73.9% |
| Renter-Occupied Housing Units | 1,054 | 26.1% |
| Total Occupied Housing Units | 4,043 | 100.0% |
Occupancy by Household Size in Charlton County
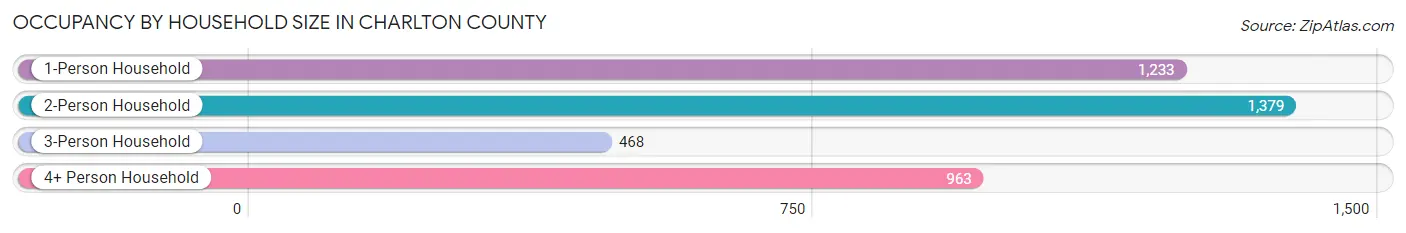
| Household Size | # Housing Units | % Housing Units |
| 1-Person Household | 1,233 | 30.5% |
| 2-Person Household | 1,379 | 34.1% |
| 3-Person Household | 468 | 11.6% |
| 4+ Person Household | 963 | 23.8% |
| Total Housing Units | 4,043 | 100.0% |
Occupancy by Ownership by Household Size in Charlton County
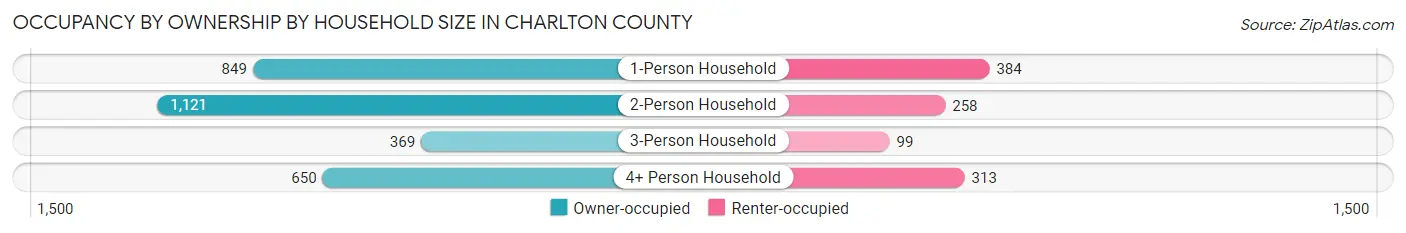
| Household Size | Owner-occupied | Renter-occupied |
| 1-Person Household | 849 (68.9%) | 384 (31.1%) |
| 2-Person Household | 1,121 (81.3%) | 258 (18.7%) |
| 3-Person Household | 369 (78.8%) | 99 (21.1%) |
| 4+ Person Household | 650 (67.5%) | 313 (32.5%) |
| Total Housing Units | 2,989 (73.9%) | 1,054 (26.1%) |
Occupancy by Educational Attainment in Charlton County
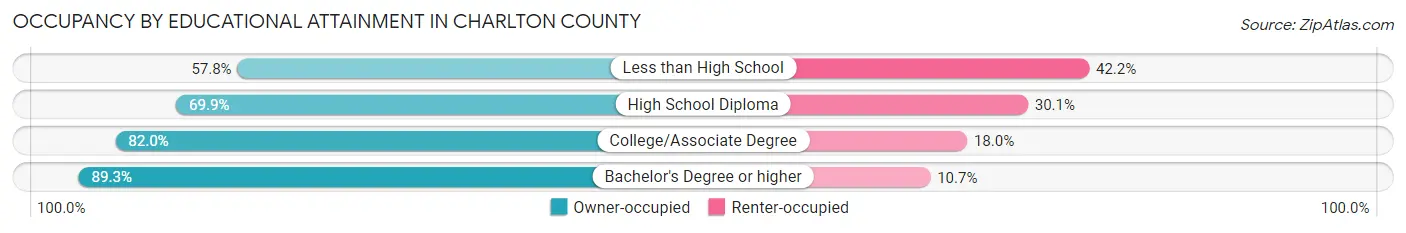
| Household Size | Owner-occupied | Renter-occupied |
| Less than High School | 337 (57.8%) | 246 (42.2%) |
| High School Diploma | 1,231 (69.9%) | 529 (30.1%) |
| College/Associate Degree | 1,088 (82.0%) | 239 (18.0%) |
| Bachelor's Degree or higher | 333 (89.3%) | 40 (10.7%) |
Occupancy by Age of Householder in Charlton County
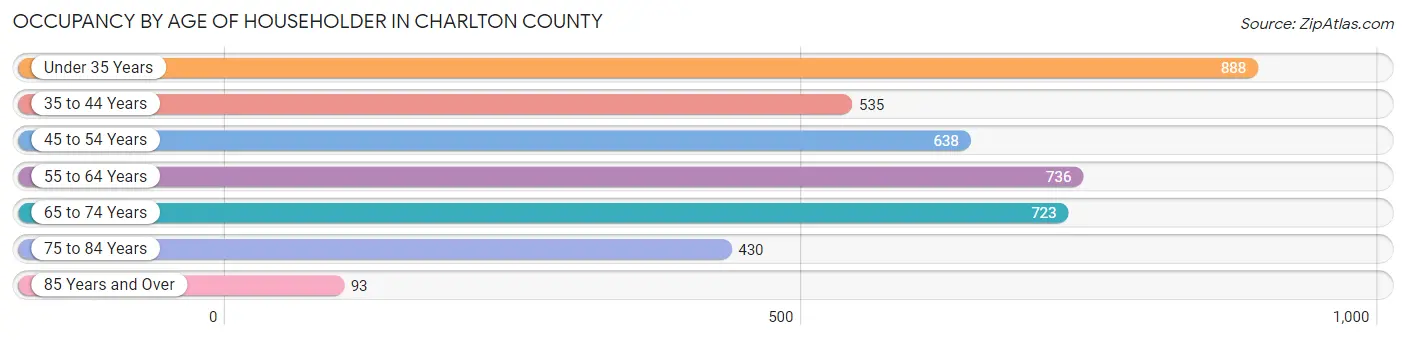
| Age Bracket | # Households | % Households |
| Under 35 Years | 888 | 22.0% |
| 35 to 44 Years | 535 | 13.2% |
| 45 to 54 Years | 638 | 15.8% |
| 55 to 64 Years | 736 | 18.2% |
| 65 to 74 Years | 723 | 17.9% |
| 75 to 84 Years | 430 | 10.6% |
| 85 Years and Over | 93 | 2.3% |
| Total | 4,043 | 100.0% |
Housing Finances in Charlton County
Median Income by Occupancy in Charlton County
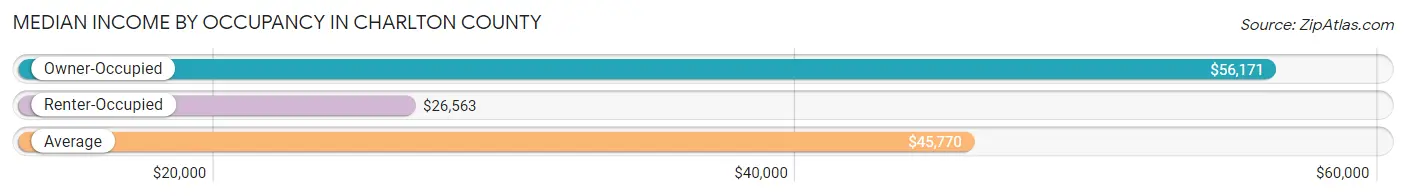
| Occupancy Type | # Households | Median Income |
| Owner-Occupied | 2,989 (73.9%) | $56,171 |
| Renter-Occupied | 1,054 (26.1%) | $26,563 |
| Average | 4,043 (100.0%) | $45,770 |
Occupancy by Householder Income Bracket in Charlton County
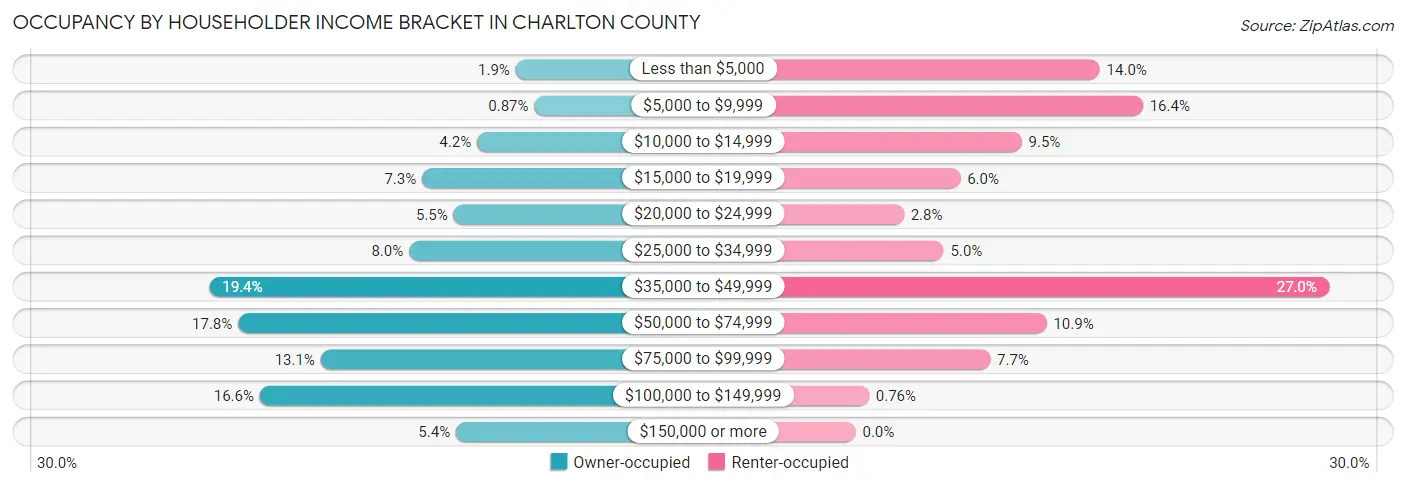
| Income Bracket | Owner-occupied | Renter-occupied |
| Less than $5,000 | 58 (1.9%) | 147 (14.0%) |
| $5,000 to $9,999 | 26 (0.9%) | 173 (16.4%) |
| $10,000 to $14,999 | 124 (4.2%) | 100 (9.5%) |
| $15,000 to $19,999 | 218 (7.3%) | 63 (6.0%) |
| $20,000 to $24,999 | 164 (5.5%) | 29 (2.8%) |
| $25,000 to $34,999 | 240 (8.0%) | 53 (5.0%) |
| $35,000 to $49,999 | 581 (19.4%) | 285 (27.0%) |
| $50,000 to $74,999 | 532 (17.8%) | 115 (10.9%) |
| $75,000 to $99,999 | 391 (13.1%) | 81 (7.7%) |
| $100,000 to $149,999 | 495 (16.6%) | 8 (0.8%) |
| $150,000 or more | 160 (5.3%) | 0 (0.0%) |
| Total | 2,989 (100.0%) | 1,054 (100.0%) |
Monthly Housing Cost Tiers in Charlton County
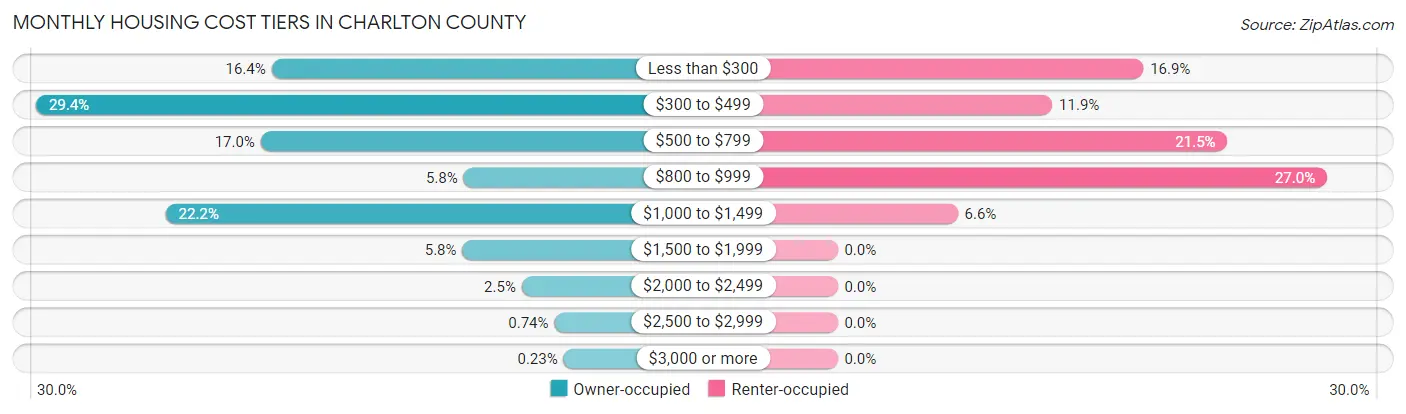
| Monthly Cost | Owner-occupied | Renter-occupied |
| Less than $300 | 489 (16.4%) | 178 (16.9%) |
| $300 to $499 | 878 (29.4%) | 125 (11.9%) |
| $500 to $799 | 507 (17.0%) | 227 (21.5%) |
| $800 to $999 | 172 (5.8%) | 285 (27.0%) |
| $1,000 to $1,499 | 664 (22.2%) | 70 (6.6%) |
| $1,500 to $1,999 | 174 (5.8%) | 0 (0.0%) |
| $2,000 to $2,499 | 76 (2.5%) | 0 (0.0%) |
| $2,500 to $2,999 | 22 (0.7%) | 0 (0.0%) |
| $3,000 or more | 7 (0.2%) | 0 (0.0%) |
| Total | 2,989 (100.0%) | 1,054 (100.0%) |
Physical Housing Characteristics in Charlton County
Housing Structures in Charlton County
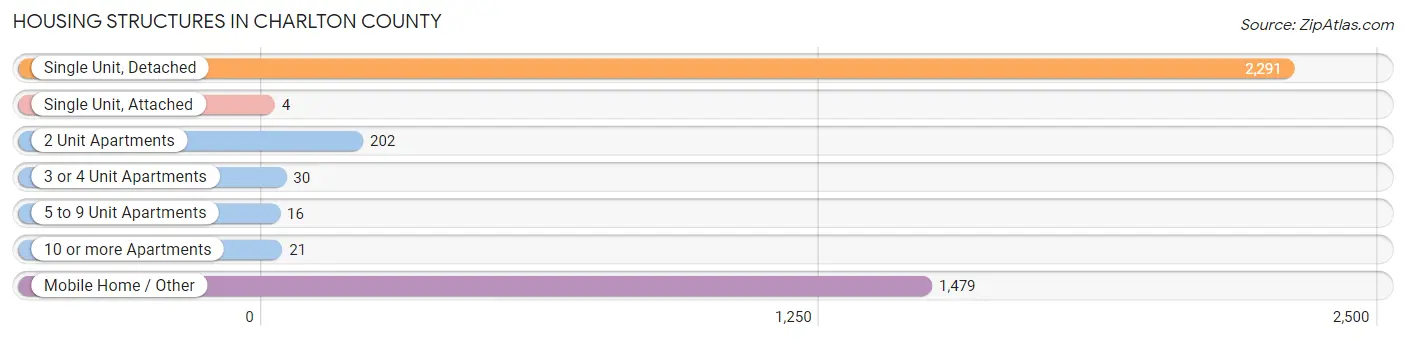
| Structure Type | # Housing Units | % Housing Units |
| Single Unit, Detached | 2,291 | 56.7% |
| Single Unit, Attached | 4 | 0.1% |
| 2 Unit Apartments | 202 | 5.0% |
| 3 or 4 Unit Apartments | 30 | 0.7% |
| 5 to 9 Unit Apartments | 16 | 0.4% |
| 10 or more Apartments | 21 | 0.5% |
| Mobile Home / Other | 1,479 | 36.6% |
| Total | 4,043 | 100.0% |
Housing Structures by Occupancy in Charlton County
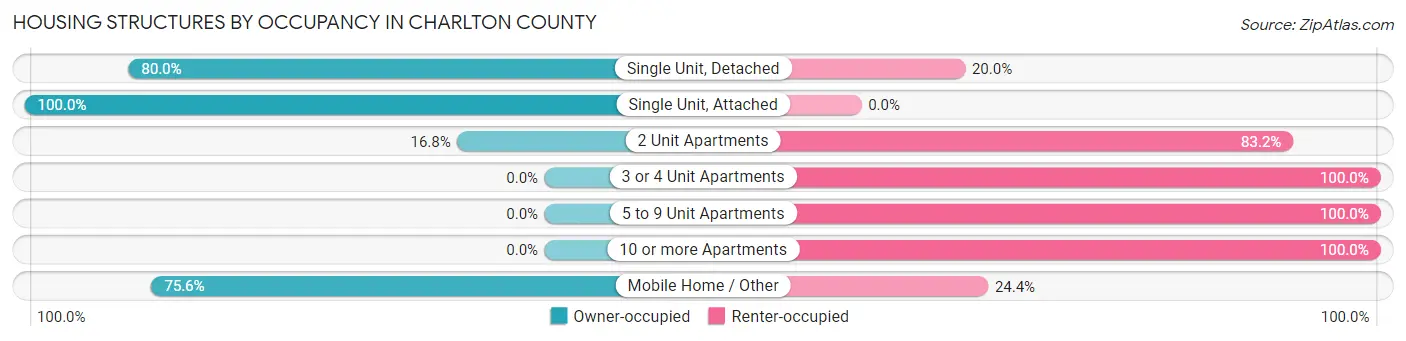
| Structure Type | Owner-occupied | Renter-occupied |
| Single Unit, Detached | 1,833 (80.0%) | 458 (20.0%) |
| Single Unit, Attached | 4 (100.0%) | 0 (0.0%) |
| 2 Unit Apartments | 34 (16.8%) | 168 (83.2%) |
| 3 or 4 Unit Apartments | 0 (0.0%) | 30 (100.0%) |
| 5 to 9 Unit Apartments | 0 (0.0%) | 16 (100.0%) |
| 10 or more Apartments | 0 (0.0%) | 21 (100.0%) |
| Mobile Home / Other | 1,118 (75.6%) | 361 (24.4%) |
| Total | 2,989 (73.9%) | 1,054 (26.1%) |
Housing Structures by Number of Rooms in Charlton County
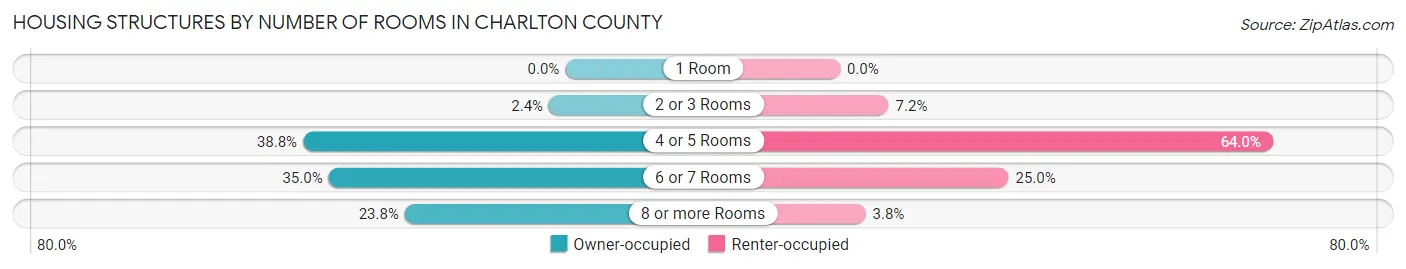
| Number of Rooms | Owner-occupied | Renter-occupied |
| 1 Room | 0 (0.0%) | 0 (0.0%) |
| 2 or 3 Rooms | 72 (2.4%) | 76 (7.2%) |
| 4 or 5 Rooms | 1,160 (38.8%) | 675 (64.0%) |
| 6 or 7 Rooms | 1,047 (35.0%) | 263 (24.9%) |
| 8 or more Rooms | 710 (23.7%) | 40 (3.8%) |
| Total | 2,989 (100.0%) | 1,054 (100.0%) |
Housing Structure by Heating Type in Charlton County
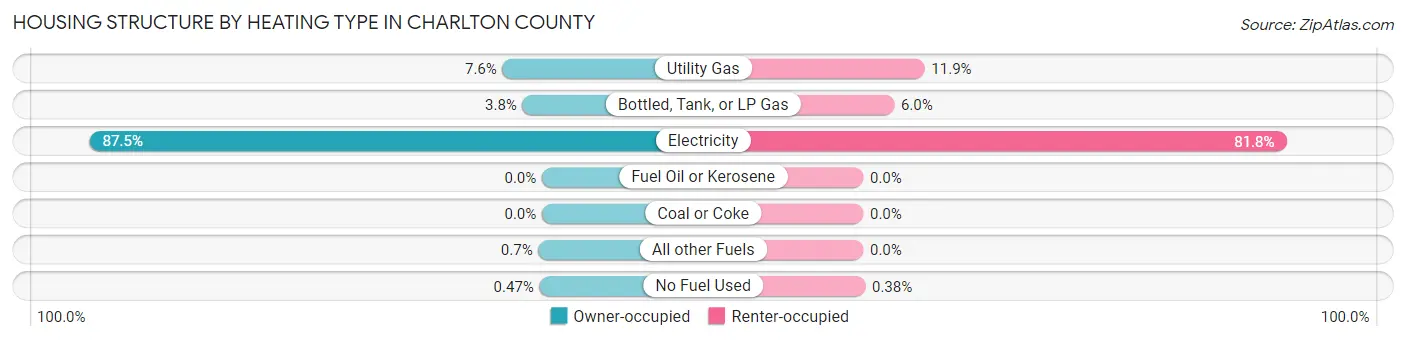
| Heating Type | Owner-occupied | Renter-occupied |
| Utility Gas | 228 (7.6%) | 125 (11.9%) |
| Bottled, Tank, or LP Gas | 112 (3.7%) | 63 (6.0%) |
| Electricity | 2,614 (87.5%) | 862 (81.8%) |
| Fuel Oil or Kerosene | 0 (0.0%) | 0 (0.0%) |
| Coal or Coke | 0 (0.0%) | 0 (0.0%) |
| All other Fuels | 21 (0.7%) | 0 (0.0%) |
| No Fuel Used | 14 (0.5%) | 4 (0.4%) |
| Total | 2,989 (100.0%) | 1,054 (100.0%) |
Household Vehicle Usage in Charlton County
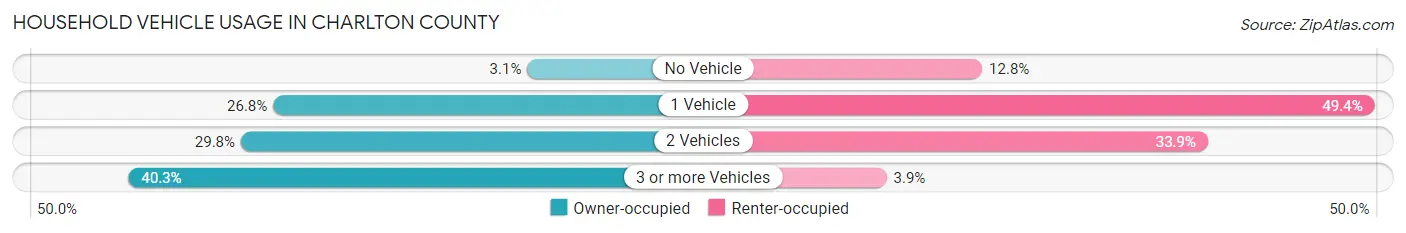
| Vehicles per Household | Owner-occupied | Renter-occupied |
| No Vehicle | 92 (3.1%) | 135 (12.8%) |
| 1 Vehicle | 801 (26.8%) | 521 (49.4%) |
| 2 Vehicles | 891 (29.8%) | 357 (33.9%) |
| 3 or more Vehicles | 1,205 (40.3%) | 41 (3.9%) |
| Total | 2,989 (100.0%) | 1,054 (100.0%) |
Real Estate & Mortgages in Charlton County
Real Estate and Mortgage Overview in Charlton County
| Characteristic | Without Mortgage | With Mortgage |
| Housing Units | 1,770 | 1,219 |
| Median Property Value | $79,800 | $158,000 |
| Median Household Income | $49,181 | $126 |
| Monthly Housing Costs | $401 | $7 |
| Real Estate Taxes | $860 | $134 |
Property Value by Mortgage Status in Charlton County
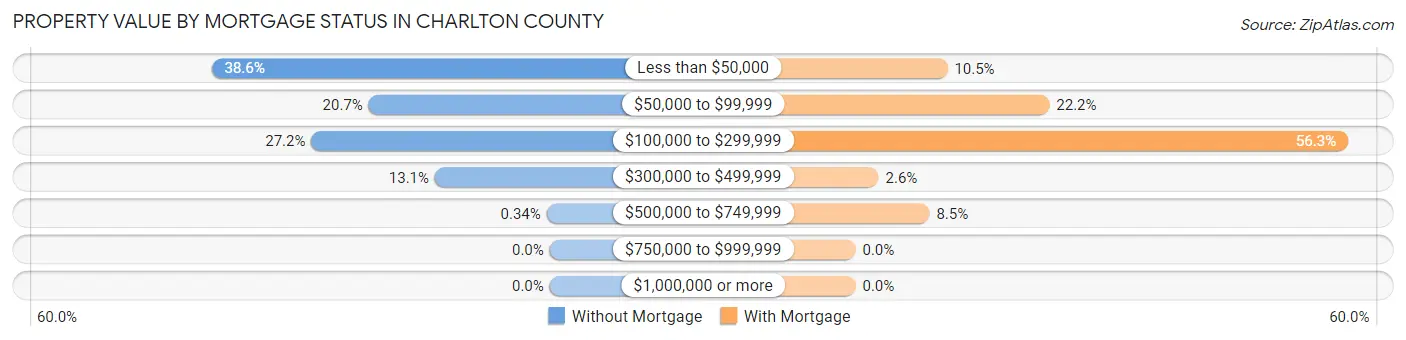
| Property Value | Without Mortgage | With Mortgage |
| Less than $50,000 | 684 (38.6%) | 128 (10.5%) |
| $50,000 to $99,999 | 366 (20.7%) | 270 (22.2%) |
| $100,000 to $299,999 | 482 (27.2%) | 686 (56.3%) |
| $300,000 to $499,999 | 232 (13.1%) | 32 (2.6%) |
| $500,000 to $749,999 | 6 (0.3%) | 103 (8.5%) |
| $750,000 to $999,999 | 0 (0.0%) | 0 (0.0%) |
| $1,000,000 or more | 0 (0.0%) | 0 (0.0%) |
| Total | 1,770 (100.0%) | 1,219 (100.0%) |
Household Income by Mortgage Status in Charlton County
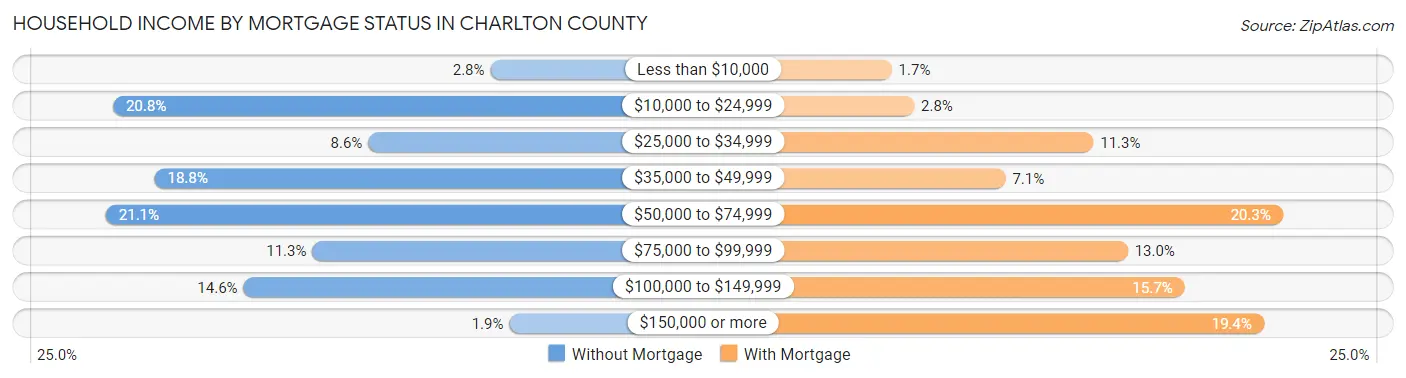
| Household Income | Without Mortgage | With Mortgage |
| Less than $10,000 | 50 (2.8%) | 21 (1.7%) |
| $10,000 to $24,999 | 368 (20.8%) | 34 (2.8%) |
| $25,000 to $34,999 | 153 (8.6%) | 138 (11.3%) |
| $35,000 to $49,999 | 333 (18.8%) | 87 (7.1%) |
| $50,000 to $74,999 | 374 (21.1%) | 248 (20.3%) |
| $75,000 to $99,999 | 200 (11.3%) | 158 (13.0%) |
| $100,000 to $149,999 | 258 (14.6%) | 191 (15.7%) |
| $150,000 or more | 34 (1.9%) | 237 (19.4%) |
| Total | 1,770 (100.0%) | 1,219 (100.0%) |
Property Value to Household Income Ratio in Charlton County
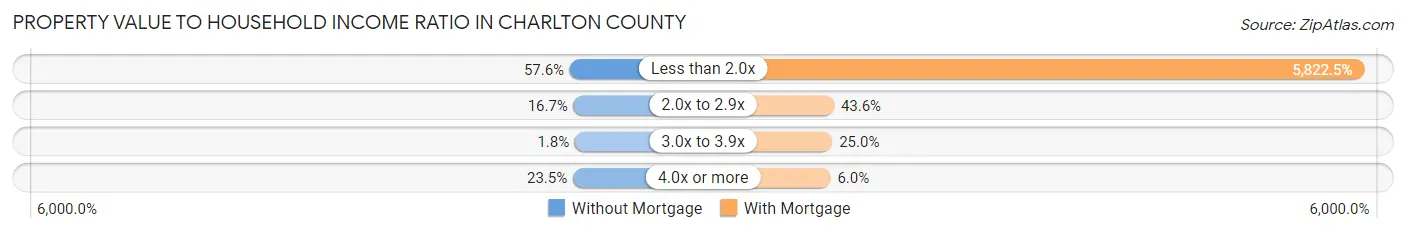
| Value-to-Income Ratio | Without Mortgage | With Mortgage |
| Less than 2.0x | 1,020 (57.6%) | 70,976 (5,822.5%) |
| 2.0x to 2.9x | 296 (16.7%) | 532 (43.6%) |
| 3.0x to 3.9x | 32 (1.8%) | 305 (25.0%) |
| 4.0x or more | 416 (23.5%) | 73 (6.0%) |
| Total | 1,770 (100.0%) | 1,219 (100.0%) |
Real Estate Taxes by Mortgage Status in Charlton County
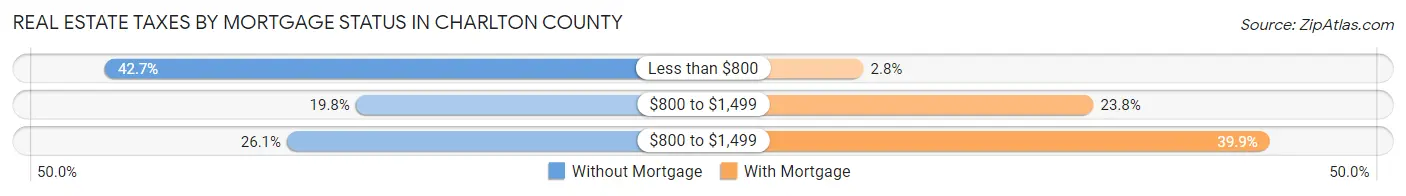
| Property Taxes | Without Mortgage | With Mortgage |
| Less than $800 | 755 (42.7%) | 34 (2.8%) |
| $800 to $1,499 | 350 (19.8%) | 290 (23.8%) |
| $800 to $1,499 | 461 (26.1%) | 486 (39.9%) |
| Total | 1,770 (100.0%) | 1,219 (100.0%) |
Health & Disability in Charlton County
Health Insurance Coverage by Age in Charlton County
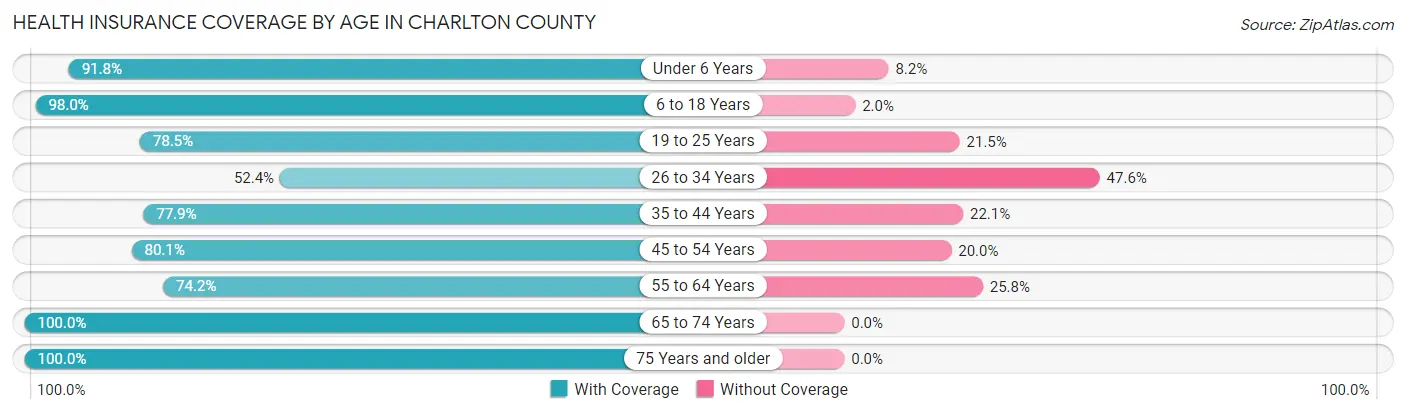
| Age Bracket | With Coverage | Without Coverage |
| Under 6 Years | 646 (91.8%) | 58 (8.2%) |
| 6 to 18 Years | 1,934 (98.0%) | 40 (2.0%) |
| 19 to 25 Years | 712 (78.5%) | 195 (21.5%) |
| 26 to 34 Years | 892 (52.4%) | 811 (47.6%) |
| 35 to 44 Years | 1,104 (77.9%) | 314 (22.1%) |
| 45 to 54 Years | 1,276 (80.0%) | 318 (20.0%) |
| 55 to 64 Years | 1,057 (74.2%) | 368 (25.8%) |
| 65 to 74 Years | 1,115 (100.0%) | 0 (0.0%) |
| 75 Years and older | 849 (100.0%) | 0 (0.0%) |
| Total | 9,585 (82.0%) | 2,104 (18.0%) |
Health Insurance Coverage by Citizenship Status in Charlton County
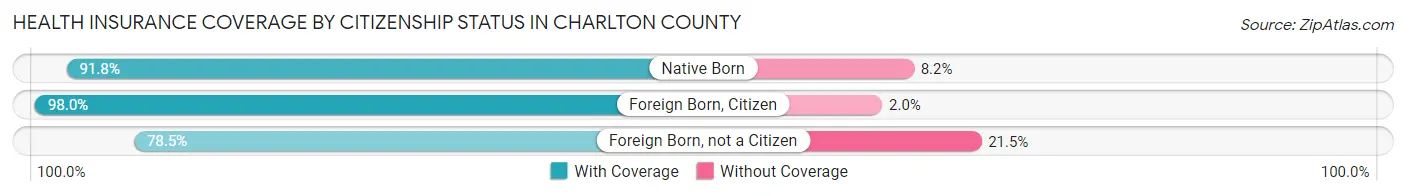
| Citizenship Status | With Coverage | Without Coverage |
| Native Born | 646 (91.8%) | 58 (8.2%) |
| Foreign Born, Citizen | 1,934 (98.0%) | 40 (2.0%) |
| Foreign Born, not a Citizen | 712 (78.5%) | 195 (21.5%) |
Health Insurance Coverage by Household Income in Charlton County
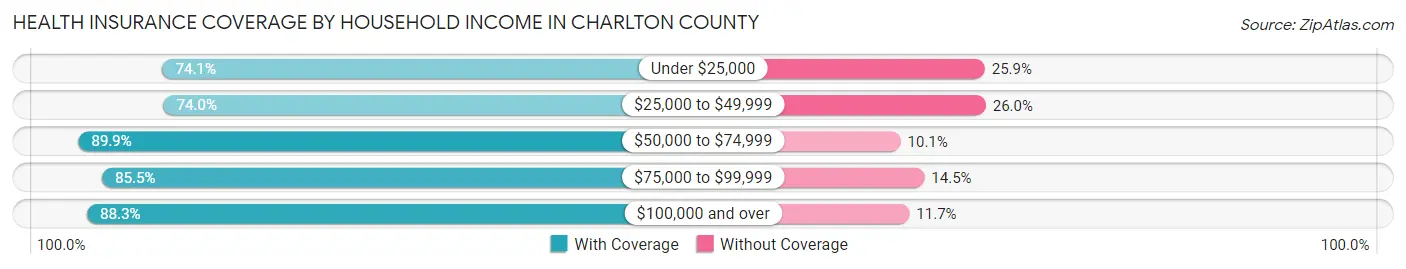
| Household Income | With Coverage | Without Coverage |
| Under $25,000 | 1,783 (74.1%) | 622 (25.9%) |
| $25,000 to $49,999 | 1,954 (74.0%) | 688 (26.0%) |
| $50,000 to $74,999 | 1,900 (89.9%) | 213 (10.1%) |
| $75,000 to $99,999 | 1,511 (85.5%) | 257 (14.5%) |
| $100,000 and over | 2,437 (88.3%) | 324 (11.7%) |
Public vs Private Health Insurance Coverage by Age in Charlton County
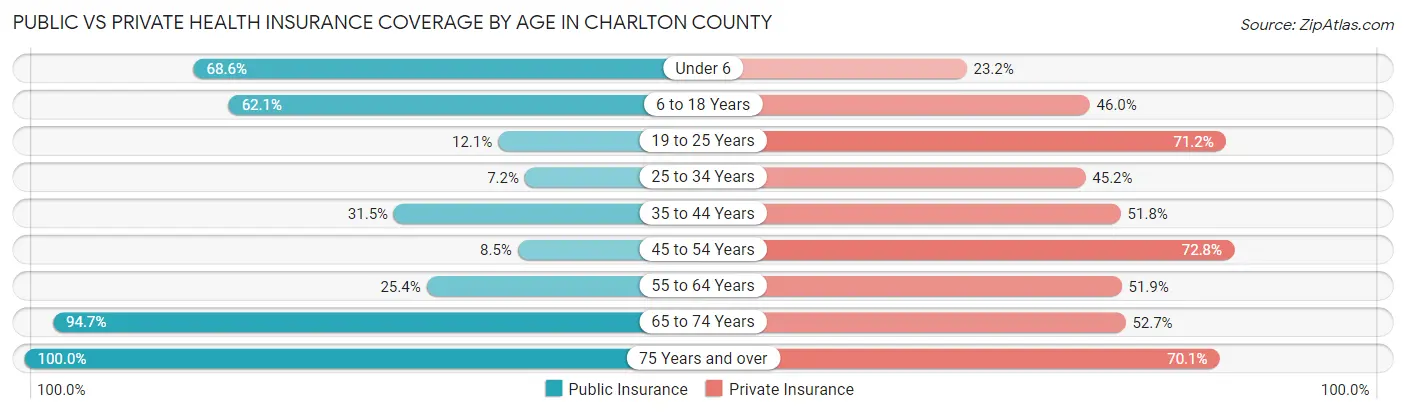
| Age Bracket | Public Insurance | Private Insurance |
| Under 6 | 483 (68.6%) | 163 (23.2%) |
| 6 to 18 Years | 1,226 (62.1%) | 908 (46.0%) |
| 19 to 25 Years | 110 (12.1%) | 646 (71.2%) |
| 25 to 34 Years | 122 (7.2%) | 770 (45.2%) |
| 35 to 44 Years | 446 (31.5%) | 734 (51.8%) |
| 45 to 54 Years | 135 (8.5%) | 1,160 (72.8%) |
| 55 to 64 Years | 362 (25.4%) | 740 (51.9%) |
| 65 to 74 Years | 1,056 (94.7%) | 587 (52.6%) |
| 75 Years and over | 849 (100.0%) | 595 (70.1%) |
| Total | 4,789 (41.0%) | 6,303 (53.9%) |
Disability Status by Sex by Age in Charlton County
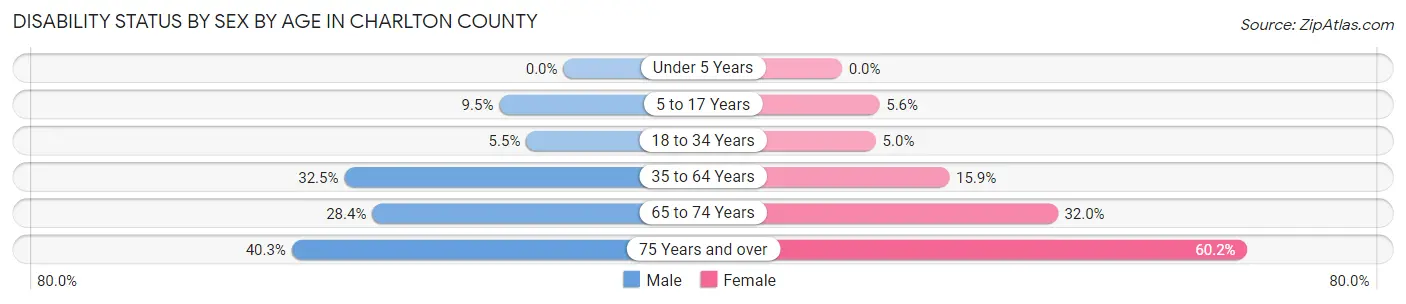
| Age Bracket | Male | Female |
| Under 5 Years | 0 (0.0%) | 0 (0.0%) |
| 5 to 17 Years | 80 (9.5%) | 49 (5.6%) |
| 18 to 34 Years | 108 (5.5%) | 52 (5.0%) |
| 35 to 64 Years | 822 (32.5%) | 304 (15.9%) |
| 65 to 74 Years | 172 (28.4%) | 163 (32.0%) |
| 75 Years and over | 167 (40.3%) | 262 (60.2%) |
Disability Class by Sex by Age in Charlton County
Disability Class: Hearing Difficulty
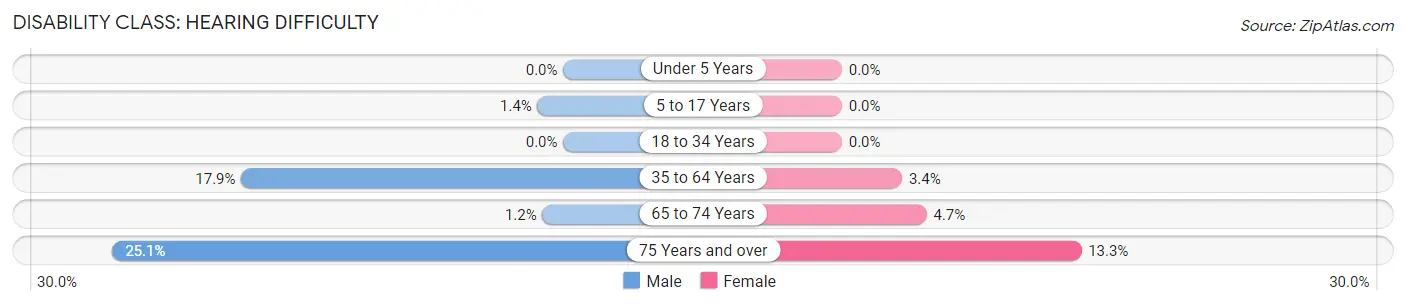
| Age Bracket | Male | Female |
| Under 5 Years | 0 (0.0%) | 0 (0.0%) |
| 5 to 17 Years | 12 (1.4%) | 0 (0.0%) |
| 18 to 34 Years | 0 (0.0%) | 0 (0.0%) |
| 35 to 64 Years | 453 (17.9%) | 64 (3.4%) |
| 65 to 74 Years | 7 (1.2%) | 24 (4.7%) |
| 75 Years and over | 104 (25.1%) | 58 (13.3%) |
Disability Class: Vision Difficulty
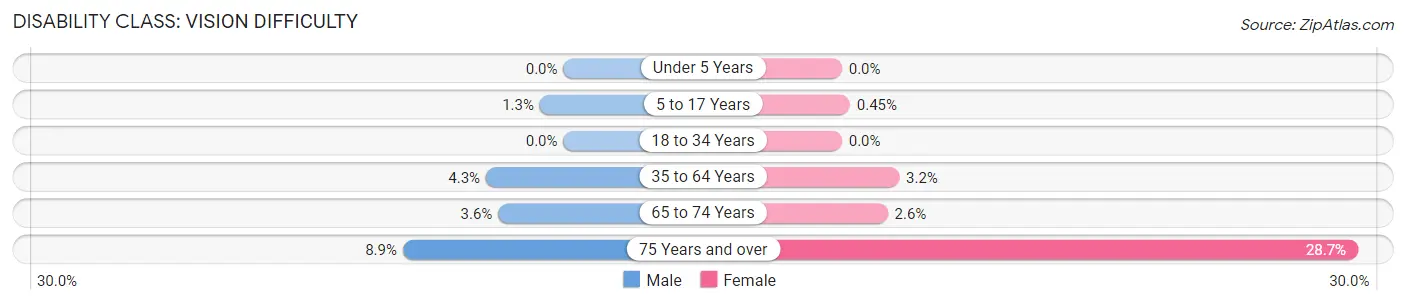
| Age Bracket | Male | Female |
| Under 5 Years | 0 (0.0%) | 0 (0.0%) |
| 5 to 17 Years | 11 (1.3%) | 4 (0.4%) |
| 18 to 34 Years | 0 (0.0%) | 0 (0.0%) |
| 35 to 64 Years | 109 (4.3%) | 61 (3.2%) |
| 65 to 74 Years | 22 (3.6%) | 13 (2.5%) |
| 75 Years and over | 37 (8.9%) | 125 (28.7%) |
Disability Class: Cognitive Difficulty
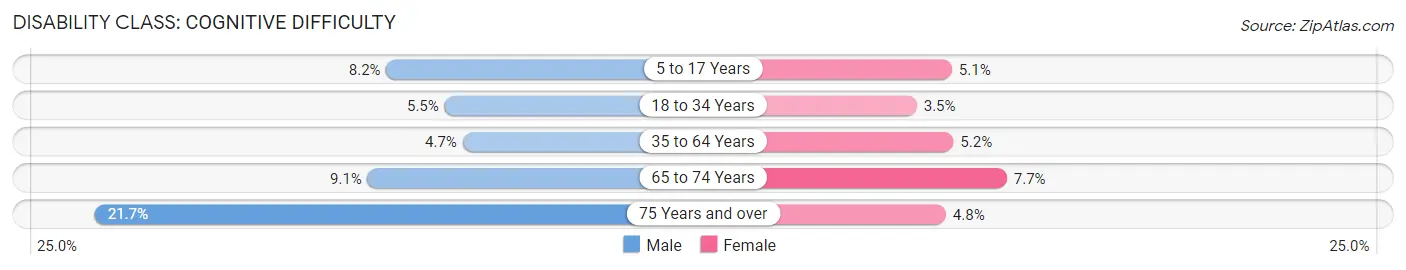
| Age Bracket | Male | Female |
| 5 to 17 Years | 69 (8.2%) | 45 (5.1%) |
| 18 to 34 Years | 108 (5.5%) | 36 (3.5%) |
| 35 to 64 Years | 118 (4.7%) | 99 (5.2%) |
| 65 to 74 Years | 55 (9.1%) | 39 (7.7%) |
| 75 Years and over | 90 (21.7%) | 21 (4.8%) |
Disability Class: Ambulatory Difficulty
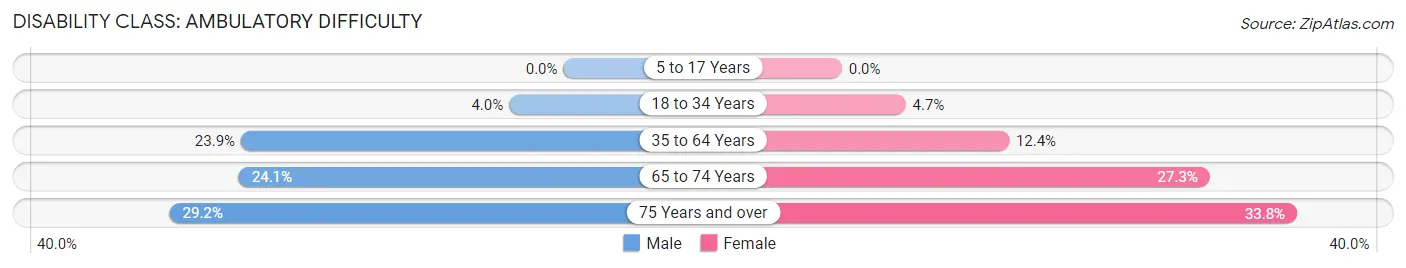
| Age Bracket | Male | Female |
| 5 to 17 Years | 0 (0.0%) | 0 (0.0%) |
| 18 to 34 Years | 79 (4.0%) | 49 (4.7%) |
| 35 to 64 Years | 605 (23.9%) | 237 (12.4%) |
| 65 to 74 Years | 146 (24.1%) | 139 (27.3%) |
| 75 Years and over | 121 (29.2%) | 147 (33.8%) |
Disability Class: Self-Care Difficulty
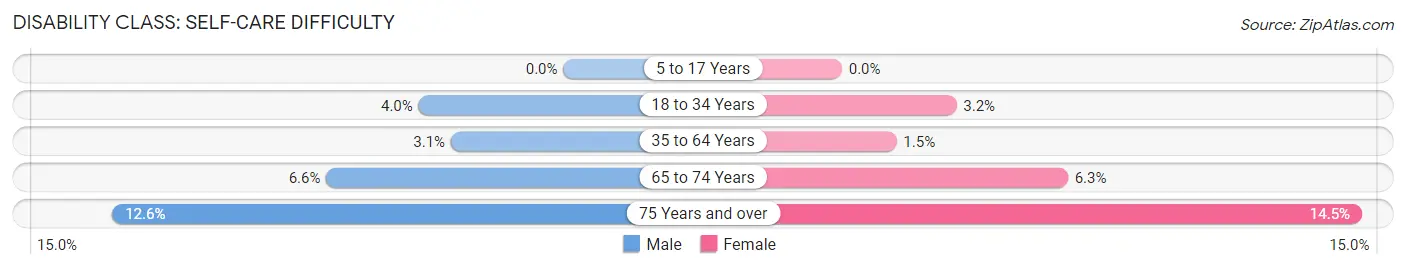
| Age Bracket | Male | Female |
| 5 to 17 Years | 0 (0.0%) | 0 (0.0%) |
| 18 to 34 Years | 79 (4.0%) | 33 (3.2%) |
| 35 to 64 Years | 79 (3.1%) | 29 (1.5%) |
| 65 to 74 Years | 40 (6.6%) | 32 (6.3%) |
| 75 Years and over | 52 (12.6%) | 63 (14.5%) |
Technology Access in Charlton County
Computing Device Access in Charlton County
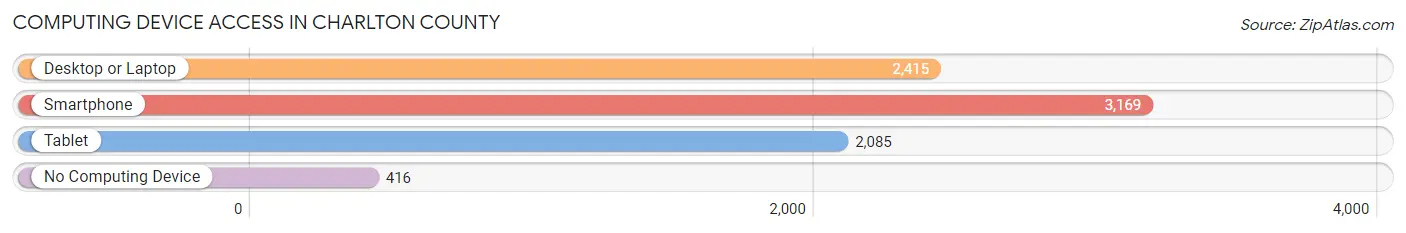
| Device Type | # Households | % Households |
| Desktop or Laptop | 2,415 | 59.7% |
| Smartphone | 3,169 | 78.4% |
| Tablet | 2,085 | 51.6% |
| No Computing Device | 416 | 10.3% |
| Total | 4,043 | 100.0% |
Internet Access in Charlton County
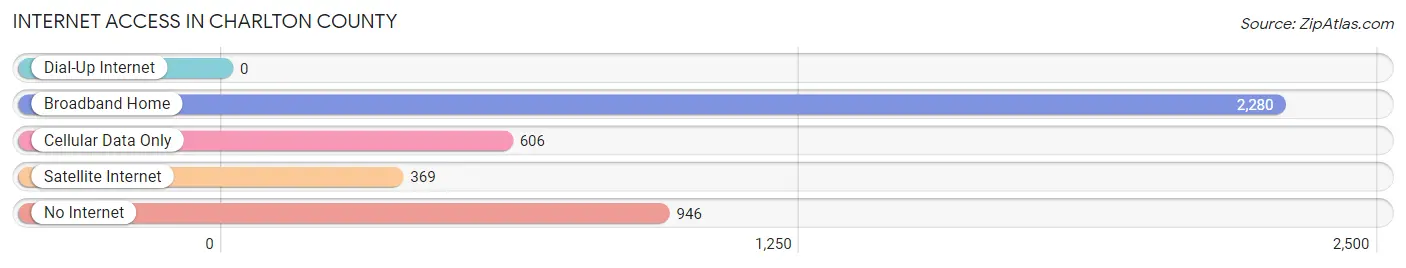
| Internet Type | # Households | % Households |
| Dial-Up Internet | 0 | 0.0% |
| Broadband Home | 2,280 | 56.4% |
| Cellular Data Only | 606 | 15.0% |
| Satellite Internet | 369 | 9.1% |
| No Internet | 946 | 23.4% |
| Total | 4,043 | 100.0% |
Charlton County Summary
Charlton County is located in the southeastern corner of the U.S. state of Georgia. It is bordered by the Atlantic Ocean to the east, Camden County to the north, Ware County to the west, and Brantley County to the south. The county seat is Folkston, and the largest city is St. George. As of the 2010 census, the population was 12,171.
History
Charlton County was created in 1854 from parts of Camden and Ware counties. It was named for Robert Milledge Charlton, a prominent lawyer and politician from Liberty County. The county was largely rural and agricultural until the late 20th century, when it began to experience population growth due to its proximity to Jacksonville, Florida.
Geography
Charlton County is located in the southeastern corner of Georgia, with the Atlantic Ocean to the east and the Okefenokee Swamp to the west. The county is mostly flat, with some rolling hills in the northern part. The Satilla River forms the western border of the county, and the St. Marys River forms the eastern border. The county has a total area of 545 square miles, of which 541 square miles is land and 4.2 square miles is water.
Economy
Charlton County's economy is largely based on agriculture and forestry. The county is home to several large timber companies, and the timber industry is the largest employer in the county. Other major industries include poultry farming, fishing, and tourism. The county is also home to several military bases, including Kings Bay Naval Submarine Base and Camp Blanding.
Demographics
As of the 2010 census, there were 12,171 people, 4,541 households, and 3,279 families living in the county. The population density was 22.4 people per square mile. The racial makeup of the county was 79.2% White, 16.2% African American, 0.5% Native American, 0.7% Asian, 0.1% Pacific Islander, 1.7% from other races, and 1.7% from two or more races. Hispanic or Latino of any race were 4.2% of the population.
The median income for a household in the county was $35,945, and the median income for a family was $41,945. The per capita income for the county was $17,845. About 17.2% of families and 20.7% of the population were below the poverty line, including 28.2% of those under age 18 and 16.2% of those age 65 or over.
Common Questions
What is Per Capita Income in Charlton County?
Per Capita income in Charlton County is $22,742.
What is the Median Family Income in Charlton County?
Median Family Income in Charlton County is $55,237.
What is the Median Household income in Charlton County?
Median Household Income in Charlton County is $45,770.
What is Income or Wage Gap in Charlton County?
Income or Wage Gap in Charlton County is 8.1%.
Women in Charlton County earn 91.9 cents for every dollar earned by a man.
What is Inequality or Gini Index in Charlton County?
Inequality or Gini Index in Charlton County is 0.45.
What is the Total Population of Charlton County?
Total Population of Charlton County is 12,547.
What is the Total Male Population of Charlton County?
Total Male Population of Charlton County is 7,331.
What is the Total Female Population of Charlton County?
Total Female Population of Charlton County is 5,216.
What is the Ratio of Males per 100 Females in Charlton County?
There are 140.55 Males per 100 Females in Charlton County.
What is the Ratio of Females per 100 Males in Charlton County?
There are 71.15 Females per 100 Males in Charlton County.
What is the Median Population Age in Charlton County?
Median Population Age in Charlton County is 39.4 Years.
What is the Average Family Size in Charlton County
Average Family Size in Charlton County is 3.6 People.
What is the Average Household Size in Charlton County
Average Household Size in Charlton County is 2.9 People.
How Large is the Labor Force in Charlton County?
There are 5,468 People in the Labor Forcein in Charlton County.
What is the Percentage of People in the Labor Force in Charlton County?
52.0% of People are in the Labor Force in Charlton County.
What is the Unemployment Rate in Charlton County?
Unemployment Rate in Charlton County is 8.3%.