Candler County, GA Map & Demographics
Candler County Map
Candler County Overview
$24,477
PER CAPITA INCOME
$63,571
AVG FAMILY INCOME
$45,519
AVG HOUSEHOLD INCOME
29.1%
WAGE / INCOME GAP [ % ]
70.9¢/ $1
WAGE / INCOME GAP [ $ ]
$15,688
FAMILY INCOME DEFICIT
0.46
INEQUALITY / GINI INDEX
10,946
TOTAL POPULATION
5,334
MALE POPULATION
5,612
FEMALE POPULATION
95.05
MALES / 100 FEMALES
105.21
FEMALES / 100 MALES
41.6
MEDIAN AGE
3.4
AVG FAMILY SIZE
2.6
AVG HOUSEHOLD SIZE
4,645
LABOR FORCE [ PEOPLE ]
54.1%
PERCENT IN LABOR FORCE
3.9%
UNEMPLOYMENT RATE
Candler County Area Codes
Income in Candler County
Income Overview in Candler County
Per Capita Income in Candler County is $24,477, while median incomes of families and households are $63,571 and $45,519 respectively.
| Characteristic | Number | Measure |
| Per Capita Income | 10,946 | $24,477 |
| Median Family Income | 2,638 | $63,571 |
| Mean Family Income | 2,638 | $73,611 |
| Median Household Income | 4,103 | $45,519 |
| Mean Household Income | 4,103 | $62,538 |
| Income Deficit | 2,638 | $15,688 |
| Wage / Income Gap (%) | 10,946 | 29.08% |
| Wage / Income Gap ($) | 10,946 | 70.92¢ per $1 |
| Gini / Inequality Index | 10,946 | 0.46 |
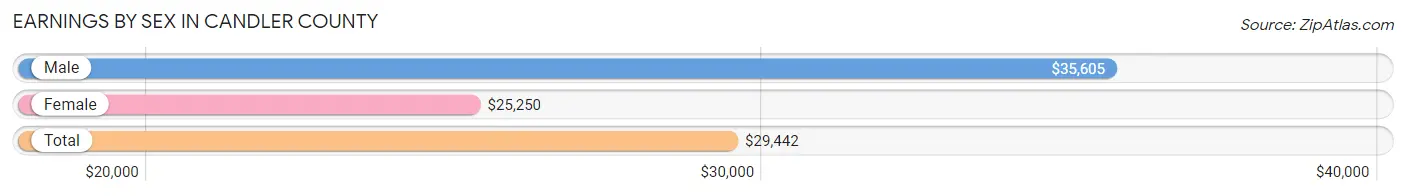
Earnings by Sex in Candler County
Average Earnings in Candler County are $29,442, $35,605 for men and $25,250 for women, a difference of 29.1%.
| Sex | Number | Average Earnings |
| Male | 2,698 (53.9%) | $35,605 |
| Female | 2,304 (46.1%) | $25,250 |
| Total | 5,002 (100.0%) | $29,442 |
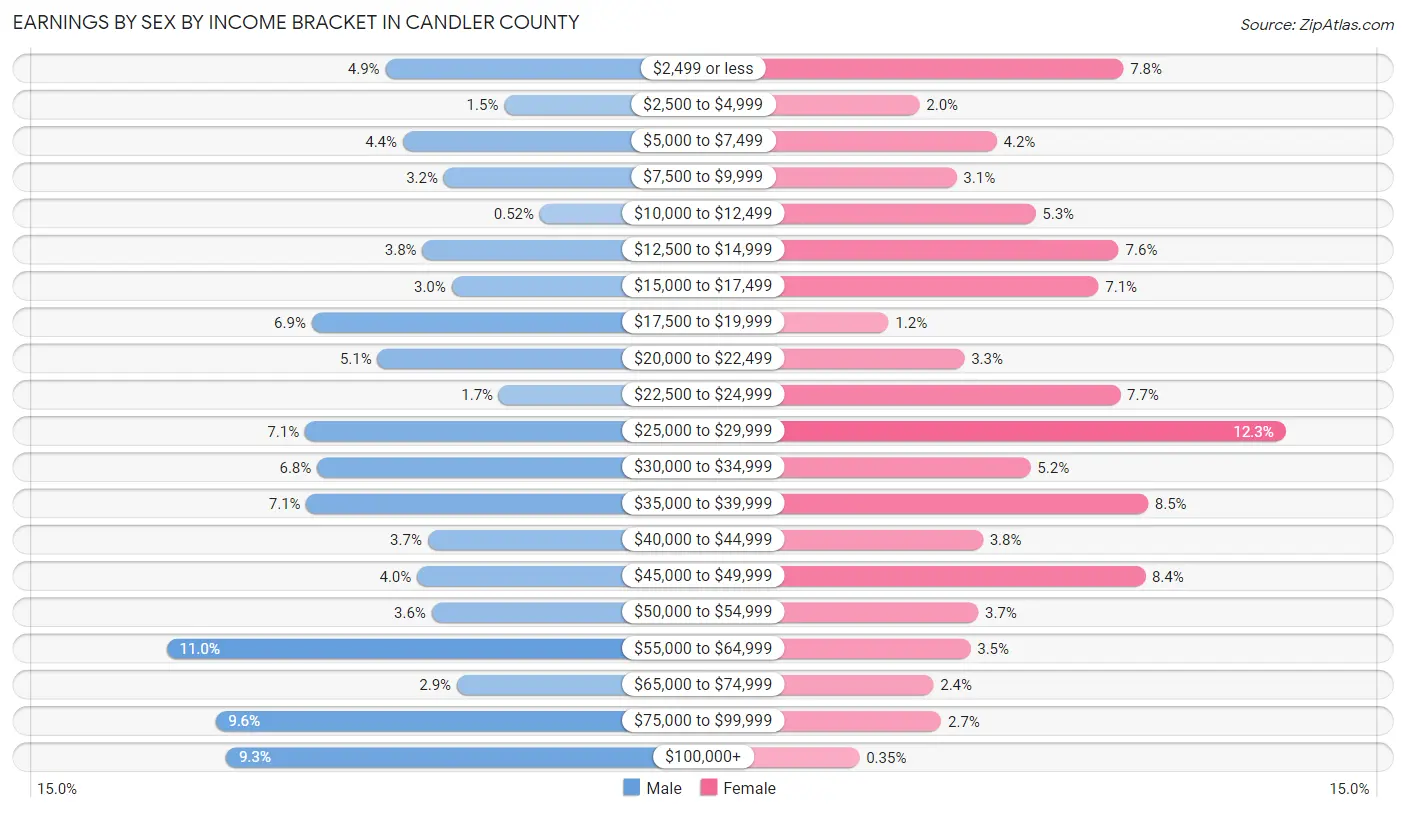
Earnings by Sex by Income Bracket in Candler County
The most common earnings brackets in Candler County are $55,000 to $64,999 for men (297 | 11.0%) and $25,000 to $29,999 for women (284 | 12.3%).
| Income | Male | Female |
| $2,499 or less | 131 (4.9%) | 179 (7.8%) |
| $2,500 to $4,999 | 41 (1.5%) | 47 (2.0%) |
| $5,000 to $7,499 | 118 (4.4%) | 97 (4.2%) |
| $7,500 to $9,999 | 87 (3.2%) | 71 (3.1%) |
| $10,000 to $12,499 | 14 (0.5%) | 122 (5.3%) |
| $12,500 to $14,999 | 103 (3.8%) | 176 (7.6%) |
| $15,000 to $17,499 | 81 (3.0%) | 163 (7.1%) |
| $17,500 to $19,999 | 187 (6.9%) | 27 (1.2%) |
| $20,000 to $22,499 | 137 (5.1%) | 76 (3.3%) |
| $22,500 to $24,999 | 45 (1.7%) | 177 (7.7%) |
| $25,000 to $29,999 | 192 (7.1%) | 284 (12.3%) |
| $30,000 to $34,999 | 183 (6.8%) | 119 (5.2%) |
| $35,000 to $39,999 | 191 (7.1%) | 195 (8.5%) |
| $40,000 to $44,999 | 99 (3.7%) | 88 (3.8%) |
| $45,000 to $49,999 | 107 (4.0%) | 193 (8.4%) |
| $50,000 to $54,999 | 96 (3.6%) | 85 (3.7%) |
| $55,000 to $64,999 | 297 (11.0%) | 80 (3.5%) |
| $65,000 to $74,999 | 77 (2.9%) | 56 (2.4%) |
| $75,000 to $99,999 | 260 (9.6%) | 61 (2.6%) |
| $100,000+ | 252 (9.3%) | 8 (0.4%) |
| Total | 2,698 (100.0%) | 2,304 (100.0%) |
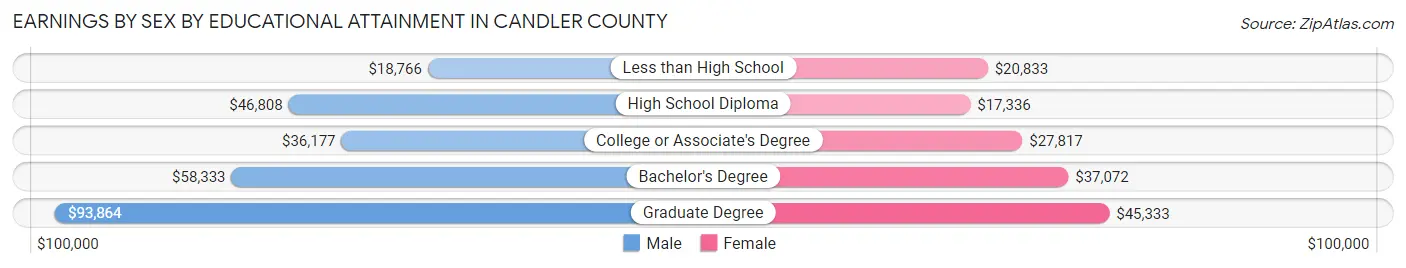
Earnings by Sex by Educational Attainment in Candler County
Average earnings in Candler County are $40,897 for men and $26,637 for women, a difference of 34.9%. Men with an educational attainment of graduate degree enjoy the highest average annual earnings of $93,864, while those with less than high school education earn the least with $18,766. Women with an educational attainment of graduate degree earn the most with the average annual earnings of $45,333, while those with high school diploma education have the smallest earnings of $17,336.
| Educational Attainment | Male Income | Female Income |
| Less than High School | $18,766 | $20,833 |
| High School Diploma | $46,808 | $17,336 |
| College or Associate's Degree | $36,177 | $27,817 |
| Bachelor's Degree | $58,333 | $37,072 |
| Graduate Degree | $93,864 | $45,333 |
| Total | $40,897 | $26,637 |
Family Income in Candler County
Family Income Brackets in Candler County
According to the Candler County family income data, there are 551 families falling into the $50,000 to $74,999 income range, which is the most common income bracket and makes up 20.9% of all families. Conversely, the $10,000 to $14,999 income bracket is the least frequent group with only 74 families (2.8%) belonging to this category.
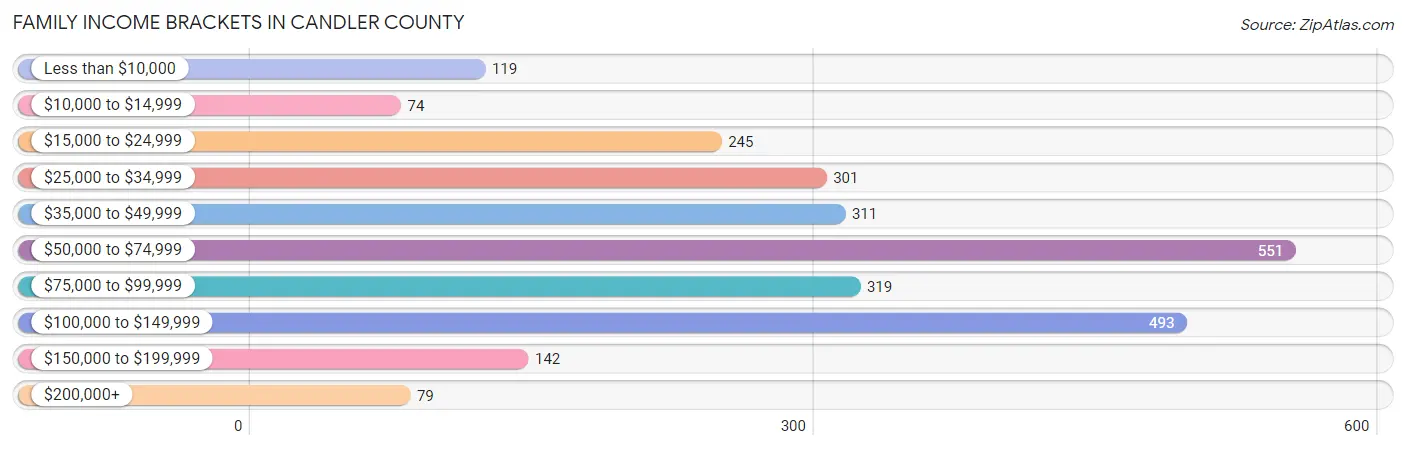
| Income Bracket | # Families | % Families |
| Less than $10,000 | 119 | 4.5% |
| $10,000 to $14,999 | 74 | 2.8% |
| $15,000 to $24,999 | 245 | 9.3% |
| $25,000 to $34,999 | 301 | 11.4% |
| $35,000 to $49,999 | 311 | 11.8% |
| $50,000 to $74,999 | 551 | 20.9% |
| $75,000 to $99,999 | 319 | 12.1% |
| $100,000 to $149,999 | 493 | 18.7% |
| $150,000 to $199,999 | 142 | 5.4% |
| $200,000+ | 79 | 3.0% |
Family Income by Famaliy Size in Candler County
4-person families (442 | 16.8%) account for the highest median family income in Candler County with $97,014 per family, while 2-person families (1,336 | 50.6%) have the highest median income of $28,982 per family member.
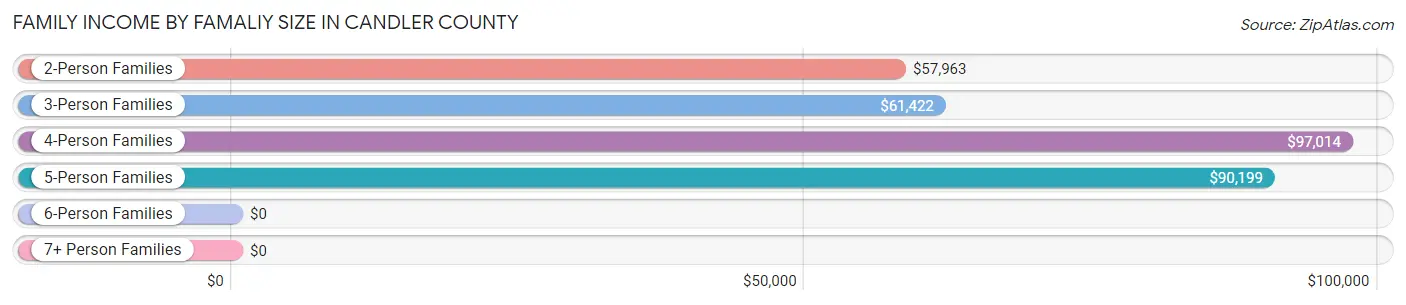
| Income Bracket | # Families | Median Income |
| 2-Person Families | 1,336 (50.6%) | $57,963 |
| 3-Person Families | 498 (18.9%) | $61,422 |
| 4-Person Families | 442 (16.8%) | $97,014 |
| 5-Person Families | 246 (9.3%) | $90,199 |
| 6-Person Families | 89 (3.4%) | $0 |
| 7+ Person Families | 27 (1.0%) | $0 |
| Total | 2,638 (100.0%) | $63,571 |
Family Income by Number of Earners in Candler County
The median family income in Candler County is $63,571, with families comprising 3+ earners (218) having the highest median family income of $101,429, while families with no earners (458) have the lowest median family income of $32,908, accounting for 8.3% and 17.4% of families, respectively.
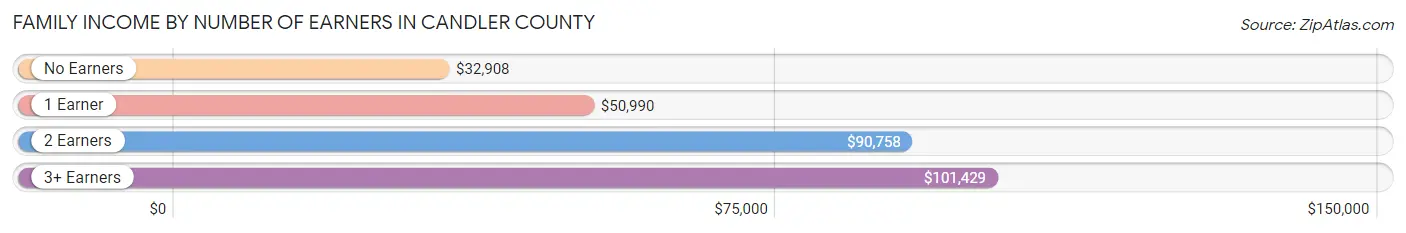
| Number of Earners | # Families | Median Income |
| No Earners | 458 (17.4%) | $32,908 |
| 1 Earner | 870 (33.0%) | $50,990 |
| 2 Earners | 1,092 (41.4%) | $90,758 |
| 3+ Earners | 218 (8.3%) | $101,429 |
| Total | 2,638 (100.0%) | $63,571 |
Household Income in Candler County
Household Income Brackets in Candler County
With 747 households falling in the category, the $50,000 to $74,999 income range is the most frequent in Candler County, accounting for 18.2% of all households. In contrast, only 98 households (2.4%) fall into the $200,000+ income bracket, making it the least populous group.
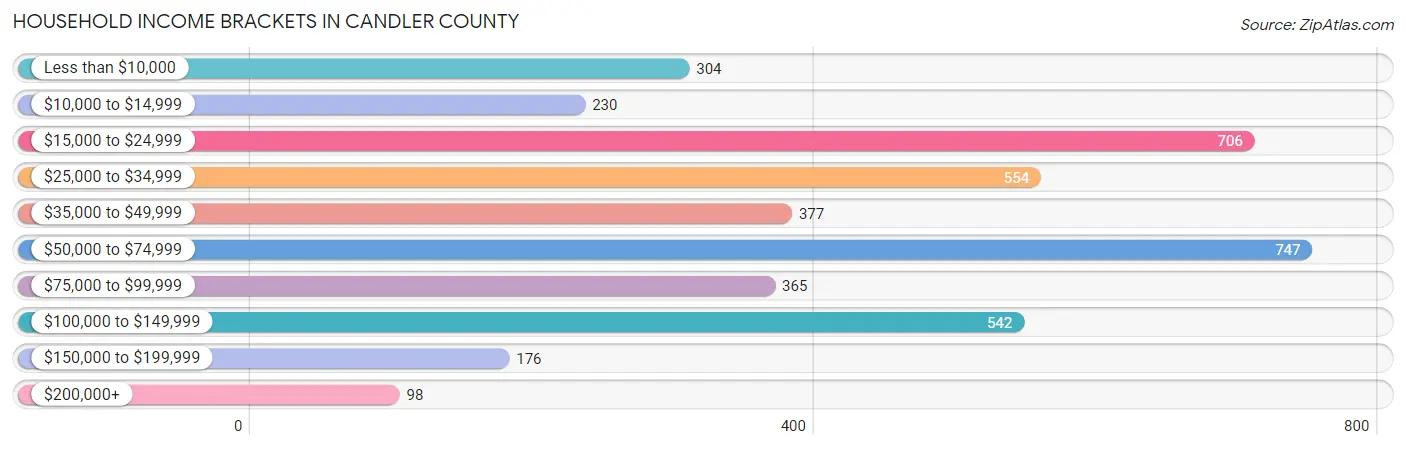
| Income Bracket | # Households | % Households |
| Less than $10,000 | 304 | 7.4% |
| $10,000 to $14,999 | 230 | 5.6% |
| $15,000 to $24,999 | 706 | 17.2% |
| $25,000 to $34,999 | 554 | 13.5% |
| $35,000 to $49,999 | 377 | 9.2% |
| $50,000 to $74,999 | 747 | 18.2% |
| $75,000 to $99,999 | 365 | 8.9% |
| $100,000 to $149,999 | 542 | 13.2% |
| $150,000 to $199,999 | 176 | 4.3% |
| $200,000+ | 98 | 2.4% |
Household Income by Householder Age in Candler County
The median household income in Candler County is $45,519, with the highest median household income of $58,601 found in the 25 to 44 years age bracket for the primary householder. A total of 1,073 households (26.2%) fall into this category. Meanwhile, the 15 to 24 years age bracket for the primary householder has the lowest median household income of $0, with 89 households (2.2%) in this group.
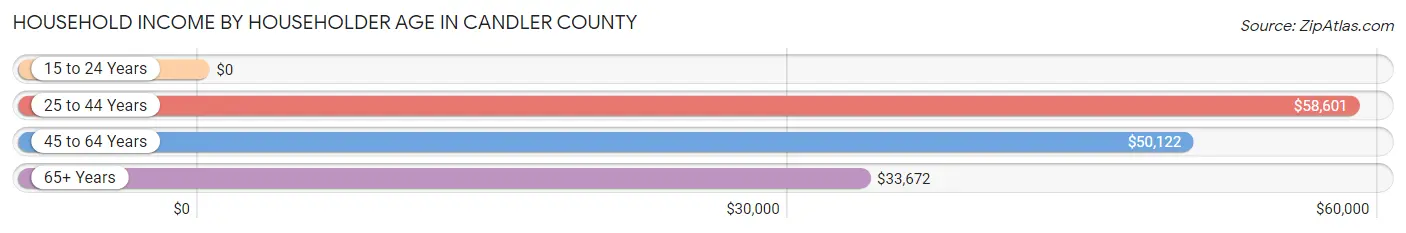
| Income Bracket | # Households | Median Income |
| 15 to 24 Years | 89 (2.2%) | $0 |
| 25 to 44 Years | 1,073 (26.2%) | $58,601 |
| 45 to 64 Years | 1,635 (39.9%) | $50,122 |
| 65+ Years | 1,306 (31.8%) | $33,672 |
| Total | 4,103 (100.0%) | $45,519 |
Poverty in Candler County
Income Below Poverty by Sex and Age in Candler County
With 18.7% poverty level for males and 17.9% for females among the residents of Candler County, 12 to 14 year old males and 5 year old females are the most vulnerable to poverty, with 198 males (45.0%) and 43 females (46.7%) in their respective age groups living below the poverty level.
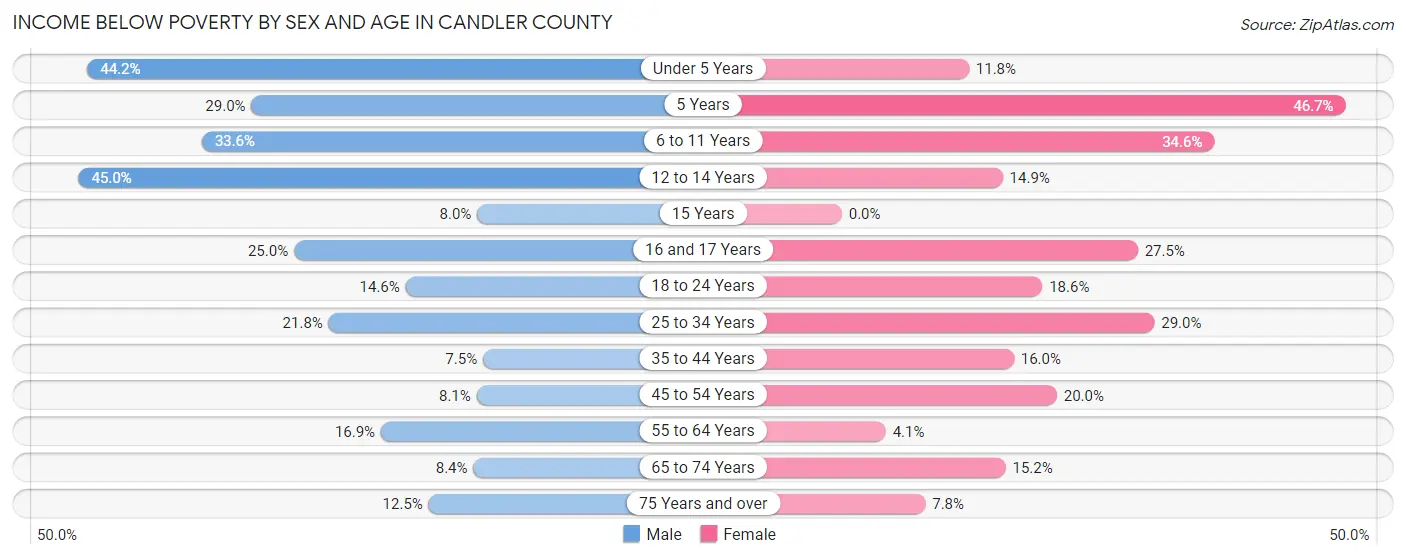
| Age Bracket | Male | Female |
| Under 5 Years | 110 (44.2%) | 56 (11.8%) |
| 5 Years | 22 (28.9%) | 43 (46.7%) |
| 6 to 11 Years | 100 (33.6%) | 150 (34.6%) |
| 12 to 14 Years | 198 (45.0%) | 33 (14.9%) |
| 15 Years | 2 (8.0%) | 0 (0.0%) |
| 16 and 17 Years | 44 (25.0%) | 39 (27.5%) |
| 18 to 24 Years | 88 (14.6%) | 64 (18.6%) |
| 25 to 34 Years | 105 (21.8%) | 174 (29.0%) |
| 35 to 44 Years | 42 (7.5%) | 98 (16.0%) |
| 45 to 54 Years | 57 (8.1%) | 165 (20.0%) |
| 55 to 64 Years | 120 (16.9%) | 26 (4.1%) |
| 65 to 74 Years | 47 (8.4%) | 93 (15.2%) |
| 75 Years and over | 42 (12.5%) | 29 (7.7%) |
| Total | 977 (18.7%) | 970 (17.9%) |
Income Above Poverty by Sex and Age in Candler County
According to the poverty statistics in Candler County, males aged 35 to 44 years and females aged 15 years are the age groups that are most secure financially, with 92.5% of males and 100.0% of females in these age groups living above the poverty line.
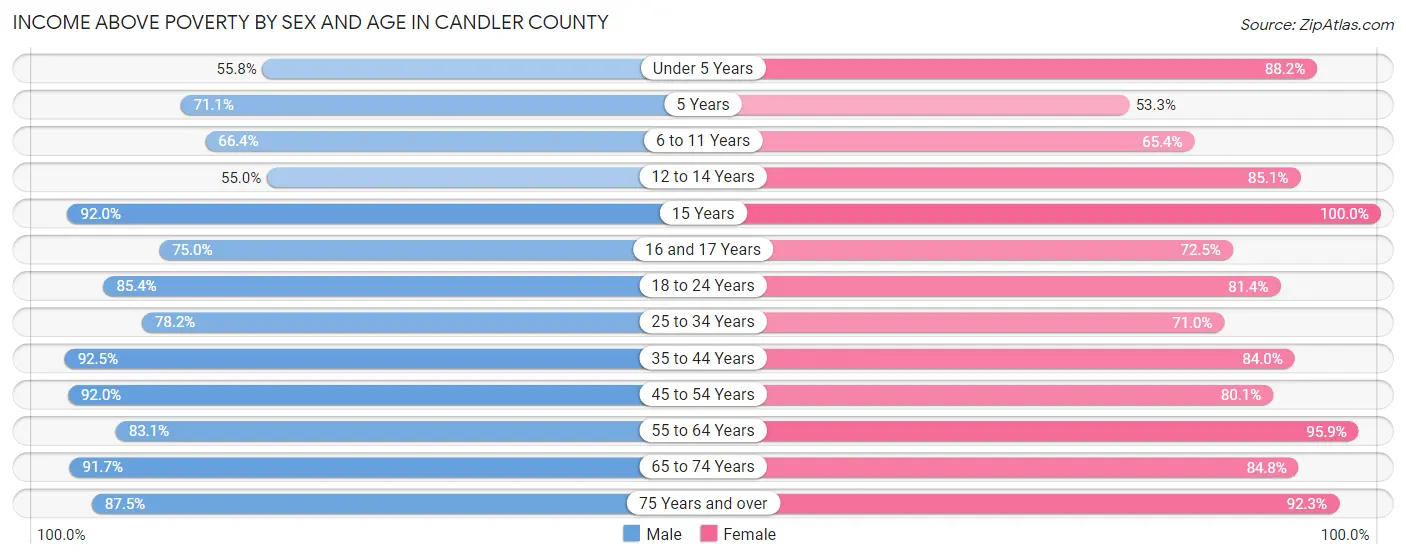
| Age Bracket | Male | Female |
| Under 5 Years | 139 (55.8%) | 419 (88.2%) |
| 5 Years | 54 (71.1%) | 49 (53.3%) |
| 6 to 11 Years | 198 (66.4%) | 284 (65.4%) |
| 12 to 14 Years | 242 (55.0%) | 188 (85.1%) |
| 15 Years | 23 (92.0%) | 50 (100.0%) |
| 16 and 17 Years | 132 (75.0%) | 103 (72.5%) |
| 18 to 24 Years | 513 (85.4%) | 280 (81.4%) |
| 25 to 34 Years | 377 (78.2%) | 426 (71.0%) |
| 35 to 44 Years | 521 (92.5%) | 516 (84.0%) |
| 45 to 54 Years | 651 (91.9%) | 662 (80.0%) |
| 55 to 64 Years | 589 (83.1%) | 611 (95.9%) |
| 65 to 74 Years | 516 (91.6%) | 519 (84.8%) |
| 75 Years and over | 294 (87.5%) | 345 (92.2%) |
| Total | 4,249 (81.3%) | 4,452 (82.1%) |
Income Below Poverty Among Married-Couple Families in Candler County
The poverty statistics for married-couple families in Candler County show that 7.1% or 143 of the total 2,012 families live below the poverty line. Families with 5 or more children have the highest poverty rate of 100.0%, comprising of 27 families. On the other hand, families with 3 or 4 children have the lowest poverty rate of 0.0%, which includes 0 families.
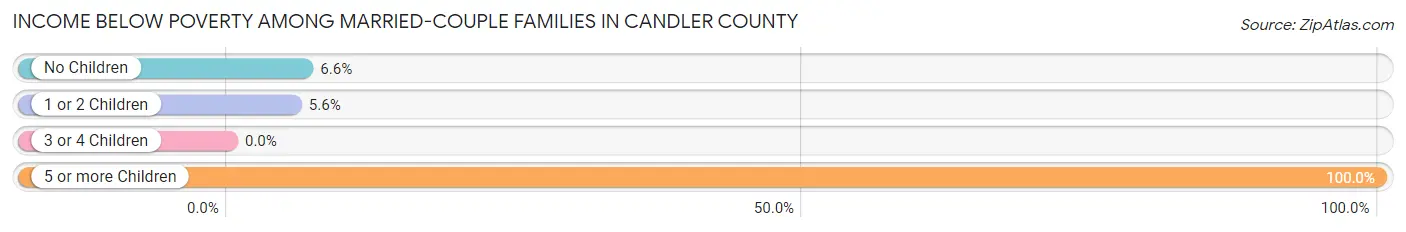
| Children | Above Poverty | Below Poverty |
| No Children | 1,183 (93.4%) | 83 (6.6%) |
| 1 or 2 Children | 560 (94.4%) | 33 (5.6%) |
| 3 or 4 Children | 126 (100.0%) | 0 (0.0%) |
| 5 or more Children | 0 (0.0%) | 27 (100.0%) |
| Total | 1,869 (92.9%) | 143 (7.1%) |
Income Below Poverty Among Single-Parent Households in Candler County
According to the poverty data in Candler County, 39.8% or 51 single-father households and 28.3% or 141 single-mother households are living below the poverty line. Among single-father households, those with 5 or more children have the highest poverty rate, with 25 households (100.0%) experiencing poverty. Likewise, among single-mother households, those with 3 or 4 children have the highest poverty rate, with 57 households (100.0%) falling below the poverty line.
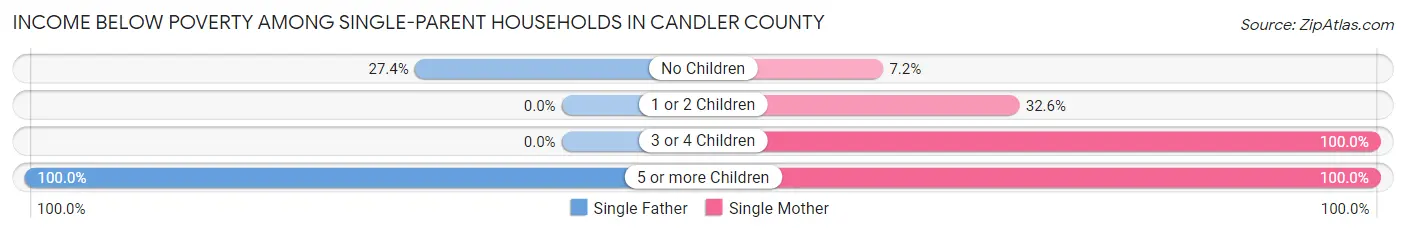
| Children | Single Father | Single Mother |
| No Children | 26 (27.4%) | 18 (7.2%) |
| 1 or 2 Children | 0 (0.0%) | 61 (32.6%) |
| 3 or 4 Children | 0 (0.0%) | 57 (100.0%) |
| 5 or more Children | 25 (100.0%) | 5 (100.0%) |
| Total | 51 (39.8%) | 141 (28.3%) |
Income Below Poverty Among Married-Couple vs Single-Parent Households in Candler County
The poverty data for Candler County shows that 143 of the married-couple family households (7.1%) and 192 of the single-parent households (30.7%) are living below the poverty level. Within the married-couple family households, those with 5 or more children have the highest poverty rate, with 27 households (100.0%) falling below the poverty line. Among the single-parent households, those with 3 or 4 children have the highest poverty rate, with 57 household (100.0%) living below poverty.
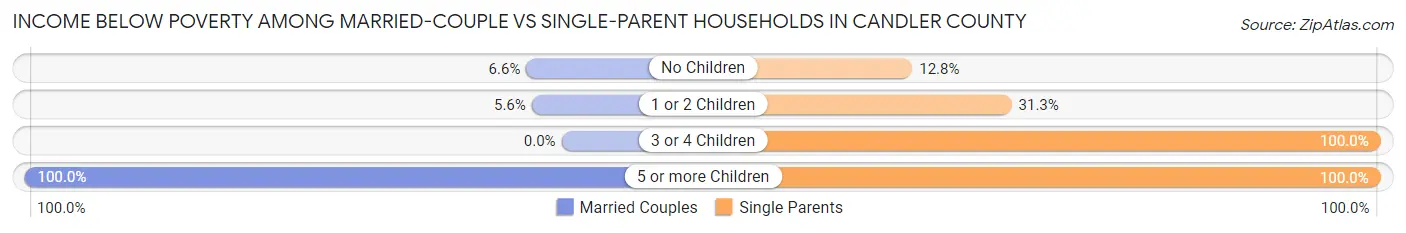
| Children | Married-Couple Families | Single-Parent Households |
| No Children | 83 (6.6%) | 44 (12.8%) |
| 1 or 2 Children | 33 (5.6%) | 61 (31.3%) |
| 3 or 4 Children | 0 (0.0%) | 57 (100.0%) |
| 5 or more Children | 27 (100.0%) | 30 (100.0%) |
| Total | 143 (7.1%) | 192 (30.7%) |
Race in Candler County
The most populous races in Candler County are White / Caucasian (6,825 | 62.4%), Black / African American (2,465 | 22.5%), and Hispanic or Latino (1,338 | 12.2%).
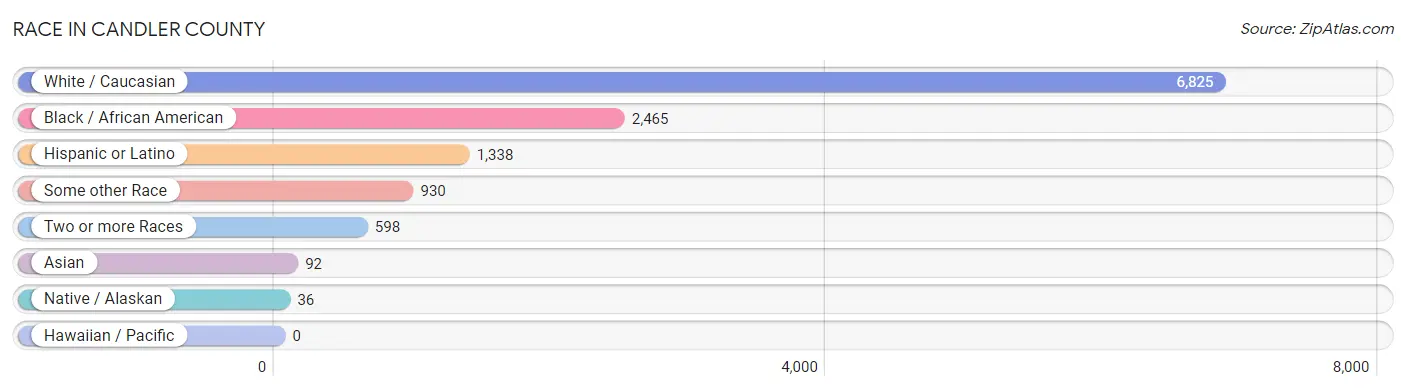
| Race | # Population | % Population |
| Asian | 92 | 0.8% |
| Black / African American | 2,465 | 22.5% |
| Hawaiian / Pacific | 0 | 0.0% |
| Hispanic or Latino | 1,338 | 12.2% |
| Native / Alaskan | 36 | 0.3% |
| White / Caucasian | 6,825 | 62.4% |
| Two or more Races | 598 | 5.5% |
| Some other Race | 930 | 8.5% |
| Total | 10,946 | 100.0% |
Ancestry in Candler County
The most populous ancestries reported in Candler County are American (1,346 | 12.3%), Irish (951 | 8.7%), Mexican (892 | 8.2%), German (714 | 6.5%), and European (548 | 5.0%), together accounting for 40.7% of all Candler County residents.
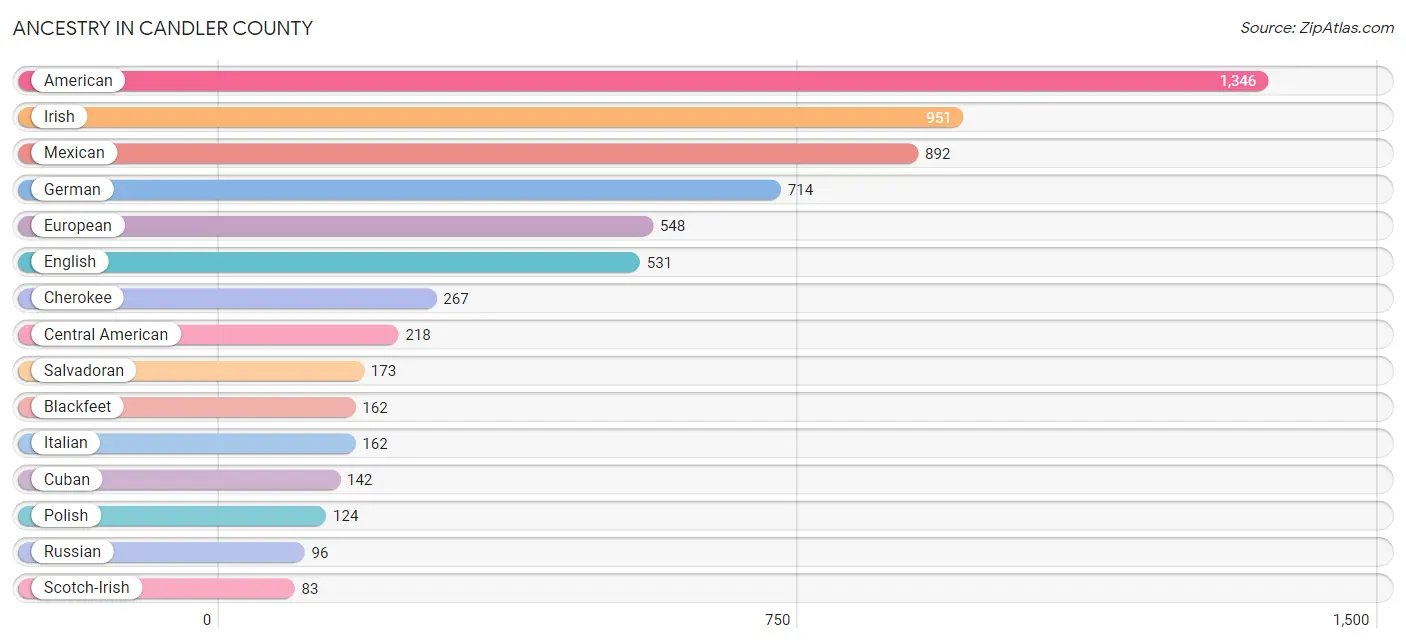
| Ancestry | # Population | % Population |
| American | 1,346 | 12.3% |
| Blackfeet | 162 | 1.5% |
| British | 43 | 0.4% |
| Canadian | 66 | 0.6% |
| Central American | 218 | 2.0% |
| Cherokee | 267 | 2.4% |
| Creek | 50 | 0.5% |
| Cuban | 142 | 1.3% |
| Danish | 34 | 0.3% |
| Dutch | 56 | 0.5% |
| English | 531 | 4.9% |
| European | 548 | 5.0% |
| French | 72 | 0.7% |
| German | 714 | 6.5% |
| Greek | 22 | 0.2% |
| Guatemalan | 45 | 0.4% |
| Hungarian | 9 | 0.1% |
| Indian (Asian) | 34 | 0.3% |
| Irish | 951 | 8.7% |
| Italian | 162 | 1.5% |
| Korean | 71 | 0.6% |
| Lithuanian | 22 | 0.2% |
| Mexican | 892 | 8.2% |
| Norwegian | 23 | 0.2% |
| Pennsylvania German | 23 | 0.2% |
| Polish | 124 | 1.1% |
| Portuguese | 6 | 0.1% |
| Puerto Rican | 72 | 0.7% |
| Russian | 96 | 0.9% |
| Salvadoran | 173 | 1.6% |
| Scandinavian | 6 | 0.1% |
| Scotch-Irish | 83 | 0.8% |
| Scottish | 26 | 0.2% |
| Seminole | 30 | 0.3% |
| Slovak | 26 | 0.2% |
| Spanish | 14 | 0.1% |
| Subsaharan African | 2 | 0.0% |
| Swedish | 11 | 0.1% |
| Swiss | 8 | 0.1% |
| Welsh | 9 | 0.1% | View All 40 Rows |
Immigrants in Candler County
The most numerous immigrant groups reported in Candler County came from Latin America (633 | 5.8%), Central America (473 | 4.3%), Mexico (371 | 3.4%), Caribbean (142 | 1.3%), and Cuba (142 | 1.3%), together accounting for 16.1% of all Candler County residents.
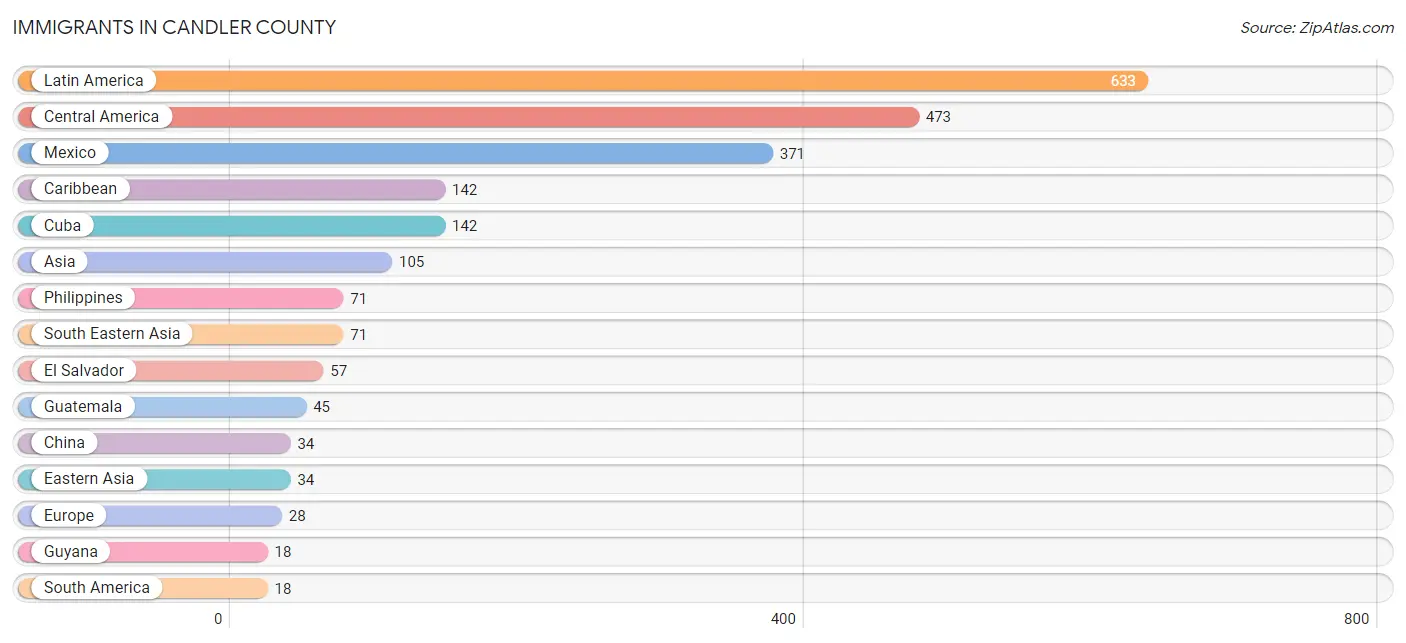
| Immigration Origin | # Population | % Population |
| Asia | 105 | 1.0% |
| Canada | 5 | 0.1% |
| Caribbean | 142 | 1.3% |
| Central America | 473 | 4.3% |
| China | 34 | 0.3% |
| Cuba | 142 | 1.3% |
| Eastern Asia | 34 | 0.3% |
| Eastern Europe | 17 | 0.2% |
| El Salvador | 57 | 0.5% |
| England | 7 | 0.1% |
| Europe | 28 | 0.3% |
| Guatemala | 45 | 0.4% |
| Guyana | 18 | 0.2% |
| Latin America | 633 | 5.8% |
| Mexico | 371 | 3.4% |
| Northern Europe | 11 | 0.1% |
| Philippines | 71 | 0.6% |
| Romania | 17 | 0.2% |
| Scotland | 2 | 0.0% |
| South America | 18 | 0.2% |
| South Eastern Asia | 71 | 0.6% | View All 21 Rows |
Sex and Age in Candler County
Sex and Age in Candler County
The most populous age groups in Candler County are 10 to 14 Years (583 | 10.9%) for men and Under 5 Years (475 | 8.5%) for women.
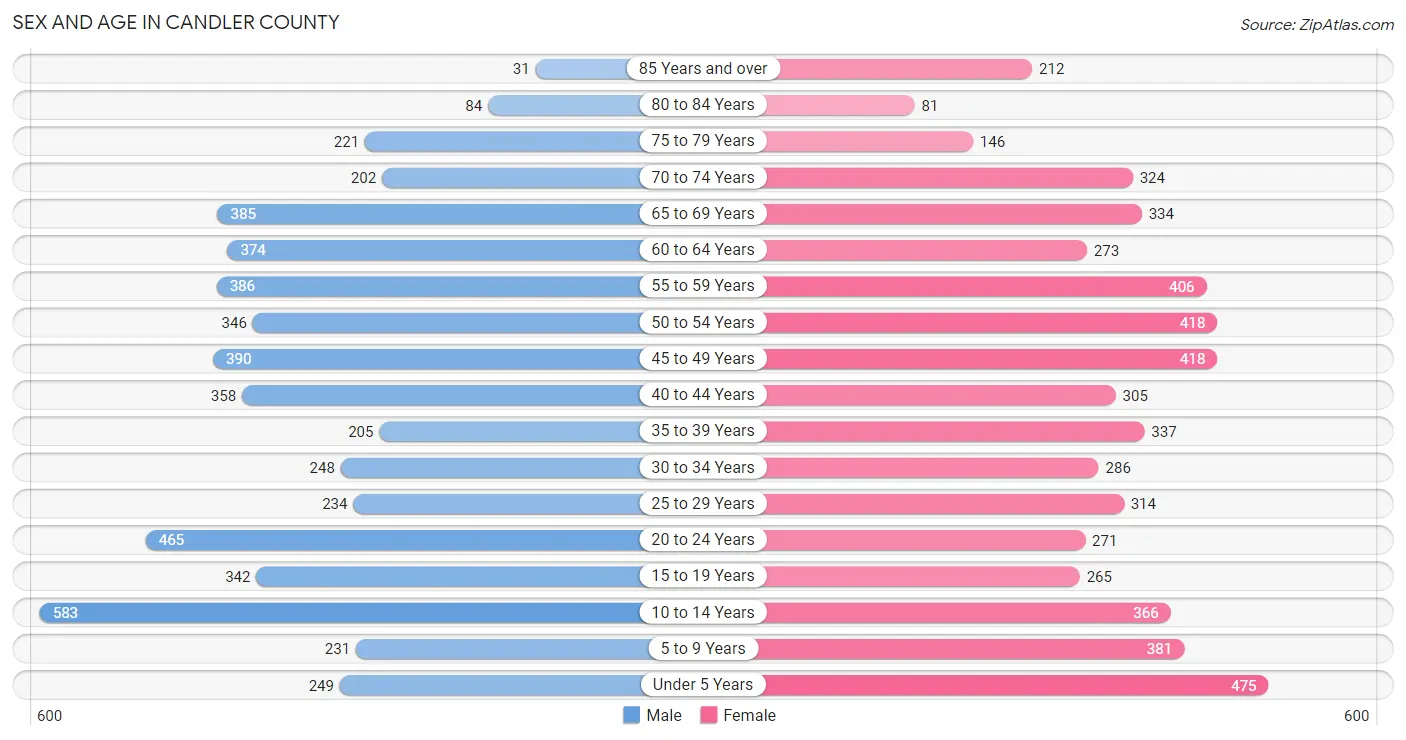
| Age Bracket | Male | Female |
| Under 5 Years | 249 (4.7%) | 475 (8.5%) |
| 5 to 9 Years | 231 (4.3%) | 381 (6.8%) |
| 10 to 14 Years | 583 (10.9%) | 366 (6.5%) |
| 15 to 19 Years | 342 (6.4%) | 265 (4.7%) |
| 20 to 24 Years | 465 (8.7%) | 271 (4.8%) |
| 25 to 29 Years | 234 (4.4%) | 314 (5.6%) |
| 30 to 34 Years | 248 (4.6%) | 286 (5.1%) |
| 35 to 39 Years | 205 (3.8%) | 337 (6.0%) |
| 40 to 44 Years | 358 (6.7%) | 305 (5.4%) |
| 45 to 49 Years | 390 (7.3%) | 418 (7.4%) |
| 50 to 54 Years | 346 (6.5%) | 418 (7.4%) |
| 55 to 59 Years | 386 (7.2%) | 406 (7.2%) |
| 60 to 64 Years | 374 (7.0%) | 273 (4.9%) |
| 65 to 69 Years | 385 (7.2%) | 334 (5.9%) |
| 70 to 74 Years | 202 (3.8%) | 324 (5.8%) |
| 75 to 79 Years | 221 (4.1%) | 146 (2.6%) |
| 80 to 84 Years | 84 (1.6%) | 81 (1.4%) |
| 85 Years and over | 31 (0.6%) | 212 (3.8%) |
| Total | 5,334 (100.0%) | 5,612 (100.0%) |
Families and Households in Candler County
Median Family Size in Candler County
The median family size in Candler County is 3.40 persons per family, with single male/father families (128 | 4.9%) accounting for the largest median family size of 3.83 persons per family. On the other hand, married-couple families (2,012 | 76.3%) represent the smallest median family size with 3.31 persons per family.
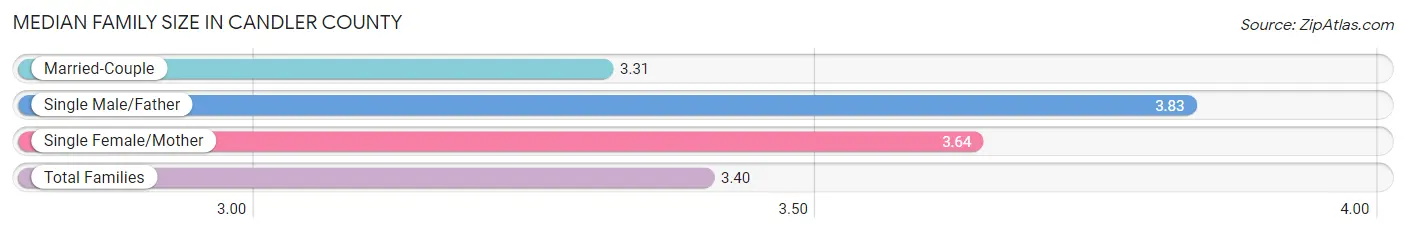
| Family Type | # Families | Family Size |
| Married-Couple | 2,012 (76.3%) | 3.31 |
| Single Male/Father | 128 (4.9%) | 3.83 |
| Single Female/Mother | 498 (18.9%) | 3.64 |
| Total Families | 2,638 (100.0%) | 3.40 |
Median Household Size in Candler County
The median household size in Candler County is 2.60 persons per household, with single male/father households (128 | 3.1%) accounting for the largest median household size of 4.41 persons per household. non-family households (1,465 | 35.7%) represent the smallest median household size with 1.05 persons per household.
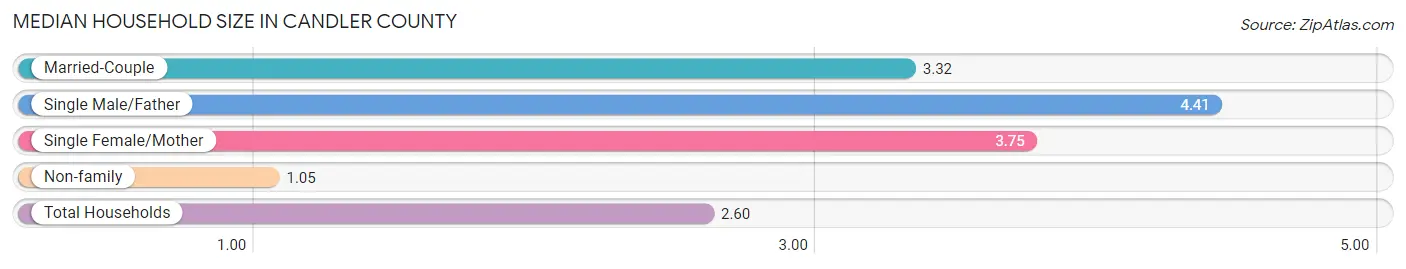
| Household Type | # Households | Household Size |
| Married-Couple | 2,012 (49.0%) | 3.32 |
| Single Male/Father | 128 (3.1%) | 4.41 |
| Single Female/Mother | 498 (12.1%) | 3.75 |
| Non-family | 1,465 (35.7%) | 1.05 |
| Total Households | 4,103 (100.0%) | 2.60 |
Household Size by Marriage Status in Candler County
Out of a total of 4,103 households in Candler County, 2,638 (64.3%) are family households, while 1,465 (35.7%) are nonfamily households. The most numerous type of family households are 2-person households, comprising 1,286, and the most common type of nonfamily households are 1-person households, comprising 1,389.
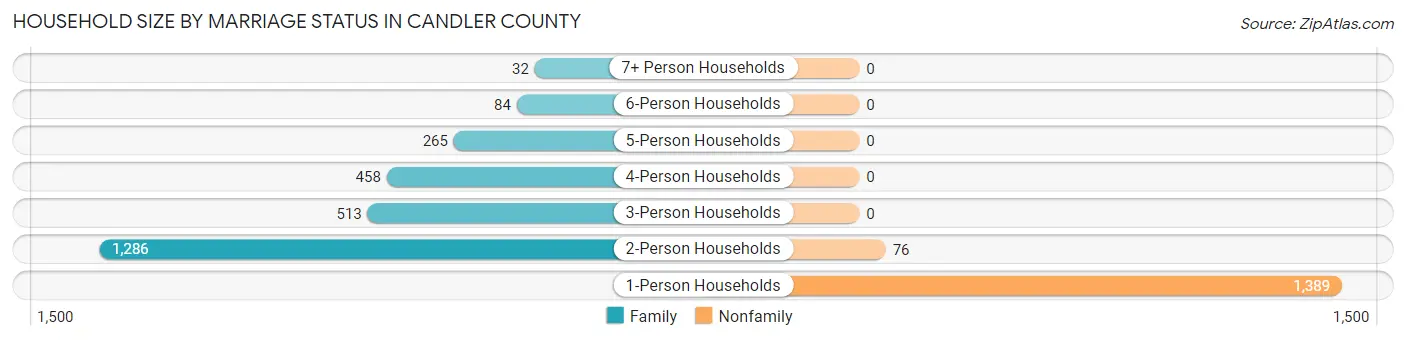
| Household Size | Family Households | Nonfamily Households |
| 1-Person Households | - | 1,389 (33.9%) |
| 2-Person Households | 1,286 (31.3%) | 76 (1.8%) |
| 3-Person Households | 513 (12.5%) | 0 (0.0%) |
| 4-Person Households | 458 (11.2%) | 0 (0.0%) |
| 5-Person Households | 265 (6.5%) | 0 (0.0%) |
| 6-Person Households | 84 (2.1%) | 0 (0.0%) |
| 7+ Person Households | 32 (0.8%) | 0 (0.0%) |
| Total | 2,638 (64.3%) | 1,465 (35.7%) |
Female Fertility in Candler County
Fertility by Age in Candler County
Average fertility rate in Candler County is 28.0 births per 1,000 women. Women in the age bracket of 20 to 34 years have the highest fertility rate with 53.0 births per 1,000 women. Women in the age bracket of 20 to 34 years acount for 71.9% of all women with births.
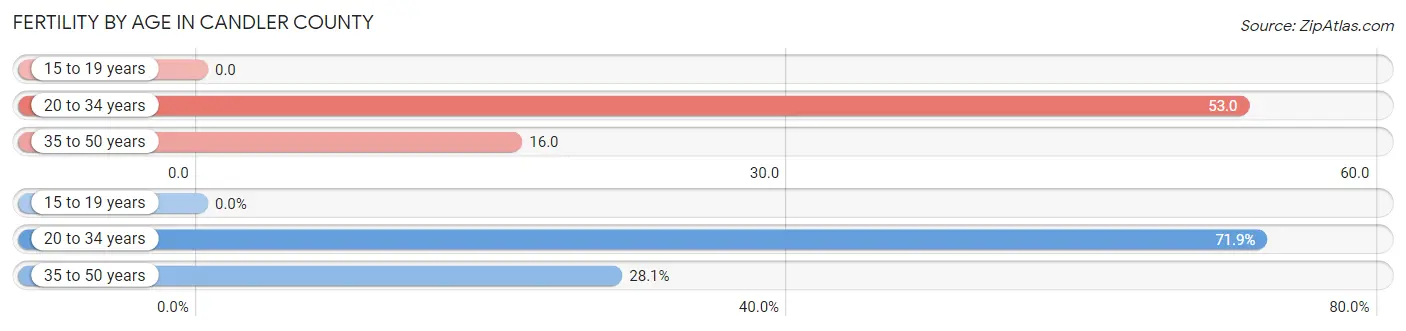
| Age Bracket | Women with Births | Births / 1,000 Women |
| 15 to 19 years | 0 (0.0%) | 0.0 |
| 20 to 34 years | 46 (71.9%) | 53.0 |
| 35 to 50 years | 18 (28.1%) | 16.0 |
| Total | 64 (100.0%) | 28.0 |
Fertility by Age by Marriage Status in Candler County
53.1% of women with births (64) in Candler County are married. The highest percentage of unmarried women with births falls into 20 to 34 years age bracket with 65.2% of them unmarried at the time of birth, while the lowest percentage of unmarried women with births belong to 35 to 50 years age bracket with 0.0% of them unmarried.
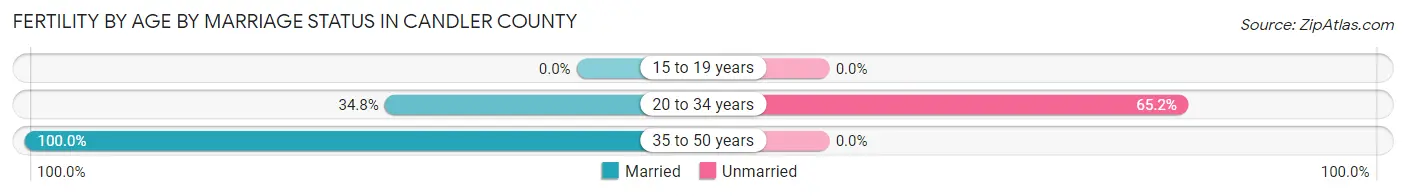
| Age Bracket | Married | Unmarried |
| 15 to 19 years | 0 (0.0%) | 0 (0.0%) |
| 20 to 34 years | 16 (34.8%) | 30 (65.2%) |
| 35 to 50 years | 18 (100.0%) | 0 (0.0%) |
| Total | 34 (53.1%) | 30 (46.9%) |
Fertility by Education in Candler County
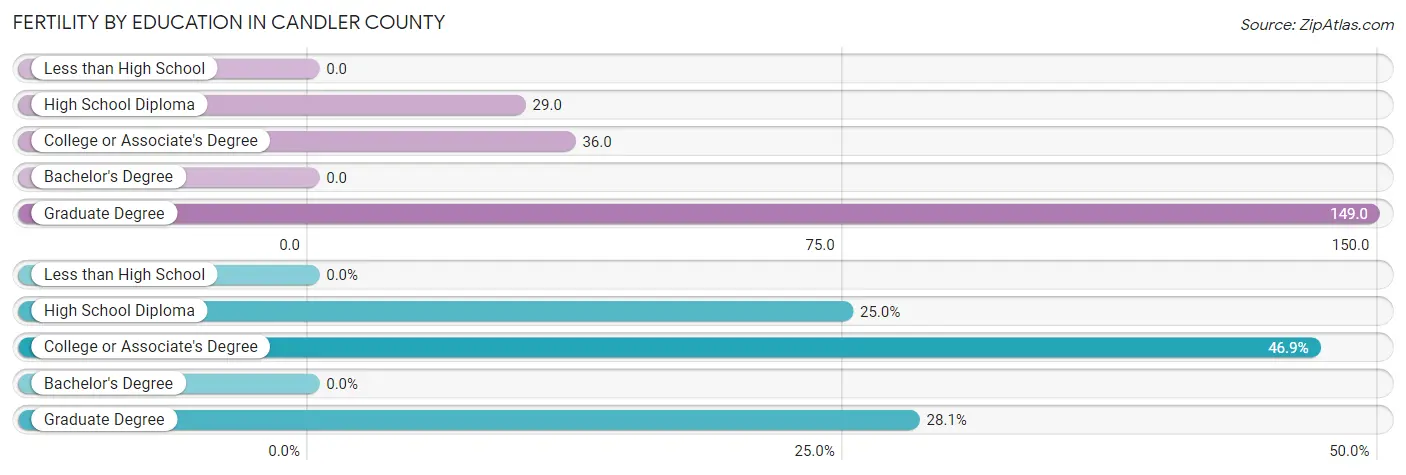
| Educational Attainment | Women with Births | Births / 1,000 Women |
| Less than High School | 0 (0.0%) | 0.0 |
| High School Diploma | 16 (25.0%) | 29.0 |
| College or Associate's Degree | 30 (46.9%) | 36.0 |
| Bachelor's Degree | 0 (0.0%) | 0.0 |
| Graduate Degree | 18 (28.1%) | 149.0 |
| Total | 64 (100.0%) | 28.0 |
Fertility by Education by Marriage Status in Candler County
46.9% of women with births in Candler County are unmarried. Women with the educational attainment of high school diploma are most likely to be married with 100.0% of them married at childbirth, while women with the educational attainment of college or associate's degree are least likely to be married with 100.0% of them unmarried at childbirth.
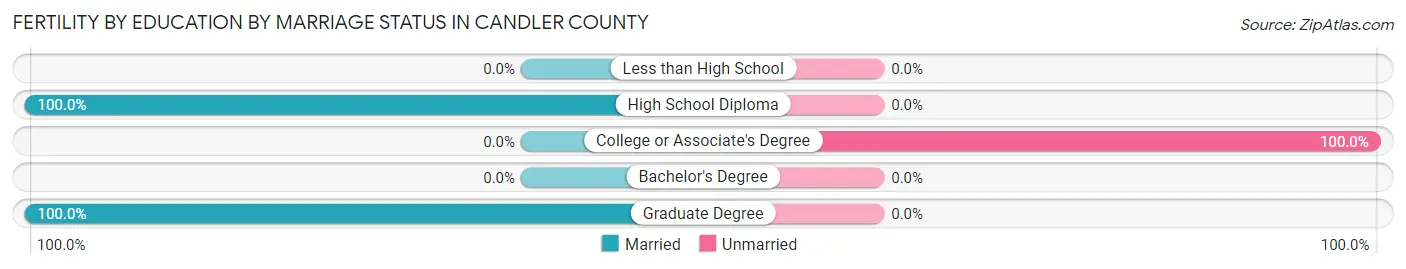
| Educational Attainment | Married | Unmarried |
| Less than High School | 0 (0.0%) | 0 (0.0%) |
| High School Diploma | 16 (100.0%) | 0 (0.0%) |
| College or Associate's Degree | 0 (0.0%) | 30 (100.0%) |
| Bachelor's Degree | 0 (0.0%) | 0 (0.0%) |
| Graduate Degree | 18 (100.0%) | 0 (0.0%) |
| Total | 34 (53.1%) | 30 (46.9%) |
Employment Characteristics in Candler County
Employment by Class of Employer in Candler County
Among the 4,429 employed individuals in Candler County, private company employees (2,937 | 66.3%), state government employees (495 | 11.2%), and local government employees (313 | 7.1%) make up the most common classes of employment.
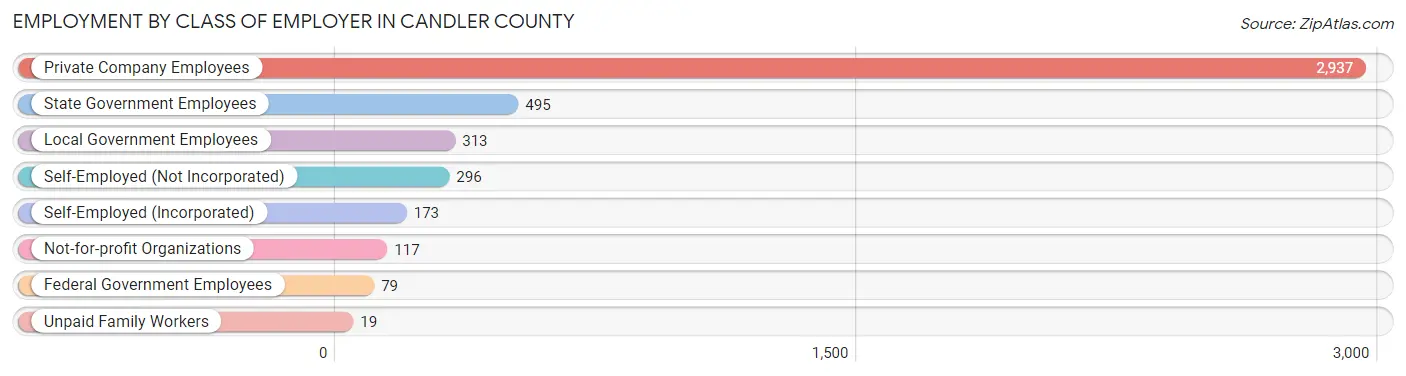
| Employer Class | # Employees | % Employees |
| Private Company Employees | 2,937 | 66.3% |
| Self-Employed (Incorporated) | 173 | 3.9% |
| Self-Employed (Not Incorporated) | 296 | 6.7% |
| Not-for-profit Organizations | 117 | 2.6% |
| Local Government Employees | 313 | 7.1% |
| State Government Employees | 495 | 11.2% |
| Federal Government Employees | 79 | 1.8% |
| Unpaid Family Workers | 19 | 0.4% |
| Total | 4,429 | 100.0% |
Employment Status by Age in Candler County
According to the labor force statistics for Candler County, out of the total population over 16 years of age (8,586), 54.1% or 4,645 individuals are in the labor force, with 3.9% or 181 of them unemployed. The age group with the highest labor force participation rate is 45 to 54 years, with 82.3% or 1,294 individuals in the labor force. Within the labor force, the 20 to 24 years age range has the highest percentage of unemployed individuals, with 10.8% or 62 of them being unemployed.
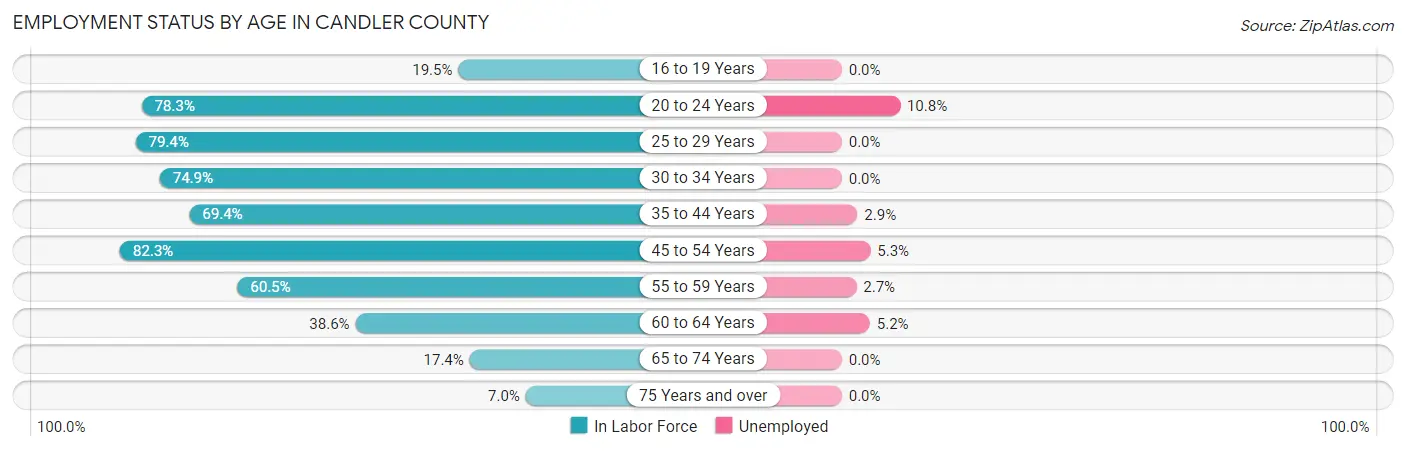
| Age Bracket | In Labor Force | Unemployed |
| 16 to 19 Years | 104 (19.5%) | 0 (0.0%) |
| 20 to 24 Years | 576 (78.3%) | 62 (10.8%) |
| 25 to 29 Years | 435 (79.4%) | 0 (0.0%) |
| 30 to 34 Years | 400 (74.9%) | 0 (0.0%) |
| 35 to 44 Years | 836 (69.4%) | 24 (2.9%) |
| 45 to 54 Years | 1,294 (82.3%) | 69 (5.3%) |
| 55 to 59 Years | 479 (60.5%) | 13 (2.7%) |
| 60 to 64 Years | 250 (38.6%) | 13 (5.2%) |
| 65 to 74 Years | 217 (17.4%) | 0 (0.0%) |
| 75 Years and over | 54 (7.0%) | 0 (0.0%) |
| Total | 4,645 (54.1%) | 181 (3.9%) |
Employment Status by Educational Attainment in Candler County
According to labor force statistics for Candler County, 69.7% of individuals (3,693) out of the total population between 25 and 64 years of age (5,298) are in the labor force, with 3.2% or 118 of them being unemployed. The group with the highest labor force participation rate are those with the educational attainment of bachelor's degree or higher, with 97.4% or 663 individuals in the labor force. Within the labor force, individuals with high school diploma education have the highest percentage of unemployment, with 6.0% or 70 of them being unemployed.
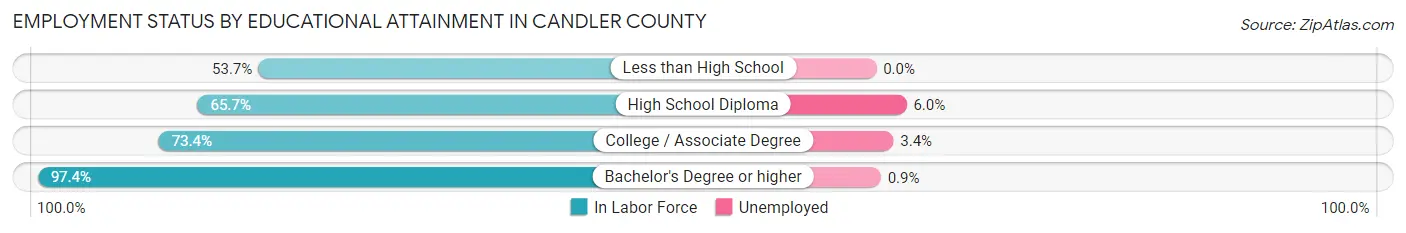
| Educational Attainment | In Labor Force | Unemployed |
| Less than High School | 604 (53.7%) | 0 (0.0%) |
| High School Diploma | 1,160 (65.7%) | 106 (6.0%) |
| College / Associate Degree | 1,268 (73.4%) | 59 (3.4%) |
| Bachelor's Degree or higher | 663 (97.4%) | 6 (0.9%) |
| Total | 3,693 (69.7%) | 170 (3.2%) |
Employment Occupations by Sex in Candler County
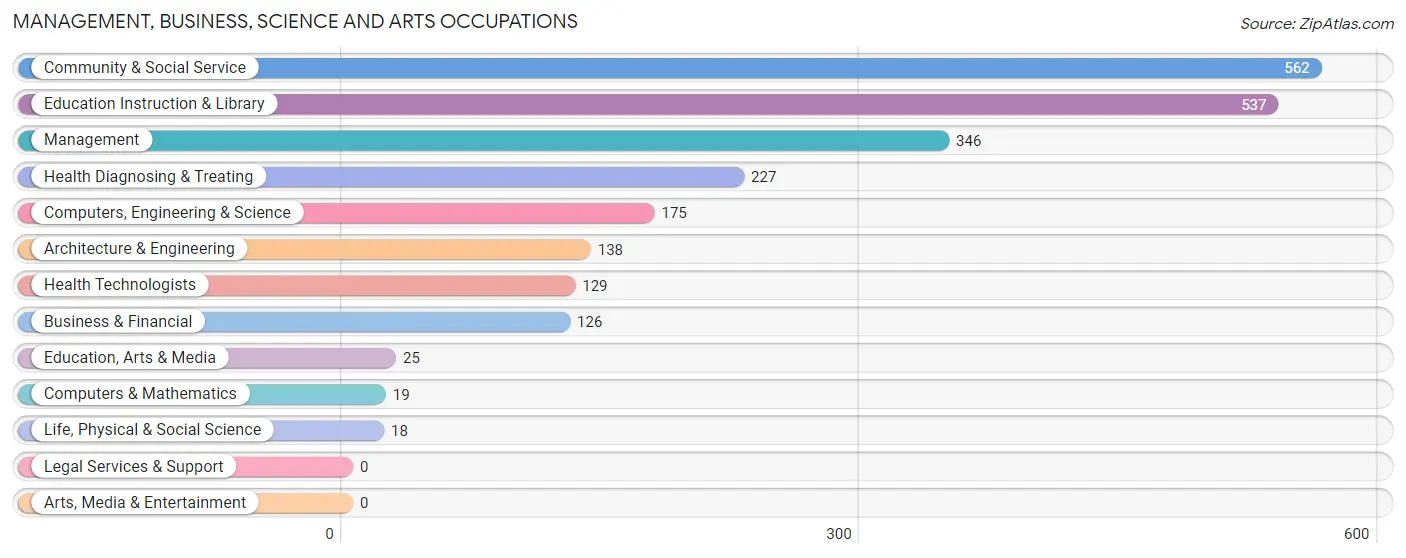
Management, Business, Science and Arts Occupations
The most common Management, Business, Science and Arts occupations in Candler County are Community & Social Service (562 | 12.6%), Education Instruction & Library (537 | 12.0%), Management (346 | 7.7%), Health Diagnosing & Treating (227 | 5.1%), and Computers, Engineering & Science (175 | 3.9%).
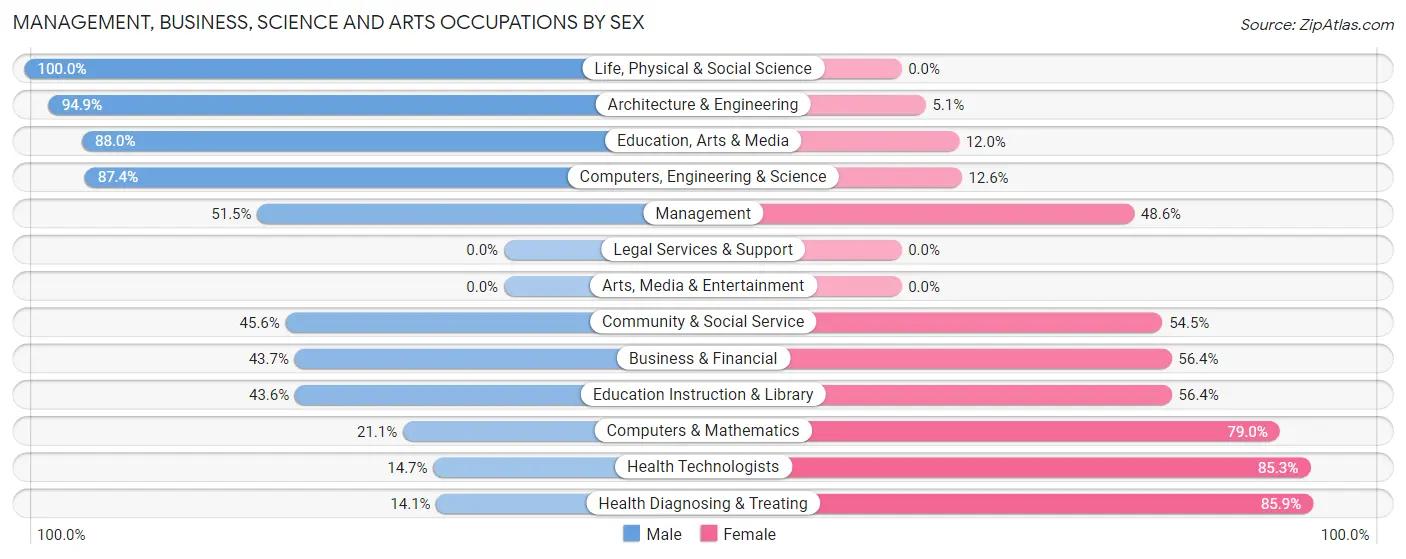
Management, Business, Science and Arts Occupations by Sex
Within the Management, Business, Science and Arts occupations in Candler County, the most male-oriented occupations are Life, Physical & Social Science (100.0%), Architecture & Engineering (94.9%), and Education, Arts & Media (88.0%), while the most female-oriented occupations are Health Diagnosing & Treating (85.9%), Health Technologists (85.3%), and Computers & Mathematics (78.9%).
| Occupation | Male | Female |
| Management | 178 (51.4%) | 168 (48.5%) |
| Business & Financial | 55 (43.6%) | 71 (56.4%) |
| Computers, Engineering & Science | 153 (87.4%) | 22 (12.6%) |
| Computers & Mathematics | 4 (21.0%) | 15 (78.9%) |
| Architecture & Engineering | 131 (94.9%) | 7 (5.1%) |
| Life, Physical & Social Science | 18 (100.0%) | 0 (0.0%) |
| Community & Social Service | 256 (45.6%) | 306 (54.4%) |
| Education, Arts & Media | 22 (88.0%) | 3 (12.0%) |
| Legal Services & Support | 0 (0.0%) | 0 (0.0%) |
| Education Instruction & Library | 234 (43.6%) | 303 (56.4%) |
| Arts, Media & Entertainment | 0 (0.0%) | 0 (0.0%) |
| Health Diagnosing & Treating | 32 (14.1%) | 195 (85.9%) |
| Health Technologists | 19 (14.7%) | 110 (85.3%) |
| Total (Category) | 674 (46.9%) | 762 (53.1%) |
| Total (Overall) | 2,451 (54.9%) | 2,013 (45.1%) |
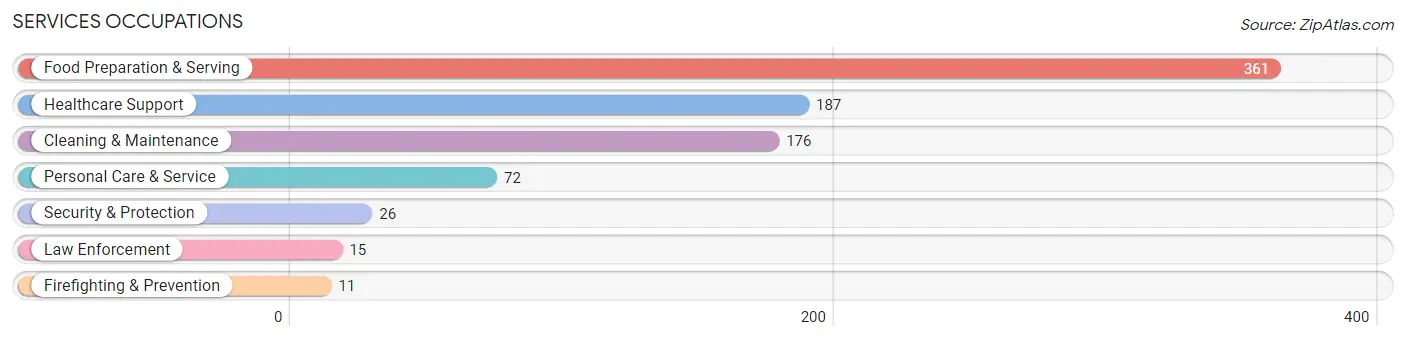
Services Occupations
The most common Services occupations in Candler County are Food Preparation & Serving (361 | 8.1%), Healthcare Support (187 | 4.2%), Cleaning & Maintenance (176 | 3.9%), Personal Care & Service (72 | 1.6%), and Security & Protection (26 | 0.6%).
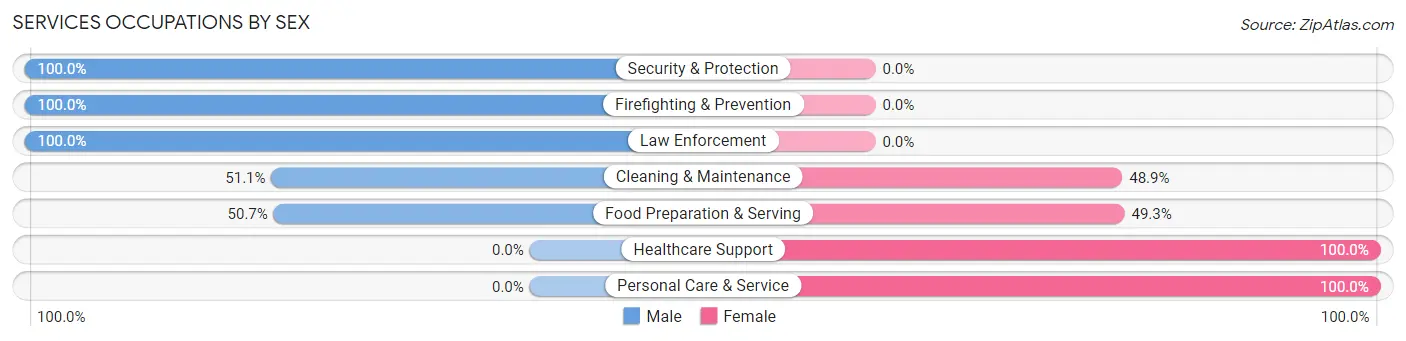
Services Occupations by Sex
Within the Services occupations in Candler County, the most male-oriented occupations are Security & Protection (100.0%), Firefighting & Prevention (100.0%), and Law Enforcement (100.0%), while the most female-oriented occupations are Healthcare Support (100.0%), Personal Care & Service (100.0%), and Food Preparation & Serving (49.3%).
| Occupation | Male | Female |
| Healthcare Support | 0 (0.0%) | 187 (100.0%) |
| Security & Protection | 26 (100.0%) | 0 (0.0%) |
| Firefighting & Prevention | 11 (100.0%) | 0 (0.0%) |
| Law Enforcement | 15 (100.0%) | 0 (0.0%) |
| Food Preparation & Serving | 183 (50.7%) | 178 (49.3%) |
| Cleaning & Maintenance | 90 (51.1%) | 86 (48.9%) |
| Personal Care & Service | 0 (0.0%) | 72 (100.0%) |
| Total (Category) | 299 (36.4%) | 523 (63.6%) |
| Total (Overall) | 2,451 (54.9%) | 2,013 (45.1%) |
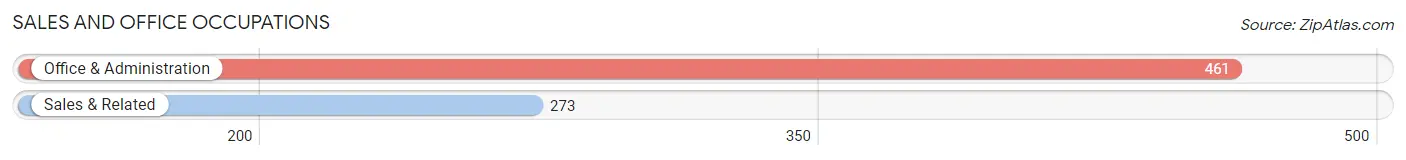
Sales and Office Occupations
The most common Sales and Office occupations in Candler County are Office & Administration (461 | 10.3%), and Sales & Related (273 | 6.1%).
Sales and Office Occupations by Sex
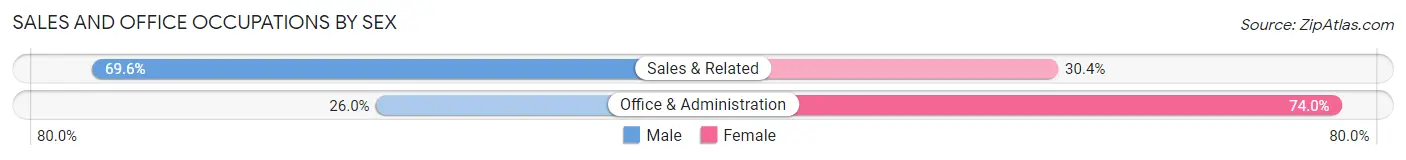
| Occupation | Male | Female |
| Sales & Related | 190 (69.6%) | 83 (30.4%) |
| Office & Administration | 120 (26.0%) | 341 (74.0%) |
| Total (Category) | 310 (42.2%) | 424 (57.8%) |
| Total (Overall) | 2,451 (54.9%) | 2,013 (45.1%) |
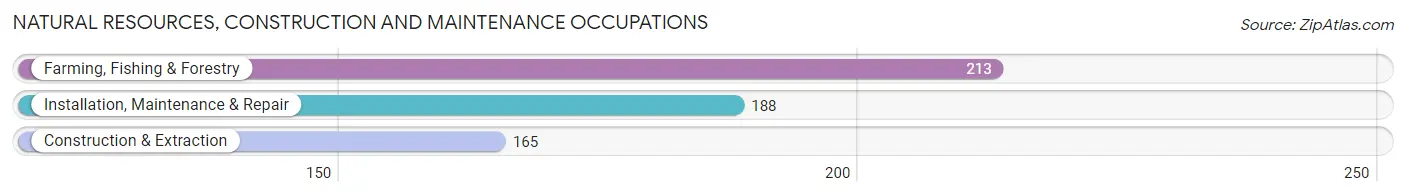
Natural Resources, Construction and Maintenance Occupations
The most common Natural Resources, Construction and Maintenance occupations in Candler County are Farming, Fishing & Forestry (213 | 4.8%), Installation, Maintenance & Repair (188 | 4.2%), and Construction & Extraction (165 | 3.7%).
Natural Resources, Construction and Maintenance Occupations by Sex
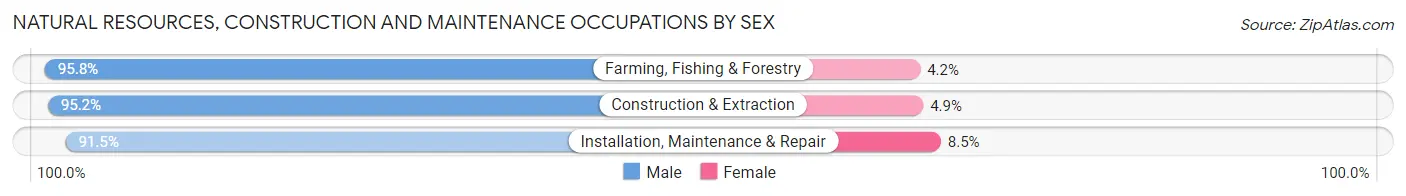
| Occupation | Male | Female |
| Farming, Fishing & Forestry | 204 (95.8%) | 9 (4.2%) |
| Construction & Extraction | 157 (95.2%) | 8 (4.9%) |
| Installation, Maintenance & Repair | 172 (91.5%) | 16 (8.5%) |
| Total (Category) | 533 (94.2%) | 33 (5.8%) |
| Total (Overall) | 2,451 (54.9%) | 2,013 (45.1%) |
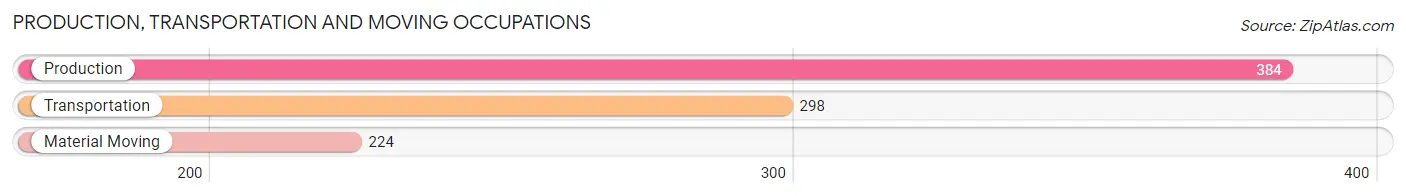
Production, Transportation and Moving Occupations
The most common Production, Transportation and Moving occupations in Candler County are Production (384 | 8.6%), Transportation (298 | 6.7%), and Material Moving (224 | 5.0%).
Production, Transportation and Moving Occupations by Sex
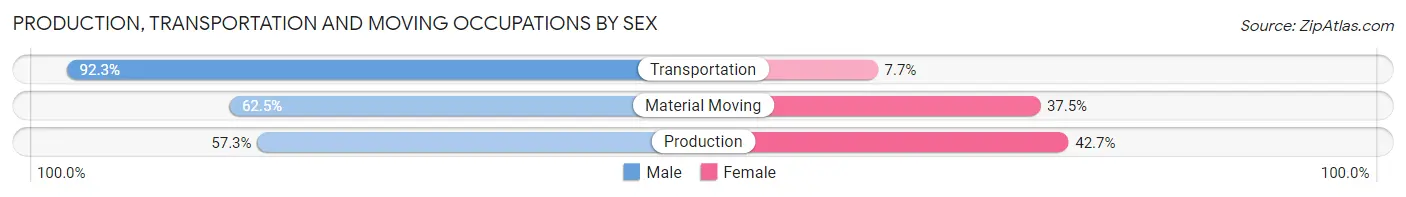
| Occupation | Male | Female |
| Production | 220 (57.3%) | 164 (42.7%) |
| Transportation | 275 (92.3%) | 23 (7.7%) |
| Material Moving | 140 (62.5%) | 84 (37.5%) |
| Total (Category) | 635 (70.1%) | 271 (29.9%) |
| Total (Overall) | 2,451 (54.9%) | 2,013 (45.1%) |
Employment Industries by Sex in Candler County
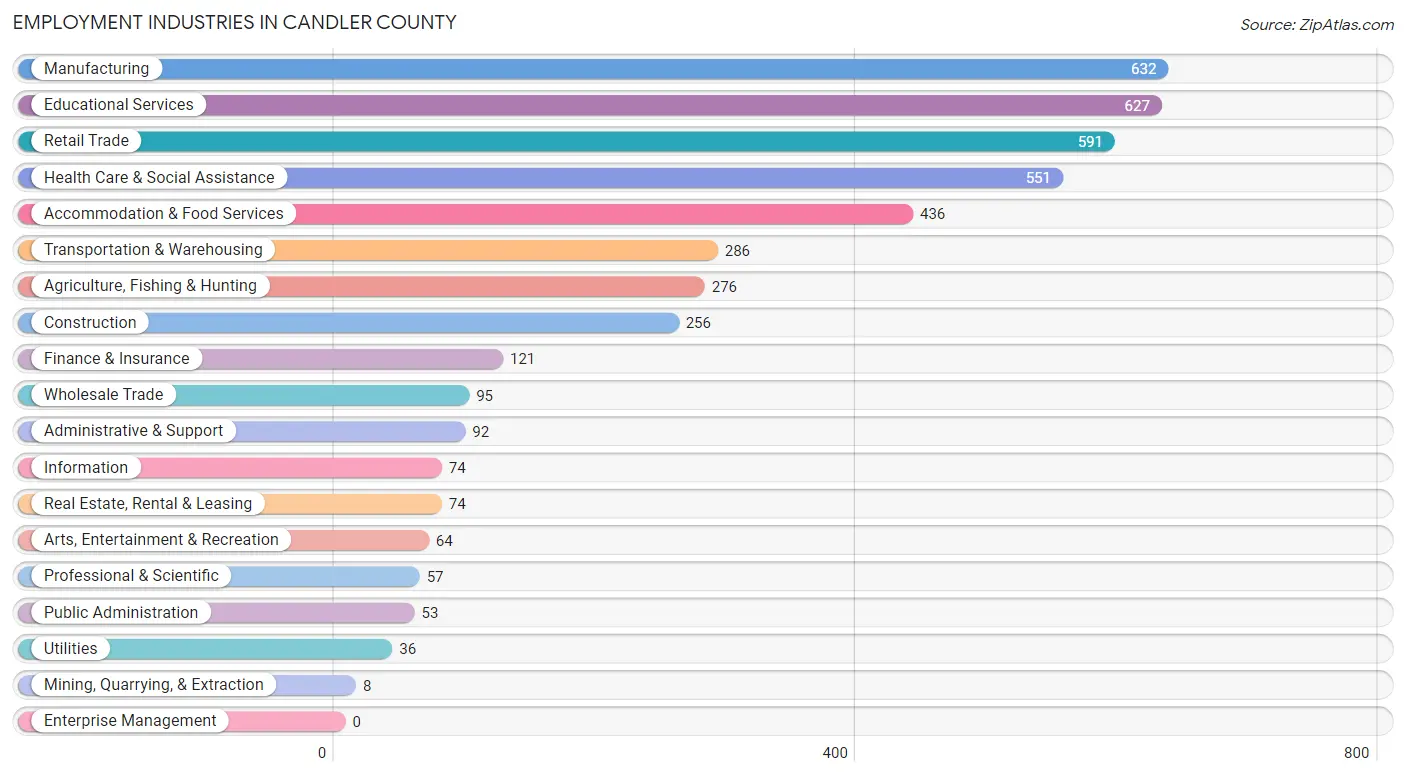
Employment Industries in Candler County
The major employment industries in Candler County include Manufacturing (632 | 14.2%), Educational Services (627 | 14.1%), Retail Trade (591 | 13.2%), Health Care & Social Assistance (551 | 12.3%), and Accommodation & Food Services (436 | 9.8%).
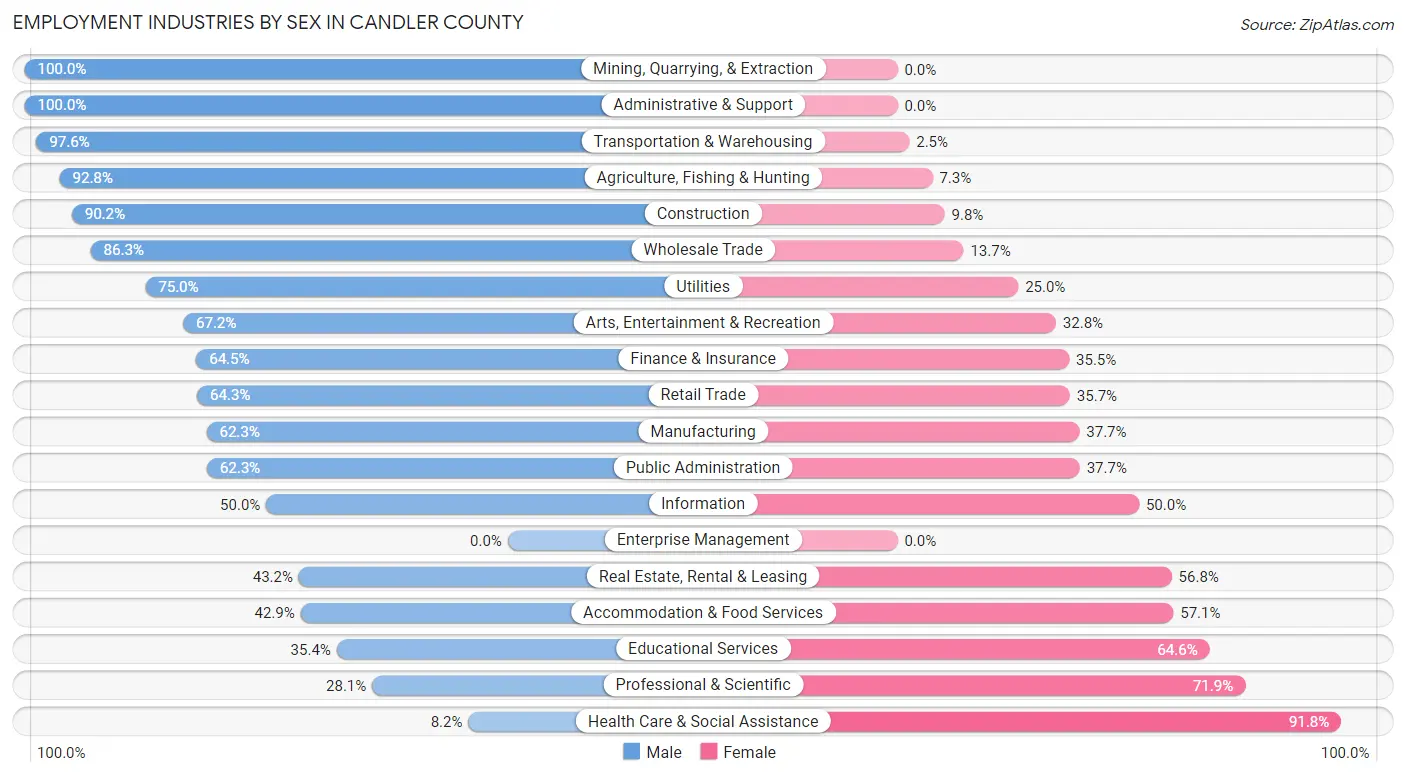
Employment Industries by Sex in Candler County
The Candler County industries that see more men than women are Mining, Quarrying, & Extraction (100.0%), Administrative & Support (100.0%), and Transportation & Warehousing (97.6%), whereas the industries that tend to have a higher number of women are Health Care & Social Assistance (91.8%), Professional & Scientific (71.9%), and Educational Services (64.6%).
| Industry | Male | Female |
| Agriculture, Fishing & Hunting | 256 (92.7%) | 20 (7.2%) |
| Mining, Quarrying, & Extraction | 8 (100.0%) | 0 (0.0%) |
| Construction | 231 (90.2%) | 25 (9.8%) |
| Manufacturing | 394 (62.3%) | 238 (37.7%) |
| Wholesale Trade | 82 (86.3%) | 13 (13.7%) |
| Retail Trade | 380 (64.3%) | 211 (35.7%) |
| Transportation & Warehousing | 279 (97.6%) | 7 (2.5%) |
| Utilities | 27 (75.0%) | 9 (25.0%) |
| Information | 37 (50.0%) | 37 (50.0%) |
| Finance & Insurance | 78 (64.5%) | 43 (35.5%) |
| Real Estate, Rental & Leasing | 32 (43.2%) | 42 (56.8%) |
| Professional & Scientific | 16 (28.1%) | 41 (71.9%) |
| Enterprise Management | 0 (0.0%) | 0 (0.0%) |
| Administrative & Support | 92 (100.0%) | 0 (0.0%) |
| Educational Services | 222 (35.4%) | 405 (64.6%) |
| Health Care & Social Assistance | 45 (8.2%) | 506 (91.8%) |
| Arts, Entertainment & Recreation | 43 (67.2%) | 21 (32.8%) |
| Accommodation & Food Services | 187 (42.9%) | 249 (57.1%) |
| Public Administration | 33 (62.3%) | 20 (37.7%) |
| Total | 2,451 (54.9%) | 2,013 (45.1%) |
Education in Candler County
School Enrollment in Candler County
The most common levels of schooling among the 2,434 students in Candler County are middle school (879 | 36.1%), elementary school (487 | 20.0%), and high school (474 | 19.5%).
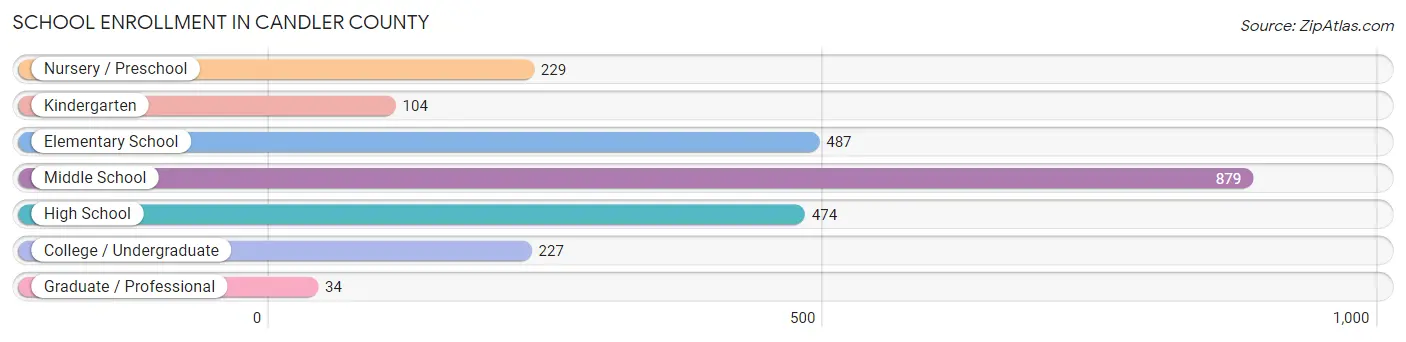
| School Level | # Students | % Students |
| Nursery / Preschool | 229 | 9.4% |
| Kindergarten | 104 | 4.3% |
| Elementary School | 487 | 20.0% |
| Middle School | 879 | 36.1% |
| High School | 474 | 19.5% |
| College / Undergraduate | 227 | 9.3% |
| Graduate / Professional | 34 | 1.4% |
| Total | 2,434 | 100.0% |
School Enrollment by Age by Funding Source in Candler County
Out of a total of 2,434 students who are enrolled in schools in Candler County, 336 (13.8%) attend a private institution, while the remaining 2,098 (86.2%) are enrolled in public schools. The age group of 18 to 19 year olds has the highest likelihood of being enrolled in private schools, with 33 (34.4% in the age bracket) enrolled. Conversely, the age group of 3 to 4 year olds has the lowest likelihood of being enrolled in a private school, with 164 (100.0% in the age bracket) attending a public institution.
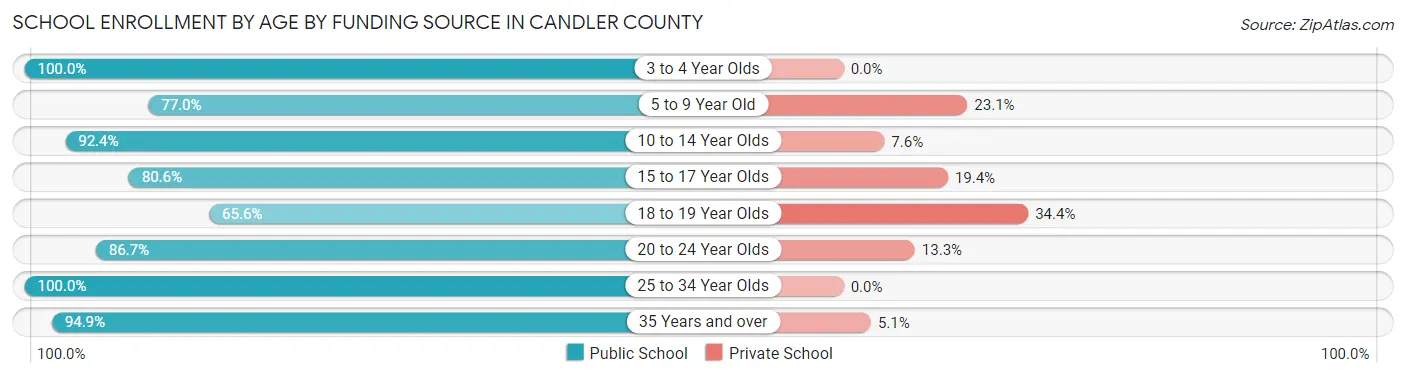
| Age Bracket | Public School | Private School |
| 3 to 4 Year Olds | 164 (100.0%) | 0 (0.0%) |
| 5 to 9 Year Old | 454 (76.9%) | 136 (23.1%) |
| 10 to 14 Year Olds | 877 (92.4%) | 72 (7.6%) |
| 15 to 17 Year Olds | 307 (80.6%) | 74 (19.4%) |
| 18 to 19 Year Olds | 63 (65.6%) | 33 (34.4%) |
| 20 to 24 Year Olds | 98 (86.7%) | 15 (13.3%) |
| 25 to 34 Year Olds | 23 (100.0%) | 0 (0.0%) |
| 35 Years and over | 112 (94.9%) | 6 (5.1%) |
| Total | 2,098 (86.2%) | 336 (13.8%) |
Educational Attainment by Field of Study in Candler County
Education (362 | 37.6%), business (172 | 17.9%), arts & humanities (88 | 9.1%), engineering (83 | 8.6%), and bio, nature & agricultural (63 | 6.6%) are the most common fields of study among 962 individuals in Candler County who have obtained a bachelor's degree or higher.
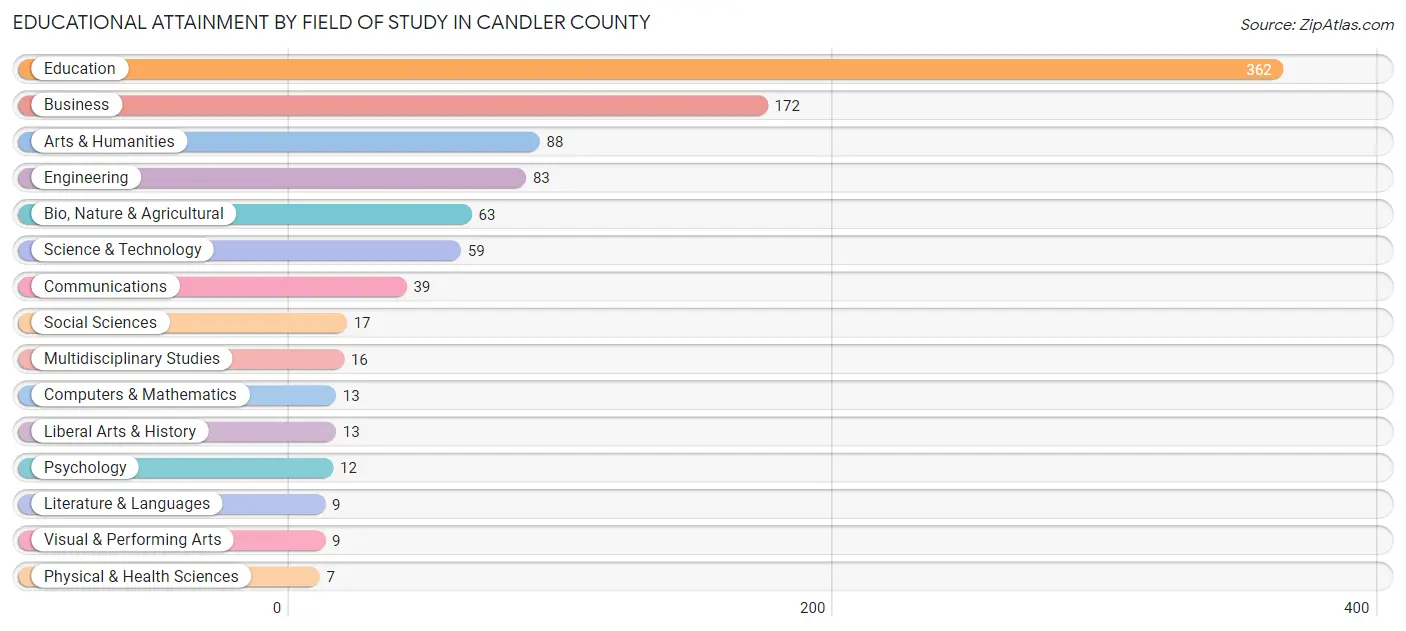
| Field of Study | # Graduates | % Graduates |
| Computers & Mathematics | 13 | 1.3% |
| Bio, Nature & Agricultural | 63 | 6.6% |
| Physical & Health Sciences | 7 | 0.7% |
| Psychology | 12 | 1.3% |
| Social Sciences | 17 | 1.8% |
| Engineering | 83 | 8.6% |
| Multidisciplinary Studies | 16 | 1.7% |
| Science & Technology | 59 | 6.1% |
| Business | 172 | 17.9% |
| Education | 362 | 37.6% |
| Literature & Languages | 9 | 0.9% |
| Liberal Arts & History | 13 | 1.3% |
| Visual & Performing Arts | 9 | 0.9% |
| Communications | 39 | 4.1% |
| Arts & Humanities | 88 | 9.1% |
| Total | 962 | 100.0% |
Transportation & Commute in Candler County
Vehicle Availability by Sex in Candler County
The most prevalent vehicle ownership categories in Candler County are males with 2 vehicles (1,030, accounting for 42.6%) and females with 2 vehicles (681, making up 51.2%).
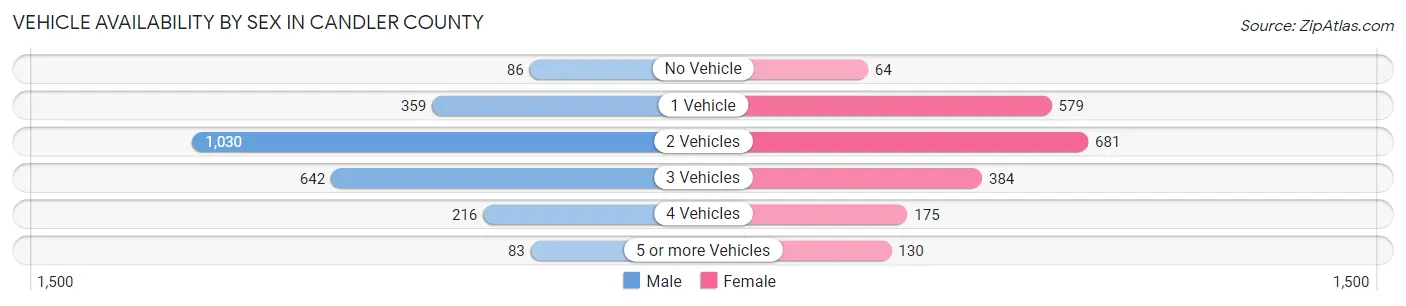
| Vehicles Available | Male | Female |
| No Vehicle | 86 (3.6%) | 64 (3.2%) |
| 1 Vehicle | 359 (14.9%) | 579 (28.8%) |
| 2 Vehicles | 1,030 (42.6%) | 681 (33.8%) |
| 3 Vehicles | 642 (26.6%) | 384 (19.1%) |
| 4 Vehicles | 216 (8.9%) | 175 (8.7%) |
| 5 or more Vehicles | 83 (3.4%) | 130 (6.5%) |
| Total | 2,416 (100.0%) | 2,013 (100.0%) |
Commute Time in Candler County
The most frequently occuring commute durations in Candler County are 10 to 14 minutes (723 commuters, 16.8%), 30 to 34 minutes (654 commuters, 15.2%), and 5 to 9 minutes (626 commuters, 14.5%).
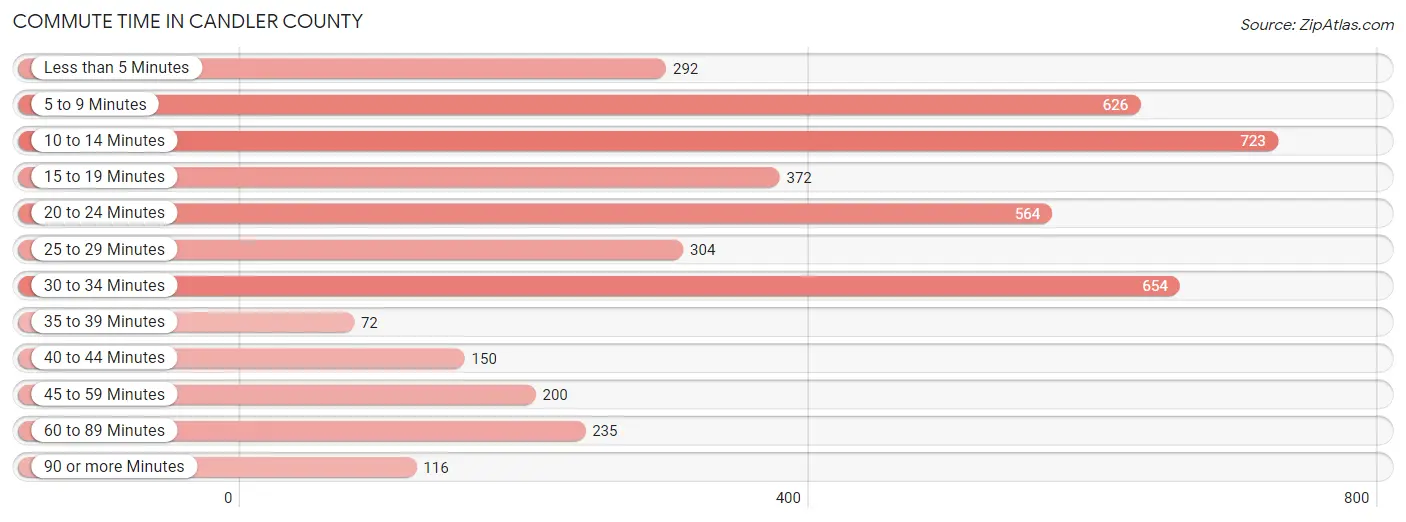
| Commute Time | # Commuters | % Commuters |
| Less than 5 Minutes | 292 | 6.8% |
| 5 to 9 Minutes | 626 | 14.5% |
| 10 to 14 Minutes | 723 | 16.8% |
| 15 to 19 Minutes | 372 | 8.6% |
| 20 to 24 Minutes | 564 | 13.1% |
| 25 to 29 Minutes | 304 | 7.1% |
| 30 to 34 Minutes | 654 | 15.2% |
| 35 to 39 Minutes | 72 | 1.7% |
| 40 to 44 Minutes | 150 | 3.5% |
| 45 to 59 Minutes | 200 | 4.6% |
| 60 to 89 Minutes | 235 | 5.4% |
| 90 or more Minutes | 116 | 2.7% |
Commute Time by Sex in Candler County
The most common commute times in Candler County are 10 to 14 minutes (357 commuters, 15.1%) for males and 10 to 14 minutes (366 commuters, 18.9%) for females.
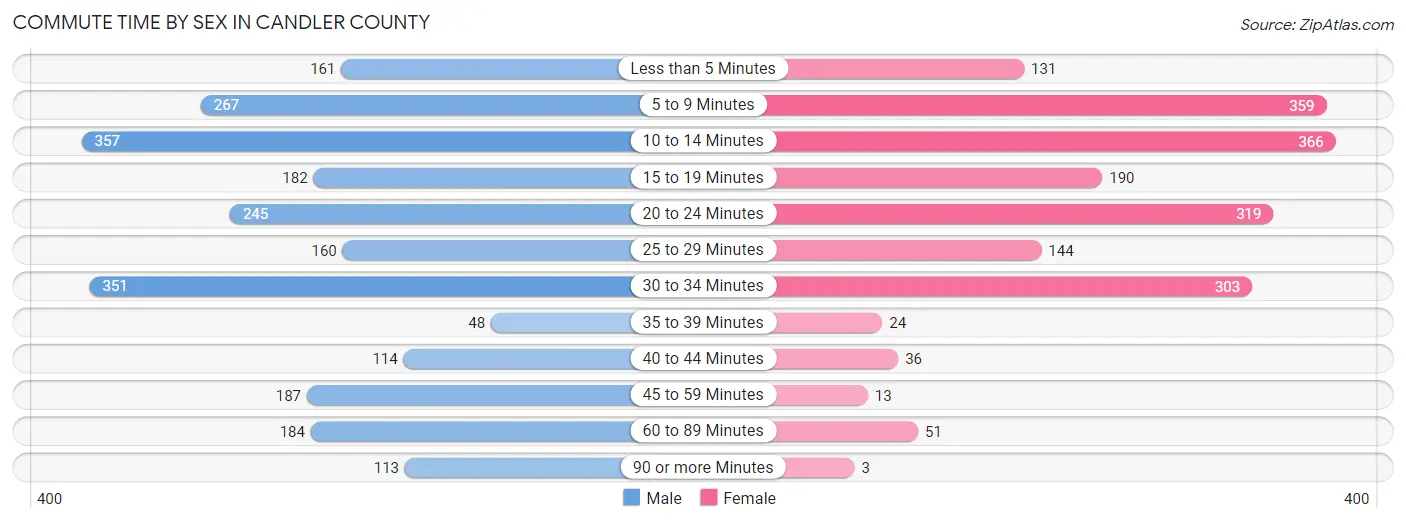
| Commute Time | Male | Female |
| Less than 5 Minutes | 161 (6.8%) | 131 (6.8%) |
| 5 to 9 Minutes | 267 (11.3%) | 359 (18.5%) |
| 10 to 14 Minutes | 357 (15.1%) | 366 (18.9%) |
| 15 to 19 Minutes | 182 (7.7%) | 190 (9.8%) |
| 20 to 24 Minutes | 245 (10.3%) | 319 (16.5%) |
| 25 to 29 Minutes | 160 (6.8%) | 144 (7.4%) |
| 30 to 34 Minutes | 351 (14.8%) | 303 (15.6%) |
| 35 to 39 Minutes | 48 (2.0%) | 24 (1.2%) |
| 40 to 44 Minutes | 114 (4.8%) | 36 (1.9%) |
| 45 to 59 Minutes | 187 (7.9%) | 13 (0.7%) |
| 60 to 89 Minutes | 184 (7.8%) | 51 (2.6%) |
| 90 or more Minutes | 113 (4.8%) | 3 (0.2%) |
Time of Departure to Work by Sex in Candler County
The most frequent times of departure to work in Candler County are 6:00 AM to 6:29 AM (388, 16.4%) for males and 7:00 AM to 7:29 AM (397, 20.5%) for females.
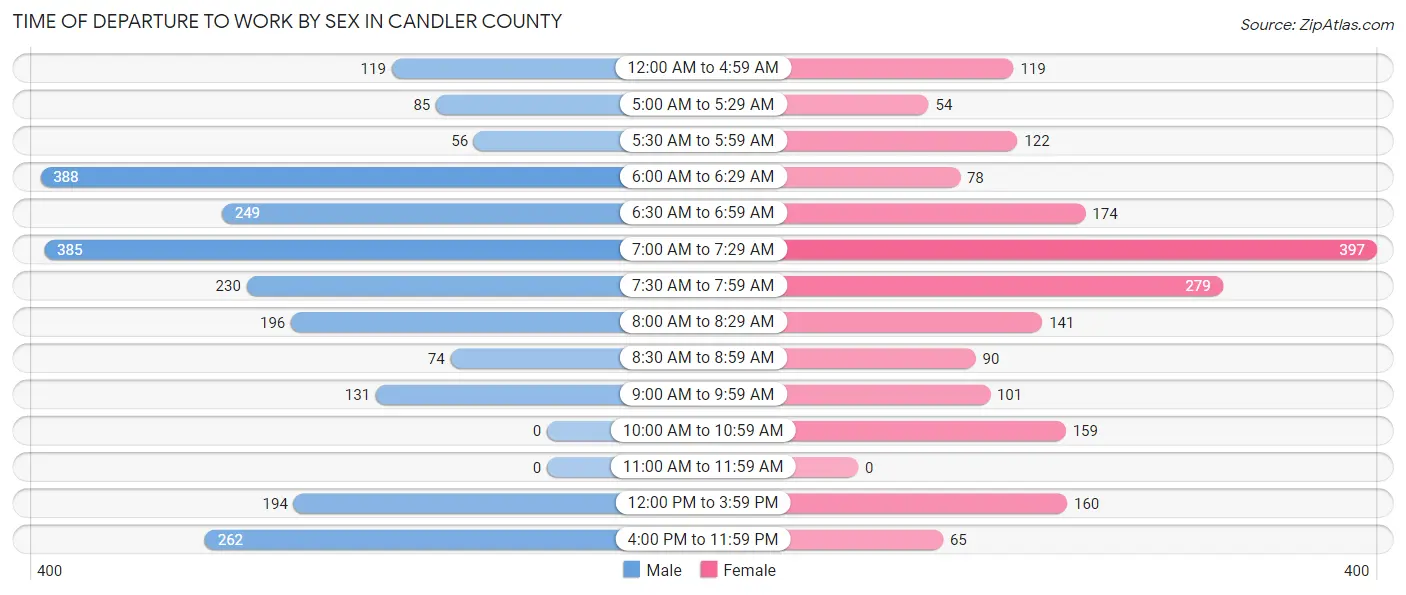
| Time of Departure | Male | Female |
| 12:00 AM to 4:59 AM | 119 (5.0%) | 119 (6.1%) |
| 5:00 AM to 5:29 AM | 85 (3.6%) | 54 (2.8%) |
| 5:30 AM to 5:59 AM | 56 (2.4%) | 122 (6.3%) |
| 6:00 AM to 6:29 AM | 388 (16.4%) | 78 (4.0%) |
| 6:30 AM to 6:59 AM | 249 (10.5%) | 174 (9.0%) |
| 7:00 AM to 7:29 AM | 385 (16.3%) | 397 (20.5%) |
| 7:30 AM to 7:59 AM | 230 (9.7%) | 279 (14.4%) |
| 8:00 AM to 8:29 AM | 196 (8.3%) | 141 (7.3%) |
| 8:30 AM to 8:59 AM | 74 (3.1%) | 90 (4.6%) |
| 9:00 AM to 9:59 AM | 131 (5.5%) | 101 (5.2%) |
| 10:00 AM to 10:59 AM | 0 (0.0%) | 159 (8.2%) |
| 11:00 AM to 11:59 AM | 0 (0.0%) | 0 (0.0%) |
| 12:00 PM to 3:59 PM | 194 (8.2%) | 160 (8.3%) |
| 4:00 PM to 11:59 PM | 262 (11.1%) | 65 (3.4%) |
| Total | 2,369 (100.0%) | 1,939 (100.0%) |
Housing Occupancy in Candler County
Occupancy by Ownership in Candler County
Of the total 4,103 dwellings in Candler County, owner-occupied units account for 2,499 (60.9%), while renter-occupied units make up 1,604 (39.1%).
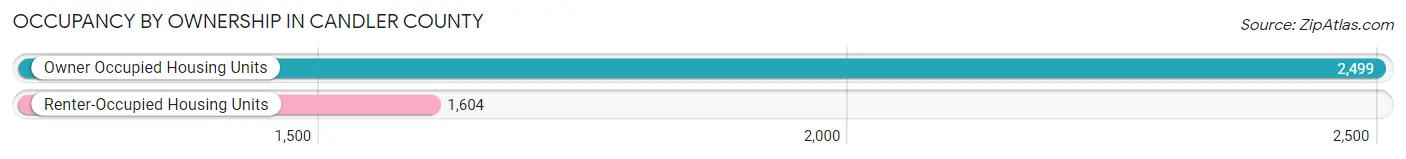
| Occupancy | # Housing Units | % Housing Units |
| Owner Occupied Housing Units | 2,499 | 60.9% |
| Renter-Occupied Housing Units | 1,604 | 39.1% |
| Total Occupied Housing Units | 4,103 | 100.0% |
Occupancy by Household Size in Candler County
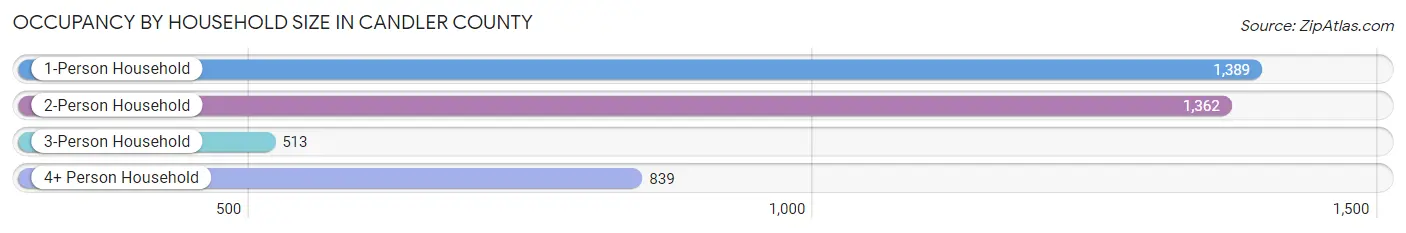
| Household Size | # Housing Units | % Housing Units |
| 1-Person Household | 1,389 | 33.9% |
| 2-Person Household | 1,362 | 33.2% |
| 3-Person Household | 513 | 12.5% |
| 4+ Person Household | 839 | 20.4% |
| Total Housing Units | 4,103 | 100.0% |
Occupancy by Ownership by Household Size in Candler County
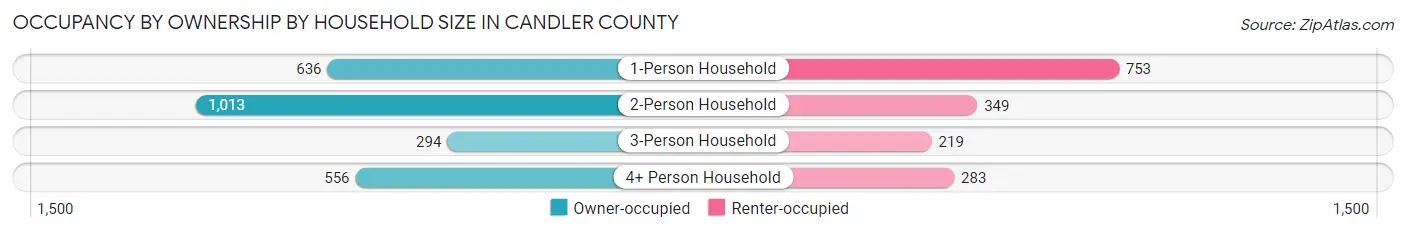
| Household Size | Owner-occupied | Renter-occupied |
| 1-Person Household | 636 (45.8%) | 753 (54.2%) |
| 2-Person Household | 1,013 (74.4%) | 349 (25.6%) |
| 3-Person Household | 294 (57.3%) | 219 (42.7%) |
| 4+ Person Household | 556 (66.3%) | 283 (33.7%) |
| Total Housing Units | 2,499 (60.9%) | 1,604 (39.1%) |
Occupancy by Educational Attainment in Candler County
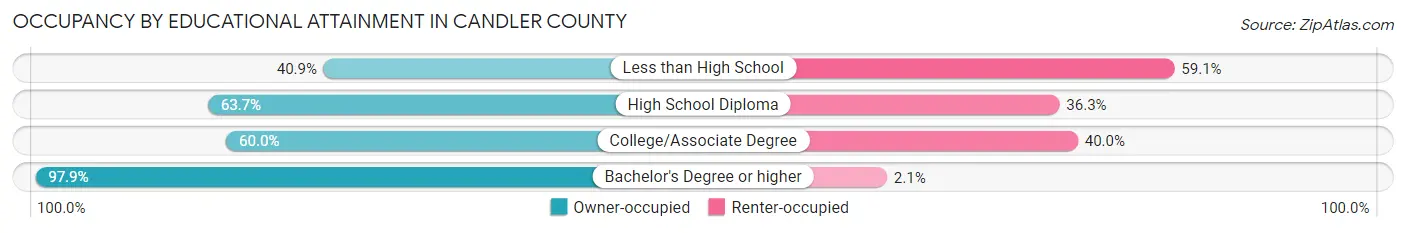
| Household Size | Owner-occupied | Renter-occupied |
| Less than High School | 403 (40.9%) | 583 (59.1%) |
| High School Diploma | 822 (63.7%) | 469 (36.3%) |
| College/Associate Degree | 814 (60.0%) | 542 (40.0%) |
| Bachelor's Degree or higher | 460 (97.9%) | 10 (2.1%) |
Occupancy by Age of Householder in Candler County
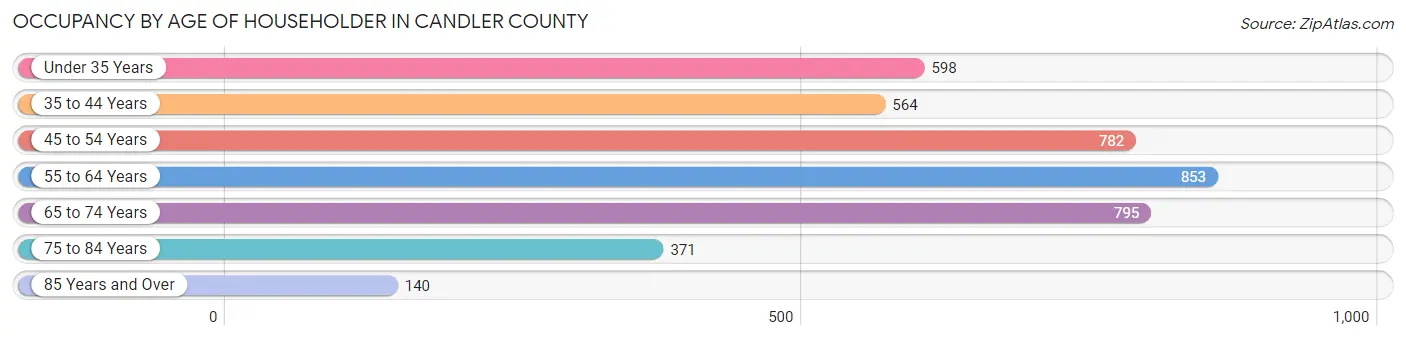
| Age Bracket | # Households | % Households |
| Under 35 Years | 598 | 14.6% |
| 35 to 44 Years | 564 | 13.8% |
| 45 to 54 Years | 782 | 19.1% |
| 55 to 64 Years | 853 | 20.8% |
| 65 to 74 Years | 795 | 19.4% |
| 75 to 84 Years | 371 | 9.0% |
| 85 Years and Over | 140 | 3.4% |
| Total | 4,103 | 100.0% |
Housing Finances in Candler County
Median Income by Occupancy in Candler County
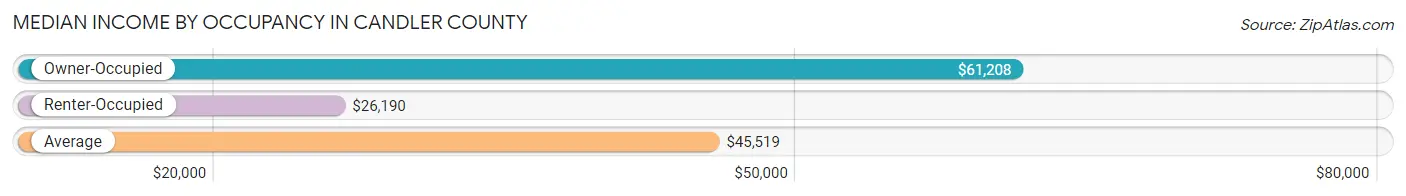
| Occupancy Type | # Households | Median Income |
| Owner-Occupied | 2,499 (60.9%) | $61,208 |
| Renter-Occupied | 1,604 (39.1%) | $26,190 |
| Average | 4,103 (100.0%) | $45,519 |
Occupancy by Householder Income Bracket in Candler County
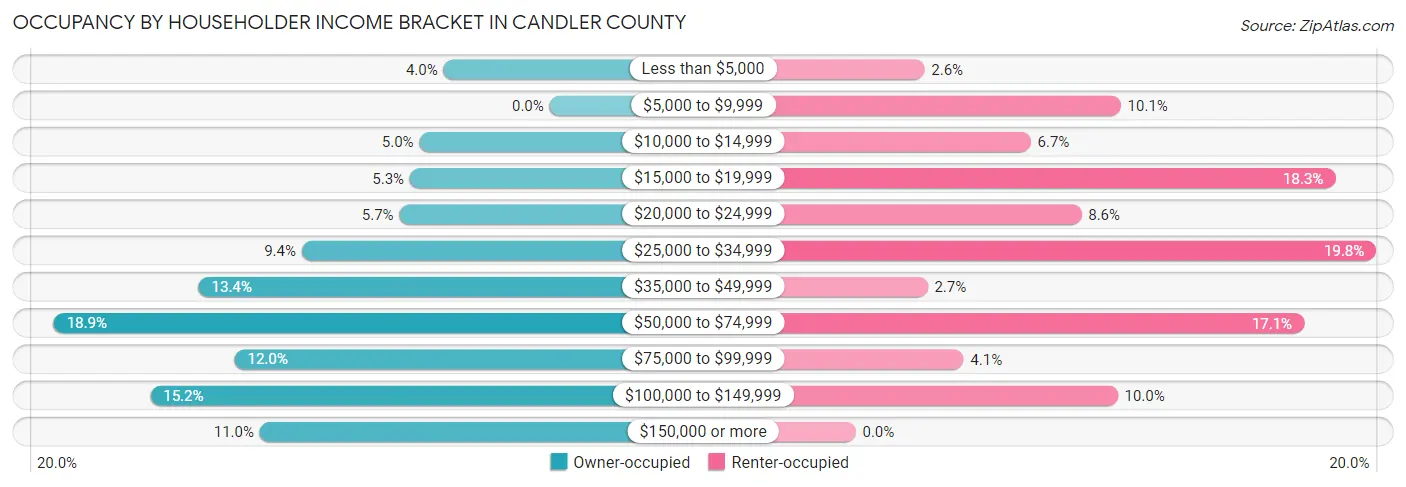
| Income Bracket | Owner-occupied | Renter-occupied |
| Less than $5,000 | 101 (4.0%) | 42 (2.6%) |
| $5,000 to $9,999 | 0 (0.0%) | 162 (10.1%) |
| $10,000 to $14,999 | 124 (5.0%) | 107 (6.7%) |
| $15,000 to $19,999 | 133 (5.3%) | 293 (18.3%) |
| $20,000 to $24,999 | 143 (5.7%) | 138 (8.6%) |
| $25,000 to $34,999 | 236 (9.4%) | 318 (19.8%) |
| $35,000 to $49,999 | 334 (13.4%) | 44 (2.7%) |
| $50,000 to $74,999 | 472 (18.9%) | 274 (17.1%) |
| $75,000 to $99,999 | 300 (12.0%) | 66 (4.1%) |
| $100,000 to $149,999 | 380 (15.2%) | 160 (10.0%) |
| $150,000 or more | 276 (11.0%) | 0 (0.0%) |
| Total | 2,499 (100.0%) | 1,604 (100.0%) |
Monthly Housing Cost Tiers in Candler County
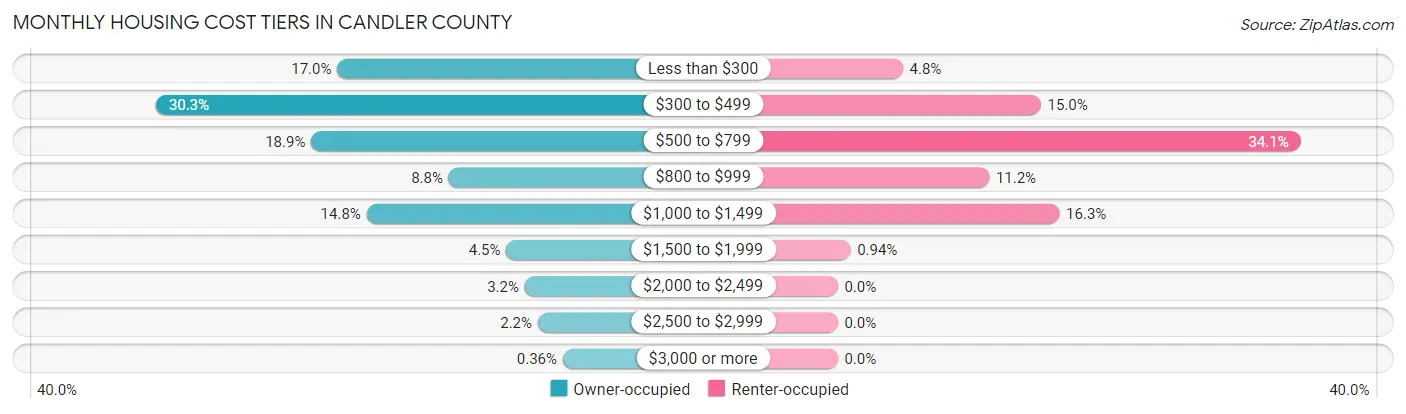
| Monthly Cost | Owner-occupied | Renter-occupied |
| Less than $300 | 424 (17.0%) | 77 (4.8%) |
| $300 to $499 | 758 (30.3%) | 240 (15.0%) |
| $500 to $799 | 472 (18.9%) | 547 (34.1%) |
| $800 to $999 | 219 (8.8%) | 179 (11.2%) |
| $1,000 to $1,499 | 370 (14.8%) | 262 (16.3%) |
| $1,500 to $1,999 | 113 (4.5%) | 15 (0.9%) |
| $2,000 to $2,499 | 79 (3.2%) | 0 (0.0%) |
| $2,500 to $2,999 | 55 (2.2%) | 0 (0.0%) |
| $3,000 or more | 9 (0.4%) | 0 (0.0%) |
| Total | 2,499 (100.0%) | 1,604 (100.0%) |
Physical Housing Characteristics in Candler County
Housing Structures in Candler County
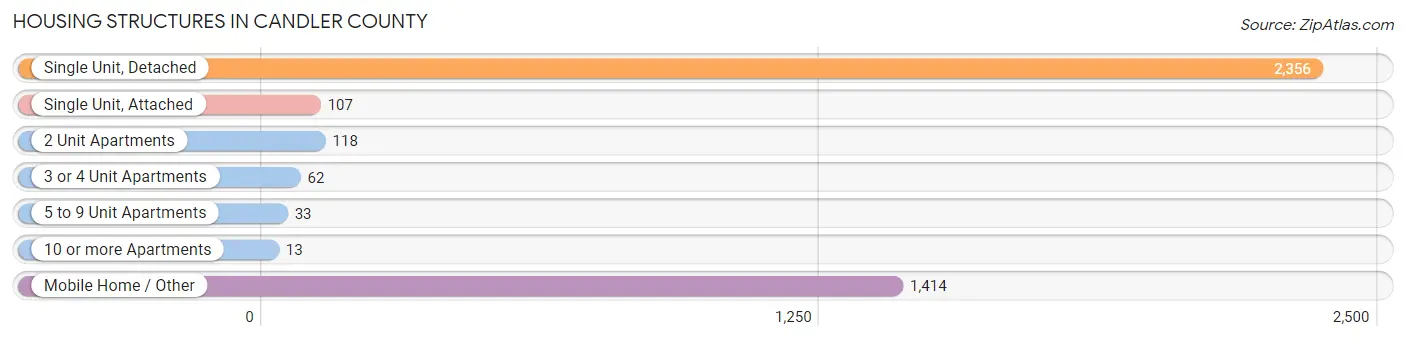
| Structure Type | # Housing Units | % Housing Units |
| Single Unit, Detached | 2,356 | 57.4% |
| Single Unit, Attached | 107 | 2.6% |
| 2 Unit Apartments | 118 | 2.9% |
| 3 or 4 Unit Apartments | 62 | 1.5% |
| 5 to 9 Unit Apartments | 33 | 0.8% |
| 10 or more Apartments | 13 | 0.3% |
| Mobile Home / Other | 1,414 | 34.5% |
| Total | 4,103 | 100.0% |
Housing Structures by Occupancy in Candler County
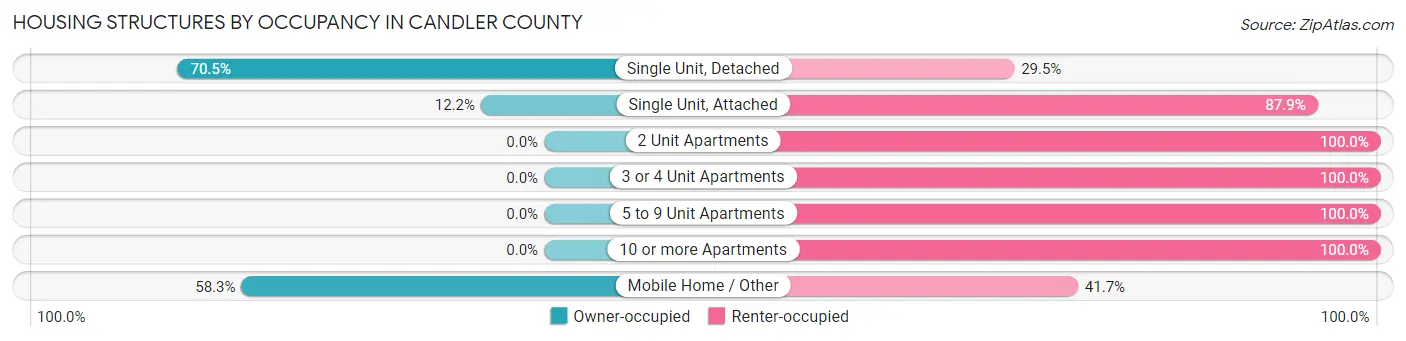
| Structure Type | Owner-occupied | Renter-occupied |
| Single Unit, Detached | 1,662 (70.5%) | 694 (29.5%) |
| Single Unit, Attached | 13 (12.1%) | 94 (87.8%) |
| 2 Unit Apartments | 0 (0.0%) | 118 (100.0%) |
| 3 or 4 Unit Apartments | 0 (0.0%) | 62 (100.0%) |
| 5 to 9 Unit Apartments | 0 (0.0%) | 33 (100.0%) |
| 10 or more Apartments | 0 (0.0%) | 13 (100.0%) |
| Mobile Home / Other | 824 (58.3%) | 590 (41.7%) |
| Total | 2,499 (60.9%) | 1,604 (39.1%) |
Housing Structures by Number of Rooms in Candler County
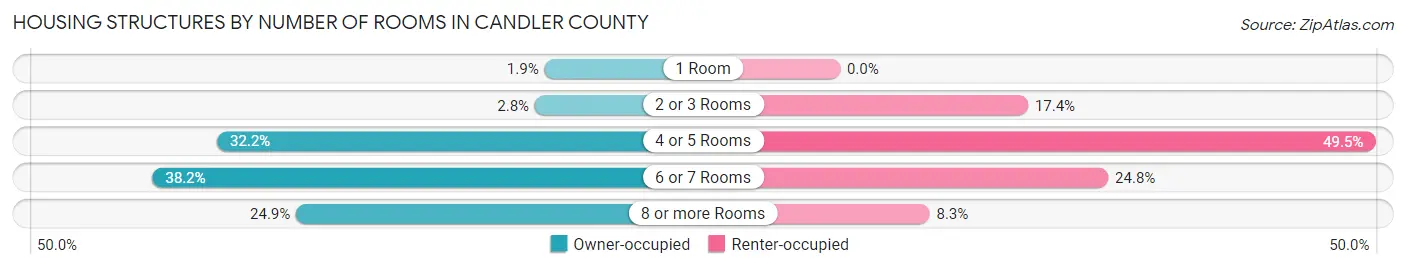
| Number of Rooms | Owner-occupied | Renter-occupied |
| 1 Room | 48 (1.9%) | 0 (0.0%) |
| 2 or 3 Rooms | 70 (2.8%) | 279 (17.4%) |
| 4 or 5 Rooms | 805 (32.2%) | 794 (49.5%) |
| 6 or 7 Rooms | 954 (38.2%) | 398 (24.8%) |
| 8 or more Rooms | 622 (24.9%) | 133 (8.3%) |
| Total | 2,499 (100.0%) | 1,604 (100.0%) |
Housing Structure by Heating Type in Candler County
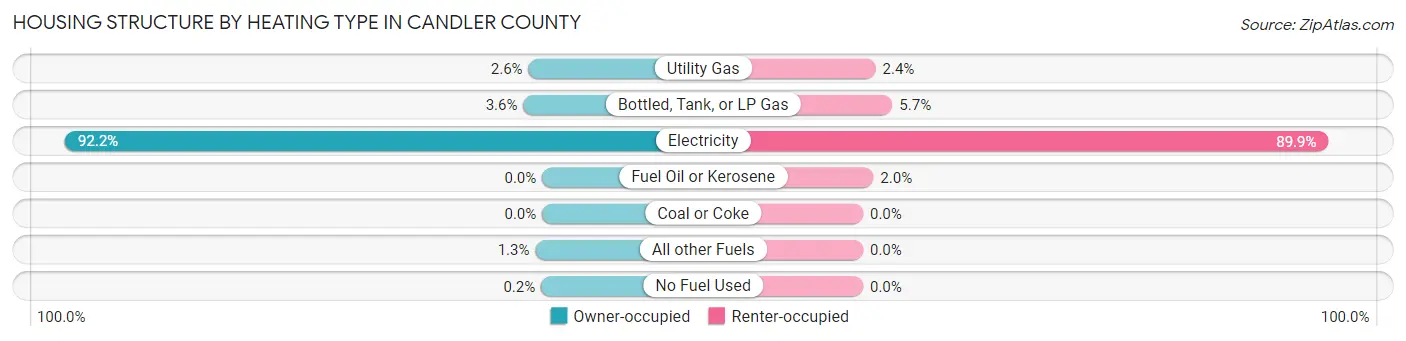
| Heating Type | Owner-occupied | Renter-occupied |
| Utility Gas | 66 (2.6%) | 39 (2.4%) |
| Bottled, Tank, or LP Gas | 91 (3.6%) | 91 (5.7%) |
| Electricity | 2,304 (92.2%) | 1,442 (89.9%) |
| Fuel Oil or Kerosene | 0 (0.0%) | 32 (2.0%) |
| Coal or Coke | 0 (0.0%) | 0 (0.0%) |
| All other Fuels | 33 (1.3%) | 0 (0.0%) |
| No Fuel Used | 5 (0.2%) | 0 (0.0%) |
| Total | 2,499 (100.0%) | 1,604 (100.0%) |
Household Vehicle Usage in Candler County
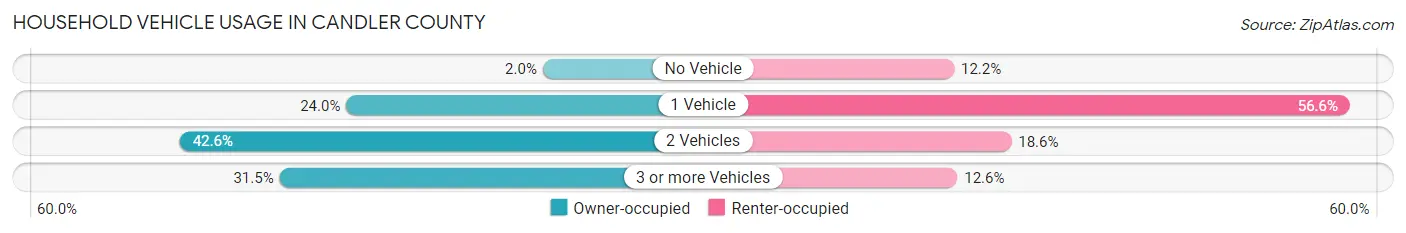
| Vehicles per Household | Owner-occupied | Renter-occupied |
| No Vehicle | 49 (2.0%) | 196 (12.2%) |
| 1 Vehicle | 599 (24.0%) | 907 (56.6%) |
| 2 Vehicles | 1,065 (42.6%) | 299 (18.6%) |
| 3 or more Vehicles | 786 (31.5%) | 202 (12.6%) |
| Total | 2,499 (100.0%) | 1,604 (100.0%) |
Real Estate & Mortgages in Candler County
Real Estate and Mortgage Overview in Candler County
| Characteristic | Without Mortgage | With Mortgage |
| Housing Units | 1,640 | 859 |
| Median Property Value | $131,000 | $158,100 |
| Median Household Income | $57,500 | $129 |
| Monthly Housing Costs | $416 | $9 |
| Real Estate Taxes | $1,234 | $29 |
Property Value by Mortgage Status in Candler County
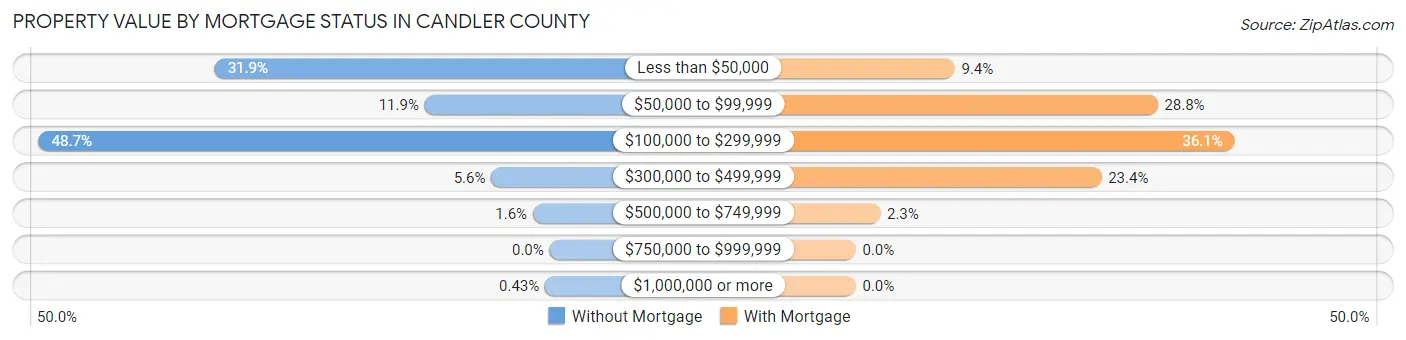
| Property Value | Without Mortgage | With Mortgage |
| Less than $50,000 | 523 (31.9%) | 81 (9.4%) |
| $50,000 to $99,999 | 195 (11.9%) | 247 (28.7%) |
| $100,000 to $299,999 | 798 (48.7%) | 310 (36.1%) |
| $300,000 to $499,999 | 91 (5.6%) | 201 (23.4%) |
| $500,000 to $749,999 | 26 (1.6%) | 20 (2.3%) |
| $750,000 to $999,999 | 0 (0.0%) | 0 (0.0%) |
| $1,000,000 or more | 7 (0.4%) | 0 (0.0%) |
| Total | 1,640 (100.0%) | 859 (100.0%) |
Household Income by Mortgage Status in Candler County
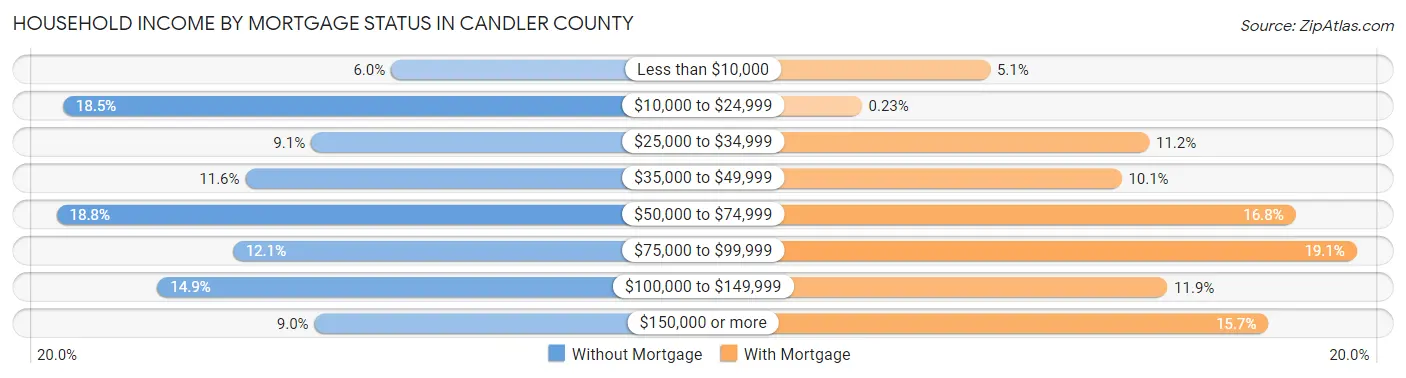
| Household Income | Without Mortgage | With Mortgage |
| Less than $10,000 | 99 (6.0%) | 44 (5.1%) |
| $10,000 to $24,999 | 304 (18.5%) | 2 (0.2%) |
| $25,000 to $34,999 | 149 (9.1%) | 96 (11.2%) |
| $35,000 to $49,999 | 190 (11.6%) | 87 (10.1%) |
| $50,000 to $74,999 | 308 (18.8%) | 144 (16.8%) |
| $75,000 to $99,999 | 198 (12.1%) | 164 (19.1%) |
| $100,000 to $149,999 | 245 (14.9%) | 102 (11.9%) |
| $150,000 or more | 147 (9.0%) | 135 (15.7%) |
| Total | 1,640 (100.0%) | 859 (100.0%) |
Property Value to Household Income Ratio in Candler County
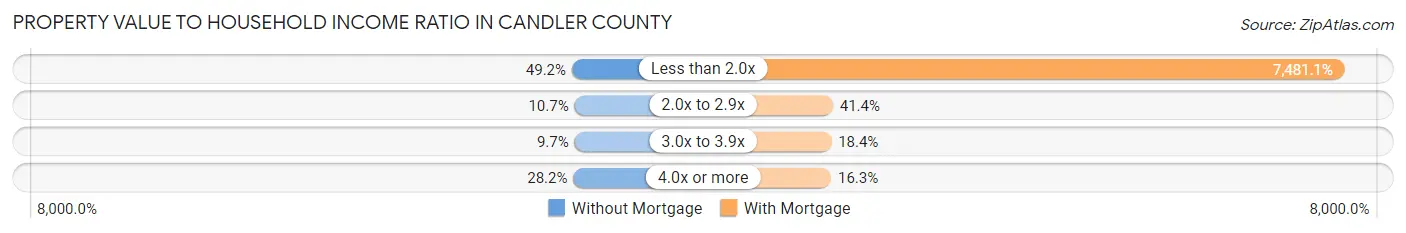
| Value-to-Income Ratio | Without Mortgage | With Mortgage |
| Less than 2.0x | 806 (49.1%) | 64,263 (7,481.1%) |
| 2.0x to 2.9x | 176 (10.7%) | 356 (41.4%) |
| 3.0x to 3.9x | 159 (9.7%) | 158 (18.4%) |
| 4.0x or more | 463 (28.2%) | 140 (16.3%) |
| Total | 1,640 (100.0%) | 859 (100.0%) |
Real Estate Taxes by Mortgage Status in Candler County
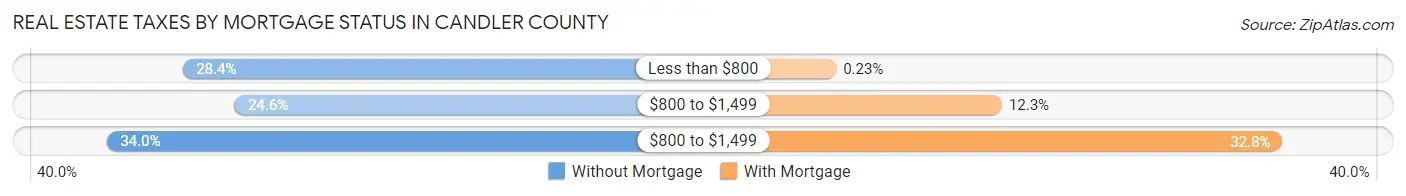
| Property Taxes | Without Mortgage | With Mortgage |
| Less than $800 | 466 (28.4%) | 2 (0.2%) |
| $800 to $1,499 | 404 (24.6%) | 106 (12.3%) |
| $800 to $1,499 | 557 (34.0%) | 282 (32.8%) |
| Total | 1,640 (100.0%) | 859 (100.0%) |
Health & Disability in Candler County
Health Insurance Coverage by Age in Candler County
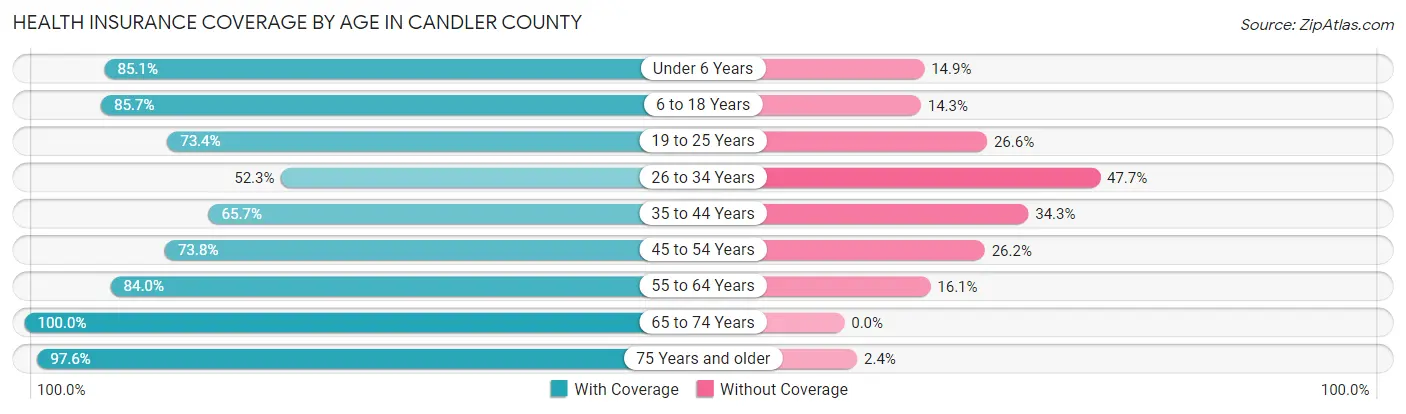
| Age Bracket | With Coverage | Without Coverage |
| Under 6 Years | 759 (85.1%) | 133 (14.9%) |
| 6 to 18 Years | 1,622 (85.7%) | 270 (14.3%) |
| 19 to 25 Years | 648 (73.4%) | 235 (26.6%) |
| 26 to 34 Years | 543 (52.3%) | 495 (47.7%) |
| 35 to 44 Years | 773 (65.7%) | 404 (34.3%) |
| 45 to 54 Years | 1,133 (73.8%) | 402 (26.2%) |
| 55 to 64 Years | 1,130 (84.0%) | 216 (16.1%) |
| 65 to 74 Years | 1,175 (100.0%) | 0 (0.0%) |
| 75 Years and older | 693 (97.6%) | 17 (2.4%) |
| Total | 8,476 (79.6%) | 2,172 (20.4%) |
Health Insurance Coverage by Citizenship Status in Candler County
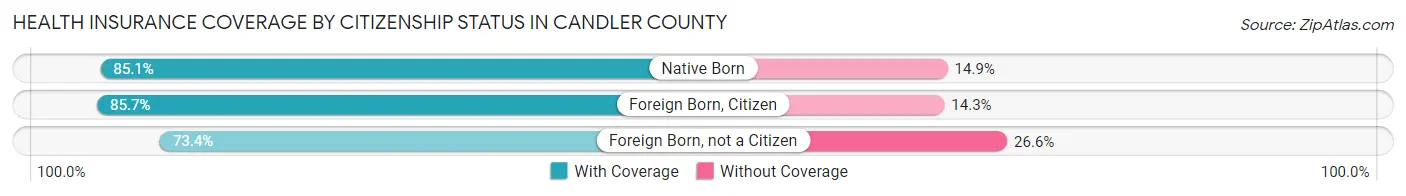
| Citizenship Status | With Coverage | Without Coverage |
| Native Born | 759 (85.1%) | 133 (14.9%) |
| Foreign Born, Citizen | 1,622 (85.7%) | 270 (14.3%) |
| Foreign Born, not a Citizen | 648 (73.4%) | 235 (26.6%) |
Health Insurance Coverage by Household Income in Candler County
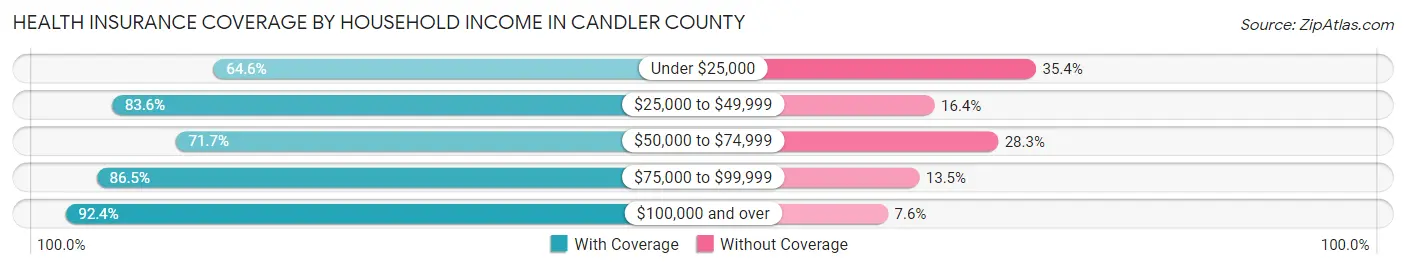
| Household Income | With Coverage | Without Coverage |
| Under $25,000 | 1,577 (64.6%) | 863 (35.4%) |
| $25,000 to $49,999 | 2,019 (83.6%) | 395 (16.4%) |
| $50,000 to $74,999 | 1,395 (71.7%) | 550 (28.3%) |
| $75,000 to $99,999 | 1,032 (86.5%) | 161 (13.5%) |
| $100,000 and over | 2,453 (92.4%) | 203 (7.6%) |
Public vs Private Health Insurance Coverage by Age in Candler County
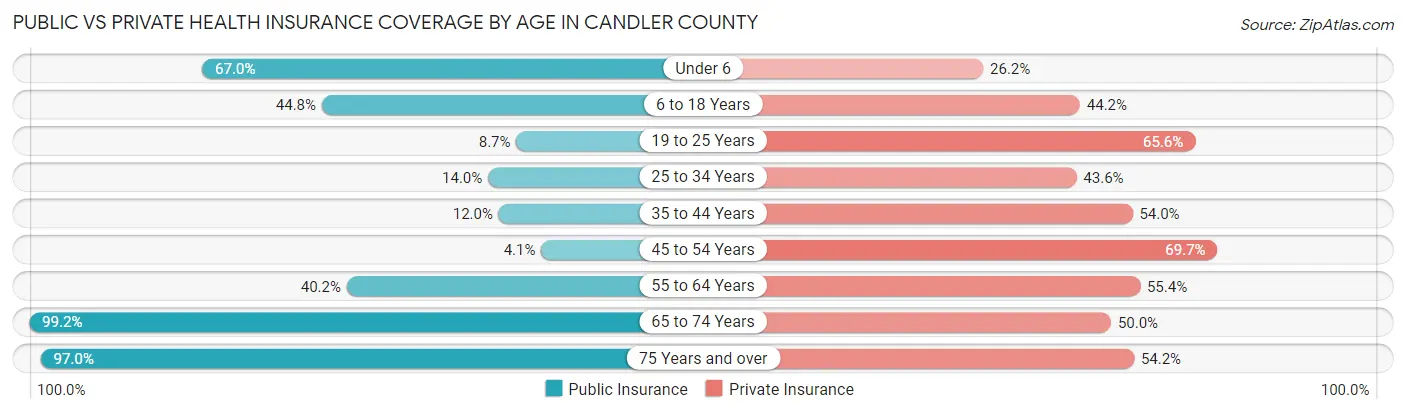
| Age Bracket | Public Insurance | Private Insurance |
| Under 6 | 598 (67.0%) | 234 (26.2%) |
| 6 to 18 Years | 848 (44.8%) | 836 (44.2%) |
| 19 to 25 Years | 77 (8.7%) | 579 (65.6%) |
| 25 to 34 Years | 145 (14.0%) | 452 (43.5%) |
| 35 to 44 Years | 141 (12.0%) | 635 (53.9%) |
| 45 to 54 Years | 63 (4.1%) | 1,070 (69.7%) |
| 55 to 64 Years | 541 (40.2%) | 745 (55.3%) |
| 65 to 74 Years | 1,165 (99.2%) | 587 (50.0%) |
| 75 Years and over | 689 (97.0%) | 385 (54.2%) |
| Total | 4,267 (40.1%) | 5,523 (51.9%) |
Disability Status by Sex by Age in Candler County
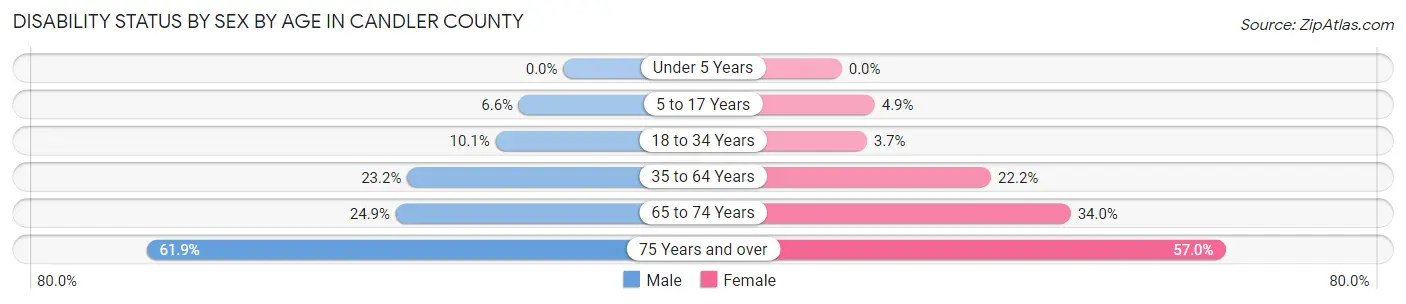
| Age Bracket | Male | Female |
| Under 5 Years | 0 (0.0%) | 0 (0.0%) |
| 5 to 17 Years | 67 (6.6%) | 46 (4.9%) |
| 18 to 34 Years | 109 (10.1%) | 35 (3.7%) |
| 35 to 64 Years | 459 (23.2%) | 461 (22.2%) |
| 65 to 74 Years | 140 (24.9%) | 208 (34.0%) |
| 75 Years and over | 208 (61.9%) | 213 (57.0%) |
Disability Class by Sex by Age in Candler County
Disability Class: Hearing Difficulty
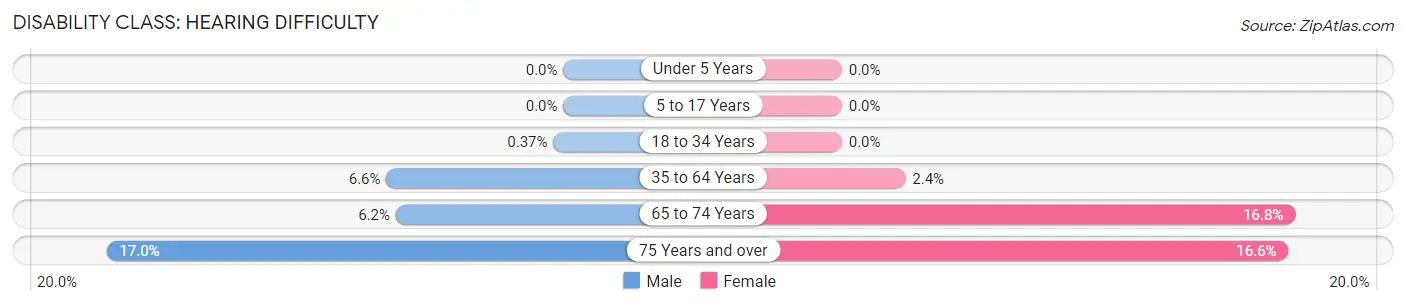
| Age Bracket | Male | Female |
| Under 5 Years | 0 (0.0%) | 0 (0.0%) |
| 5 to 17 Years | 0 (0.0%) | 0 (0.0%) |
| 18 to 34 Years | 4 (0.4%) | 0 (0.0%) |
| 35 to 64 Years | 130 (6.6%) | 49 (2.4%) |
| 65 to 74 Years | 35 (6.2%) | 103 (16.8%) |
| 75 Years and over | 57 (17.0%) | 62 (16.6%) |
Disability Class: Vision Difficulty
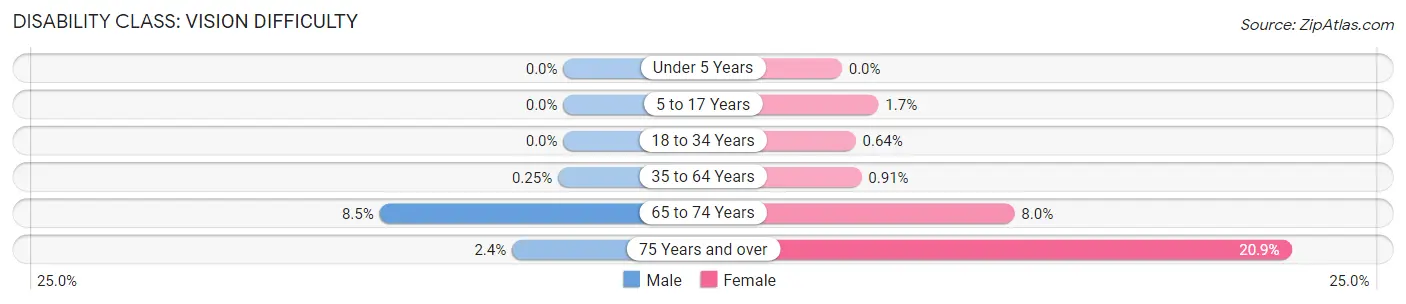
| Age Bracket | Male | Female |
| Under 5 Years | 0 (0.0%) | 0 (0.0%) |
| 5 to 17 Years | 0 (0.0%) | 16 (1.7%) |
| 18 to 34 Years | 0 (0.0%) | 6 (0.6%) |
| 35 to 64 Years | 5 (0.3%) | 19 (0.9%) |
| 65 to 74 Years | 48 (8.5%) | 49 (8.0%) |
| 75 Years and over | 8 (2.4%) | 78 (20.9%) |
Disability Class: Cognitive Difficulty
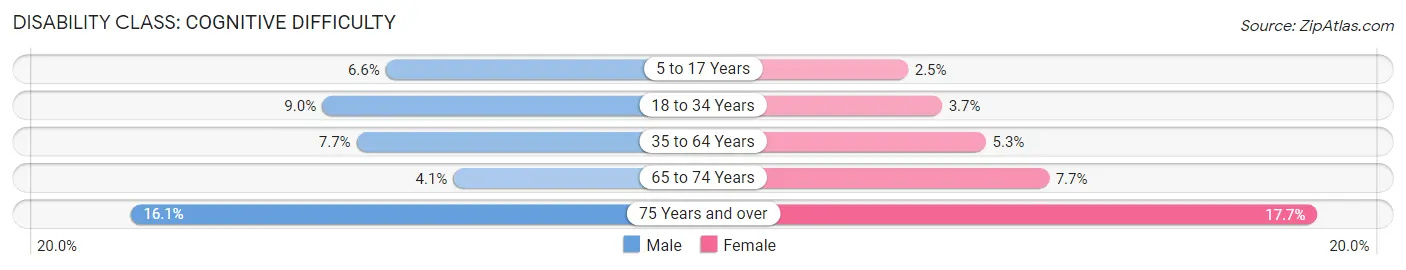
| Age Bracket | Male | Female |
| 5 to 17 Years | 67 (6.6%) | 23 (2.5%) |
| 18 to 34 Years | 97 (9.0%) | 35 (3.7%) |
| 35 to 64 Years | 152 (7.7%) | 111 (5.3%) |
| 65 to 74 Years | 23 (4.1%) | 47 (7.7%) |
| 75 Years and over | 54 (16.1%) | 66 (17.6%) |
Disability Class: Ambulatory Difficulty
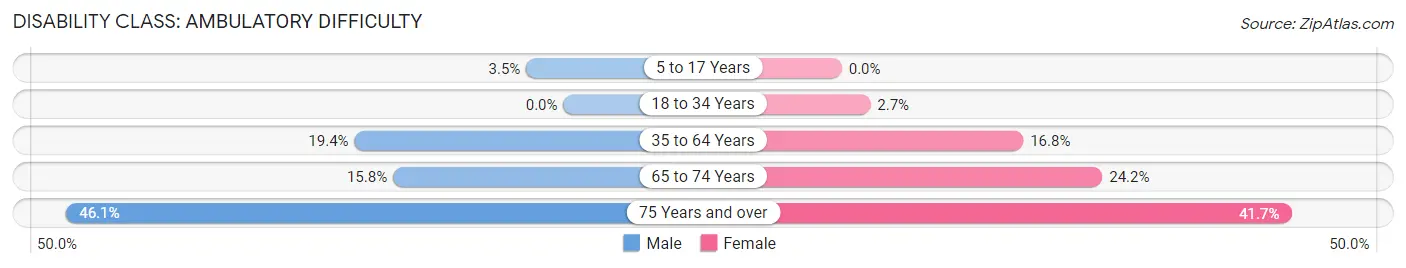
| Age Bracket | Male | Female |
| 5 to 17 Years | 35 (3.5%) | 0 (0.0%) |
| 18 to 34 Years | 0 (0.0%) | 25 (2.6%) |
| 35 to 64 Years | 384 (19.4%) | 350 (16.8%) |
| 65 to 74 Years | 89 (15.8%) | 148 (24.2%) |
| 75 Years and over | 155 (46.1%) | 156 (41.7%) |
Disability Class: Self-Care Difficulty
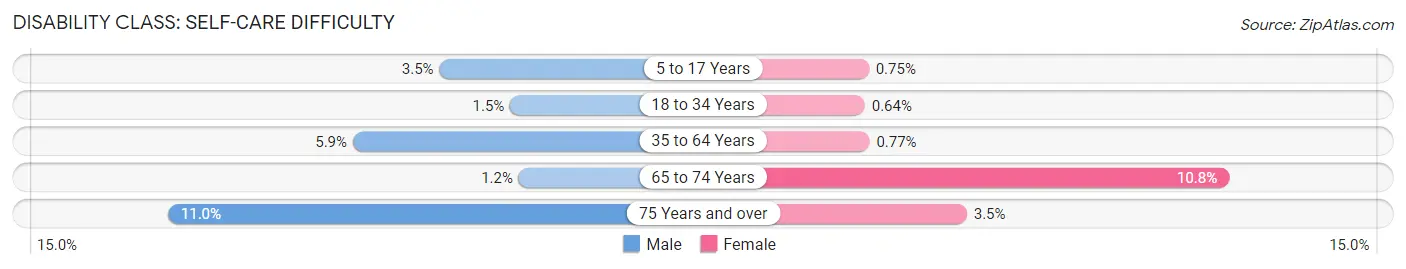
| Age Bracket | Male | Female |
| 5 to 17 Years | 35 (3.5%) | 7 (0.7%) |
| 18 to 34 Years | 16 (1.5%) | 6 (0.6%) |
| 35 to 64 Years | 116 (5.9%) | 16 (0.8%) |
| 65 to 74 Years | 7 (1.2%) | 66 (10.8%) |
| 75 Years and over | 37 (11.0%) | 13 (3.5%) |
Technology Access in Candler County
Computing Device Access in Candler County
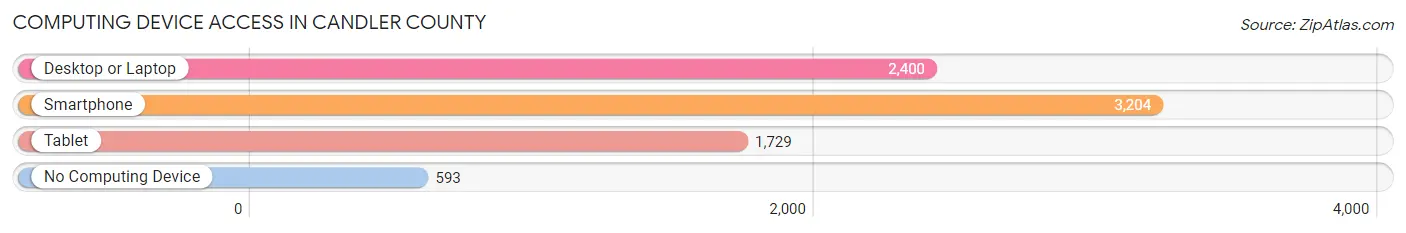
| Device Type | # Households | % Households |
| Desktop or Laptop | 2,400 | 58.5% |
| Smartphone | 3,204 | 78.1% |
| Tablet | 1,729 | 42.1% |
| No Computing Device | 593 | 14.4% |
| Total | 4,103 | 100.0% |
Internet Access in Candler County
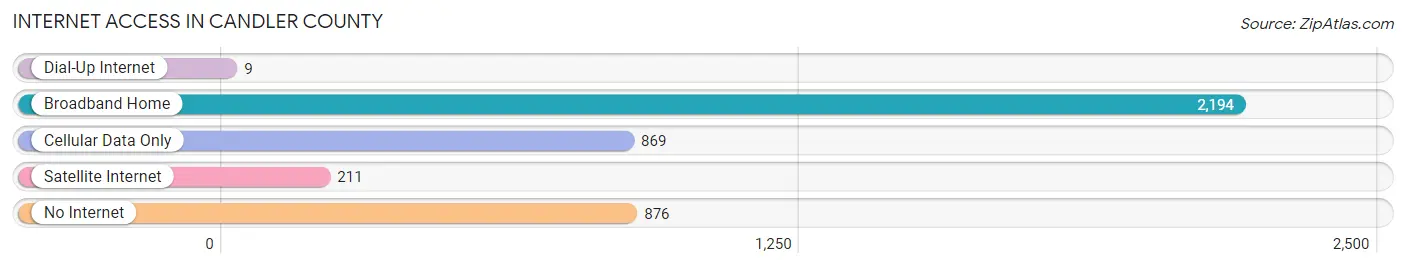
| Internet Type | # Households | % Households |
| Dial-Up Internet | 9 | 0.2% |
| Broadband Home | 2,194 | 53.5% |
| Cellular Data Only | 869 | 21.2% |
| Satellite Internet | 211 | 5.1% |
| No Internet | 876 | 21.3% |
| Total | 4,103 | 100.0% |
Candler County Summary
Candler County is a county located in the U.S. state of Georgia. As of the 2010 census, the population was 10,998. The county seat is Metter. The county was created on August 17, 1914 from parts of Bulloch, Emanuel, and Tattnall counties. It is named for Allen D. Candler, the 56th Governor of Georgia.
Geography
Candler County is located in the southeastern part of the state of Georgia. It is bordered by Bulloch County to the north, Emanuel County to the east, Tattnall County to the south, and Evans County to the west. The county has a total area of 441 square miles, of which 437 square miles is land and 4.2 square miles (1.0%) is water.
The county is located in the Ogeechee River basin and is drained by the Canoochee River. The county is located in the Coastal Plain region of Georgia and is characterized by flat terrain with sandy soils. The highest point in the county is located at an elevation of 250 feet above sea level.
Demographics
As of the 2010 United States Census, there were 10,998 people, 4,072 households, and 2,845 families residing in the county. The population density was 25.1 inhabitants per square mile (9.7/km2). There were 4,717 housing units at an average density of 10.8 per square mile (4.2/km2). The racial makeup of the county was 68.2% white, 28.3% black or African American, 0.4% Asian, 0.3% American Indian, 0.7% from other races, and 2.1% from two or more races. Those of Hispanic or Latino origin made up 2.2% of the population.
In terms of ancestry, 16.2% were American, 8.7% were English, 8.3% were Irish, and 6.2% were German. Of the 4,072 households, 33.2% had children under the age of 18 living with them, 48.2% were married couples living together, 17.2% had a female householder with no husband present, 28.7% were non-families, and 24.7% of all households were made up of individuals. The average household size was 2.60 and the average family size was 3.09.
The median age in the county was 38.3 years. 24.7% of residents were under the age of 18; 8.7% were between the ages of 18 and 24; 24.2% were from 25 to 44; 27.2% were from 45 to 64; and 15.2% were 65 years of age or older. The gender makeup of the county was 48.2% male and 51.8% female.
Economy
The economy of Candler County is largely based on agriculture. The county is home to a variety of crops, including corn, soybeans, cotton, peanuts, and hay. Livestock production is also important to the local economy, with cattle, hogs, and poultry being the main types of livestock raised in the county.
The county is also home to several manufacturing companies, including a paper mill, a wood products plant, and a plastics plant. The county is also home to several retail businesses, including grocery stores, restaurants, and clothing stores.
The county is served by the Metter-Candler Airport, which is located in the city of Metter. The airport offers general aviation services, including charter flights and air taxi services.
Conclusion
Candler County is a county located in the U.S. state of Georgia. As of the 2010 census, the population was 10,998. The county seat is Metter. The county was created on August 17, 1914 from parts of Bulloch, Emanuel, and Tattnall counties. It is named for Allen D. Candler, the 56th Governor of Georgia. The county is located in the Ogeechee River basin and is drained by the Canoochee River. The county is located in the Coastal Plain region of Georgia and is characterized by flat terrain with sandy soils. The economy of Candler County is largely based on agriculture, with crops such as corn, soybeans, cotton, peanuts, and hay being the main products. Livestock production is also important to the local economy, with cattle, hogs, and poultry being the main types of livestock raised in the county. The county is also home to several manufacturing companies, including a paper mill, a wood products plant, and a plastics plant. The county is served by the Metter-Candler Airport, which is located in the city of Metter.
Common Questions
What is Per Capita Income in Candler County?
Per Capita income in Candler County is $24,477.
What is the Median Family Income in Candler County?
Median Family Income in Candler County is $63,571.
What is the Median Household income in Candler County?
Median Household Income in Candler County is $45,519.
What is Income or Wage Gap in Candler County?
Income or Wage Gap in Candler County is 29.1%.
Women in Candler County earn 70.9 cents for every dollar earned by a man.
What is Family Income Deficit in Candler County?
Family Income Deficit in Candler County is $15,688.
Families that are below poverty line in Candler County earn $15,688 less on average than the poverty threshold level.
What is Inequality or Gini Index in Candler County?
Inequality or Gini Index in Candler County is 0.46.
What is the Total Population of Candler County?
Total Population of Candler County is 10,946.
What is the Total Male Population of Candler County?
Total Male Population of Candler County is 5,334.
What is the Total Female Population of Candler County?
Total Female Population of Candler County is 5,612.
What is the Ratio of Males per 100 Females in Candler County?
There are 95.05 Males per 100 Females in Candler County.
What is the Ratio of Females per 100 Males in Candler County?
There are 105.21 Females per 100 Males in Candler County.
What is the Median Population Age in Candler County?
Median Population Age in Candler County is 41.6 Years.
What is the Average Family Size in Candler County
Average Family Size in Candler County is 3.4 People.
What is the Average Household Size in Candler County
Average Household Size in Candler County is 2.6 People.
How Large is the Labor Force in Candler County?
There are 4,645 People in the Labor Forcein in Candler County.
What is the Percentage of People in the Labor Force in Candler County?
54.1% of People are in the Labor Force in Candler County.
What is the Unemployment Rate in Candler County?
Unemployment Rate in Candler County is 3.9%.