Brantley County, GA Map & Demographics
Brantley County Map
Brantley County Overview
$22,767
PER CAPITA INCOME
$60,170
AVG FAMILY INCOME
$40,166
AVG HOUSEHOLD INCOME
31.6%
WAGE / INCOME GAP [ % ]
68.4¢/ $1
WAGE / INCOME GAP [ $ ]
$11,497
FAMILY INCOME DEFICIT
0.45
INEQUALITY / GINI INDEX
18,105
TOTAL POPULATION
8,970
MALE POPULATION
9,135
FEMALE POPULATION
98.19
MALES / 100 FEMALES
101.84
FEMALES / 100 MALES
40.2
MEDIAN AGE
3.7
AVG FAMILY SIZE
2.7
AVG HOUSEHOLD SIZE
7,233
LABOR FORCE [ PEOPLE ]
50.3%
PERCENT IN LABOR FORCE
3.3%
UNEMPLOYMENT RATE
Brantley County Area Codes
Income in Brantley County
Income Overview in Brantley County
Per Capita Income in Brantley County is $22,767, while median incomes of families and households are $60,170 and $40,166 respectively.
| Characteristic | Number | Measure |
| Per Capita Income | 18,105 | $22,767 |
| Median Family Income | 3,938 | $60,170 |
| Mean Family Income | 3,938 | $69,380 |
| Median Household Income | 6,649 | $40,166 |
| Mean Household Income | 6,649 | $55,077 |
| Income Deficit | 3,938 | $11,497 |
| Wage / Income Gap (%) | 18,105 | 31.60% |
| Wage / Income Gap ($) | 18,105 | 68.40¢ per $1 |
| Gini / Inequality Index | 18,105 | 0.45 |
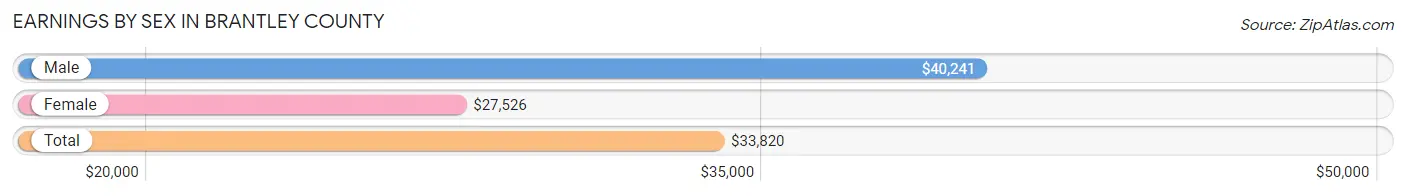
Earnings by Sex in Brantley County
Average Earnings in Brantley County are $33,820, $40,241 for men and $27,526 for women, a difference of 31.6%.
| Sex | Number | Average Earnings |
| Male | 4,155 (54.3%) | $40,241 |
| Female | 3,503 (45.7%) | $27,526 |
| Total | 7,658 (100.0%) | $33,820 |
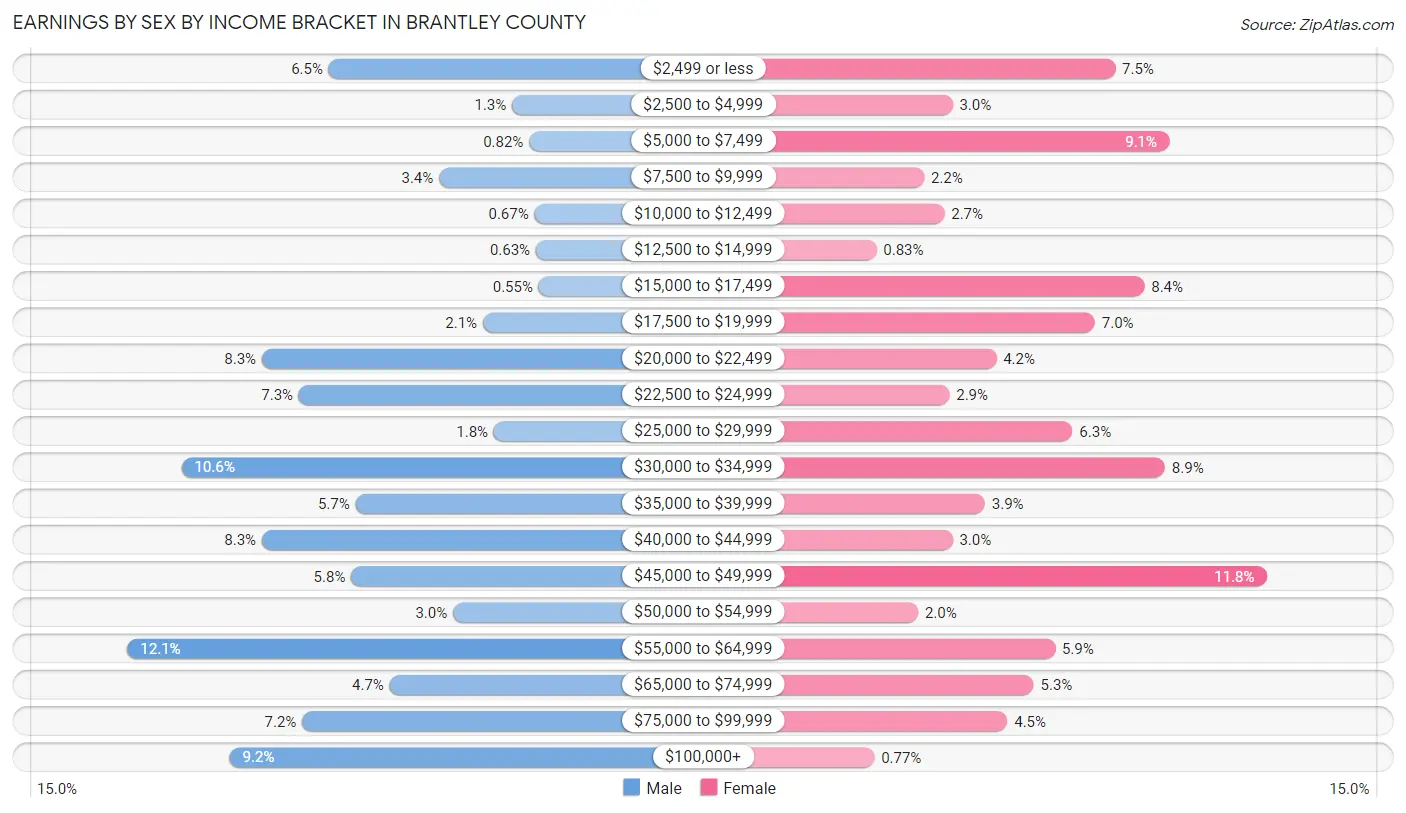
Earnings by Sex by Income Bracket in Brantley County
The most common earnings brackets in Brantley County are $55,000 to $64,999 for men (503 | 12.1%) and $45,000 to $49,999 for women (413 | 11.8%).
| Income | Male | Female |
| $2,499 or less | 268 (6.5%) | 264 (7.5%) |
| $2,500 to $4,999 | 54 (1.3%) | 104 (3.0%) |
| $5,000 to $7,499 | 34 (0.8%) | 317 (9.0%) |
| $7,500 to $9,999 | 139 (3.4%) | 76 (2.2%) |
| $10,000 to $12,499 | 28 (0.7%) | 96 (2.7%) |
| $12,500 to $14,999 | 26 (0.6%) | 29 (0.8%) |
| $15,000 to $17,499 | 23 (0.5%) | 293 (8.4%) |
| $17,500 to $19,999 | 88 (2.1%) | 244 (7.0%) |
| $20,000 to $22,499 | 346 (8.3%) | 147 (4.2%) |
| $22,500 to $24,999 | 303 (7.3%) | 101 (2.9%) |
| $25,000 to $29,999 | 75 (1.8%) | 222 (6.3%) |
| $30,000 to $34,999 | 440 (10.6%) | 313 (8.9%) |
| $35,000 to $39,999 | 237 (5.7%) | 136 (3.9%) |
| $40,000 to $44,999 | 346 (8.3%) | 104 (3.0%) |
| $45,000 to $49,999 | 242 (5.8%) | 413 (11.8%) |
| $50,000 to $54,999 | 123 (3.0%) | 70 (2.0%) |
| $55,000 to $64,999 | 503 (12.1%) | 205 (5.9%) |
| $65,000 to $74,999 | 197 (4.7%) | 184 (5.2%) |
| $75,000 to $99,999 | 299 (7.2%) | 158 (4.5%) |
| $100,000+ | 384 (9.2%) | 27 (0.8%) |
| Total | 4,155 (100.0%) | 3,503 (100.0%) |
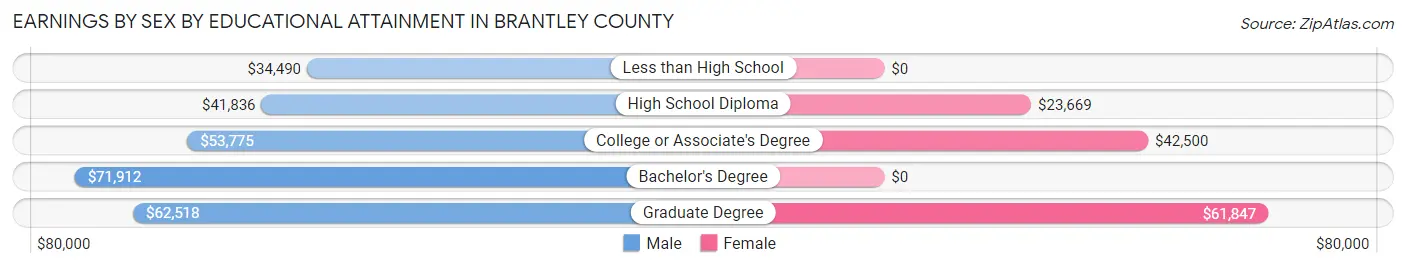
Earnings by Sex by Educational Attainment in Brantley County
Average earnings in Brantley County are $42,795 for men and $31,201 for women, a difference of 27.1%. Men with an educational attainment of bachelor's degree enjoy the highest average annual earnings of $71,912, while those with less than high school education earn the least with $34,490. Women with an educational attainment of graduate degree earn the most with the average annual earnings of $61,847, while those with high school diploma education have the smallest earnings of $23,669.
| Educational Attainment | Male Income | Female Income |
| Less than High School | $34,490 | $0 |
| High School Diploma | $41,836 | $23,669 |
| College or Associate's Degree | $53,775 | $42,500 |
| Bachelor's Degree | $71,912 | $0 |
| Graduate Degree | $62,518 | $61,847 |
| Total | $42,795 | $31,201 |
Family Income in Brantley County
Family Income Brackets in Brantley County
According to the Brantley County family income data, there are 784 families falling into the $100,000 to $149,999 income range, which is the most common income bracket and makes up 19.9% of all families. Conversely, the $10,000 to $14,999 income bracket is the least frequent group with only 35 families (0.9%) belonging to this category.
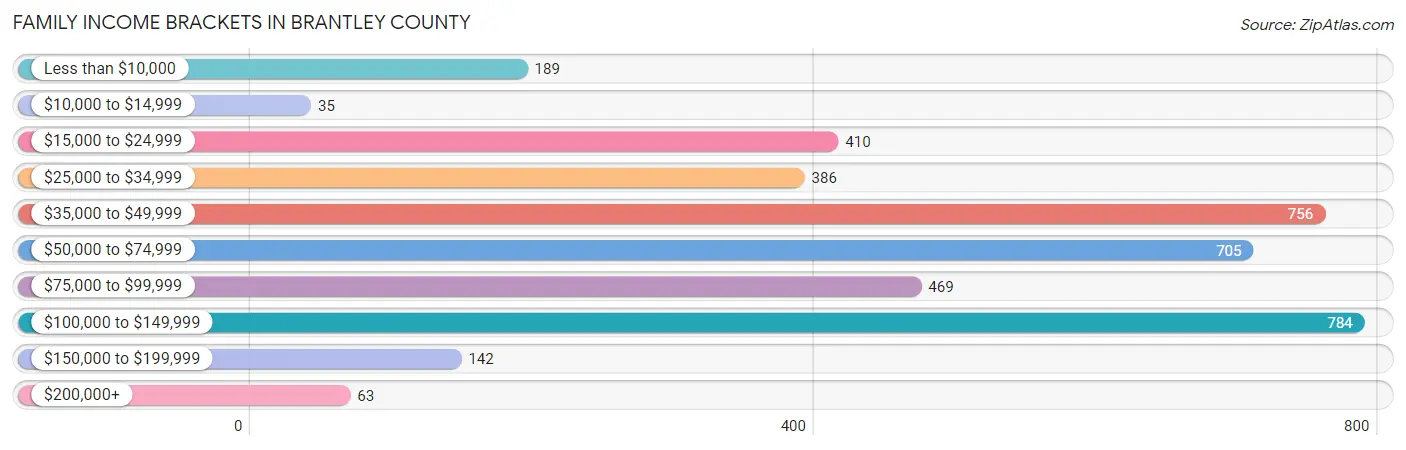
| Income Bracket | # Families | % Families |
| Less than $10,000 | 189 | 4.8% |
| $10,000 to $14,999 | 35 | 0.9% |
| $15,000 to $24,999 | 410 | 10.4% |
| $25,000 to $34,999 | 386 | 9.8% |
| $35,000 to $49,999 | 756 | 19.2% |
| $50,000 to $74,999 | 705 | 17.9% |
| $75,000 to $99,999 | 469 | 11.9% |
| $100,000 to $149,999 | 784 | 19.9% |
| $150,000 to $199,999 | 142 | 3.6% |
| $200,000+ | 63 | 1.6% |
Family Income by Famaliy Size in Brantley County
4-person families (634 | 16.1%) account for the highest median family income in Brantley County with $83,750 per family, while 3-person families (859 | 21.8%) have the highest median income of $23,767 per family member.
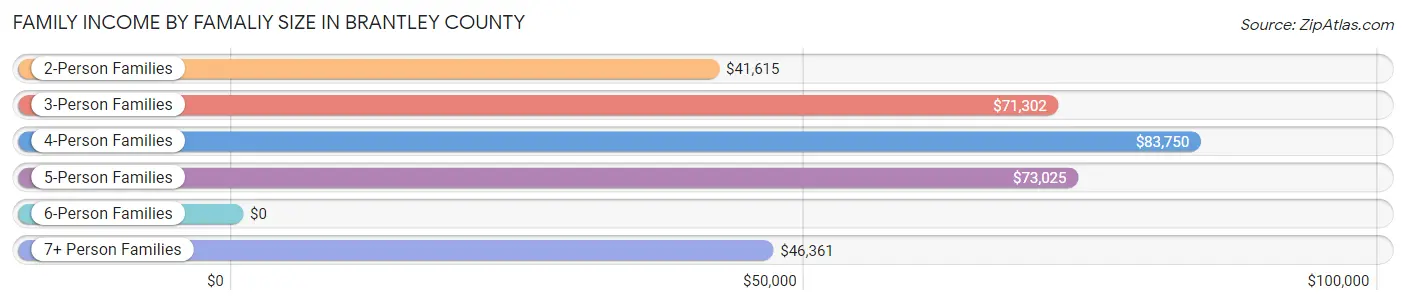
| Income Bracket | # Families | Median Income |
| 2-Person Families | 2,016 (51.2%) | $41,615 |
| 3-Person Families | 859 (21.8%) | $71,302 |
| 4-Person Families | 634 (16.1%) | $83,750 |
| 5-Person Families | 303 (7.7%) | $73,025 |
| 6-Person Families | 0 (0.0%) | $0 |
| 7+ Person Families | 126 (3.2%) | $46,361 |
| Total | 3,938 (100.0%) | $60,170 |
Family Income by Number of Earners in Brantley County
The median family income in Brantley County is $60,170, with families comprising 3+ earners (347) having the highest median family income of $100,938, while families with no earners (996) have the lowest median family income of $26,889, accounting for 8.8% and 25.3% of families, respectively.
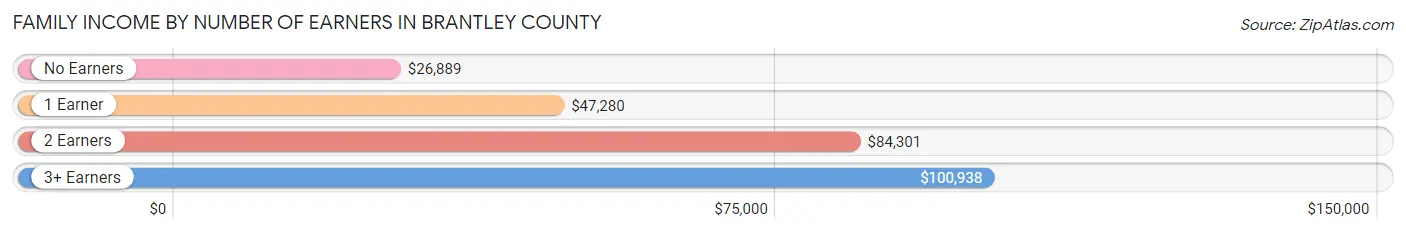
| Number of Earners | # Families | Median Income |
| No Earners | 996 (25.3%) | $26,889 |
| 1 Earner | 1,246 (31.6%) | $47,280 |
| 2 Earners | 1,349 (34.3%) | $84,301 |
| 3+ Earners | 347 (8.8%) | $100,938 |
| Total | 3,938 (100.0%) | $60,170 |
Household Income in Brantley County
Household Income Brackets in Brantley County
With 1,317 households falling in the category, the $15,000 to $24,999 income range is the most frequent in Brantley County, accounting for 19.8% of all households. In contrast, only 66 households (1.0%) fall into the $200,000+ income bracket, making it the least populous group.
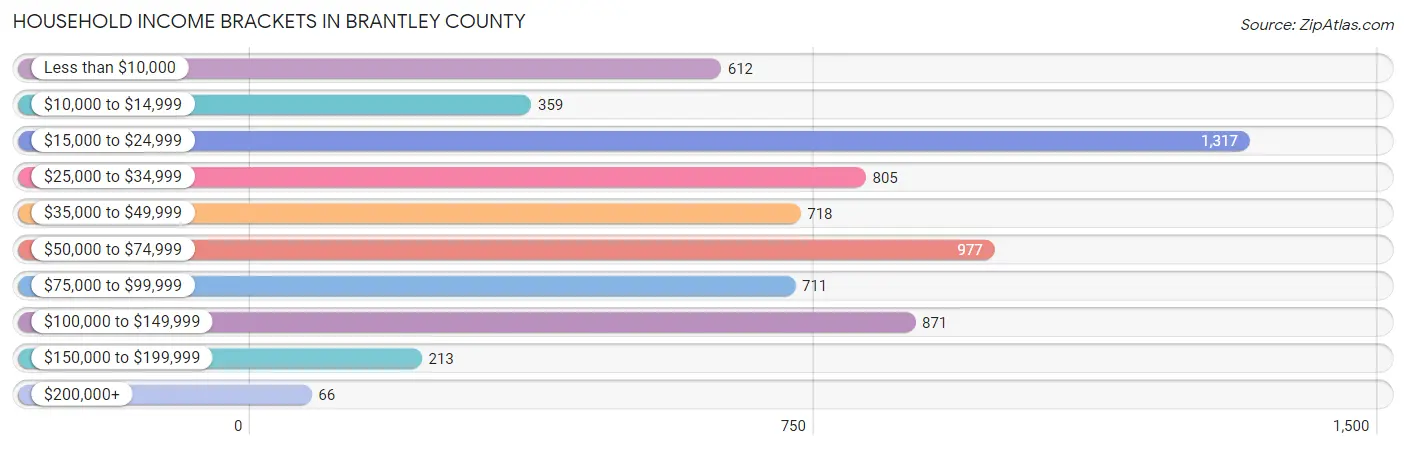
| Income Bracket | # Households | % Households |
| Less than $10,000 | 612 | 9.2% |
| $10,000 to $14,999 | 359 | 5.4% |
| $15,000 to $24,999 | 1,317 | 19.8% |
| $25,000 to $34,999 | 805 | 12.1% |
| $35,000 to $49,999 | 718 | 10.8% |
| $50,000 to $74,999 | 977 | 14.7% |
| $75,000 to $99,999 | 711 | 10.7% |
| $100,000 to $149,999 | 871 | 13.1% |
| $150,000 to $199,999 | 213 | 3.2% |
| $200,000+ | 66 | 1.0% |
Household Income by Householder Age in Brantley County
The median household income in Brantley County is $40,166, with the highest median household income of $54,131 found in the 25 to 44 years age bracket for the primary householder. A total of 1,568 households (23.6%) fall into this category. Meanwhile, the 65+ years age bracket for the primary householder has the lowest median household income of $26,244, with 2,101 households (31.6%) in this group.
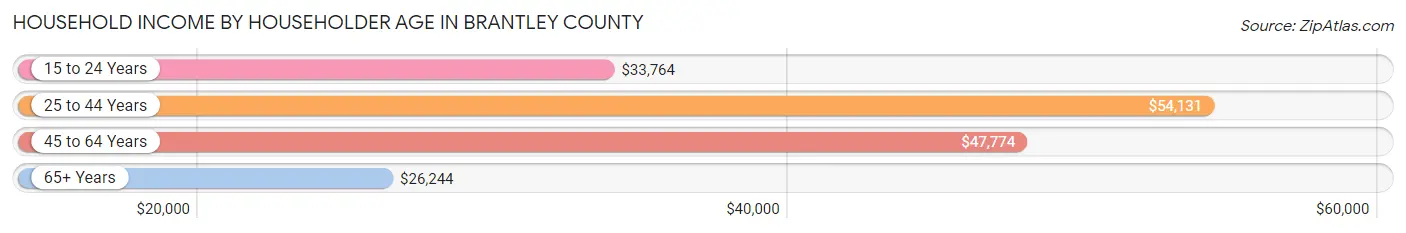
| Income Bracket | # Households | Median Income |
| 15 to 24 Years | 112 (1.7%) | $33,764 |
| 25 to 44 Years | 1,568 (23.6%) | $54,131 |
| 45 to 64 Years | 2,868 (43.1%) | $47,774 |
| 65+ Years | 2,101 (31.6%) | $26,244 |
| Total | 6,649 (100.0%) | $40,166 |
Poverty in Brantley County
Income Below Poverty by Sex and Age in Brantley County
With 14.5% poverty level for males and 18.1% for females among the residents of Brantley County, 12 to 14 year old males and 5 year old females are the most vulnerable to poverty, with 157 males (33.5%) and 117 females (60.9%) in their respective age groups living below the poverty level.
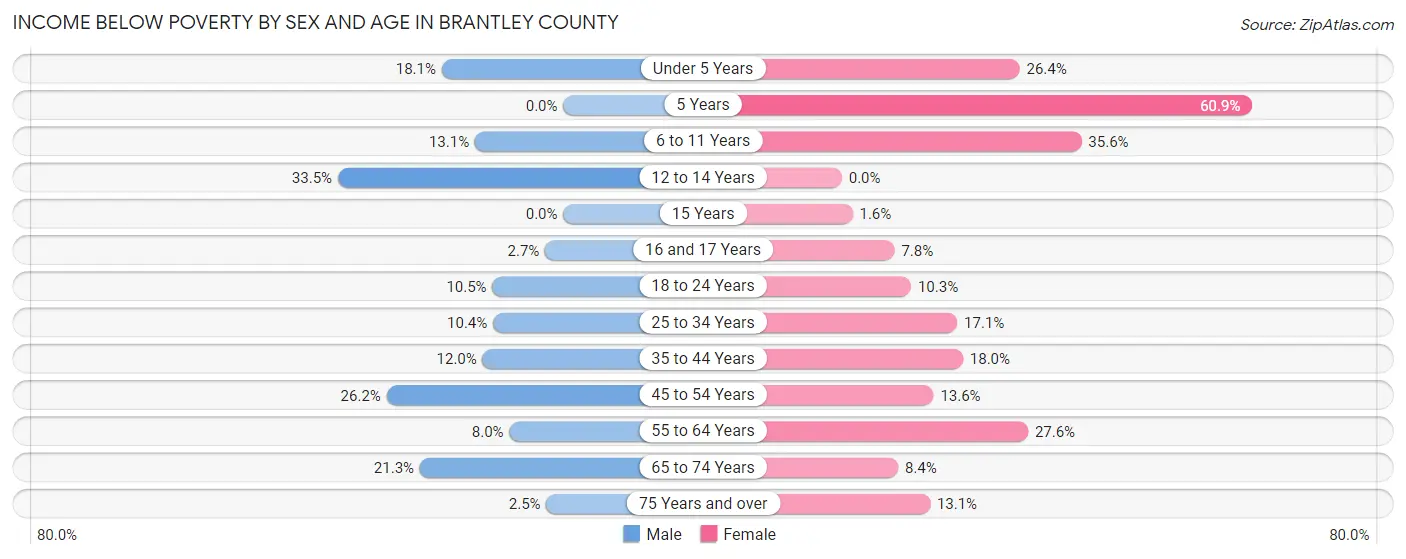
| Age Bracket | Male | Female |
| Under 5 Years | 85 (18.0%) | 160 (26.4%) |
| 5 Years | 0 (0.0%) | 117 (60.9%) |
| 6 to 11 Years | 82 (13.1%) | 211 (35.6%) |
| 12 to 14 Years | 157 (33.5%) | 0 (0.0%) |
| 15 Years | 0 (0.0%) | 3 (1.6%) |
| 16 and 17 Years | 5 (2.7%) | 14 (7.8%) |
| 18 to 24 Years | 72 (10.5%) | 77 (10.3%) |
| 25 to 34 Years | 106 (10.4%) | 178 (17.1%) |
| 35 to 44 Years | 169 (12.0%) | 180 (18.0%) |
| 45 to 54 Years | 307 (26.2%) | 194 (13.6%) |
| 55 to 64 Years | 100 (8.0%) | 351 (27.6%) |
| 65 to 74 Years | 193 (21.3%) | 77 (8.4%) |
| 75 Years and over | 12 (2.5%) | 83 (13.1%) |
| Total | 1,288 (14.5%) | 1,645 (18.1%) |
Income Above Poverty by Sex and Age in Brantley County
According to the poverty statistics in Brantley County, males aged 5 years and females aged 12 to 14 years are the age groups that are most secure financially, with 100.0% of males and 100.0% of females in these age groups living above the poverty line.
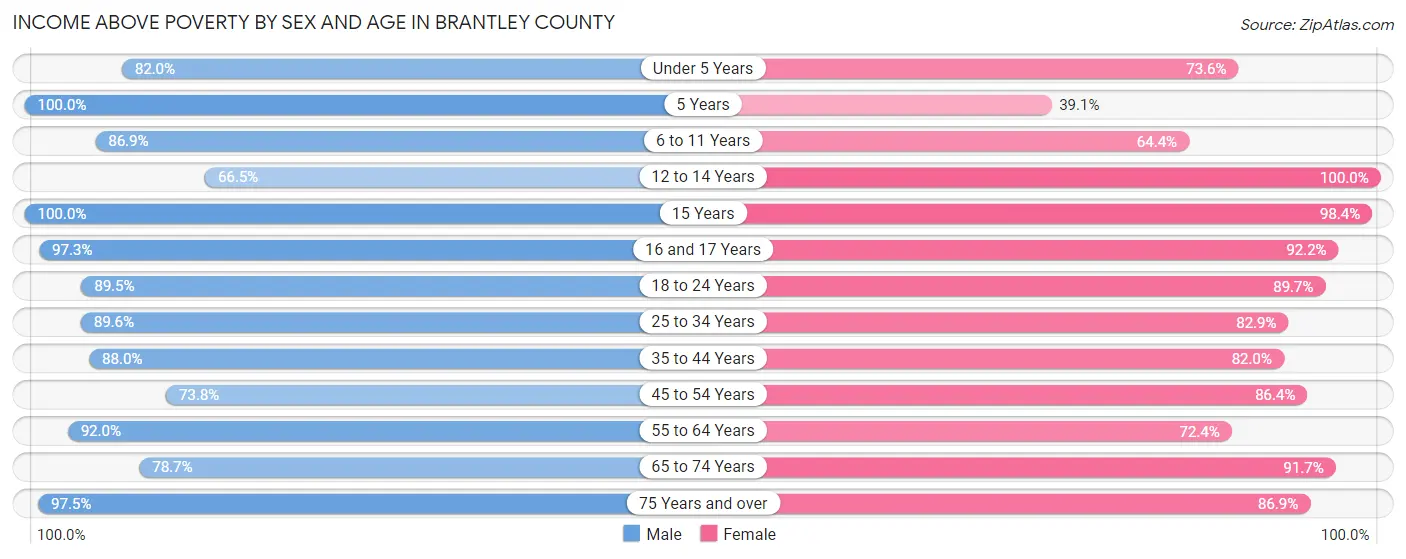
| Age Bracket | Male | Female |
| Under 5 Years | 386 (82.0%) | 446 (73.6%) |
| 5 Years | 53 (100.0%) | 75 (39.1%) |
| 6 to 11 Years | 543 (86.9%) | 382 (64.4%) |
| 12 to 14 Years | 312 (66.5%) | 291 (100.0%) |
| 15 Years | 176 (100.0%) | 186 (98.4%) |
| 16 and 17 Years | 180 (97.3%) | 165 (92.2%) |
| 18 to 24 Years | 612 (89.5%) | 673 (89.7%) |
| 25 to 34 Years | 910 (89.6%) | 861 (82.9%) |
| 35 to 44 Years | 1,240 (88.0%) | 821 (82.0%) |
| 45 to 54 Years | 863 (73.8%) | 1,231 (86.4%) |
| 55 to 64 Years | 1,148 (92.0%) | 919 (72.4%) |
| 65 to 74 Years | 713 (78.7%) | 845 (91.6%) |
| 75 Years and over | 467 (97.5%) | 551 (86.9%) |
| Total | 7,603 (85.5%) | 7,446 (81.9%) |
Income Below Poverty Among Married-Couple Families in Brantley County
The poverty statistics for married-couple families in Brantley County show that 10.7% or 312 of the total 2,919 families live below the poverty line. Families with 3 or 4 children have the highest poverty rate of 21.0%, comprising of 20 families. On the other hand, families with 5 or more children have the lowest poverty rate of 0.0%, which includes 0 families.
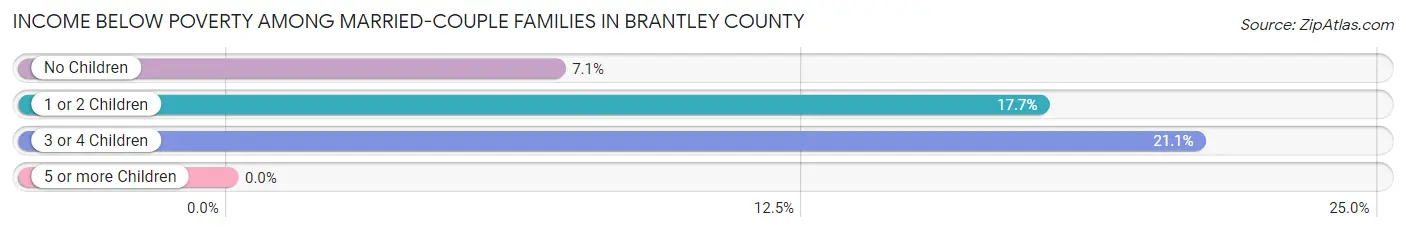
| Children | Above Poverty | Below Poverty |
| No Children | 1,656 (92.9%) | 127 (7.1%) |
| 1 or 2 Children | 770 (82.4%) | 165 (17.6%) |
| 3 or 4 Children | 75 (78.9%) | 20 (21.0%) |
| 5 or more Children | 106 (100.0%) | 0 (0.0%) |
| Total | 2,607 (89.3%) | 312 (10.7%) |
Income Below Poverty Among Single-Parent Households in Brantley County
According to the poverty data in Brantley County, 14.3% or 38 single-father households and 20.7% or 156 single-mother households are living below the poverty line. Among single-father households, those with 3 or 4 children have the highest poverty rate, with 11 households (100.0%) experiencing poverty. Likewise, among single-mother households, those with 3 or 4 children have the highest poverty rate, with 54 households (76.1%) falling below the poverty line.
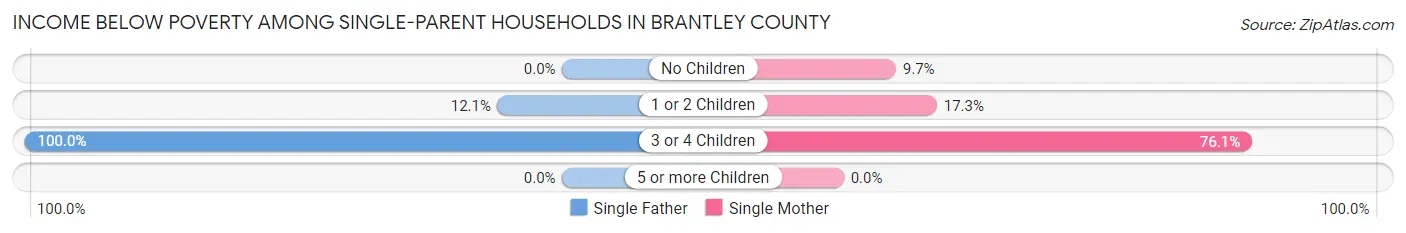
| Children | Single Father | Single Mother |
| No Children | 0 (0.0%) | 21 (9.7%) |
| 1 or 2 Children | 27 (12.0%) | 81 (17.3%) |
| 3 or 4 Children | 11 (100.0%) | 54 (76.1%) |
| 5 or more Children | 0 (0.0%) | 0 (0.0%) |
| Total | 38 (14.3%) | 156 (20.7%) |
Income Below Poverty Among Married-Couple vs Single-Parent Households in Brantley County
The poverty data for Brantley County shows that 312 of the married-couple family households (10.7%) and 194 of the single-parent households (19.0%) are living below the poverty level. Within the married-couple family households, those with 3 or 4 children have the highest poverty rate, with 20 households (21.0%) falling below the poverty line. Among the single-parent households, those with 3 or 4 children have the highest poverty rate, with 65 household (79.3%) living below poverty.
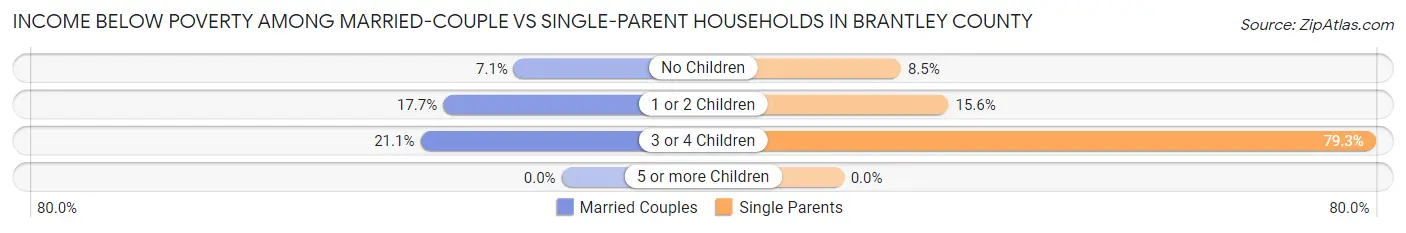
| Children | Married-Couple Families | Single-Parent Households |
| No Children | 127 (7.1%) | 21 (8.5%) |
| 1 or 2 Children | 165 (17.6%) | 108 (15.6%) |
| 3 or 4 Children | 20 (21.0%) | 65 (79.3%) |
| 5 or more Children | 0 (0.0%) | 0 (0.0%) |
| Total | 312 (10.7%) | 194 (19.0%) |
Race in Brantley County
The most populous races in Brantley County are White / Caucasian (16,805 | 92.8%), Black / African American (667 | 3.7%), and Hispanic or Latino (474 | 2.6%).
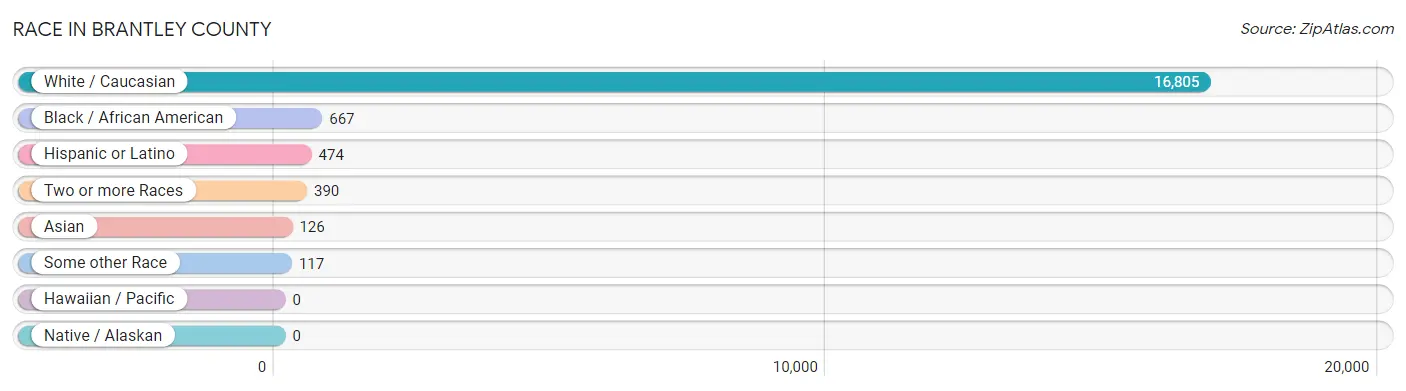
| Race | # Population | % Population |
| Asian | 126 | 0.7% |
| Black / African American | 667 | 3.7% |
| Hawaiian / Pacific | 0 | 0.0% |
| Hispanic or Latino | 474 | 2.6% |
| Native / Alaskan | 0 | 0.0% |
| White / Caucasian | 16,805 | 92.8% |
| Two or more Races | 390 | 2.1% |
| Some other Race | 117 | 0.6% |
| Total | 18,105 | 100.0% |
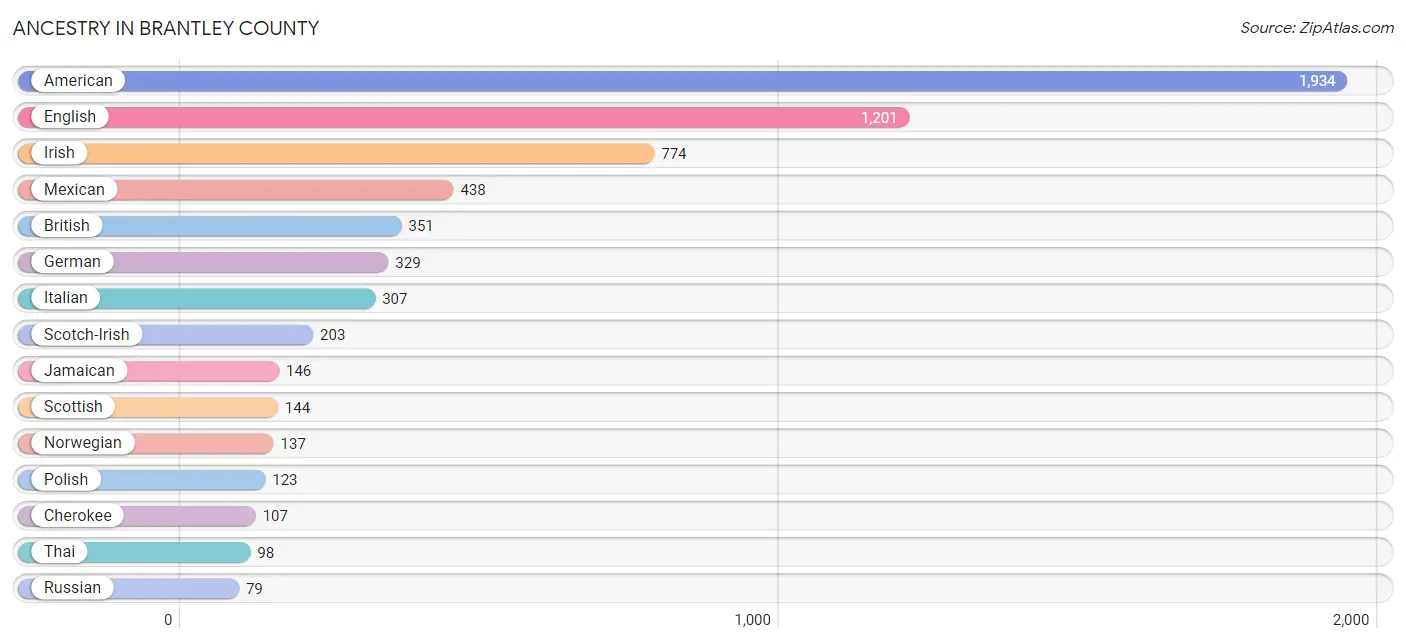
Ancestry in Brantley County
The most populous ancestries reported in Brantley County are American (1,934 | 10.7%), English (1,201 | 6.6%), Irish (774 | 4.3%), Mexican (438 | 2.4%), and British (351 | 1.9%), together accounting for 26.0% of all Brantley County residents.
| Ancestry | # Population | % Population |
| American | 1,934 | 10.7% |
| British | 351 | 1.9% |
| Central American | 6 | 0.0% |
| Cherokee | 107 | 0.6% |
| Creek | 46 | 0.3% |
| Cuban | 13 | 0.1% |
| Czechoslovakian | 3 | 0.0% |
| Danish | 14 | 0.1% |
| Dutch | 28 | 0.2% |
| English | 1,201 | 6.6% |
| European | 27 | 0.2% |
| French | 46 | 0.3% |
| French American Indian | 3 | 0.0% |
| French Canadian | 15 | 0.1% |
| German | 329 | 1.8% |
| Honduran | 5 | 0.0% |
| Hungarian | 16 | 0.1% |
| Irish | 774 | 4.3% |
| Italian | 307 | 1.7% |
| Jamaican | 146 | 0.8% |
| Mexican | 438 | 2.4% |
| Nicaraguan | 1 | 0.0% |
| Norwegian | 137 | 0.8% |
| Polish | 123 | 0.7% |
| Portuguese | 12 | 0.1% |
| Puerto Rican | 14 | 0.1% |
| Russian | 79 | 0.4% |
| Scandinavian | 15 | 0.1% |
| Scotch-Irish | 203 | 1.1% |
| Scottish | 144 | 0.8% |
| Sri Lankan | 28 | 0.2% |
| Thai | 98 | 0.5% |
| Welsh | 72 | 0.4% | View All 33 Rows |
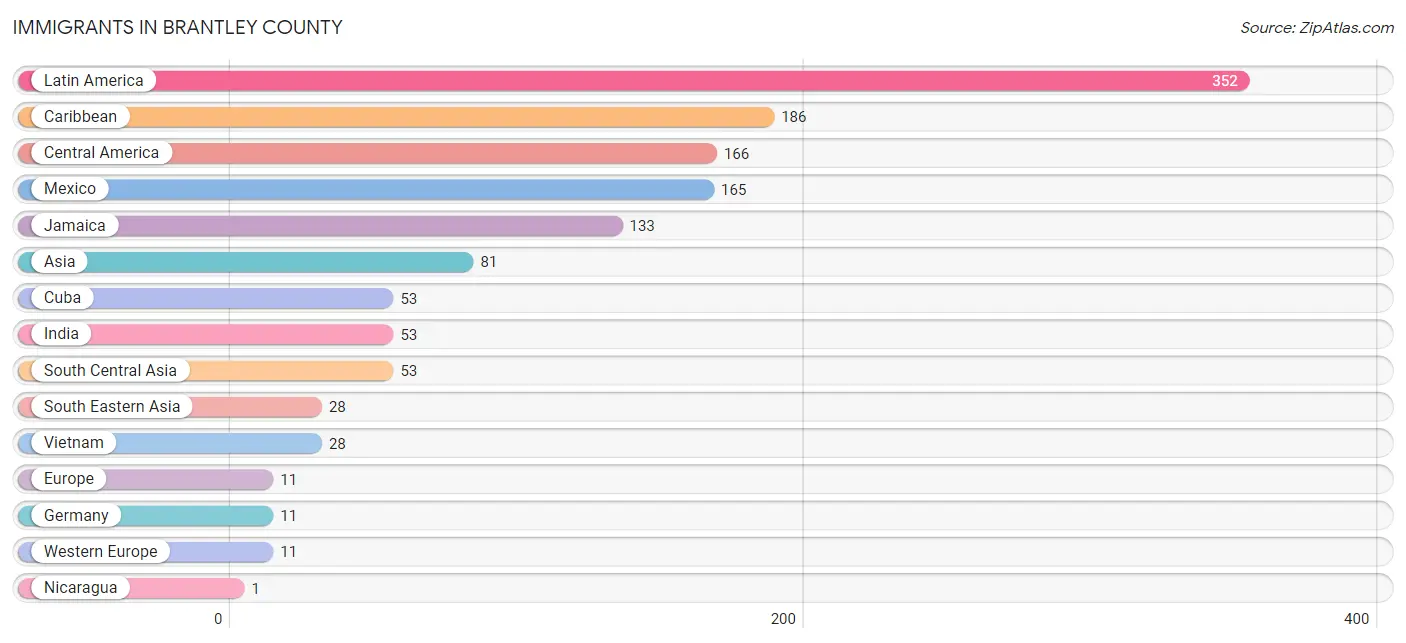
Immigrants in Brantley County
The most numerous immigrant groups reported in Brantley County came from Latin America (352 | 1.9%), Caribbean (186 | 1.0%), Central America (166 | 0.9%), Mexico (165 | 0.9%), and Jamaica (133 | 0.7%), together accounting for 5.5% of all Brantley County residents.
| Immigration Origin | # Population | % Population |
| Asia | 81 | 0.4% |
| Caribbean | 186 | 1.0% |
| Central America | 166 | 0.9% |
| Cuba | 53 | 0.3% |
| Europe | 11 | 0.1% |
| Germany | 11 | 0.1% |
| India | 53 | 0.3% |
| Jamaica | 133 | 0.7% |
| Latin America | 352 | 1.9% |
| Mexico | 165 | 0.9% |
| Nicaragua | 1 | 0.0% |
| South Central Asia | 53 | 0.3% |
| South Eastern Asia | 28 | 0.2% |
| Vietnam | 28 | 0.2% |
| Western Europe | 11 | 0.1% | View All 15 Rows |
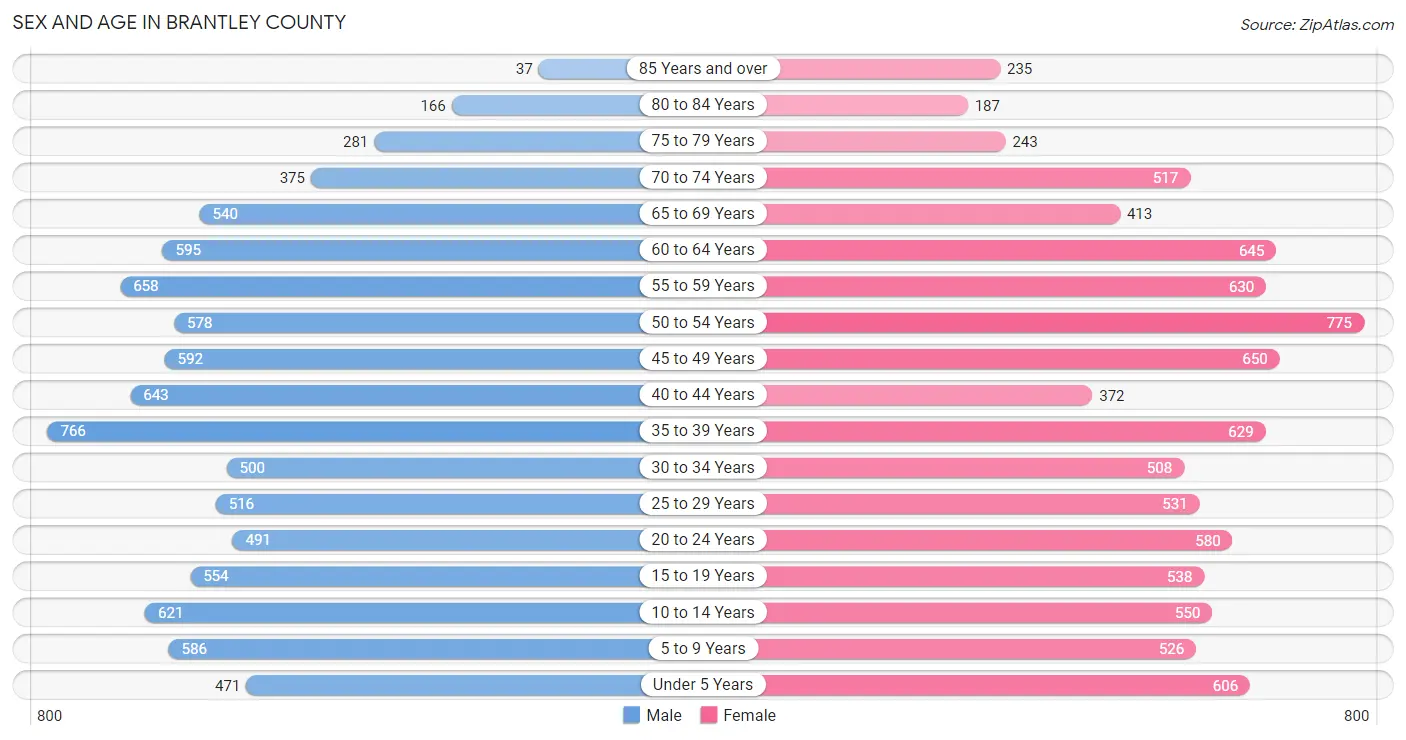
Sex and Age in Brantley County
Sex and Age in Brantley County
The most populous age groups in Brantley County are 35 to 39 Years (766 | 8.5%) for men and 50 to 54 Years (775 | 8.5%) for women.
| Age Bracket | Male | Female |
| Under 5 Years | 471 (5.2%) | 606 (6.6%) |
| 5 to 9 Years | 586 (6.5%) | 526 (5.8%) |
| 10 to 14 Years | 621 (6.9%) | 550 (6.0%) |
| 15 to 19 Years | 554 (6.2%) | 538 (5.9%) |
| 20 to 24 Years | 491 (5.5%) | 580 (6.4%) |
| 25 to 29 Years | 516 (5.8%) | 531 (5.8%) |
| 30 to 34 Years | 500 (5.6%) | 508 (5.6%) |
| 35 to 39 Years | 766 (8.5%) | 629 (6.9%) |
| 40 to 44 Years | 643 (7.2%) | 372 (4.1%) |
| 45 to 49 Years | 592 (6.6%) | 650 (7.1%) |
| 50 to 54 Years | 578 (6.4%) | 775 (8.5%) |
| 55 to 59 Years | 658 (7.3%) | 630 (6.9%) |
| 60 to 64 Years | 595 (6.6%) | 645 (7.1%) |
| 65 to 69 Years | 540 (6.0%) | 413 (4.5%) |
| 70 to 74 Years | 375 (4.2%) | 517 (5.7%) |
| 75 to 79 Years | 281 (3.1%) | 243 (2.7%) |
| 80 to 84 Years | 166 (1.8%) | 187 (2.1%) |
| 85 Years and over | 37 (0.4%) | 235 (2.6%) |
| Total | 8,970 (100.0%) | 9,135 (100.0%) |
Families and Households in Brantley County
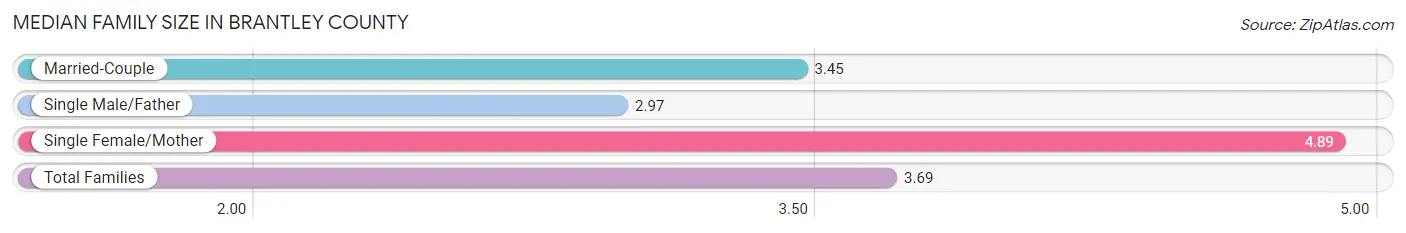
Median Family Size in Brantley County
The median family size in Brantley County is 3.69 persons per family, with single female/mother families (754 | 19.2%) accounting for the largest median family size of 4.89 persons per family. On the other hand, single male/father families (265 | 6.7%) represent the smallest median family size with 2.97 persons per family.
| Family Type | # Families | Family Size |
| Married-Couple | 2,919 (74.1%) | 3.45 |
| Single Male/Father | 265 (6.7%) | 2.97 |
| Single Female/Mother | 754 (19.2%) | 4.89 |
| Total Families | 3,938 (100.0%) | 3.69 |
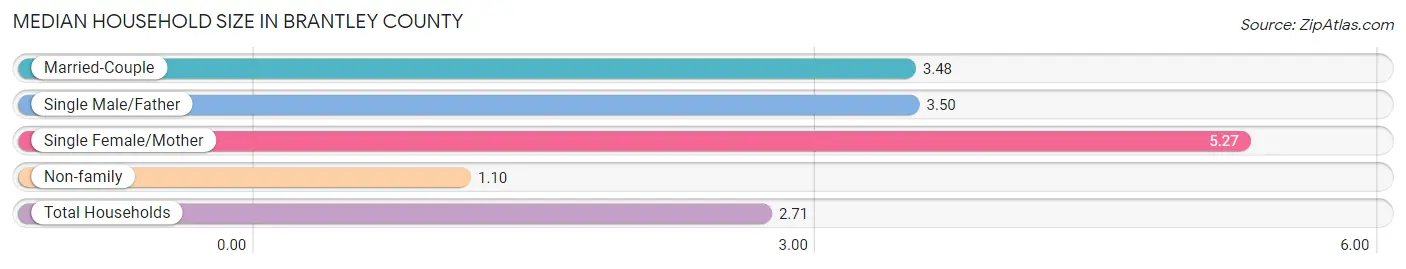
Median Household Size in Brantley County
The median household size in Brantley County is 2.71 persons per household, with single female/mother households (754 | 11.3%) accounting for the largest median household size of 5.27 persons per household. non-family households (2,711 | 40.8%) represent the smallest median household size with 1.10 persons per household.
| Household Type | # Households | Household Size |
| Married-Couple | 2,919 (43.9%) | 3.48 |
| Single Male/Father | 265 (4.0%) | 3.50 |
| Single Female/Mother | 754 (11.3%) | 5.27 |
| Non-family | 2,711 (40.8%) | 1.10 |
| Total Households | 6,649 (100.0%) | 2.71 |
Household Size by Marriage Status in Brantley County
Out of a total of 6,649 households in Brantley County, 3,938 (59.2%) are family households, while 2,711 (40.8%) are nonfamily households. The most numerous type of family households are 2-person households, comprising 1,757, and the most common type of nonfamily households are 1-person households, comprising 2,598.
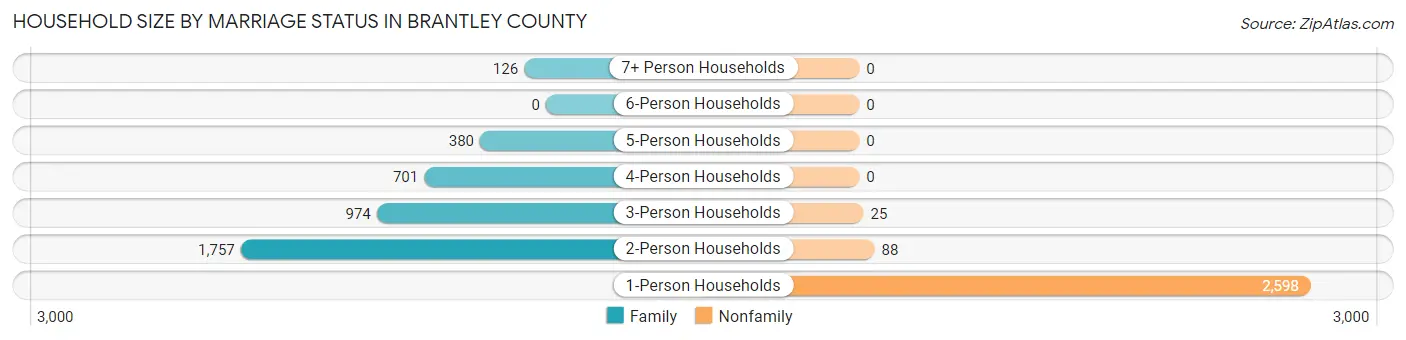
| Household Size | Family Households | Nonfamily Households |
| 1-Person Households | - | 2,598 (39.1%) |
| 2-Person Households | 1,757 (26.4%) | 88 (1.3%) |
| 3-Person Households | 974 (14.6%) | 25 (0.4%) |
| 4-Person Households | 701 (10.5%) | 0 (0.0%) |
| 5-Person Households | 380 (5.7%) | 0 (0.0%) |
| 6-Person Households | 0 (0.0%) | 0 (0.0%) |
| 7+ Person Households | 126 (1.9%) | 0 (0.0%) |
| Total | 3,938 (59.2%) | 2,711 (40.8%) |
Female Fertility in Brantley County
Fertility by Age in Brantley County
Average fertility rate in Brantley County is 49.0 births per 1,000 women. Women in the age bracket of 20 to 34 years have the highest fertility rate with 66.0 births per 1,000 women. Women in the age bracket of 20 to 34 years acount for 55.1% of all women with births.
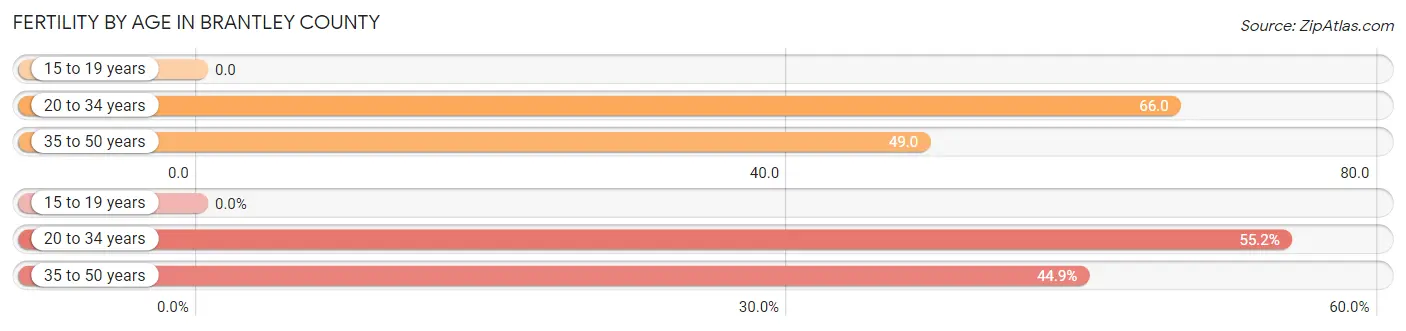
| Age Bracket | Women with Births | Births / 1,000 Women |
| 15 to 19 years | 0 (0.0%) | 0.0 |
| 20 to 34 years | 107 (55.1%) | 66.0 |
| 35 to 50 years | 87 (44.9%) | 49.0 |
| Total | 194 (100.0%) | 49.0 |
Fertility by Age by Marriage Status in Brantley County
19.1% of women with births (194) in Brantley County are married. The highest percentage of unmarried women with births falls into 35 to 50 years age bracket with 100.0% of them unmarried at the time of birth, while the lowest percentage of unmarried women with births belong to 20 to 34 years age bracket with 65.4% of them unmarried.
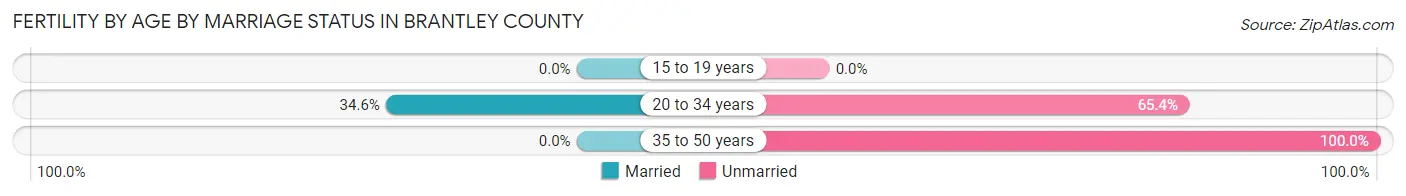
| Age Bracket | Married | Unmarried |
| 15 to 19 years | 0 (0.0%) | 0 (0.0%) |
| 20 to 34 years | 37 (34.6%) | 70 (65.4%) |
| 35 to 50 years | 0 (0.0%) | 87 (100.0%) |
| Total | 37 (19.1%) | 157 (80.9%) |
Fertility by Education in Brantley County
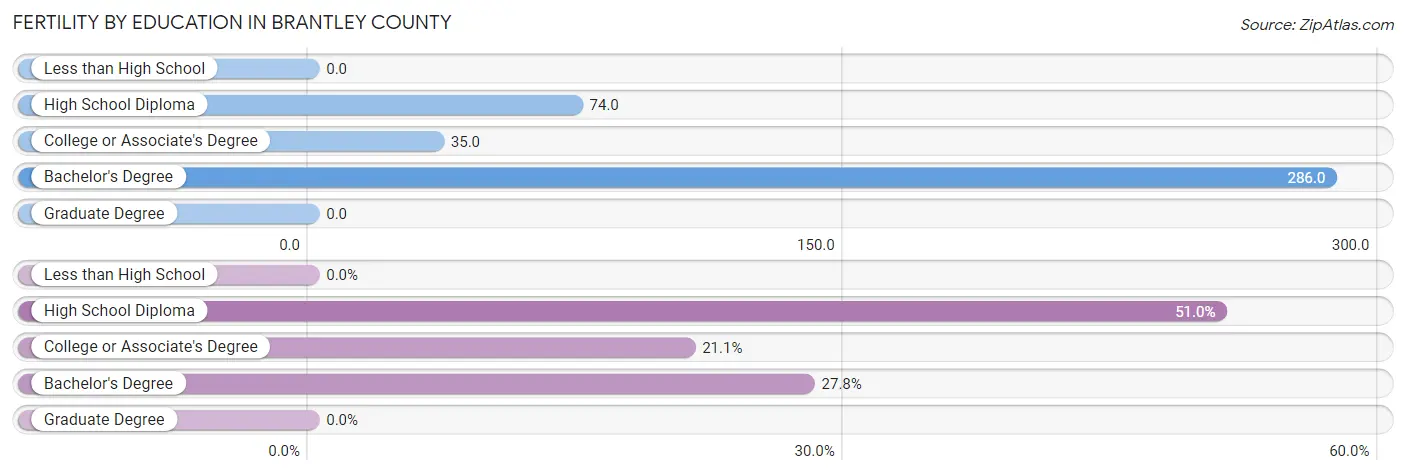
| Educational Attainment | Women with Births | Births / 1,000 Women |
| Less than High School | 0 (0.0%) | 0.0 |
| High School Diploma | 99 (51.0%) | 74.0 |
| College or Associate's Degree | 41 (21.1%) | 35.0 |
| Bachelor's Degree | 54 (27.8%) | 286.0 |
| Graduate Degree | 0 (0.0%) | 0.0 |
| Total | 194 (100.0%) | 49.0 |
Fertility by Education by Marriage Status in Brantley County
80.9% of women with births in Brantley County are unmarried. Women with the educational attainment of high school diploma are most likely to be married with 29.3% of them married at childbirth, while women with the educational attainment of bachelor's degree are least likely to be married with 100.0% of them unmarried at childbirth.
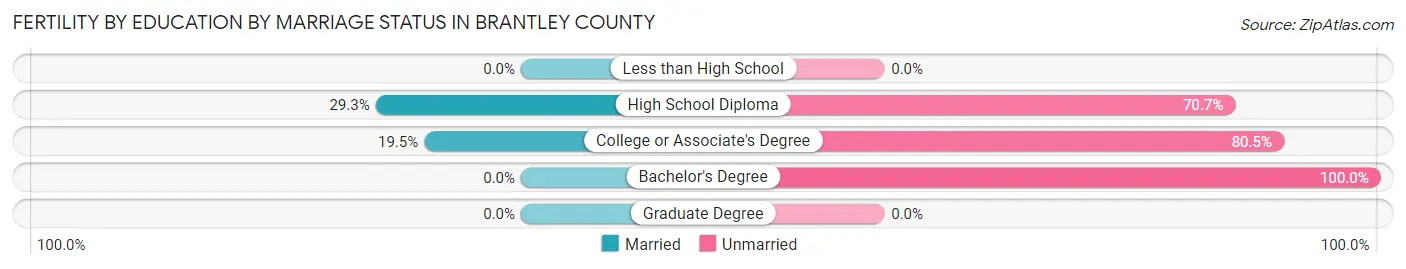
| Educational Attainment | Married | Unmarried |
| Less than High School | 0 (0.0%) | 0 (0.0%) |
| High School Diploma | 29 (29.3%) | 70 (70.7%) |
| College or Associate's Degree | 8 (19.5%) | 33 (80.5%) |
| Bachelor's Degree | 0 (0.0%) | 54 (100.0%) |
| Graduate Degree | 0 (0.0%) | 0 (0.0%) |
| Total | 37 (19.1%) | 157 (80.9%) |
Employment Characteristics in Brantley County
Employment by Class of Employer in Brantley County
Among the 6,865 employed individuals in Brantley County, private company employees (4,771 | 69.5%), local government employees (804 | 11.7%), and self-employed (not incorporated) (433 | 6.3%) make up the most common classes of employment.
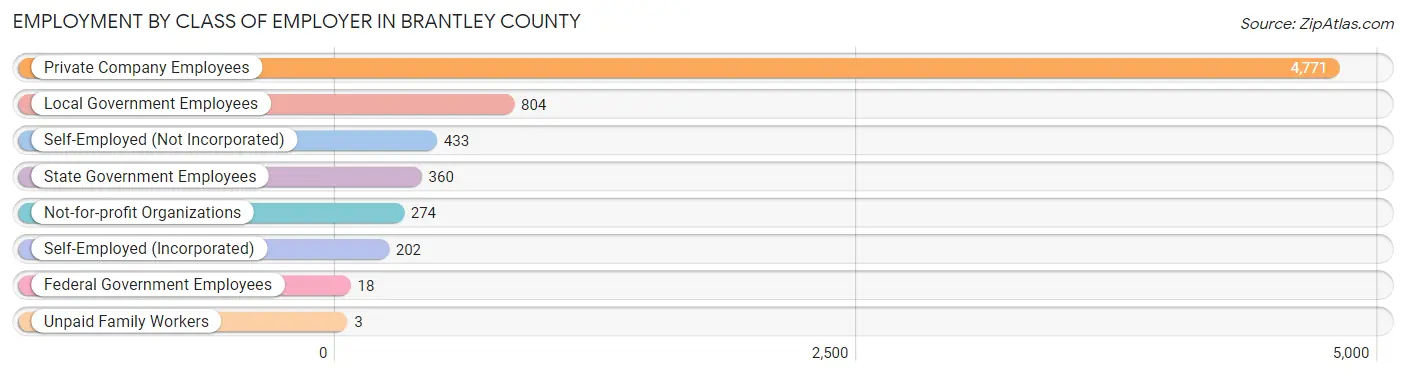
| Employer Class | # Employees | % Employees |
| Private Company Employees | 4,771 | 69.5% |
| Self-Employed (Incorporated) | 202 | 2.9% |
| Self-Employed (Not Incorporated) | 433 | 6.3% |
| Not-for-profit Organizations | 274 | 4.0% |
| Local Government Employees | 804 | 11.7% |
| State Government Employees | 360 | 5.2% |
| Federal Government Employees | 18 | 0.3% |
| Unpaid Family Workers | 3 | 0.0% |
| Total | 6,865 | 100.0% |
Employment Status by Age in Brantley County
According to the labor force statistics for Brantley County, out of the total population over 16 years of age (14,380), 50.3% or 7,233 individuals are in the labor force, with 3.3% or 239 of them unemployed. The age group with the highest labor force participation rate is 25 to 29 years, with 86.6% or 907 individuals in the labor force. Within the labor force, the 16 to 19 years age range has the highest percentage of unemployed individuals, with 25.3% or 69 of them being unemployed.
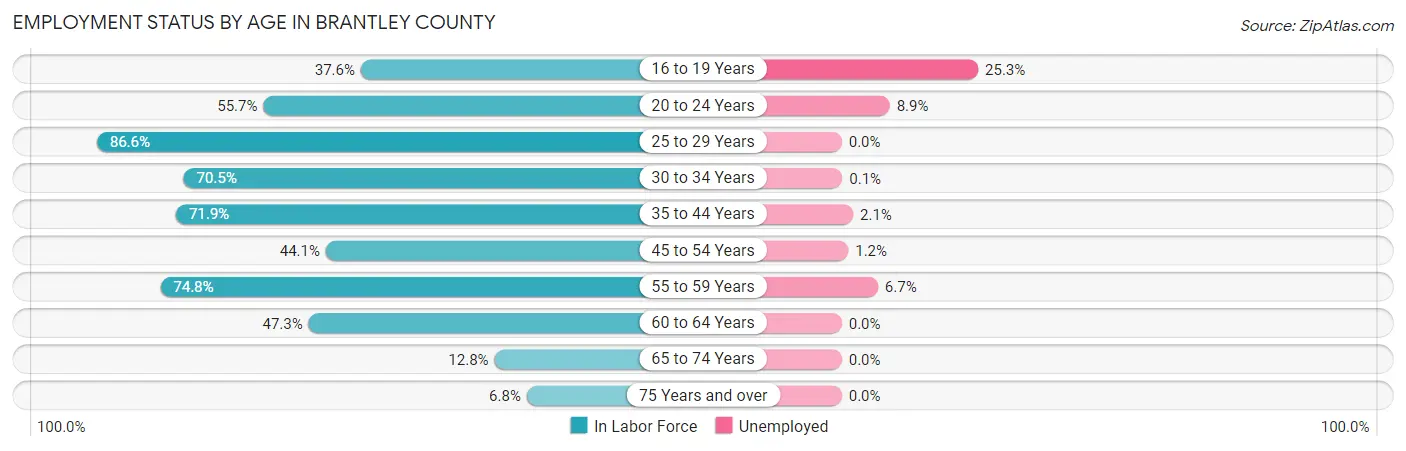
| Age Bracket | In Labor Force | Unemployed |
| 16 to 19 Years | 273 (37.6%) | 69 (25.3%) |
| 20 to 24 Years | 597 (55.7%) | 53 (8.9%) |
| 25 to 29 Years | 907 (86.6%) | 0 (0.0%) |
| 30 to 34 Years | 711 (70.5%) | 1 (0.1%) |
| 35 to 44 Years | 1,733 (71.9%) | 36 (2.1%) |
| 45 to 54 Years | 1,144 (44.1%) | 14 (1.2%) |
| 55 to 59 Years | 963 (74.8%) | 65 (6.7%) |
| 60 to 64 Years | 587 (47.3%) | 0 (0.0%) |
| 65 to 74 Years | 236 (12.8%) | 0 (0.0%) |
| 75 Years and over | 78 (6.8%) | 0 (0.0%) |
| Total | 7,233 (50.3%) | 239 (3.3%) |
Employment Status by Educational Attainment in Brantley County
According to labor force statistics for Brantley County, 63.1% of individuals (6,050) out of the total population between 25 and 64 years of age (9,588) are in the labor force, with 1.9% or 115 of them being unemployed. The group with the highest labor force participation rate are those with the educational attainment of bachelor's degree or higher, with 78.8% or 697 individuals in the labor force. Within the labor force, individuals with bachelor's degree or higher education have the highest percentage of unemployment, with 4.3% or 30 of them being unemployed.
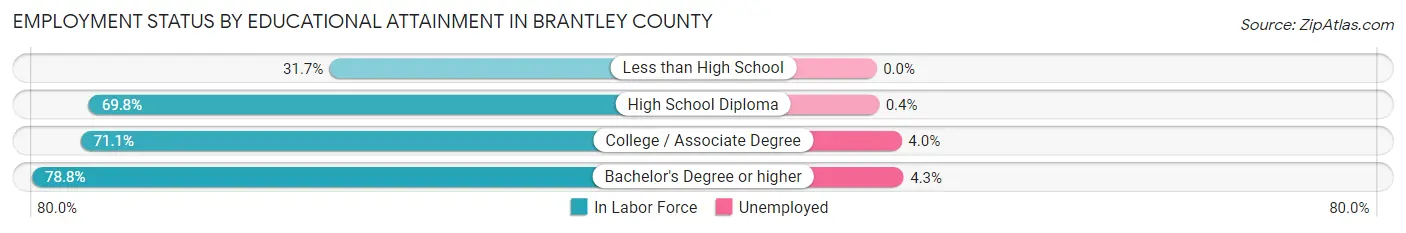
| Educational Attainment | In Labor Force | Unemployed |
| Less than High School | 634 (31.7%) | 0 (0.0%) |
| High School Diploma | 2,785 (69.8%) | 16 (0.4%) |
| College / Associate Degree | 1,930 (71.1%) | 109 (4.0%) |
| Bachelor's Degree or higher | 697 (78.8%) | 38 (4.3%) |
| Total | 6,050 (63.1%) | 182 (1.9%) |
Employment Occupations by Sex in Brantley County
Management, Business, Science and Arts Occupations
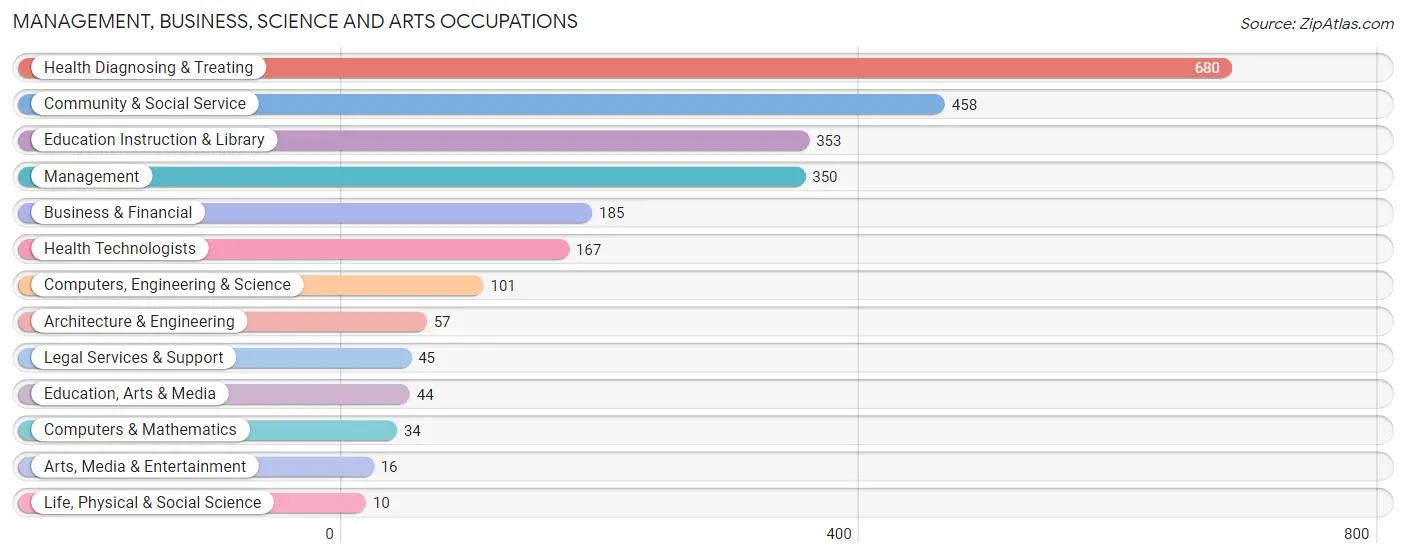
The most common Management, Business, Science and Arts occupations in Brantley County are Health Diagnosing & Treating (680 | 9.7%), Community & Social Service (458 | 6.6%), Education Instruction & Library (353 | 5.1%), Management (350 | 5.0%), and Business & Financial (185 | 2.6%).
Management, Business, Science and Arts Occupations by Sex
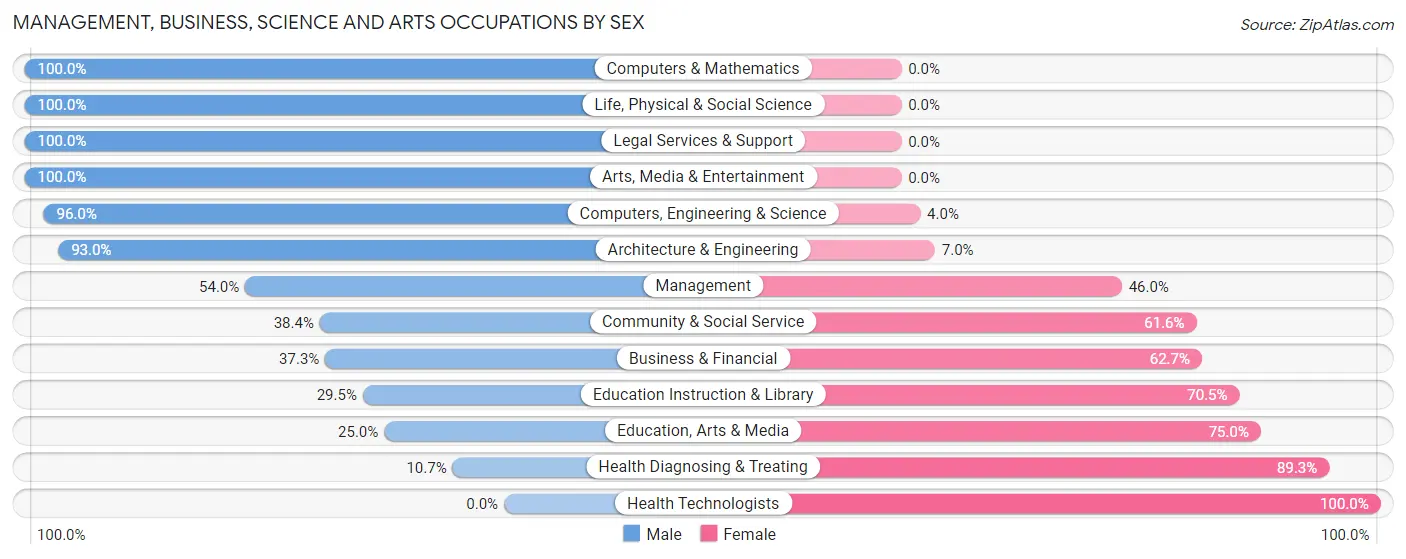
Within the Management, Business, Science and Arts occupations in Brantley County, the most male-oriented occupations are Computers & Mathematics (100.0%), Life, Physical & Social Science (100.0%), and Legal Services & Support (100.0%), while the most female-oriented occupations are Health Technologists (100.0%), Health Diagnosing & Treating (89.3%), and Education, Arts & Media (75.0%).
| Occupation | Male | Female |
| Management | 189 (54.0%) | 161 (46.0%) |
| Business & Financial | 69 (37.3%) | 116 (62.7%) |
| Computers, Engineering & Science | 97 (96.0%) | 4 (4.0%) |
| Computers & Mathematics | 34 (100.0%) | 0 (0.0%) |
| Architecture & Engineering | 53 (93.0%) | 4 (7.0%) |
| Life, Physical & Social Science | 10 (100.0%) | 0 (0.0%) |
| Community & Social Service | 176 (38.4%) | 282 (61.6%) |
| Education, Arts & Media | 11 (25.0%) | 33 (75.0%) |
| Legal Services & Support | 45 (100.0%) | 0 (0.0%) |
| Education Instruction & Library | 104 (29.5%) | 249 (70.5%) |
| Arts, Media & Entertainment | 16 (100.0%) | 0 (0.0%) |
| Health Diagnosing & Treating | 73 (10.7%) | 607 (89.3%) |
| Health Technologists | 0 (0.0%) | 167 (100.0%) |
| Total (Category) | 604 (34.1%) | 1,170 (65.9%) |
| Total (Overall) | 3,873 (55.4%) | 3,113 (44.6%) |
Services Occupations
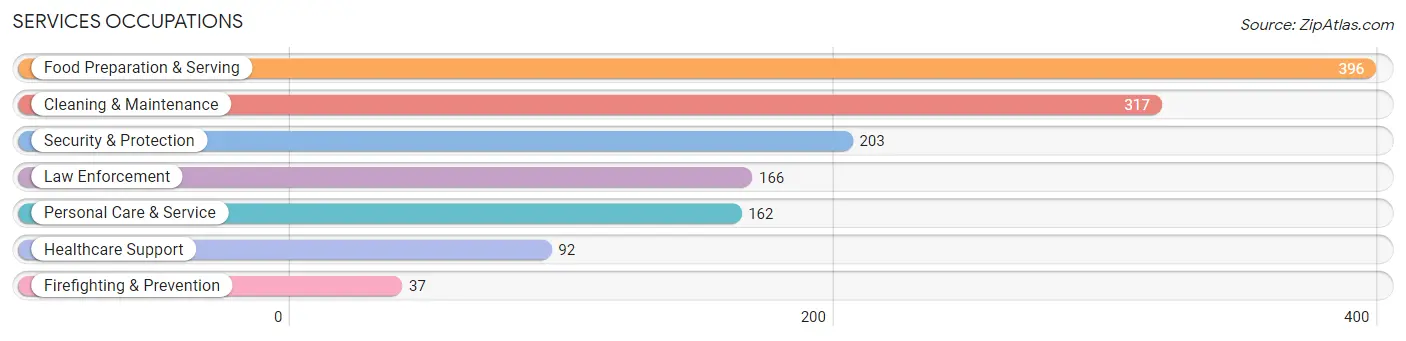
The most common Services occupations in Brantley County are Food Preparation & Serving (396 | 5.7%), Cleaning & Maintenance (317 | 4.5%), Security & Protection (203 | 2.9%), Law Enforcement (166 | 2.4%), and Personal Care & Service (162 | 2.3%).
Services Occupations by Sex
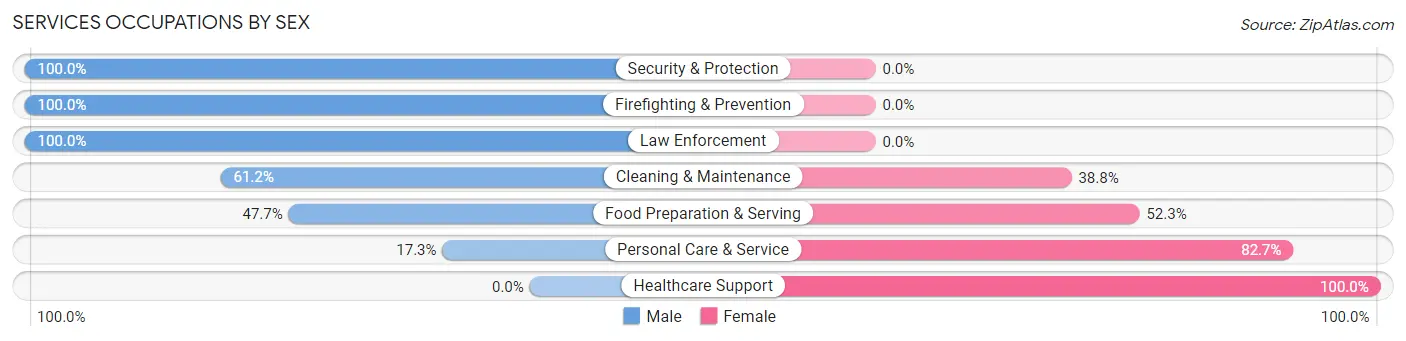
Within the Services occupations in Brantley County, the most male-oriented occupations are Security & Protection (100.0%), Firefighting & Prevention (100.0%), and Law Enforcement (100.0%), while the most female-oriented occupations are Healthcare Support (100.0%), Personal Care & Service (82.7%), and Food Preparation & Serving (52.3%).
| Occupation | Male | Female |
| Healthcare Support | 0 (0.0%) | 92 (100.0%) |
| Security & Protection | 203 (100.0%) | 0 (0.0%) |
| Firefighting & Prevention | 37 (100.0%) | 0 (0.0%) |
| Law Enforcement | 166 (100.0%) | 0 (0.0%) |
| Food Preparation & Serving | 189 (47.7%) | 207 (52.3%) |
| Cleaning & Maintenance | 194 (61.2%) | 123 (38.8%) |
| Personal Care & Service | 28 (17.3%) | 134 (82.7%) |
| Total (Category) | 614 (52.5%) | 556 (47.5%) |
| Total (Overall) | 3,873 (55.4%) | 3,113 (44.6%) |
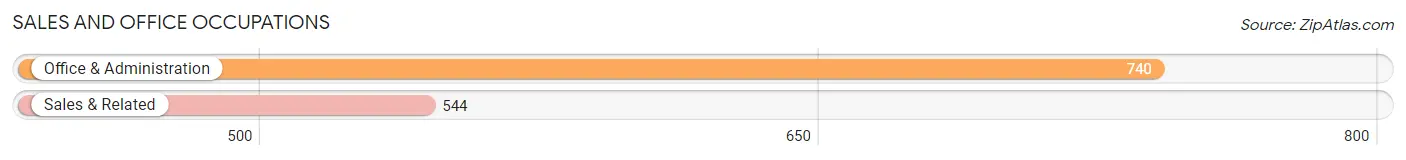
Sales and Office Occupations
The most common Sales and Office occupations in Brantley County are Office & Administration (740 | 10.6%), and Sales & Related (544 | 7.8%).
Sales and Office Occupations by Sex
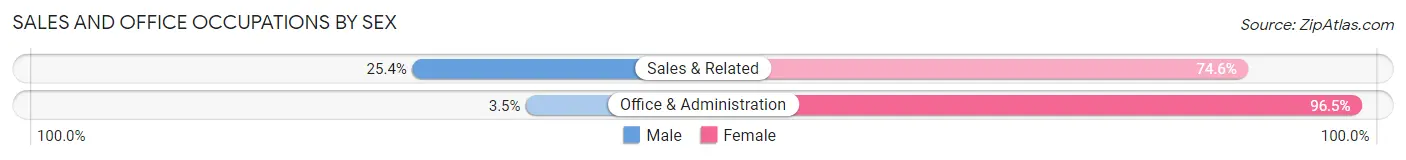
| Occupation | Male | Female |
| Sales & Related | 138 (25.4%) | 406 (74.6%) |
| Office & Administration | 26 (3.5%) | 714 (96.5%) |
| Total (Category) | 164 (12.8%) | 1,120 (87.2%) |
| Total (Overall) | 3,873 (55.4%) | 3,113 (44.6%) |
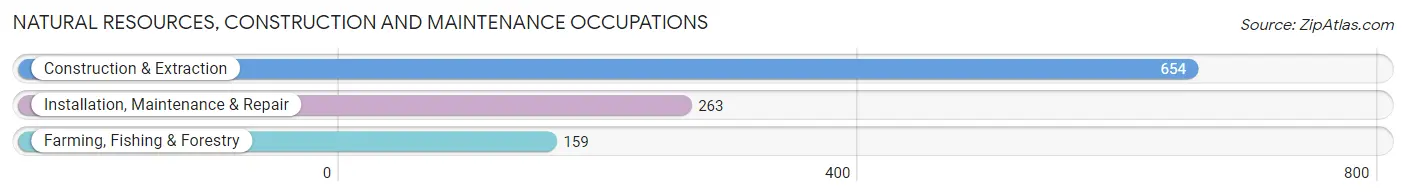
Natural Resources, Construction and Maintenance Occupations
The most common Natural Resources, Construction and Maintenance occupations in Brantley County are Construction & Extraction (654 | 9.4%), Installation, Maintenance & Repair (263 | 3.8%), and Farming, Fishing & Forestry (159 | 2.3%).
Natural Resources, Construction and Maintenance Occupations by Sex
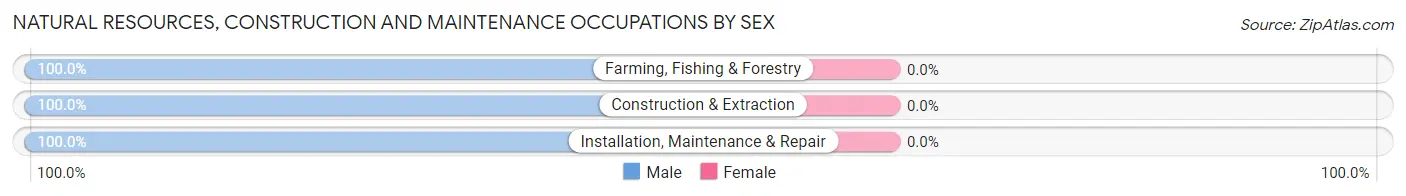
| Occupation | Male | Female |
| Farming, Fishing & Forestry | 159 (100.0%) | 0 (0.0%) |
| Construction & Extraction | 654 (100.0%) | 0 (0.0%) |
| Installation, Maintenance & Repair | 263 (100.0%) | 0 (0.0%) |
| Total (Category) | 1,076 (100.0%) | 0 (0.0%) |
| Total (Overall) | 3,873 (55.4%) | 3,113 (44.6%) |
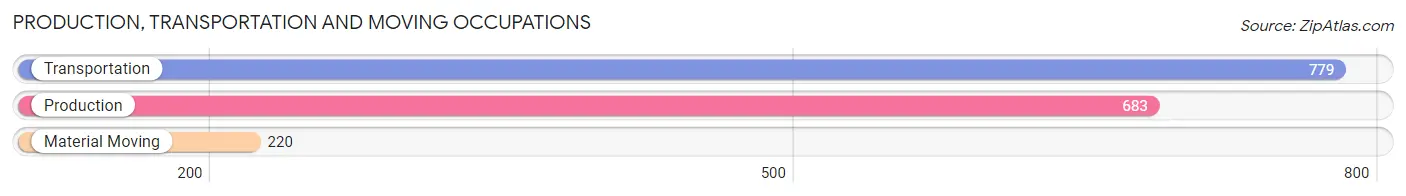
Production, Transportation and Moving Occupations
The most common Production, Transportation and Moving occupations in Brantley County are Transportation (779 | 11.2%), Production (683 | 9.8%), and Material Moving (220 | 3.2%).
Production, Transportation and Moving Occupations by Sex
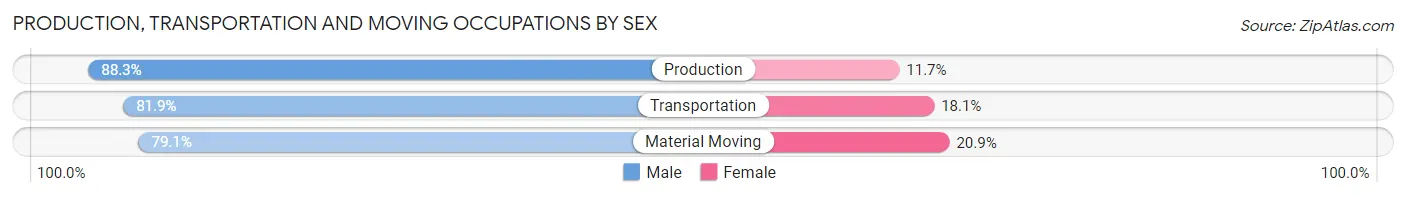
| Occupation | Male | Female |
| Production | 603 (88.3%) | 80 (11.7%) |
| Transportation | 638 (81.9%) | 141 (18.1%) |
| Material Moving | 174 (79.1%) | 46 (20.9%) |
| Total (Category) | 1,415 (84.1%) | 267 (15.9%) |
| Total (Overall) | 3,873 (55.4%) | 3,113 (44.6%) |
Employment Industries by Sex in Brantley County
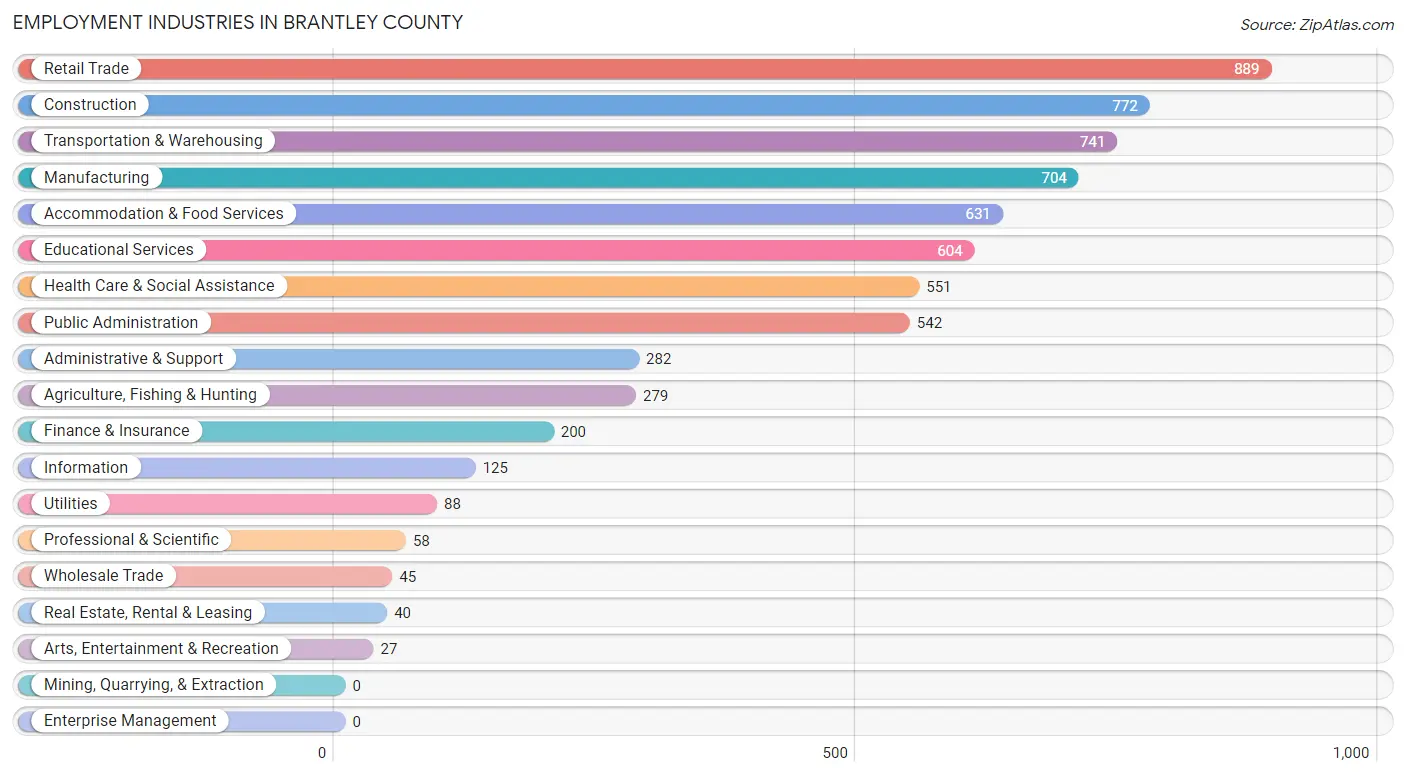
Employment Industries in Brantley County
The major employment industries in Brantley County include Retail Trade (889 | 12.7%), Construction (772 | 11.1%), Transportation & Warehousing (741 | 10.6%), Manufacturing (704 | 10.1%), and Accommodation & Food Services (631 | 9.0%).
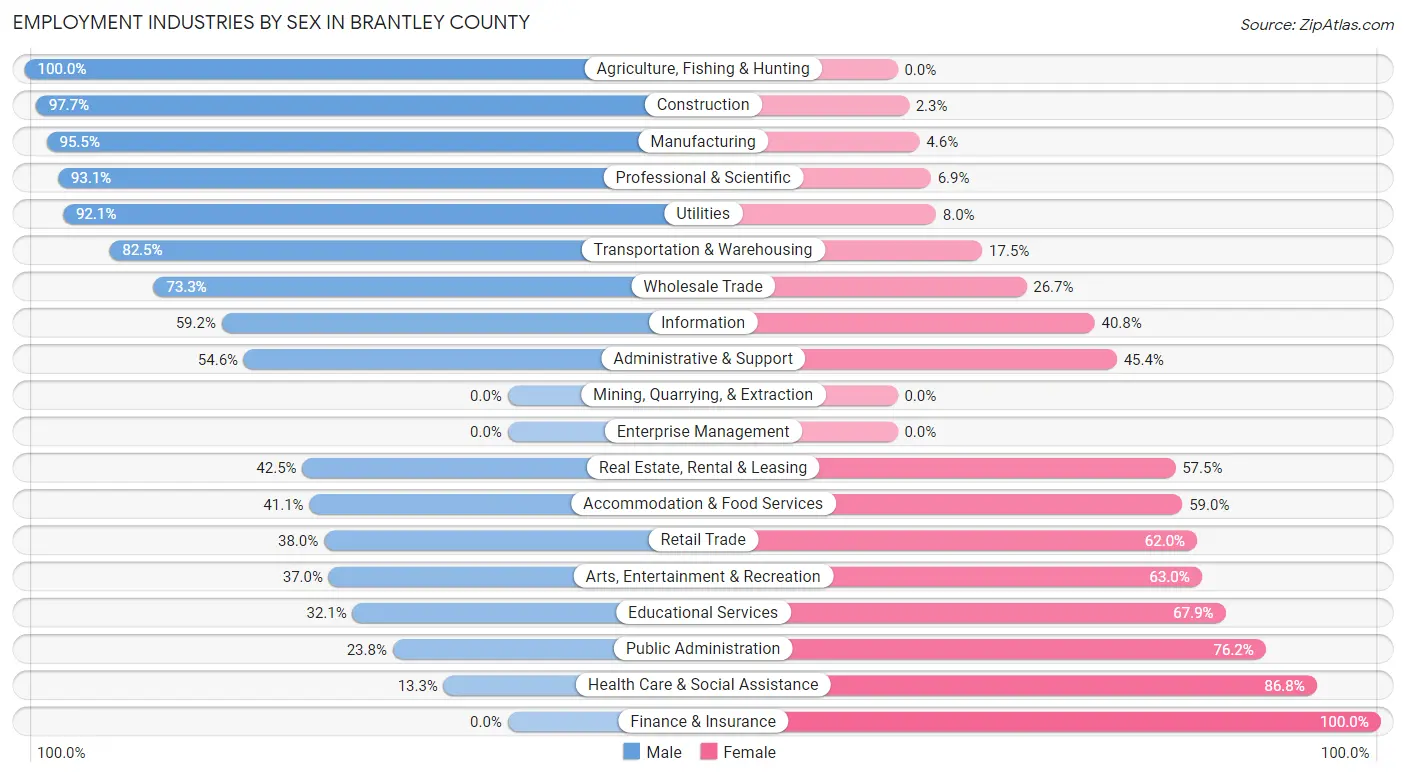
Employment Industries by Sex in Brantley County
The Brantley County industries that see more men than women are Agriculture, Fishing & Hunting (100.0%), Construction (97.7%), and Manufacturing (95.5%), whereas the industries that tend to have a higher number of women are Finance & Insurance (100.0%), Health Care & Social Assistance (86.8%), and Public Administration (76.2%).
| Industry | Male | Female |
| Agriculture, Fishing & Hunting | 279 (100.0%) | 0 (0.0%) |
| Mining, Quarrying, & Extraction | 0 (0.0%) | 0 (0.0%) |
| Construction | 754 (97.7%) | 18 (2.3%) |
| Manufacturing | 672 (95.5%) | 32 (4.5%) |
| Wholesale Trade | 33 (73.3%) | 12 (26.7%) |
| Retail Trade | 338 (38.0%) | 551 (62.0%) |
| Transportation & Warehousing | 611 (82.5%) | 130 (17.5%) |
| Utilities | 81 (92.0%) | 7 (8.0%) |
| Information | 74 (59.2%) | 51 (40.8%) |
| Finance & Insurance | 0 (0.0%) | 200 (100.0%) |
| Real Estate, Rental & Leasing | 17 (42.5%) | 23 (57.5%) |
| Professional & Scientific | 54 (93.1%) | 4 (6.9%) |
| Enterprise Management | 0 (0.0%) | 0 (0.0%) |
| Administrative & Support | 154 (54.6%) | 128 (45.4%) |
| Educational Services | 194 (32.1%) | 410 (67.9%) |
| Health Care & Social Assistance | 73 (13.3%) | 478 (86.8%) |
| Arts, Entertainment & Recreation | 10 (37.0%) | 17 (63.0%) |
| Accommodation & Food Services | 259 (41.0%) | 372 (59.0%) |
| Public Administration | 129 (23.8%) | 413 (76.2%) |
| Total | 3,873 (55.4%) | 3,113 (44.6%) |
Education in Brantley County
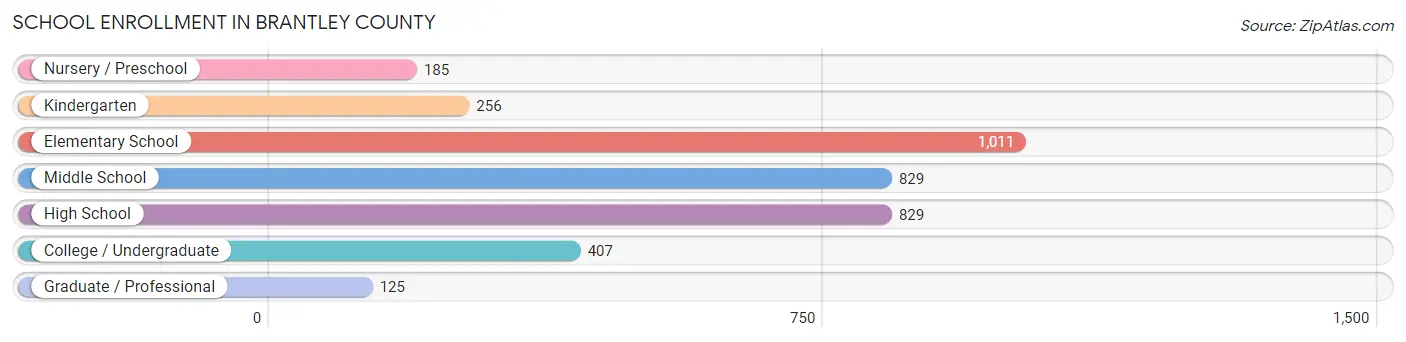
School Enrollment in Brantley County
The most common levels of schooling among the 3,642 students in Brantley County are elementary school (1,011 | 27.8%), middle school (829 | 22.8%), and high school (829 | 22.8%).
| School Level | # Students | % Students |
| Nursery / Preschool | 185 | 5.1% |
| Kindergarten | 256 | 7.0% |
| Elementary School | 1,011 | 27.8% |
| Middle School | 829 | 22.8% |
| High School | 829 | 22.8% |
| College / Undergraduate | 407 | 11.2% |
| Graduate / Professional | 125 | 3.4% |
| Total | 3,642 | 100.0% |
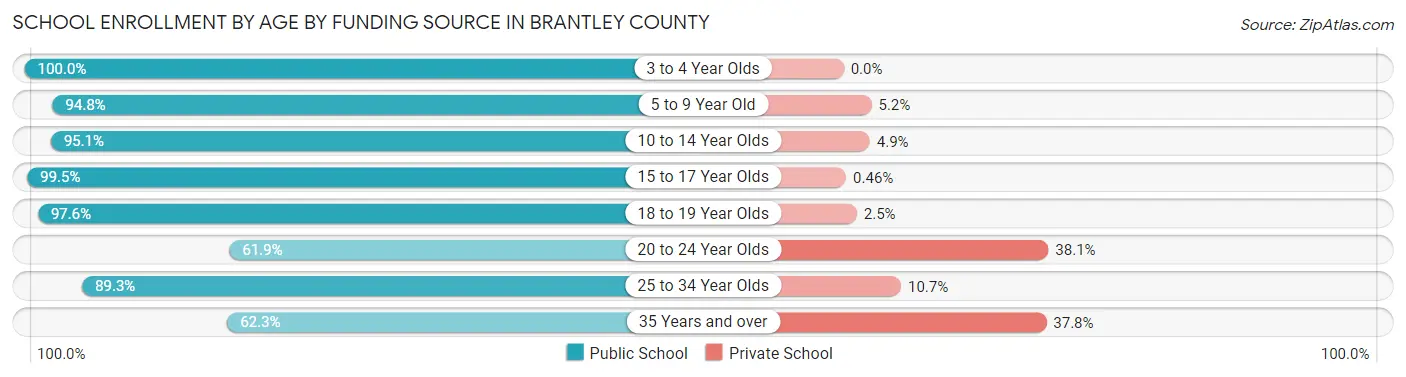
School Enrollment by Age by Funding Source in Brantley County
Out of a total of 3,642 students who are enrolled in schools in Brantley County, 262 (7.2%) attend a private institution, while the remaining 3,380 (92.8%) are enrolled in public schools. The age group of 20 to 24 year olds has the highest likelihood of being enrolled in private schools, with 74 (38.1% in the age bracket) enrolled. Conversely, the age group of 3 to 4 year olds has the lowest likelihood of being enrolled in a private school, with 141 (100.0% in the age bracket) attending a public institution.
| Age Bracket | Public School | Private School |
| 3 to 4 Year Olds | 141 (100.0%) | 0 (0.0%) |
| 5 to 9 Year Old | 1,042 (94.8%) | 57 (5.2%) |
| 10 to 14 Year Olds | 1,015 (95.1%) | 52 (4.9%) |
| 15 to 17 Year Olds | 652 (99.5%) | 3 (0.5%) |
| 18 to 19 Year Olds | 199 (97.6%) | 5 (2.5%) |
| 20 to 24 Year Olds | 120 (61.9%) | 74 (38.1%) |
| 25 to 34 Year Olds | 117 (89.3%) | 14 (10.7%) |
| 35 Years and over | 94 (62.3%) | 57 (37.8%) |
| Total | 3,380 (92.8%) | 262 (7.2%) |
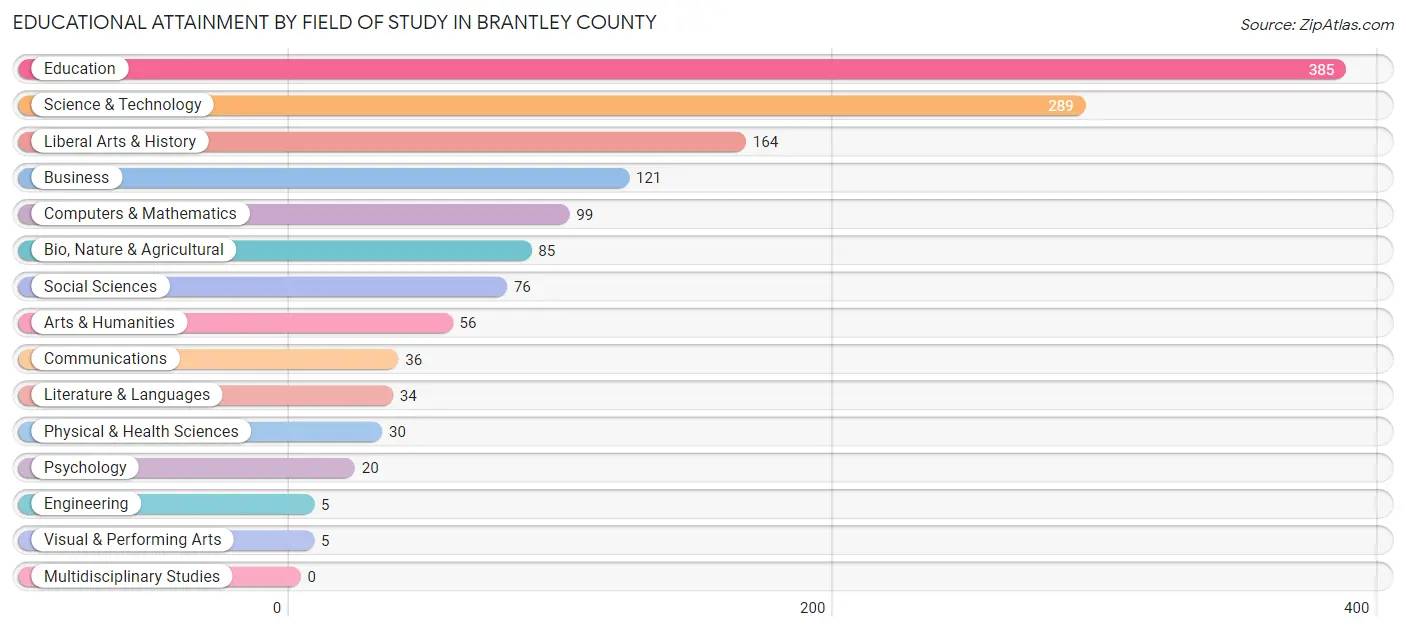
Educational Attainment by Field of Study in Brantley County
Education (385 | 27.4%), science & technology (289 | 20.6%), liberal arts & history (164 | 11.7%), business (121 | 8.6%), and computers & mathematics (99 | 7.0%) are the most common fields of study among 1,405 individuals in Brantley County who have obtained a bachelor's degree or higher.
| Field of Study | # Graduates | % Graduates |
| Computers & Mathematics | 99 | 7.0% |
| Bio, Nature & Agricultural | 85 | 6.0% |
| Physical & Health Sciences | 30 | 2.1% |
| Psychology | 20 | 1.4% |
| Social Sciences | 76 | 5.4% |
| Engineering | 5 | 0.4% |
| Multidisciplinary Studies | 0 | 0.0% |
| Science & Technology | 289 | 20.6% |
| Business | 121 | 8.6% |
| Education | 385 | 27.4% |
| Literature & Languages | 34 | 2.4% |
| Liberal Arts & History | 164 | 11.7% |
| Visual & Performing Arts | 5 | 0.4% |
| Communications | 36 | 2.6% |
| Arts & Humanities | 56 | 4.0% |
| Total | 1,405 | 100.0% |
Transportation & Commute in Brantley County
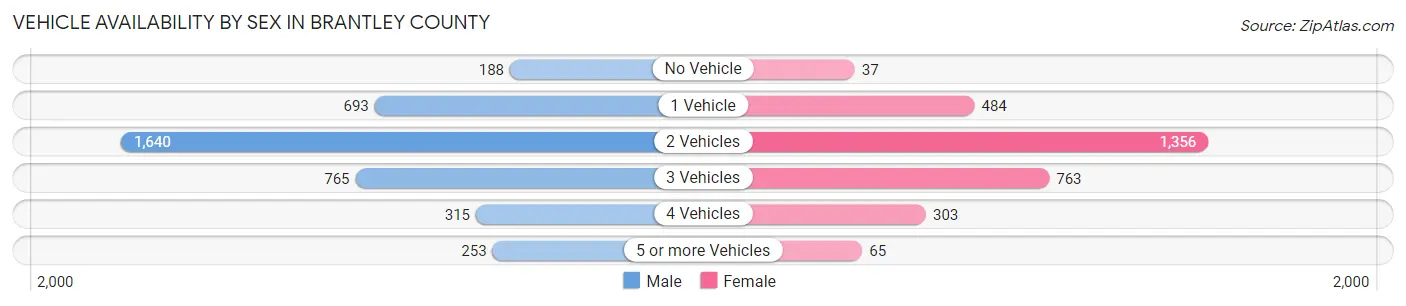
Vehicle Availability by Sex in Brantley County
The most prevalent vehicle ownership categories in Brantley County are males with 2 vehicles (1,640, accounting for 42.5%) and females with 2 vehicles (1,356, making up 54.5%).
| Vehicles Available | Male | Female |
| No Vehicle | 188 (4.9%) | 37 (1.2%) |
| 1 Vehicle | 693 (18.0%) | 484 (16.1%) |
| 2 Vehicles | 1,640 (42.5%) | 1,356 (45.1%) |
| 3 Vehicles | 765 (19.9%) | 763 (25.4%) |
| 4 Vehicles | 315 (8.2%) | 303 (10.1%) |
| 5 or more Vehicles | 253 (6.6%) | 65 (2.2%) |
| Total | 3,854 (100.0%) | 3,008 (100.0%) |
Commute Time in Brantley County
The most frequently occuring commute durations in Brantley County are 30 to 34 minutes (1,298 commuters, 19.3%), 45 to 59 minutes (1,184 commuters, 17.6%), and 20 to 24 minutes (881 commuters, 13.1%).
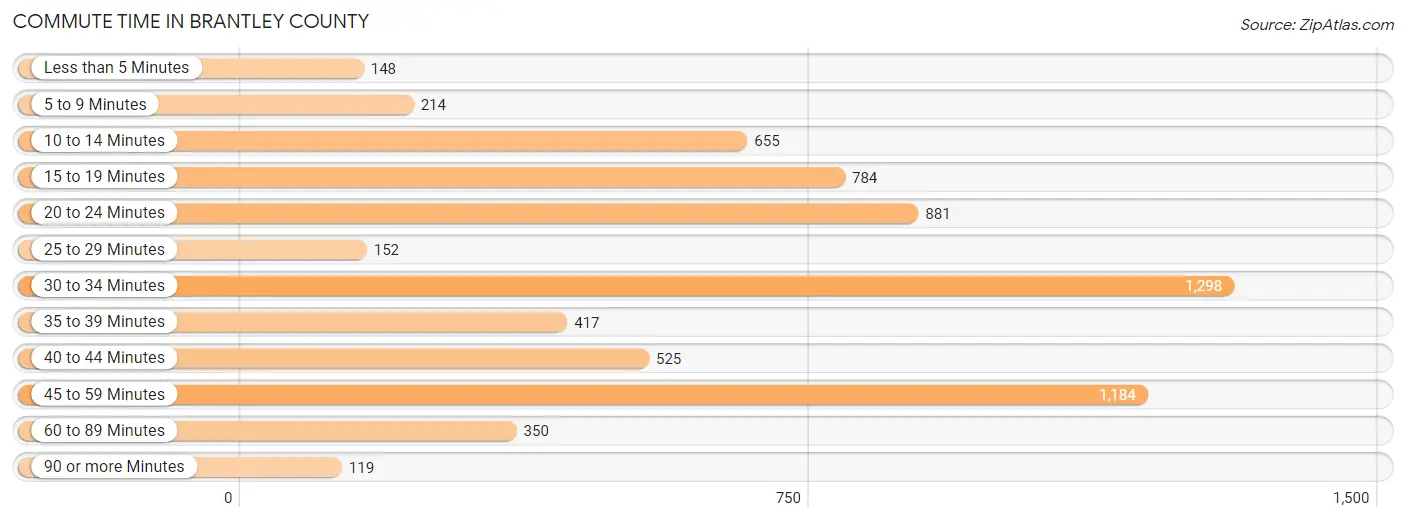
| Commute Time | # Commuters | % Commuters |
| Less than 5 Minutes | 148 | 2.2% |
| 5 to 9 Minutes | 214 | 3.2% |
| 10 to 14 Minutes | 655 | 9.7% |
| 15 to 19 Minutes | 784 | 11.7% |
| 20 to 24 Minutes | 881 | 13.1% |
| 25 to 29 Minutes | 152 | 2.3% |
| 30 to 34 Minutes | 1,298 | 19.3% |
| 35 to 39 Minutes | 417 | 6.2% |
| 40 to 44 Minutes | 525 | 7.8% |
| 45 to 59 Minutes | 1,184 | 17.6% |
| 60 to 89 Minutes | 350 | 5.2% |
| 90 or more Minutes | 119 | 1.8% |
Commute Time by Sex in Brantley County
The most common commute times in Brantley County are 30 to 34 minutes (867 commuters, 22.9%) for males and 40 to 44 minutes (497 commuters, 16.9%) for females.
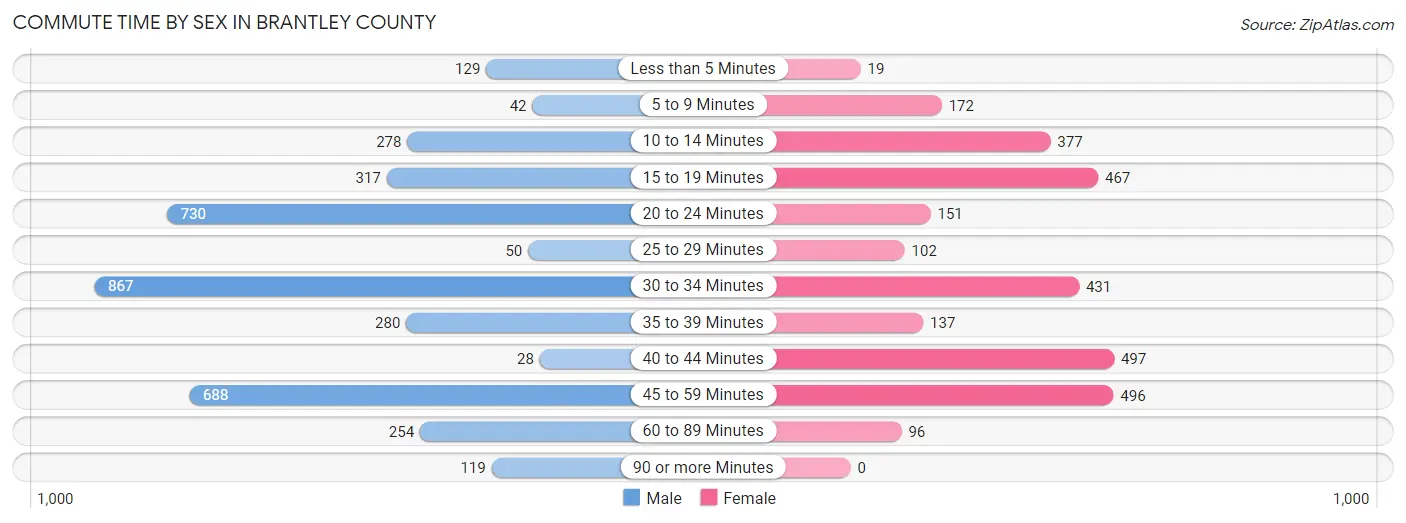
| Commute Time | Male | Female |
| Less than 5 Minutes | 129 (3.4%) | 19 (0.6%) |
| 5 to 9 Minutes | 42 (1.1%) | 172 (5.8%) |
| 10 to 14 Minutes | 278 (7.3%) | 377 (12.8%) |
| 15 to 19 Minutes | 317 (8.4%) | 467 (15.9%) |
| 20 to 24 Minutes | 730 (19.3%) | 151 (5.1%) |
| 25 to 29 Minutes | 50 (1.3%) | 102 (3.5%) |
| 30 to 34 Minutes | 867 (22.9%) | 431 (14.6%) |
| 35 to 39 Minutes | 280 (7.4%) | 137 (4.6%) |
| 40 to 44 Minutes | 28 (0.7%) | 497 (16.9%) |
| 45 to 59 Minutes | 688 (18.2%) | 496 (16.8%) |
| 60 to 89 Minutes | 254 (6.7%) | 96 (3.3%) |
| 90 or more Minutes | 119 (3.2%) | 0 (0.0%) |
Time of Departure to Work by Sex in Brantley County
The most frequent times of departure to work in Brantley County are 6:00 AM to 6:29 AM (1,020, 27.0%) for males and 6:00 AM to 6:29 AM (689, 23.4%) for females.
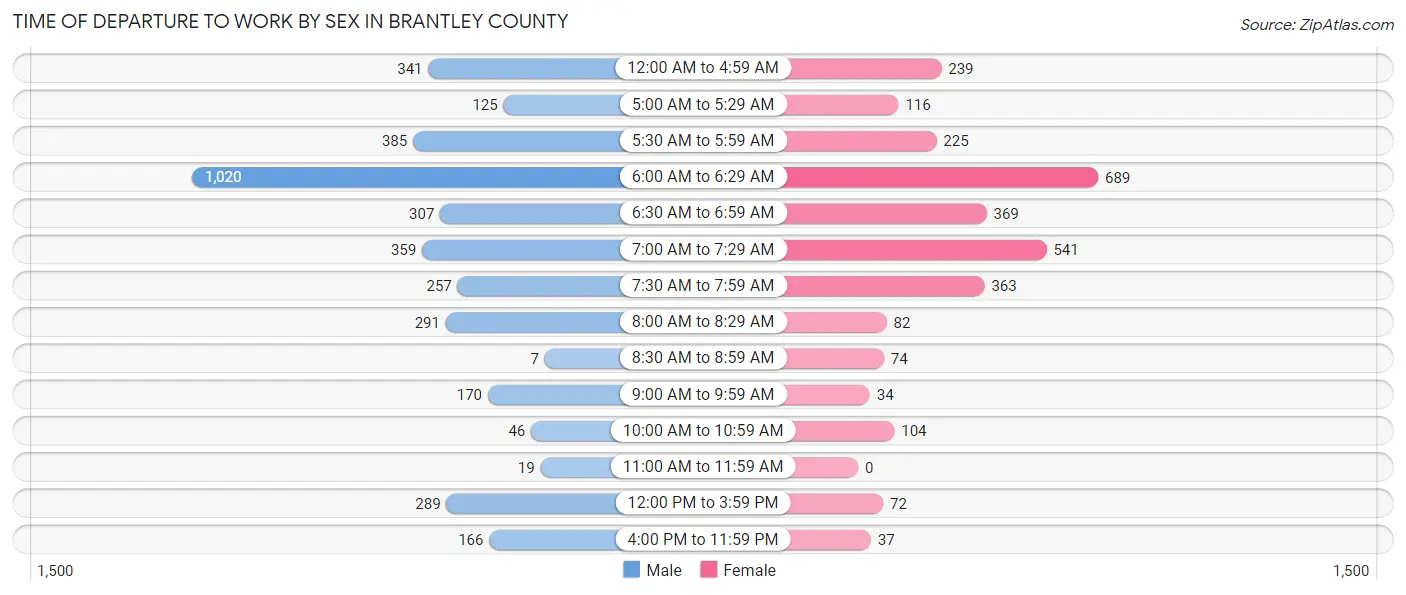
| Time of Departure | Male | Female |
| 12:00 AM to 4:59 AM | 341 (9.0%) | 239 (8.1%) |
| 5:00 AM to 5:29 AM | 125 (3.3%) | 116 (3.9%) |
| 5:30 AM to 5:59 AM | 385 (10.2%) | 225 (7.6%) |
| 6:00 AM to 6:29 AM | 1,020 (27.0%) | 689 (23.4%) |
| 6:30 AM to 6:59 AM | 307 (8.1%) | 369 (12.5%) |
| 7:00 AM to 7:29 AM | 359 (9.5%) | 541 (18.4%) |
| 7:30 AM to 7:59 AM | 257 (6.8%) | 363 (12.3%) |
| 8:00 AM to 8:29 AM | 291 (7.7%) | 82 (2.8%) |
| 8:30 AM to 8:59 AM | 7 (0.2%) | 74 (2.5%) |
| 9:00 AM to 9:59 AM | 170 (4.5%) | 34 (1.1%) |
| 10:00 AM to 10:59 AM | 46 (1.2%) | 104 (3.5%) |
| 11:00 AM to 11:59 AM | 19 (0.5%) | 0 (0.0%) |
| 12:00 PM to 3:59 PM | 289 (7.6%) | 72 (2.4%) |
| 4:00 PM to 11:59 PM | 166 (4.4%) | 37 (1.3%) |
| Total | 3,782 (100.0%) | 2,945 (100.0%) |
Housing Occupancy in Brantley County
Occupancy by Ownership in Brantley County
Of the total 6,649 dwellings in Brantley County, owner-occupied units account for 5,029 (75.6%), while renter-occupied units make up 1,620 (24.4%).
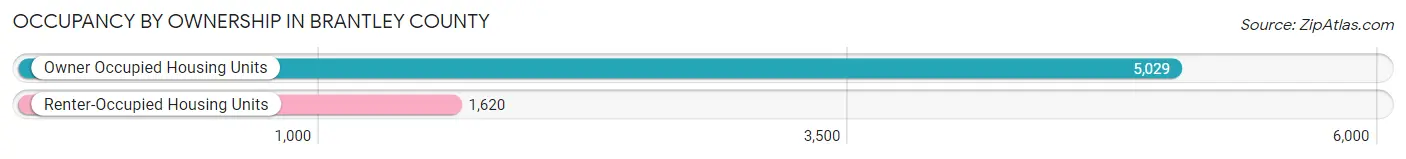
| Occupancy | # Housing Units | % Housing Units |
| Owner Occupied Housing Units | 5,029 | 75.6% |
| Renter-Occupied Housing Units | 1,620 | 24.4% |
| Total Occupied Housing Units | 6,649 | 100.0% |
Occupancy by Household Size in Brantley County
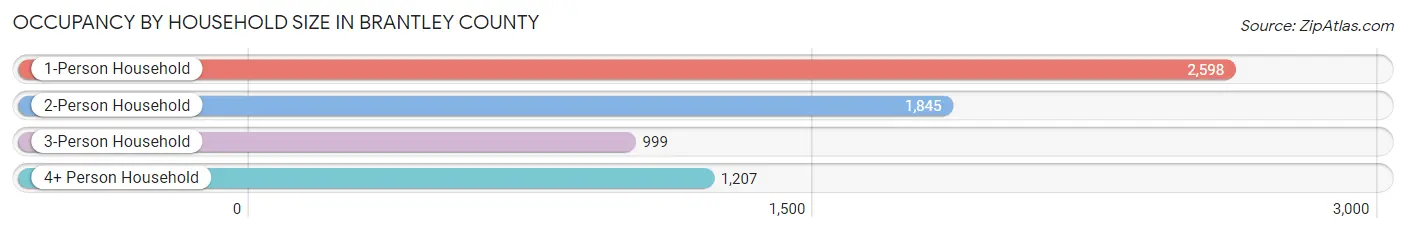
| Household Size | # Housing Units | % Housing Units |
| 1-Person Household | 2,598 | 39.1% |
| 2-Person Household | 1,845 | 27.8% |
| 3-Person Household | 999 | 15.0% |
| 4+ Person Household | 1,207 | 18.1% |
| Total Housing Units | 6,649 | 100.0% |
Occupancy by Ownership by Household Size in Brantley County
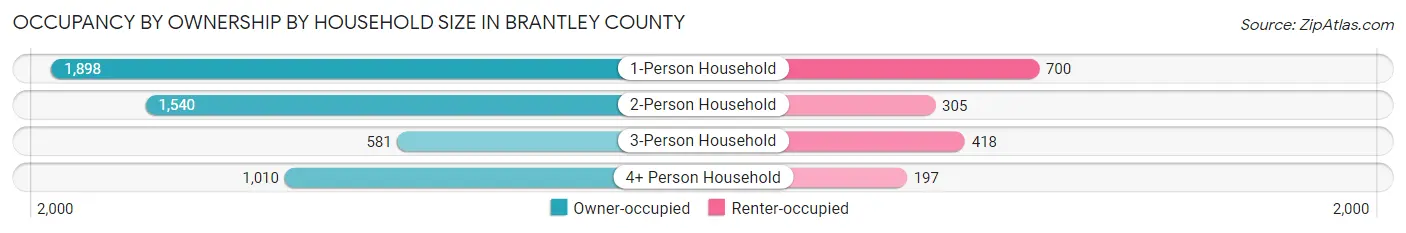
| Household Size | Owner-occupied | Renter-occupied |
| 1-Person Household | 1,898 (73.1%) | 700 (26.9%) |
| 2-Person Household | 1,540 (83.5%) | 305 (16.5%) |
| 3-Person Household | 581 (58.2%) | 418 (41.8%) |
| 4+ Person Household | 1,010 (83.7%) | 197 (16.3%) |
| Total Housing Units | 5,029 (75.6%) | 1,620 (24.4%) |
Occupancy by Educational Attainment in Brantley County
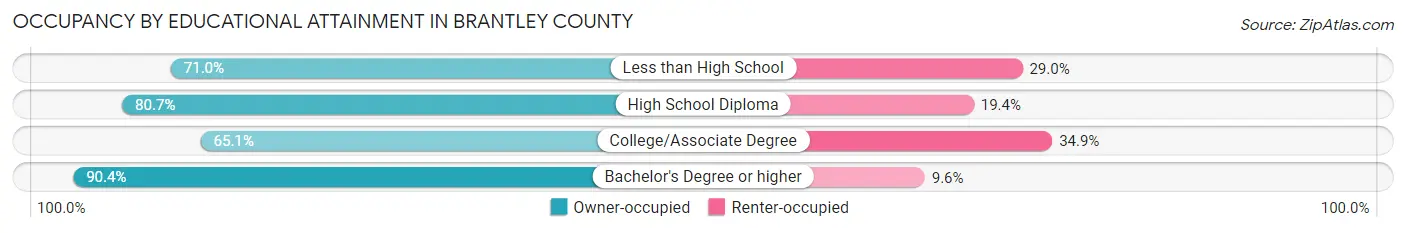
| Household Size | Owner-occupied | Renter-occupied |
| Less than High School | 886 (71.0%) | 362 (29.0%) |
| High School Diploma | 2,409 (80.6%) | 578 (19.4%) |
| College/Associate Degree | 1,153 (65.1%) | 618 (34.9%) |
| Bachelor's Degree or higher | 581 (90.4%) | 62 (9.6%) |
Occupancy by Age of Householder in Brantley County
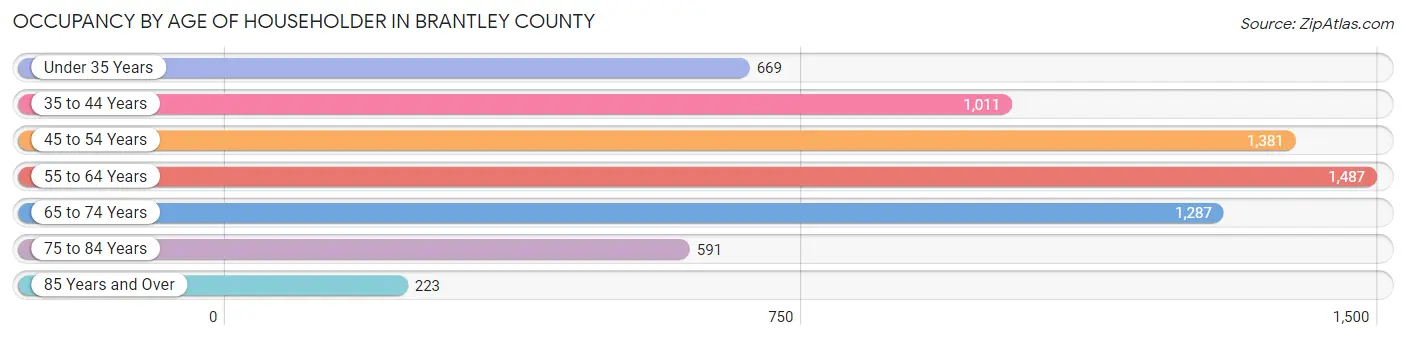
| Age Bracket | # Households | % Households |
| Under 35 Years | 669 | 10.1% |
| 35 to 44 Years | 1,011 | 15.2% |
| 45 to 54 Years | 1,381 | 20.8% |
| 55 to 64 Years | 1,487 | 22.4% |
| 65 to 74 Years | 1,287 | 19.4% |
| 75 to 84 Years | 591 | 8.9% |
| 85 Years and Over | 223 | 3.4% |
| Total | 6,649 | 100.0% |
Housing Finances in Brantley County
Median Income by Occupancy in Brantley County
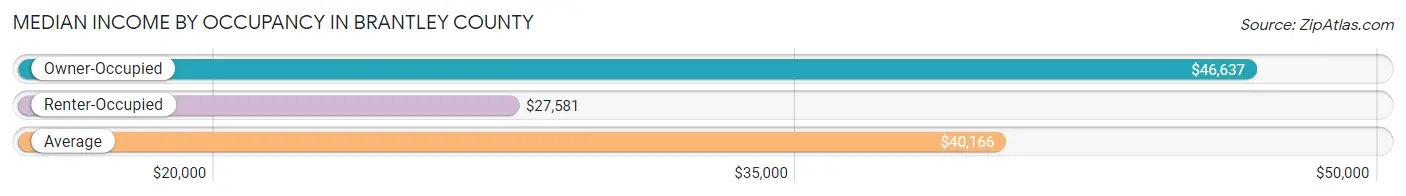
| Occupancy Type | # Households | Median Income |
| Owner-Occupied | 5,029 (75.6%) | $46,637 |
| Renter-Occupied | 1,620 (24.4%) | $27,581 |
| Average | 6,649 (100.0%) | $40,166 |
Occupancy by Householder Income Bracket in Brantley County
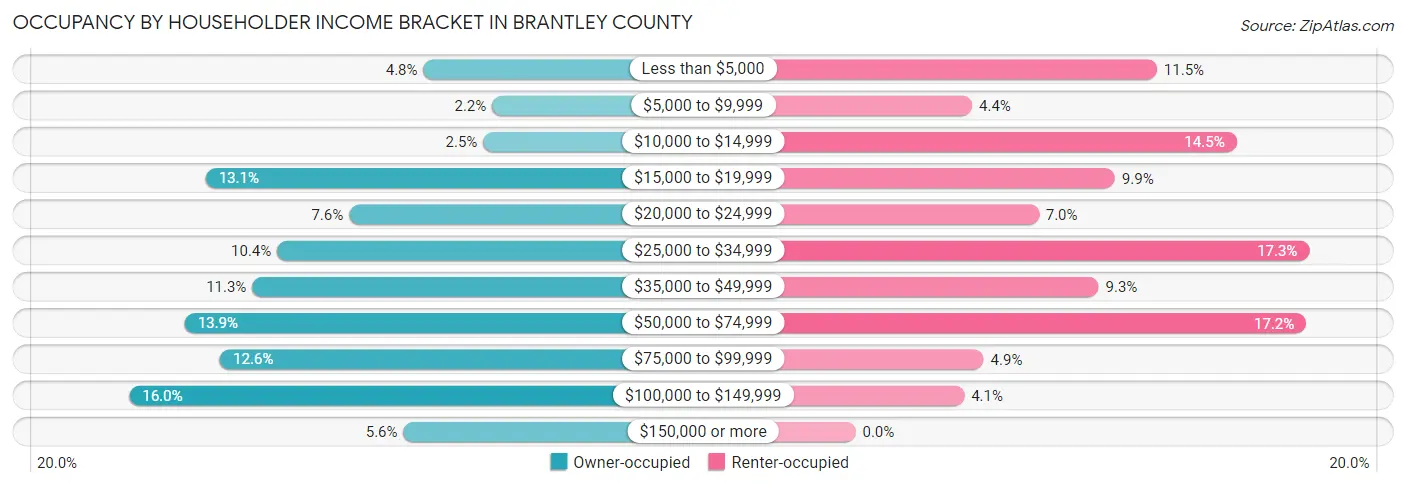
| Income Bracket | Owner-occupied | Renter-occupied |
| Less than $5,000 | 242 (4.8%) | 186 (11.5%) |
| $5,000 to $9,999 | 110 (2.2%) | 72 (4.4%) |
| $10,000 to $14,999 | 127 (2.5%) | 235 (14.5%) |
| $15,000 to $19,999 | 659 (13.1%) | 160 (9.9%) |
| $20,000 to $24,999 | 384 (7.6%) | 113 (7.0%) |
| $25,000 to $34,999 | 522 (10.4%) | 280 (17.3%) |
| $35,000 to $49,999 | 570 (11.3%) | 150 (9.3%) |
| $50,000 to $74,999 | 699 (13.9%) | 278 (17.2%) |
| $75,000 to $99,999 | 631 (12.6%) | 79 (4.9%) |
| $100,000 to $149,999 | 805 (16.0%) | 67 (4.1%) |
| $150,000 or more | 280 (5.6%) | 0 (0.0%) |
| Total | 5,029 (100.0%) | 1,620 (100.0%) |
Monthly Housing Cost Tiers in Brantley County
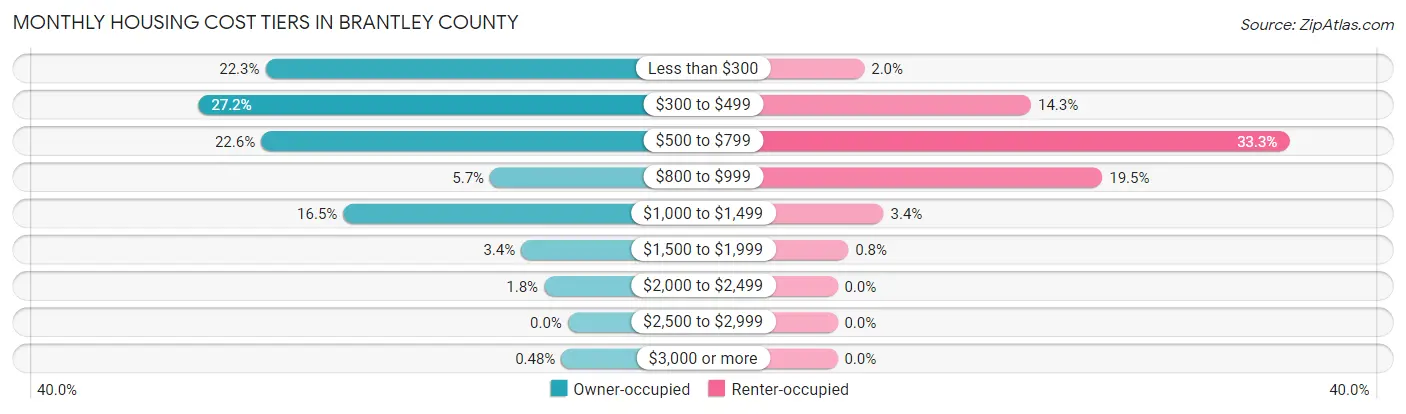
| Monthly Cost | Owner-occupied | Renter-occupied |
| Less than $300 | 1,120 (22.3%) | 32 (2.0%) |
| $300 to $499 | 1,368 (27.2%) | 231 (14.3%) |
| $500 to $799 | 1,136 (22.6%) | 539 (33.3%) |
| $800 to $999 | 288 (5.7%) | 316 (19.5%) |
| $1,000 to $1,499 | 832 (16.5%) | 55 (3.4%) |
| $1,500 to $1,999 | 173 (3.4%) | 13 (0.8%) |
| $2,000 to $2,499 | 88 (1.8%) | 0 (0.0%) |
| $2,500 to $2,999 | 0 (0.0%) | 0 (0.0%) |
| $3,000 or more | 24 (0.5%) | 0 (0.0%) |
| Total | 5,029 (100.0%) | 1,620 (100.0%) |
Physical Housing Characteristics in Brantley County
Housing Structures in Brantley County
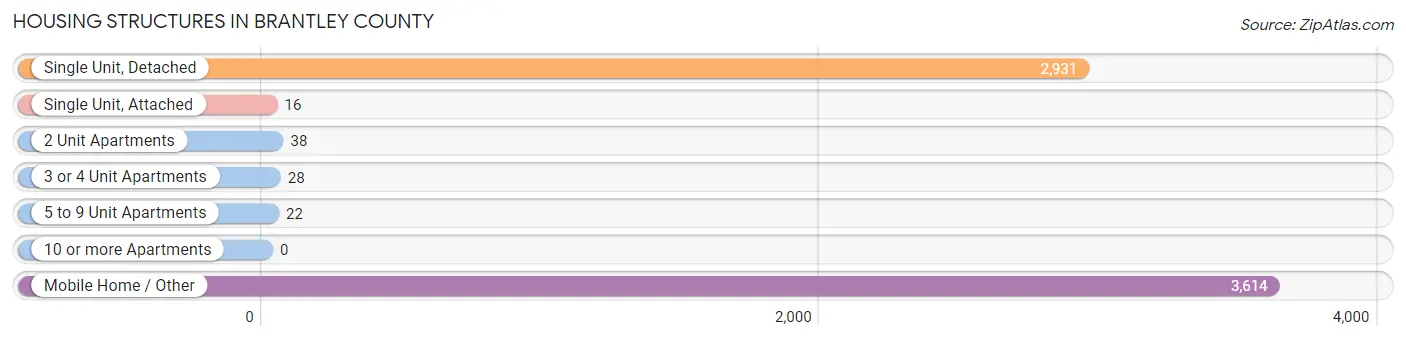
| Structure Type | # Housing Units | % Housing Units |
| Single Unit, Detached | 2,931 | 44.1% |
| Single Unit, Attached | 16 | 0.2% |
| 2 Unit Apartments | 38 | 0.6% |
| 3 or 4 Unit Apartments | 28 | 0.4% |
| 5 to 9 Unit Apartments | 22 | 0.3% |
| 10 or more Apartments | 0 | 0.0% |
| Mobile Home / Other | 3,614 | 54.3% |
| Total | 6,649 | 100.0% |
Housing Structures by Occupancy in Brantley County
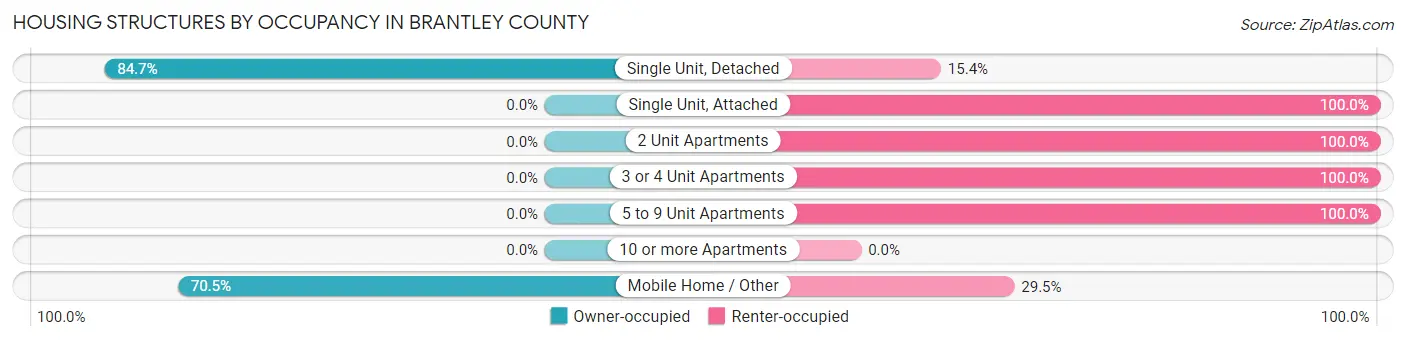
| Structure Type | Owner-occupied | Renter-occupied |
| Single Unit, Detached | 2,481 (84.7%) | 450 (15.3%) |
| Single Unit, Attached | 0 (0.0%) | 16 (100.0%) |
| 2 Unit Apartments | 0 (0.0%) | 38 (100.0%) |
| 3 or 4 Unit Apartments | 0 (0.0%) | 28 (100.0%) |
| 5 to 9 Unit Apartments | 0 (0.0%) | 22 (100.0%) |
| 10 or more Apartments | 0 (0.0%) | 0 (0.0%) |
| Mobile Home / Other | 2,548 (70.5%) | 1,066 (29.5%) |
| Total | 5,029 (75.6%) | 1,620 (24.4%) |
Housing Structures by Number of Rooms in Brantley County
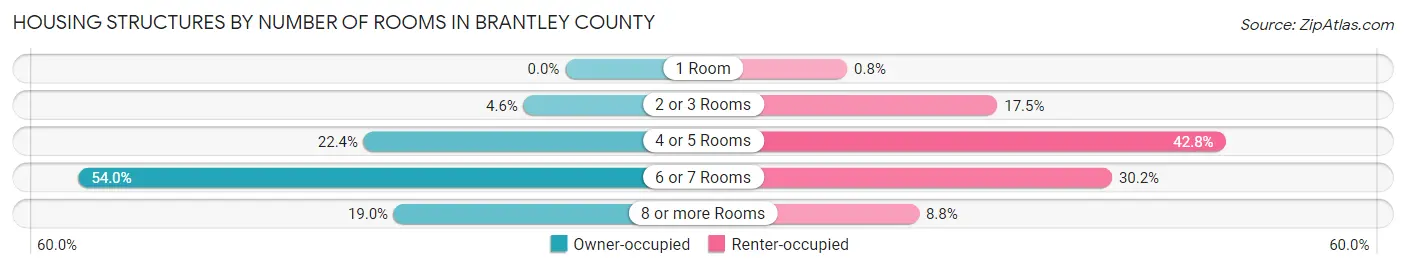
| Number of Rooms | Owner-occupied | Renter-occupied |
| 1 Room | 0 (0.0%) | 13 (0.8%) |
| 2 or 3 Rooms | 232 (4.6%) | 283 (17.5%) |
| 4 or 5 Rooms | 1,124 (22.4%) | 693 (42.8%) |
| 6 or 7 Rooms | 2,717 (54.0%) | 489 (30.2%) |
| 8 or more Rooms | 956 (19.0%) | 142 (8.8%) |
| Total | 5,029 (100.0%) | 1,620 (100.0%) |
Housing Structure by Heating Type in Brantley County
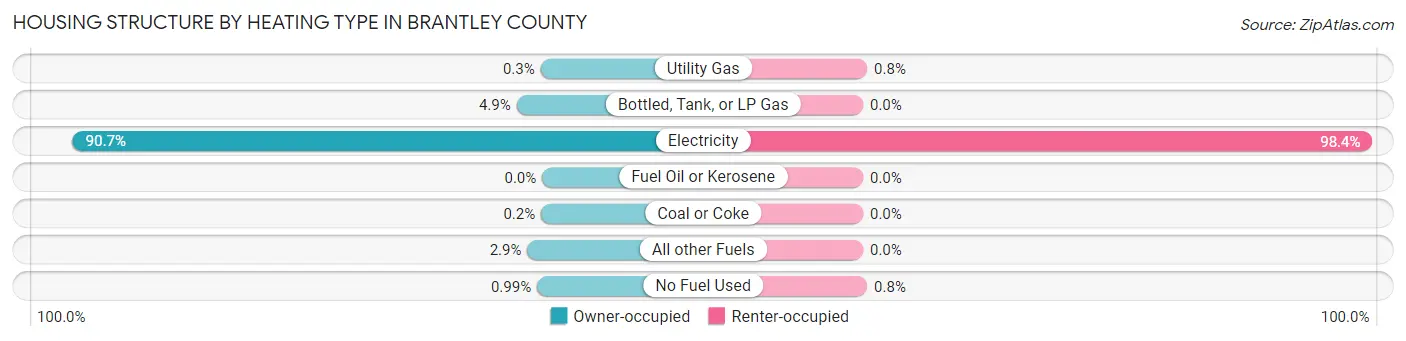
| Heating Type | Owner-occupied | Renter-occupied |
| Utility Gas | 15 (0.3%) | 13 (0.8%) |
| Bottled, Tank, or LP Gas | 248 (4.9%) | 0 (0.0%) |
| Electricity | 4,562 (90.7%) | 1,594 (98.4%) |
| Fuel Oil or Kerosene | 0 (0.0%) | 0 (0.0%) |
| Coal or Coke | 10 (0.2%) | 0 (0.0%) |
| All other Fuels | 144 (2.9%) | 0 (0.0%) |
| No Fuel Used | 50 (1.0%) | 13 (0.8%) |
| Total | 5,029 (100.0%) | 1,620 (100.0%) |
Household Vehicle Usage in Brantley County
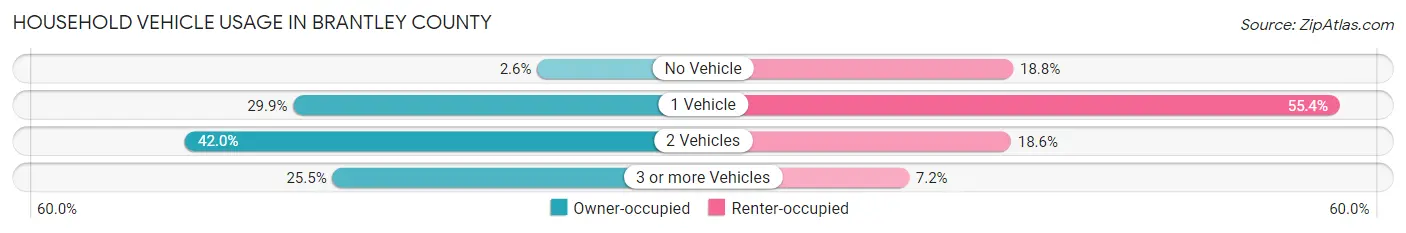
| Vehicles per Household | Owner-occupied | Renter-occupied |
| No Vehicle | 129 (2.6%) | 305 (18.8%) |
| 1 Vehicle | 1,504 (29.9%) | 898 (55.4%) |
| 2 Vehicles | 2,113 (42.0%) | 301 (18.6%) |
| 3 or more Vehicles | 1,283 (25.5%) | 116 (7.2%) |
| Total | 5,029 (100.0%) | 1,620 (100.0%) |
Real Estate & Mortgages in Brantley County
Real Estate and Mortgage Overview in Brantley County
| Characteristic | Without Mortgage | With Mortgage |
| Housing Units | 3,399 | 1,630 |
| Median Property Value | $56,200 | $146,400 |
| Median Household Income | $32,509 | $149 |
| Monthly Housing Costs | $376 | $24 |
| Real Estate Taxes | $814 | $66 |
Property Value by Mortgage Status in Brantley County
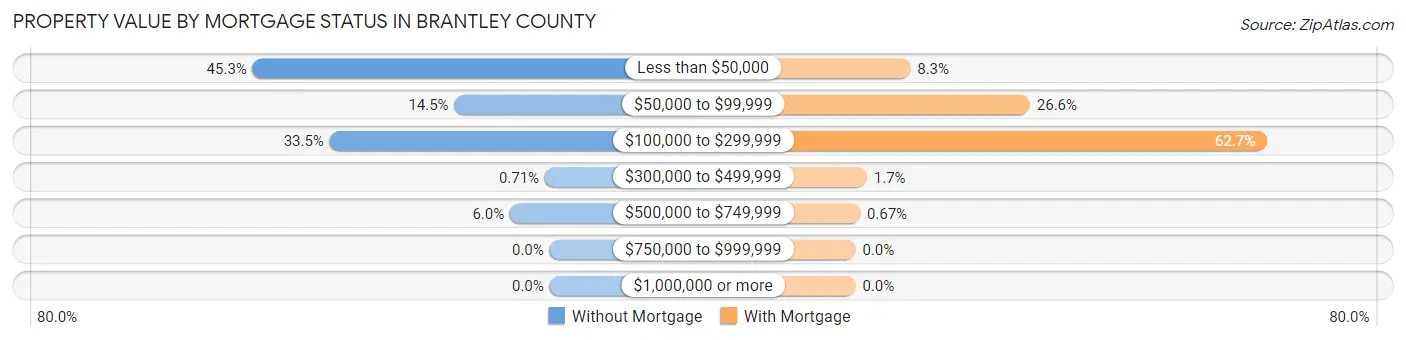
| Property Value | Without Mortgage | With Mortgage |
| Less than $50,000 | 1,538 (45.3%) | 136 (8.3%) |
| $50,000 to $99,999 | 493 (14.5%) | 433 (26.6%) |
| $100,000 to $299,999 | 1,139 (33.5%) | 1,022 (62.7%) |
| $300,000 to $499,999 | 24 (0.7%) | 28 (1.7%) |
| $500,000 to $749,999 | 205 (6.0%) | 11 (0.7%) |
| $750,000 to $999,999 | 0 (0.0%) | 0 (0.0%) |
| $1,000,000 or more | 0 (0.0%) | 0 (0.0%) |
| Total | 3,399 (100.0%) | 1,630 (100.0%) |
Household Income by Mortgage Status in Brantley County

| Household Income | Without Mortgage | With Mortgage |
| Less than $10,000 | 308 (9.1%) | 12 (0.7%) |
| $10,000 to $24,999 | 1,074 (31.6%) | 44 (2.7%) |
| $25,000 to $34,999 | 462 (13.6%) | 96 (5.9%) |
| $35,000 to $49,999 | 371 (10.9%) | 60 (3.7%) |
| $50,000 to $74,999 | 519 (15.3%) | 199 (12.2%) |
| $75,000 to $99,999 | 298 (8.8%) | 180 (11.0%) |
| $100,000 to $149,999 | 236 (6.9%) | 333 (20.4%) |
| $150,000 or more | 131 (3.8%) | 569 (34.9%) |
| Total | 3,399 (100.0%) | 1,630 (100.0%) |
Property Value to Household Income Ratio in Brantley County
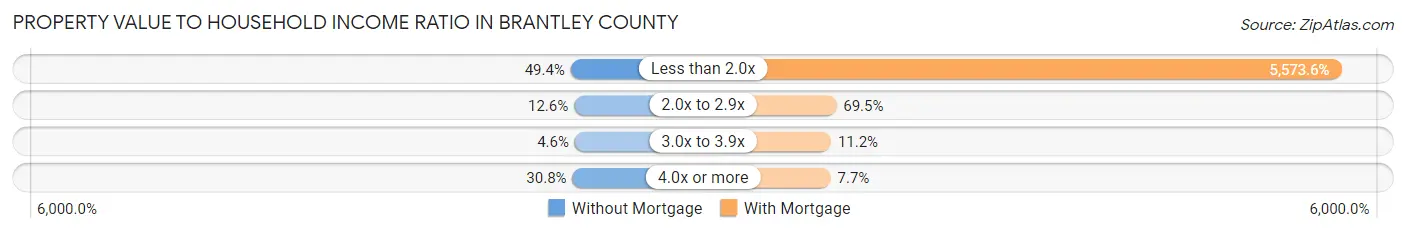
| Value-to-Income Ratio | Without Mortgage | With Mortgage |
| Less than 2.0x | 1,678 (49.4%) | 90,850 (5,573.6%) |
| 2.0x to 2.9x | 427 (12.6%) | 1,133 (69.5%) |
| 3.0x to 3.9x | 157 (4.6%) | 182 (11.2%) |
| 4.0x or more | 1,046 (30.8%) | 125 (7.7%) |
| Total | 3,399 (100.0%) | 1,630 (100.0%) |
Real Estate Taxes by Mortgage Status in Brantley County
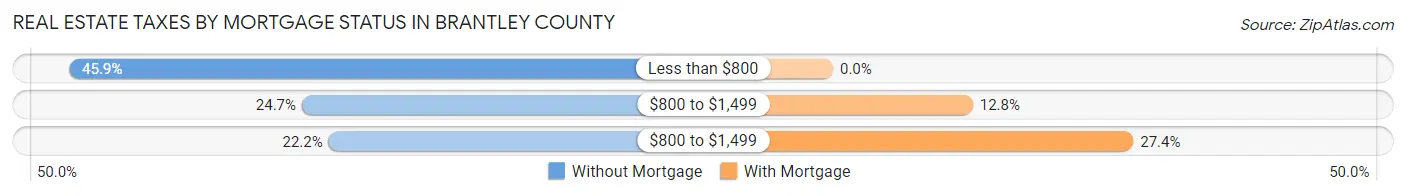
| Property Taxes | Without Mortgage | With Mortgage |
| Less than $800 | 1,561 (45.9%) | 0 (0.0%) |
| $800 to $1,499 | 839 (24.7%) | 208 (12.8%) |
| $800 to $1,499 | 756 (22.2%) | 447 (27.4%) |
| Total | 3,399 (100.0%) | 1,630 (100.0%) |
Health & Disability in Brantley County
Health Insurance Coverage by Age in Brantley County
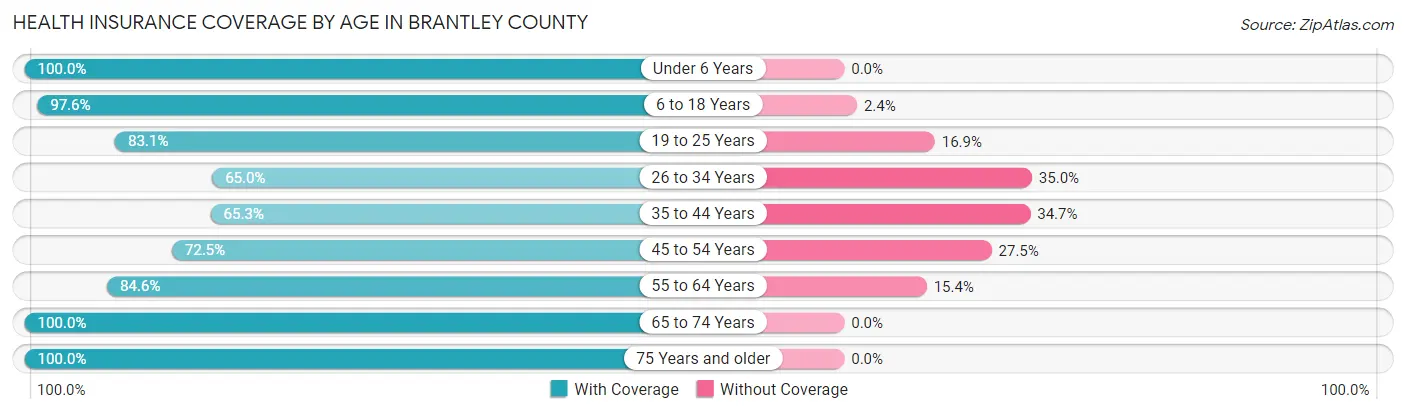
| Age Bracket | With Coverage | Without Coverage |
| Under 6 Years | 1,322 (100.0%) | 0 (0.0%) |
| 6 to 18 Years | 2,889 (97.6%) | 70 (2.4%) |
| 19 to 25 Years | 1,339 (83.1%) | 272 (16.9%) |
| 26 to 34 Years | 1,096 (65.0%) | 590 (35.0%) |
| 35 to 44 Years | 1,574 (65.3%) | 836 (34.7%) |
| 45 to 54 Years | 1,877 (72.5%) | 711 (27.5%) |
| 55 to 64 Years | 2,131 (84.6%) | 387 (15.4%) |
| 65 to 74 Years | 1,828 (100.0%) | 0 (0.0%) |
| 75 Years and older | 1,113 (100.0%) | 0 (0.0%) |
| Total | 15,169 (84.1%) | 2,866 (15.9%) |
Health Insurance Coverage by Citizenship Status in Brantley County
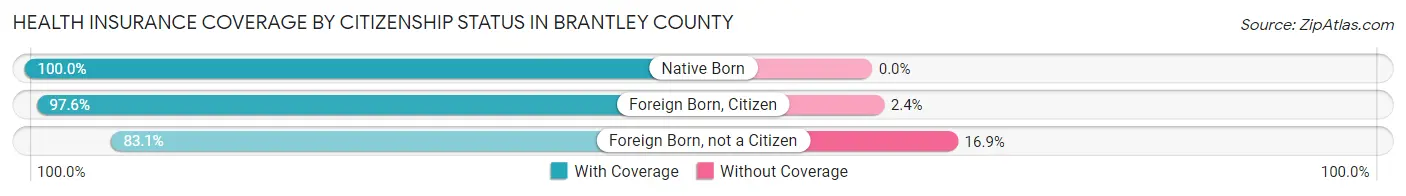
| Citizenship Status | With Coverage | Without Coverage |
| Native Born | 1,322 (100.0%) | 0 (0.0%) |
| Foreign Born, Citizen | 2,889 (97.6%) | 70 (2.4%) |
| Foreign Born, not a Citizen | 1,339 (83.1%) | 272 (16.9%) |
Health Insurance Coverage by Household Income in Brantley County
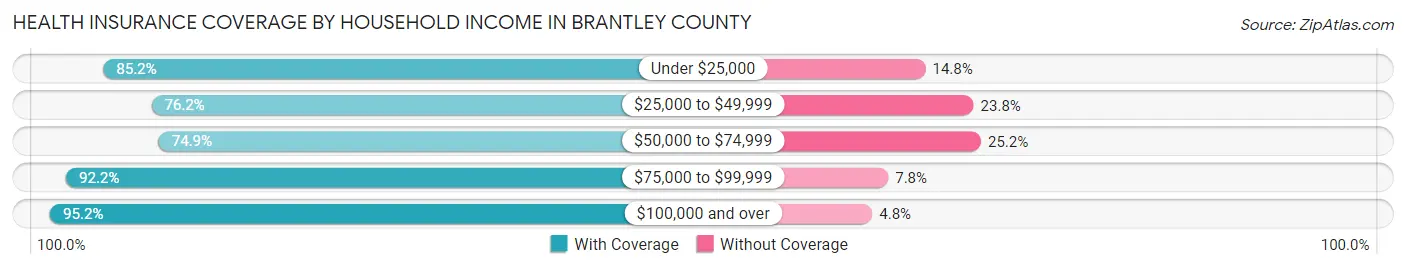
| Household Income | With Coverage | Without Coverage |
| Under $25,000 | 2,985 (85.2%) | 517 (14.8%) |
| $25,000 to $49,999 | 2,970 (76.2%) | 926 (23.8%) |
| $50,000 to $74,999 | 3,092 (74.9%) | 1,039 (25.2%) |
| $75,000 to $99,999 | 2,231 (92.2%) | 188 (7.8%) |
| $100,000 and over | 3,880 (95.2%) | 195 (4.8%) |
Public vs Private Health Insurance Coverage by Age in Brantley County
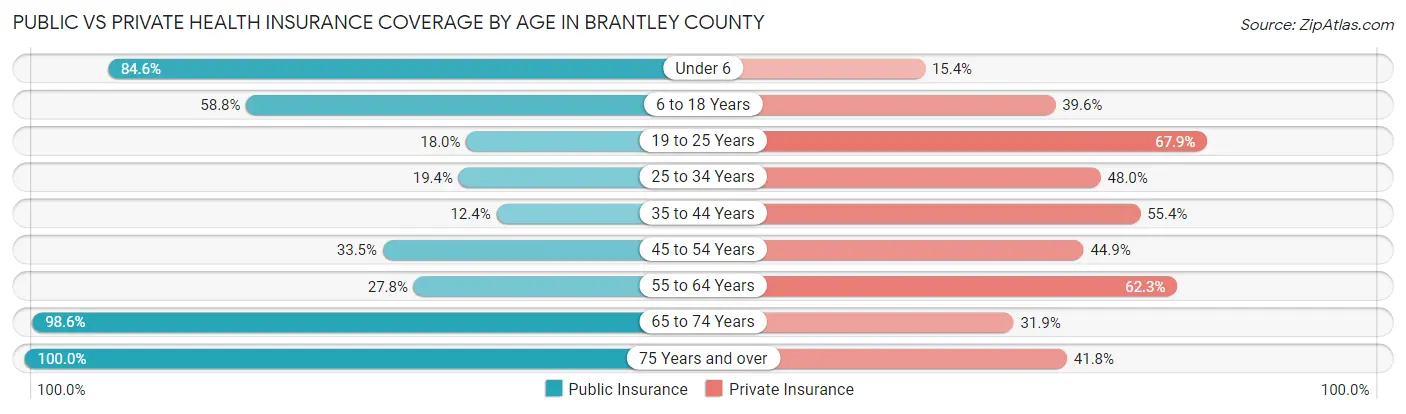
| Age Bracket | Public Insurance | Private Insurance |
| Under 6 | 1,118 (84.6%) | 204 (15.4%) |
| 6 to 18 Years | 1,741 (58.8%) | 1,172 (39.6%) |
| 19 to 25 Years | 290 (18.0%) | 1,093 (67.8%) |
| 25 to 34 Years | 327 (19.4%) | 810 (48.0%) |
| 35 to 44 Years | 299 (12.4%) | 1,335 (55.4%) |
| 45 to 54 Years | 867 (33.5%) | 1,161 (44.9%) |
| 55 to 64 Years | 699 (27.8%) | 1,568 (62.3%) |
| 65 to 74 Years | 1,802 (98.6%) | 583 (31.9%) |
| 75 Years and over | 1,113 (100.0%) | 465 (41.8%) |
| Total | 8,256 (45.8%) | 8,391 (46.5%) |
Disability Status by Sex by Age in Brantley County
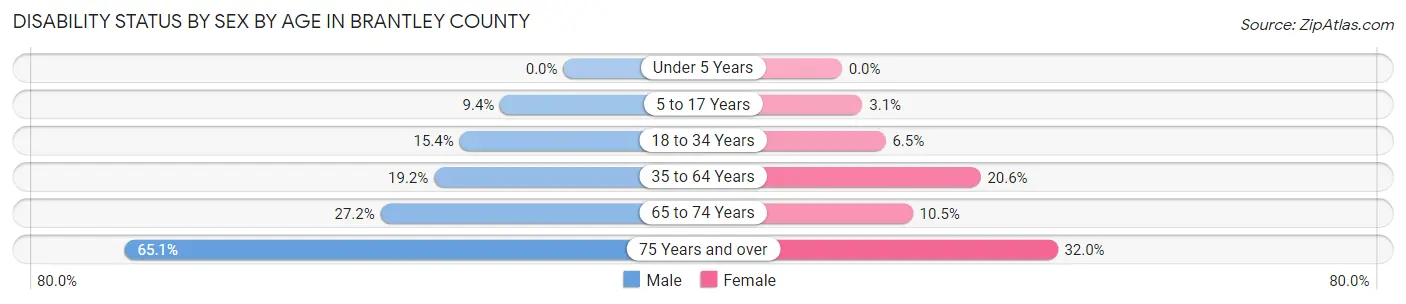
| Age Bracket | Male | Female |
| Under 5 Years | 0 (0.0%) | 0 (0.0%) |
| 5 to 17 Years | 147 (9.4%) | 44 (3.0%) |
| 18 to 34 Years | 262 (15.4%) | 116 (6.5%) |
| 35 to 64 Years | 733 (19.2%) | 761 (20.6%) |
| 65 to 74 Years | 246 (27.2%) | 97 (10.5%) |
| 75 Years and over | 312 (65.1%) | 203 (32.0%) |
Disability Class by Sex by Age in Brantley County
Disability Class: Hearing Difficulty
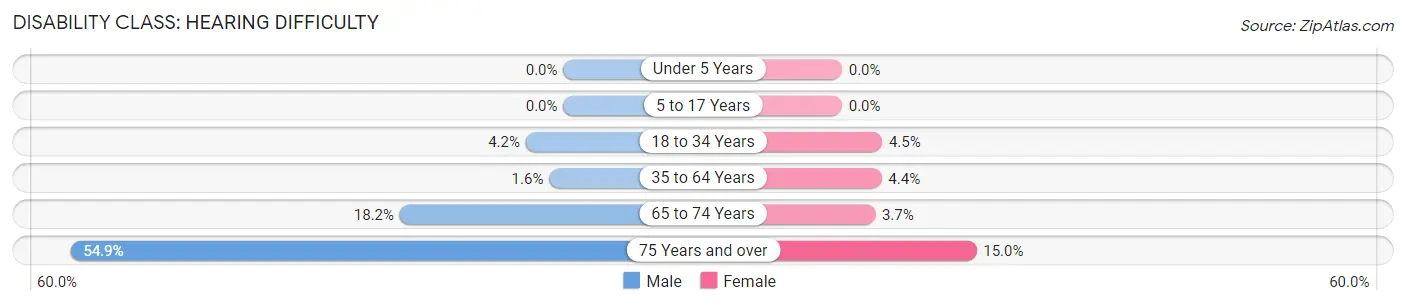
| Age Bracket | Male | Female |
| Under 5 Years | 0 (0.0%) | 0 (0.0%) |
| 5 to 17 Years | 0 (0.0%) | 0 (0.0%) |
| 18 to 34 Years | 71 (4.2%) | 80 (4.5%) |
| 35 to 64 Years | 60 (1.6%) | 163 (4.4%) |
| 65 to 74 Years | 165 (18.2%) | 34 (3.7%) |
| 75 Years and over | 263 (54.9%) | 95 (15.0%) |
Disability Class: Vision Difficulty
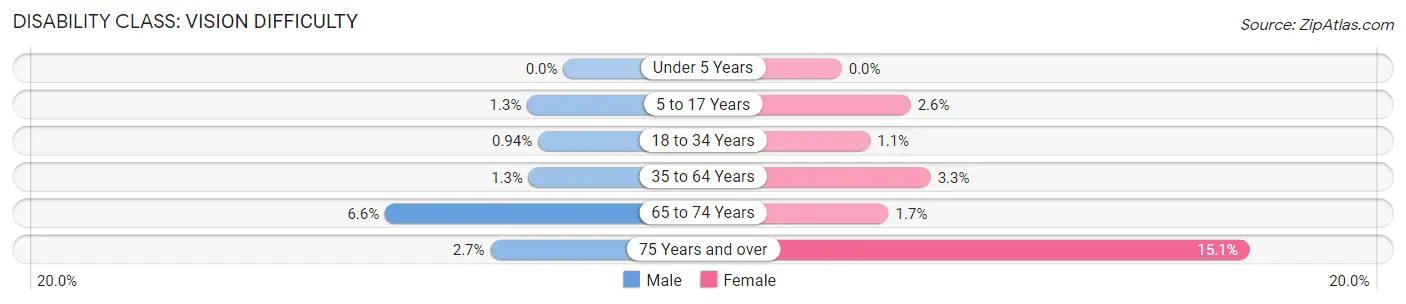
| Age Bracket | Male | Female |
| Under 5 Years | 0 (0.0%) | 0 (0.0%) |
| 5 to 17 Years | 21 (1.3%) | 37 (2.6%) |
| 18 to 34 Years | 16 (0.9%) | 19 (1.1%) |
| 35 to 64 Years | 49 (1.3%) | 122 (3.3%) |
| 65 to 74 Years | 60 (6.6%) | 16 (1.7%) |
| 75 Years and over | 13 (2.7%) | 96 (15.1%) |
Disability Class: Cognitive Difficulty
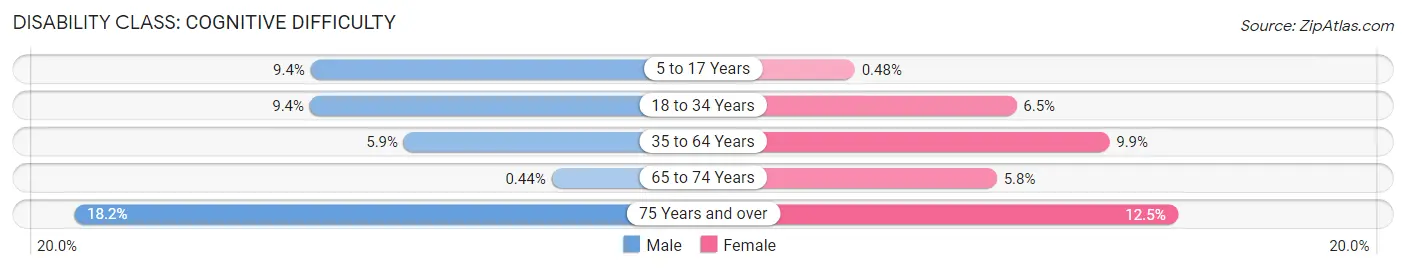
| Age Bracket | Male | Female |
| 5 to 17 Years | 147 (9.4%) | 7 (0.5%) |
| 18 to 34 Years | 160 (9.4%) | 116 (6.5%) |
| 35 to 64 Years | 226 (5.9%) | 367 (9.9%) |
| 65 to 74 Years | 4 (0.4%) | 53 (5.8%) |
| 75 Years and over | 87 (18.2%) | 79 (12.5%) |
Disability Class: Ambulatory Difficulty
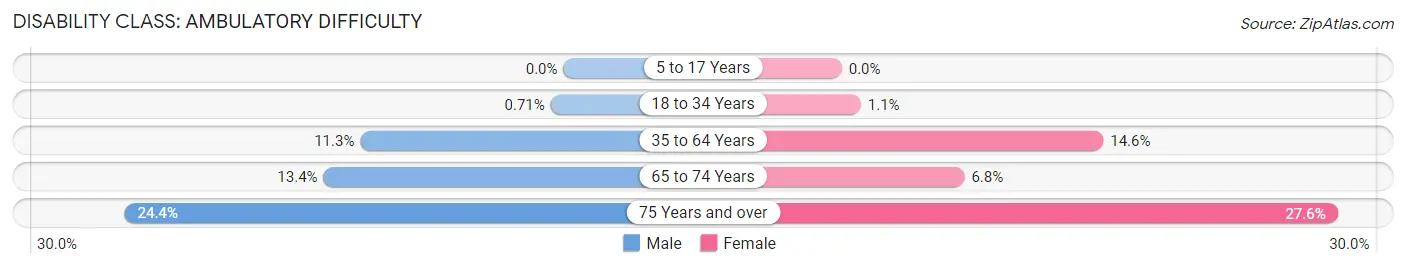
| Age Bracket | Male | Female |
| 5 to 17 Years | 0 (0.0%) | 0 (0.0%) |
| 18 to 34 Years | 12 (0.7%) | 19 (1.1%) |
| 35 to 64 Years | 432 (11.3%) | 538 (14.6%) |
| 65 to 74 Years | 121 (13.4%) | 63 (6.8%) |
| 75 Years and over | 117 (24.4%) | 175 (27.6%) |
Disability Class: Self-Care Difficulty
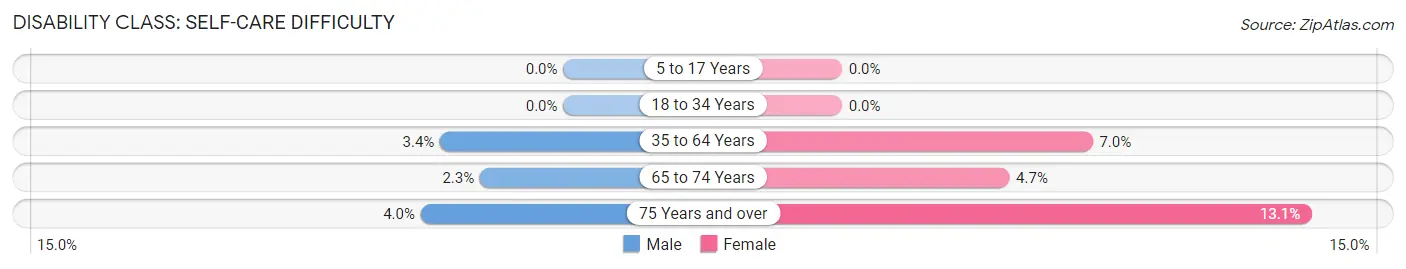
| Age Bracket | Male | Female |
| 5 to 17 Years | 0 (0.0%) | 0 (0.0%) |
| 18 to 34 Years | 0 (0.0%) | 0 (0.0%) |
| 35 to 64 Years | 131 (3.4%) | 258 (7.0%) |
| 65 to 74 Years | 21 (2.3%) | 43 (4.7%) |
| 75 Years and over | 19 (4.0%) | 83 (13.1%) |
Technology Access in Brantley County
Computing Device Access in Brantley County
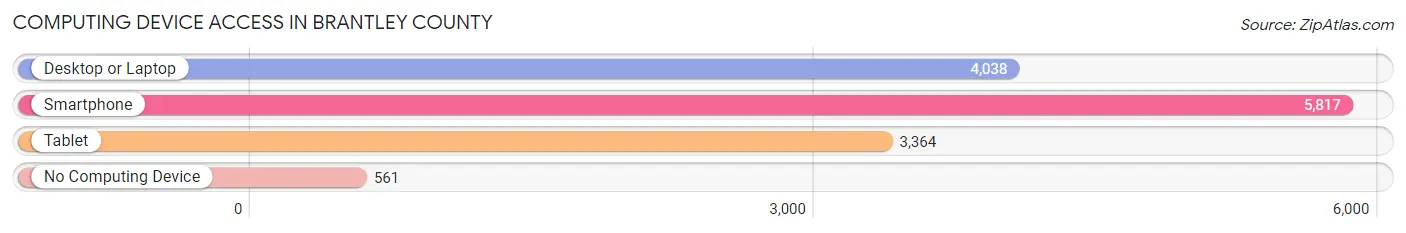
| Device Type | # Households | % Households |
| Desktop or Laptop | 4,038 | 60.7% |
| Smartphone | 5,817 | 87.5% |
| Tablet | 3,364 | 50.6% |
| No Computing Device | 561 | 8.4% |
| Total | 6,649 | 100.0% |
Internet Access in Brantley County
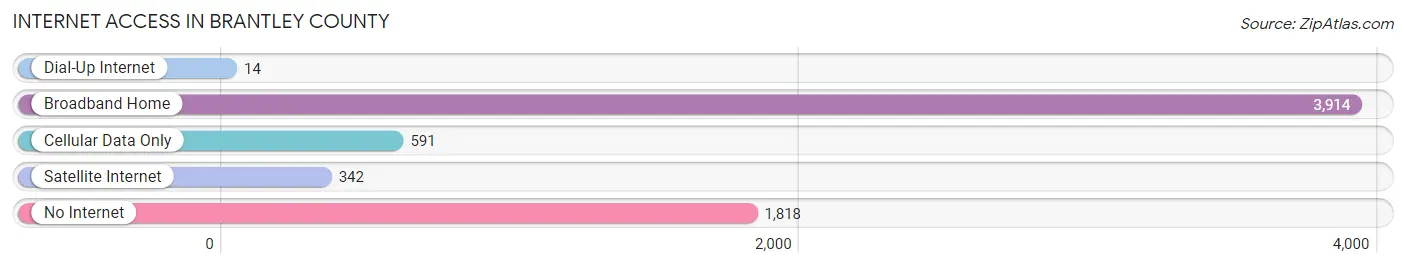
| Internet Type | # Households | % Households |
| Dial-Up Internet | 14 | 0.2% |
| Broadband Home | 3,914 | 58.9% |
| Cellular Data Only | 591 | 8.9% |
| Satellite Internet | 342 | 5.1% |
| No Internet | 1,818 | 27.3% |
| Total | 6,649 | 100.0% |
Brantley County Summary
Brantley County is a county located in the southeastern corner of the U.S. state of Georgia. As of the 2010 census, the population was 19,444. The county seat is Nahunta. Brantley County is part of the Brunswick, GA Metropolitan Statistical Area.
History
Brantley County was created in 1920 from parts of Charlton, Pierce, and Wayne counties. It was named for Jonathan Brantley, a Revolutionary War soldier and a member of the Georgia General Assembly.
Geography
Brantley County is located in the southeastern corner of Georgia, with the Atlantic Ocean to the east. It is bordered by Charlton County to the north, Camden County to the east, Glynn County to the south, and Ware and Pierce counties to the west. The county has a total area of 545 square miles, of which 541 square miles is land and 4.2 square miles (0.8%) is water.
The majority of the county is located in the Satilla River sub-basin of the St. Marys-Satilla River basin, with just the northeastern corner of the county located in the Cumberland-St. Simons Sound sub-basin of the same St. Marys-Satilla River basin.
Economy
Brantley County's economy is largely based on agriculture and timber. The county is home to several large timber companies, including Rayonier, International Paper, and Georgia-Pacific. The county also has a large poultry industry, with several large poultry processing plants located in the county.
The county also has a growing tourism industry, with several popular attractions, including the Okefenokee Swamp, the Crooked River State Park, and the Hofwyl-Broadfield Plantation.
Demographics
As of the 2010 United States Census, there were 19,444 people, 7,541 households, and 5,541 families residing in the county. The population density was 36.0 inhabitants per square mile (13.9/km2). There were 8,845 housing units at an average density of 16.3 per square mile (6.3/km2). The racial makeup of the county was 79.2% white, 17.7% black or African American, 0.7% Asian, 0.3% American Indian, 0.9% from other races, and 1.2% from two or more races. Those of Hispanic or Latino origin made up 2.2% of the population.
In terms of ancestry, 16.2% were American, 11.2% were English, 10.2% were Irish, and 8.2% were German.
The median income for a household in the county was $35,945 and the median income for a family was $43,945. Males had a median income of $32,945 versus $25,945 for females. The per capita income for the county was $17,945. About 14.2% of families and 17.2% of the population were below the poverty line, including 24.2% of those under age 18 and 14.2% of those age 65 or over.
Common Questions
What is Per Capita Income in Brantley County?
Per Capita income in Brantley County is $22,767.
What is the Median Family Income in Brantley County?
Median Family Income in Brantley County is $60,170.
What is the Median Household income in Brantley County?
Median Household Income in Brantley County is $40,166.
What is Income or Wage Gap in Brantley County?
Income or Wage Gap in Brantley County is 31.6%.
Women in Brantley County earn 68.4 cents for every dollar earned by a man.
What is Family Income Deficit in Brantley County?
Family Income Deficit in Brantley County is $11,497.
Families that are below poverty line in Brantley County earn $11,497 less on average than the poverty threshold level.
What is Inequality or Gini Index in Brantley County?
Inequality or Gini Index in Brantley County is 0.45.
What is the Total Population of Brantley County?
Total Population of Brantley County is 18,105.
What is the Total Male Population of Brantley County?
Total Male Population of Brantley County is 8,970.
What is the Total Female Population of Brantley County?
Total Female Population of Brantley County is 9,135.
What is the Ratio of Males per 100 Females in Brantley County?
There are 98.19 Males per 100 Females in Brantley County.
What is the Ratio of Females per 100 Males in Brantley County?
There are 101.84 Females per 100 Males in Brantley County.
What is the Median Population Age in Brantley County?
Median Population Age in Brantley County is 40.2 Years.
What is the Average Family Size in Brantley County
Average Family Size in Brantley County is 3.7 People.
What is the Average Household Size in Brantley County
Average Household Size in Brantley County is 2.7 People.
How Large is the Labor Force in Brantley County?
There are 7,233 People in the Labor Forcein in Brantley County.
What is the Percentage of People in the Labor Force in Brantley County?
50.3% of People are in the Labor Force in Brantley County.
What is the Unemployment Rate in Brantley County?
Unemployment Rate in Brantley County is 3.3%.