Bleckley County, GA Map & Demographics
Bleckley County Map
Bleckley County Overview
$28,207
PER CAPITA INCOME
$62,701
AVG FAMILY INCOME
$56,021
AVG HOUSEHOLD INCOME
30.5%
WAGE / INCOME GAP [ % ]
69.5¢/ $1
WAGE / INCOME GAP [ $ ]
0.47
INEQUALITY / GINI INDEX
12,413
TOTAL POPULATION
6,042
MALE POPULATION
6,371
FEMALE POPULATION
94.84
MALES / 100 FEMALES
105.45
FEMALES / 100 MALES
37.7
MEDIAN AGE
3.1
AVG FAMILY SIZE
2.6
AVG HOUSEHOLD SIZE
5,338
LABOR FORCE [ PEOPLE ]
51.3%
PERCENT IN LABOR FORCE
6.1%
UNEMPLOYMENT RATE
Bleckley County Area Codes
Income in Bleckley County
Income Overview in Bleckley County
Per Capita Income in Bleckley County is $28,207, while median incomes of families and households are $62,701 and $56,021 respectively.
| Characteristic | Number | Measure |
| Per Capita Income | 12,413 | $28,207 |
| Median Family Income | 3,101 | $62,701 |
| Mean Family Income | 3,101 | $84,092 |
| Median Household Income | 4,223 | $56,021 |
| Mean Household Income | 4,223 | $72,658 |
| Income Deficit | 3,101 | $0 |
| Wage / Income Gap (%) | 12,413 | 30.48% |
| Wage / Income Gap ($) | 12,413 | 69.52¢ per $1 |
| Gini / Inequality Index | 12,413 | 0.47 |
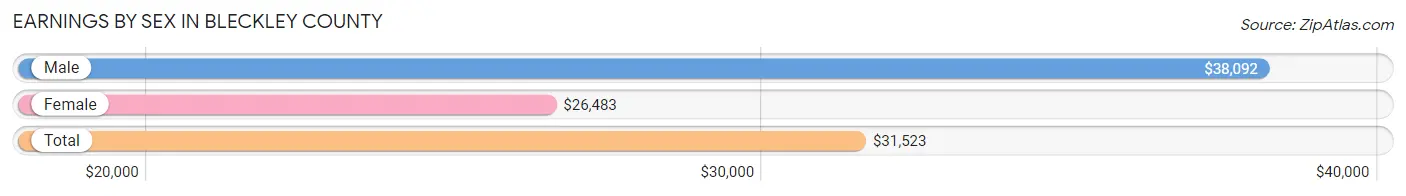
Earnings by Sex in Bleckley County
Average Earnings in Bleckley County are $31,523, $38,092 for men and $26,483 for women, a difference of 30.5%.
| Sex | Number | Average Earnings |
| Male | 2,809 (51.4%) | $38,092 |
| Female | 2,660 (48.6%) | $26,483 |
| Total | 5,469 (100.0%) | $31,523 |
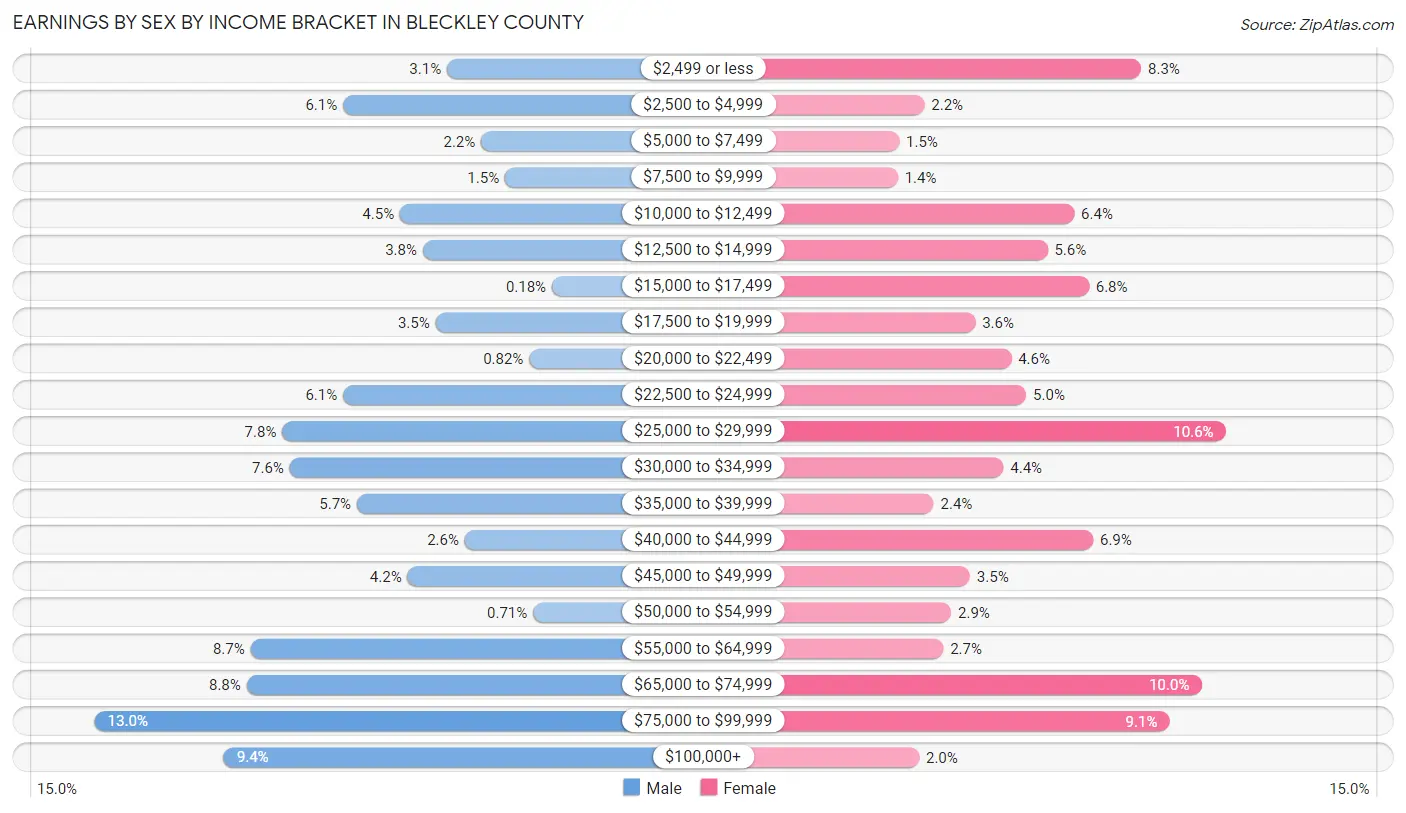
Earnings by Sex by Income Bracket in Bleckley County
The most common earnings brackets in Bleckley County are $75,000 to $99,999 for men (366 | 13.0%) and $25,000 to $29,999 for women (283 | 10.6%).
| Income | Male | Female |
| $2,499 or less | 88 (3.1%) | 220 (8.3%) |
| $2,500 to $4,999 | 170 (6.0%) | 58 (2.2%) |
| $5,000 to $7,499 | 61 (2.2%) | 39 (1.5%) |
| $7,500 to $9,999 | 42 (1.5%) | 38 (1.4%) |
| $10,000 to $12,499 | 125 (4.4%) | 170 (6.4%) |
| $12,500 to $14,999 | 107 (3.8%) | 150 (5.6%) |
| $15,000 to $17,499 | 5 (0.2%) | 181 (6.8%) |
| $17,500 to $19,999 | 97 (3.5%) | 96 (3.6%) |
| $20,000 to $22,499 | 23 (0.8%) | 123 (4.6%) |
| $22,500 to $24,999 | 170 (6.0%) | 134 (5.0%) |
| $25,000 to $29,999 | 218 (7.8%) | 283 (10.6%) |
| $30,000 to $34,999 | 212 (7.5%) | 117 (4.4%) |
| $35,000 to $39,999 | 159 (5.7%) | 65 (2.4%) |
| $40,000 to $44,999 | 74 (2.6%) | 184 (6.9%) |
| $45,000 to $49,999 | 119 (4.2%) | 92 (3.5%) |
| $50,000 to $54,999 | 20 (0.7%) | 78 (2.9%) |
| $55,000 to $64,999 | 243 (8.6%) | 72 (2.7%) |
| $65,000 to $74,999 | 246 (8.8%) | 265 (10.0%) |
| $75,000 to $99,999 | 366 (13.0%) | 241 (9.1%) |
| $100,000+ | 264 (9.4%) | 54 (2.0%) |
| Total | 2,809 (100.0%) | 2,660 (100.0%) |
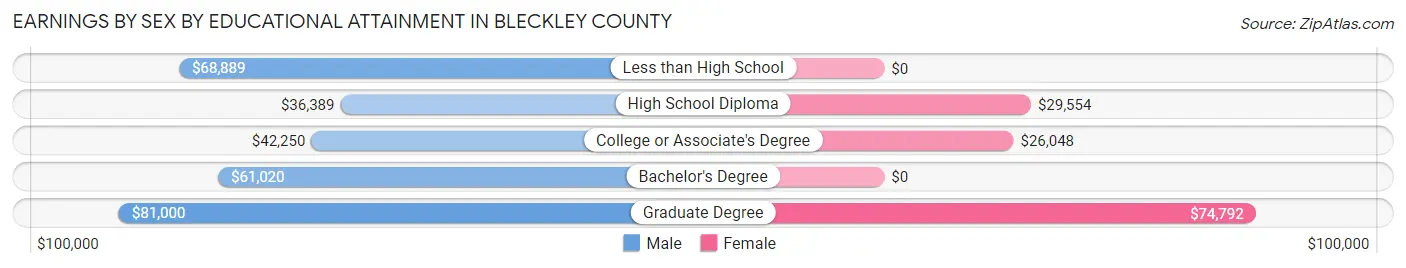
Earnings by Sex by Educational Attainment in Bleckley County
Average earnings in Bleckley County are $49,771 for men and $29,154 for women, a difference of 41.4%. Men with an educational attainment of graduate degree enjoy the highest average annual earnings of $81,000, while those with high school diploma education earn the least with $36,389. Women with an educational attainment of graduate degree earn the most with the average annual earnings of $74,792, while those with college or associate's degree education have the smallest earnings of $26,048.
| Educational Attainment | Male Income | Female Income |
| Less than High School | $68,889 | $0 |
| High School Diploma | $36,389 | $29,554 |
| College or Associate's Degree | $42,250 | $26,048 |
| Bachelor's Degree | $61,020 | $0 |
| Graduate Degree | $81,000 | $74,792 |
| Total | $49,771 | $29,154 |
Family Income in Bleckley County
Family Income Brackets in Bleckley County
According to the Bleckley County family income data, there are 595 families falling into the $50,000 to $74,999 income range, which is the most common income bracket and makes up 19.2% of all families. Conversely, the $200,000+ income bracket is the least frequent group with only 127 families (4.1%) belonging to this category.
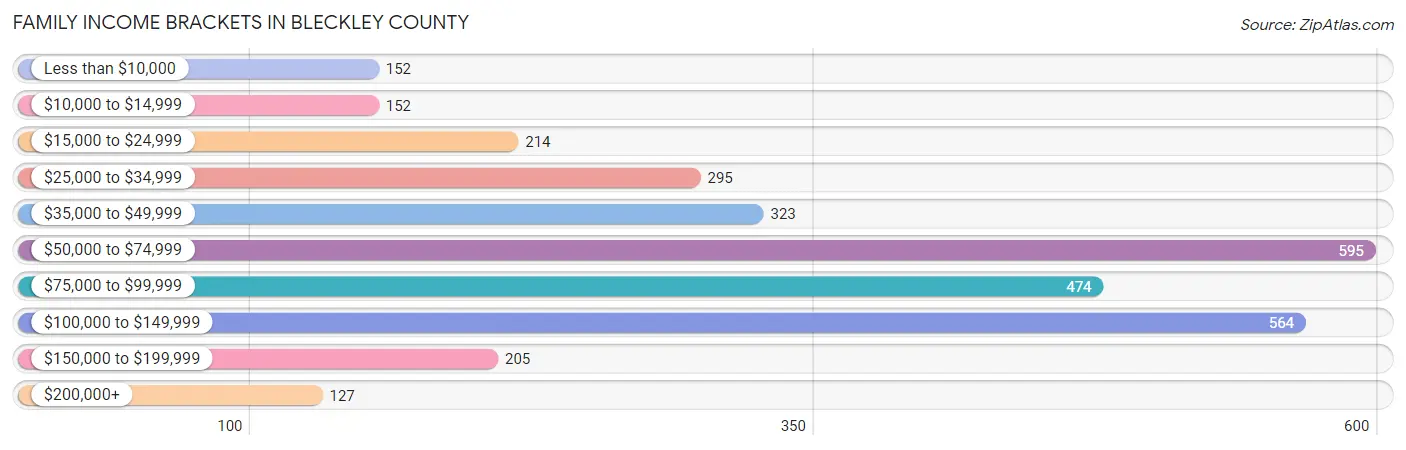
| Income Bracket | # Families | % Families |
| Less than $10,000 | 152 | 4.9% |
| $10,000 to $14,999 | 152 | 4.9% |
| $15,000 to $24,999 | 214 | 6.9% |
| $25,000 to $34,999 | 295 | 9.5% |
| $35,000 to $49,999 | 323 | 10.4% |
| $50,000 to $74,999 | 595 | 19.2% |
| $75,000 to $99,999 | 474 | 15.3% |
| $100,000 to $149,999 | 564 | 18.2% |
| $150,000 to $199,999 | 205 | 6.6% |
| $200,000+ | 127 | 4.1% |
Family Income by Famaliy Size in Bleckley County
3-person families (553 | 17.8%) account for the highest median family income in Bleckley County with $90,625 per family, while 3-person families (553 | 17.8%) have the highest median income of $30,208 per family member.
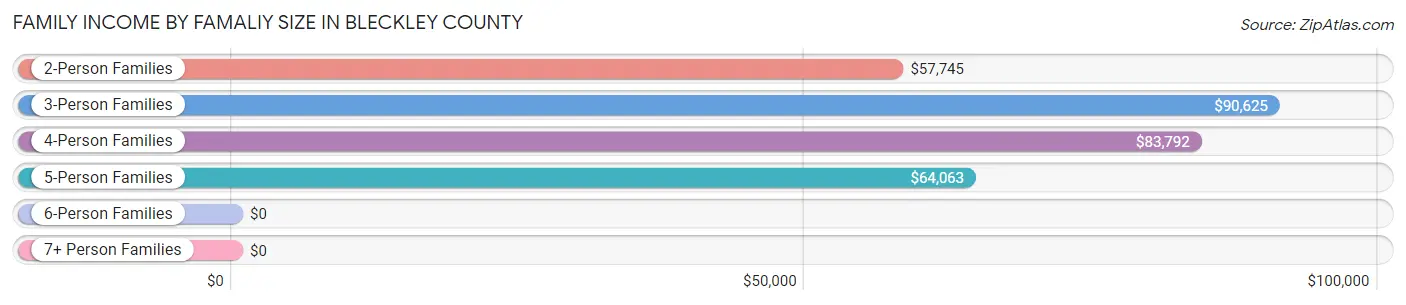
| Income Bracket | # Families | Median Income |
| 2-Person Families | 1,558 (50.2%) | $57,745 |
| 3-Person Families | 553 (17.8%) | $90,625 |
| 4-Person Families | 689 (22.2%) | $83,792 |
| 5-Person Families | 220 (7.1%) | $64,063 |
| 6-Person Families | 26 (0.8%) | $0 |
| 7+ Person Families | 55 (1.8%) | $0 |
| Total | 3,101 (100.0%) | $62,701 |
Family Income by Number of Earners in Bleckley County
The median family income in Bleckley County is $62,701, with families comprising 3+ earners (369) having the highest median family income of $143,894, while families with no earners (713) have the lowest median family income of $31,754, accounting for 11.9% and 23.0% of families, respectively.
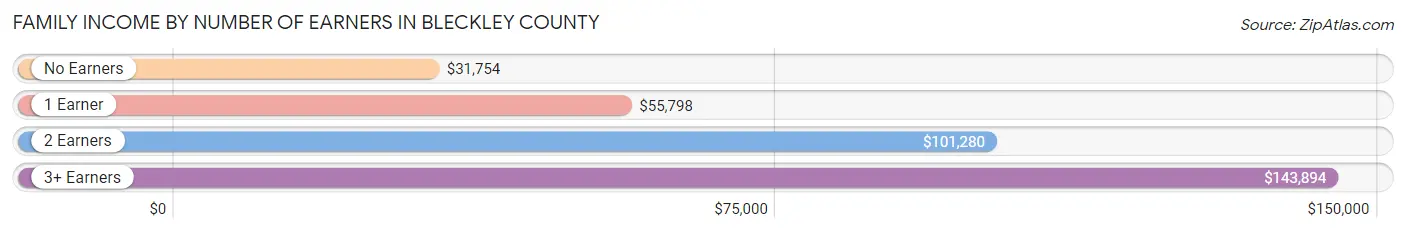
| Number of Earners | # Families | Median Income |
| No Earners | 713 (23.0%) | $31,754 |
| 1 Earner | 1,175 (37.9%) | $55,798 |
| 2 Earners | 844 (27.2%) | $101,280 |
| 3+ Earners | 369 (11.9%) | $143,894 |
| Total | 3,101 (100.0%) | $62,701 |
Household Income in Bleckley County
Household Income Brackets in Bleckley County
With 680 households falling in the category, the $50,000 to $74,999 income range is the most frequent in Bleckley County, accounting for 16.1% of all households. In contrast, only 148 households (3.5%) fall into the $200,000+ income bracket, making it the least populous group.
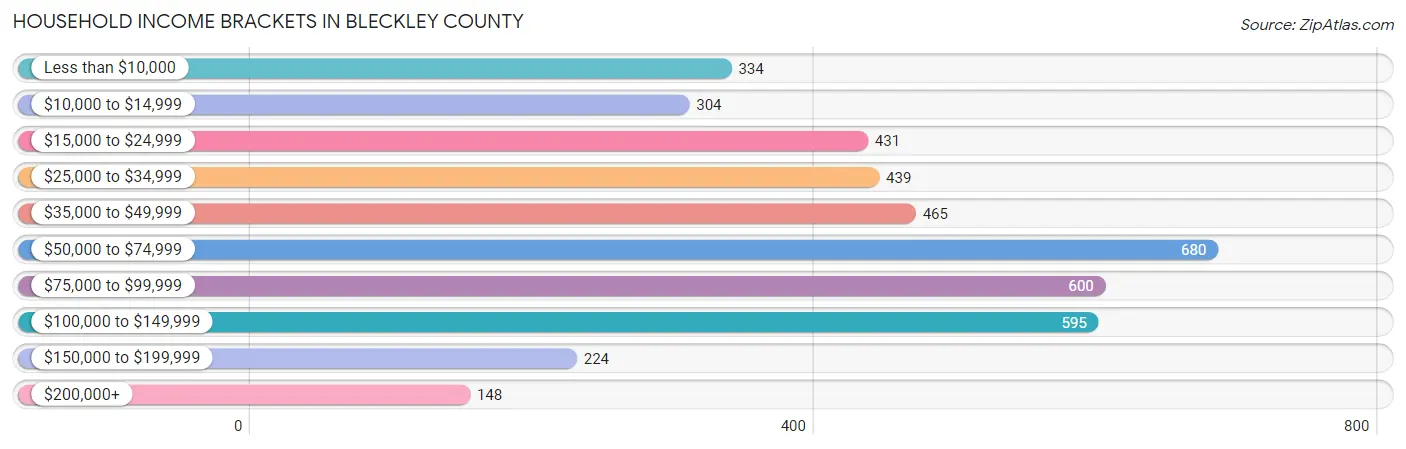
| Income Bracket | # Households | % Households |
| Less than $10,000 | 334 | 7.9% |
| $10,000 to $14,999 | 304 | 7.2% |
| $15,000 to $24,999 | 431 | 10.2% |
| $25,000 to $34,999 | 439 | 10.4% |
| $35,000 to $49,999 | 465 | 11.0% |
| $50,000 to $74,999 | 680 | 16.1% |
| $75,000 to $99,999 | 600 | 14.2% |
| $100,000 to $149,999 | 595 | 14.1% |
| $150,000 to $199,999 | 224 | 5.3% |
| $200,000+ | 148 | 3.5% |
Household Income by Householder Age in Bleckley County
The median household income in Bleckley County is $56,021, with the highest median household income of $66,136 found in the 45 to 64 years age bracket for the primary householder. A total of 1,398 households (33.1%) fall into this category. Meanwhile, the 15 to 24 years age bracket for the primary householder has the lowest median household income of $19,402, with 120 households (2.8%) in this group.
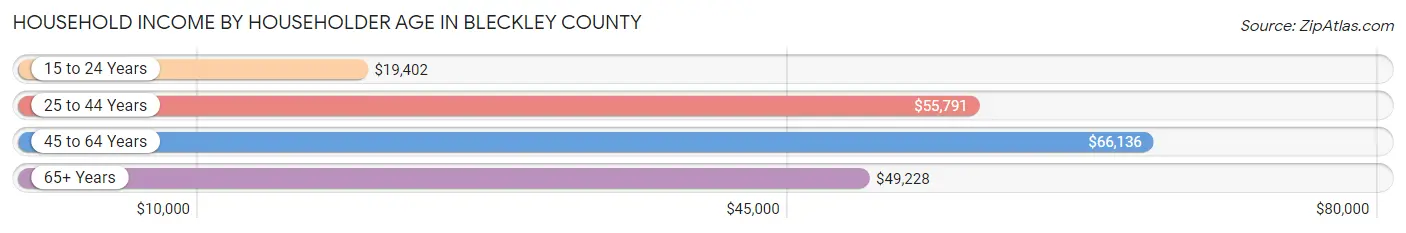
| Income Bracket | # Households | Median Income |
| 15 to 24 Years | 120 (2.8%) | $19,402 |
| 25 to 44 Years | 1,317 (31.2%) | $55,791 |
| 45 to 64 Years | 1,398 (33.1%) | $66,136 |
| 65+ Years | 1,388 (32.9%) | $49,228 |
| Total | 4,223 (100.0%) | $56,021 |
Poverty in Bleckley County
Income Below Poverty by Sex and Age in Bleckley County
With 15.4% poverty level for males and 18.6% for females among the residents of Bleckley County, 15 year old males and 18 to 24 year old females are the most vulnerable to poverty, with 31 males (58.5%) and 194 females (37.4%) in their respective age groups living below the poverty level.
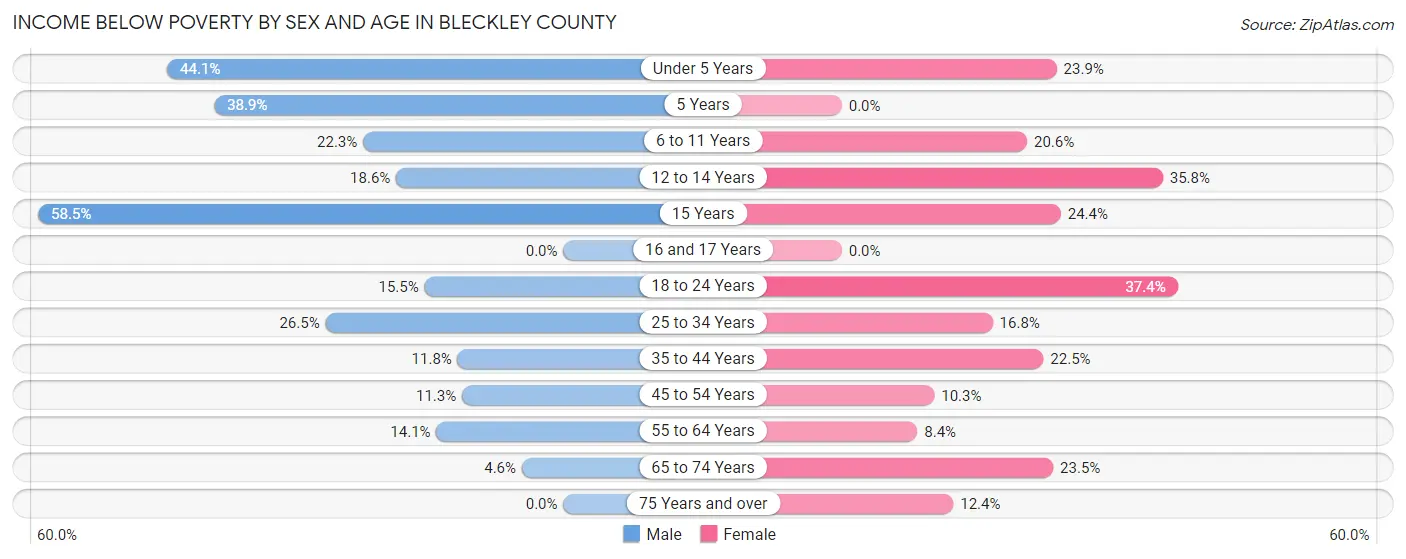
| Age Bracket | Male | Female |
| Under 5 Years | 120 (44.1%) | 84 (23.9%) |
| 5 Years | 28 (38.9%) | 0 (0.0%) |
| 6 to 11 Years | 95 (22.3%) | 78 (20.6%) |
| 12 to 14 Years | 27 (18.6%) | 79 (35.7%) |
| 15 Years | 31 (58.5%) | 10 (24.4%) |
| 16 and 17 Years | 0 (0.0%) | 0 (0.0%) |
| 18 to 24 Years | 77 (15.5%) | 194 (37.4%) |
| 25 to 34 Years | 160 (26.5%) | 130 (16.8%) |
| 35 to 44 Years | 83 (11.8%) | 143 (22.5%) |
| 45 to 54 Years | 81 (11.3%) | 73 (10.3%) |
| 55 to 64 Years | 112 (14.1%) | 75 (8.4%) |
| 65 to 74 Years | 23 (4.6%) | 141 (23.5%) |
| 75 Years and over | 0 (0.0%) | 62 (12.4%) |
| Total | 837 (15.4%) | 1,069 (18.6%) |
Income Above Poverty by Sex and Age in Bleckley County
According to the poverty statistics in Bleckley County, males aged 16 and 17 years and females aged 5 years are the age groups that are most secure financially, with 100.0% of males and 100.0% of females in these age groups living above the poverty line.
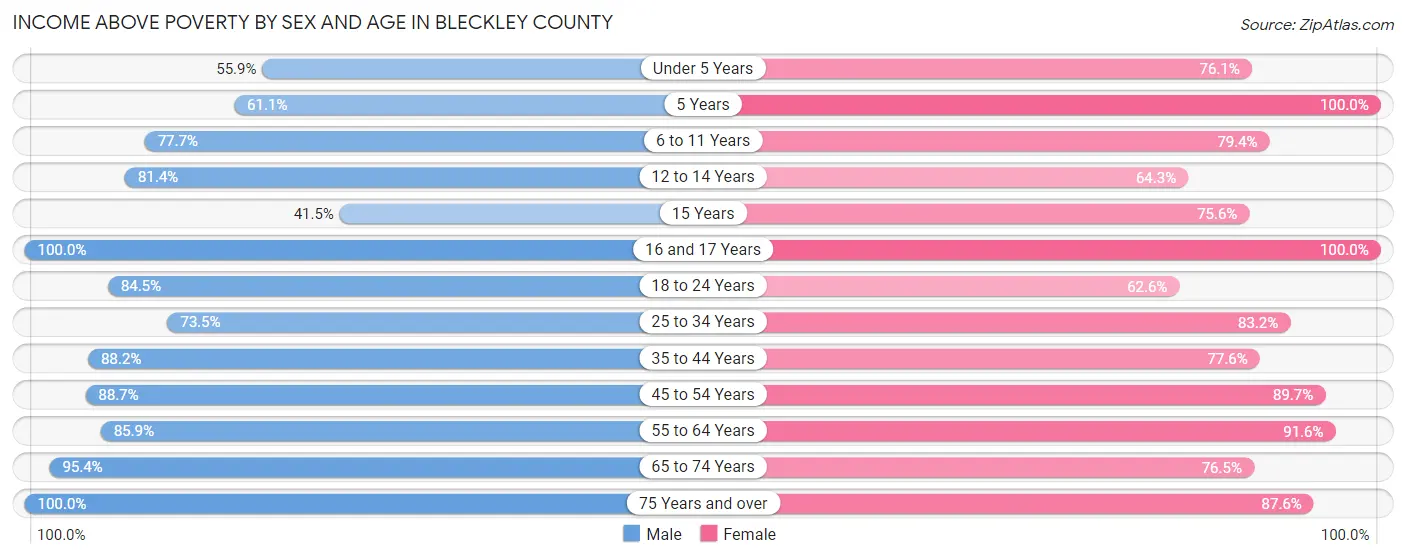
| Age Bracket | Male | Female |
| Under 5 Years | 152 (55.9%) | 267 (76.1%) |
| 5 Years | 44 (61.1%) | 28 (100.0%) |
| 6 to 11 Years | 331 (77.7%) | 300 (79.4%) |
| 12 to 14 Years | 118 (81.4%) | 142 (64.2%) |
| 15 Years | 22 (41.5%) | 31 (75.6%) |
| 16 and 17 Years | 214 (100.0%) | 107 (100.0%) |
| 18 to 24 Years | 421 (84.5%) | 325 (62.6%) |
| 25 to 34 Years | 444 (73.5%) | 644 (83.2%) |
| 35 to 44 Years | 622 (88.2%) | 494 (77.5%) |
| 45 to 54 Years | 637 (88.7%) | 636 (89.7%) |
| 55 to 64 Years | 680 (85.9%) | 817 (91.6%) |
| 65 to 74 Years | 475 (95.4%) | 458 (76.5%) |
| 75 Years and over | 420 (100.0%) | 437 (87.6%) |
| Total | 4,580 (84.6%) | 4,686 (81.4%) |
Income Below Poverty Among Married-Couple Families in Bleckley County
The poverty statistics for married-couple families in Bleckley County show that 7.1% or 153 of the total 2,140 families live below the poverty line. Families with 1 or 2 children have the highest poverty rate of 15.7%, comprising of 110 families. On the other hand, families with 3 or 4 children have the lowest poverty rate of 0.0%, which includes 0 families.
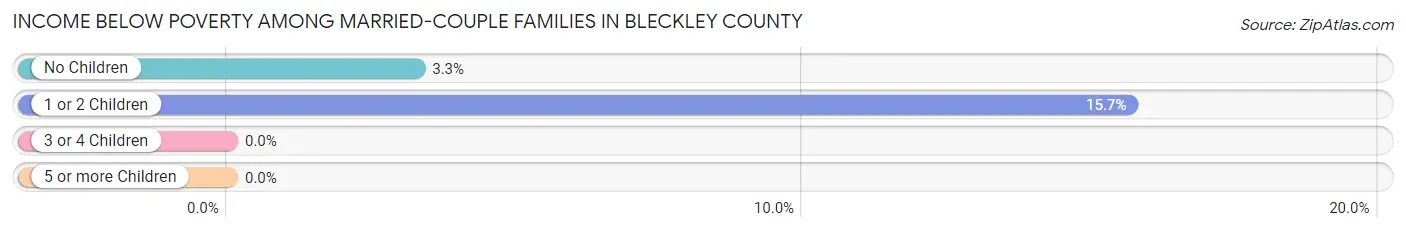
| Children | Above Poverty | Below Poverty |
| No Children | 1,275 (96.7%) | 43 (3.3%) |
| 1 or 2 Children | 592 (84.3%) | 110 (15.7%) |
| 3 or 4 Children | 65 (100.0%) | 0 (0.0%) |
| 5 or more Children | 55 (100.0%) | 0 (0.0%) |
| Total | 1,987 (92.8%) | 153 (7.1%) |
Income Below Poverty Among Single-Parent Households in Bleckley County
According to the poverty data in Bleckley County, 26.6% or 61 single-father households and 28.5% or 209 single-mother households are living below the poverty line. Among single-father households, those with 3 or 4 children have the highest poverty rate, with 61 households (100.0%) experiencing poverty. Likewise, among single-mother households, those with 3 or 4 children have the highest poverty rate, with 51 households (60.7%) falling below the poverty line.
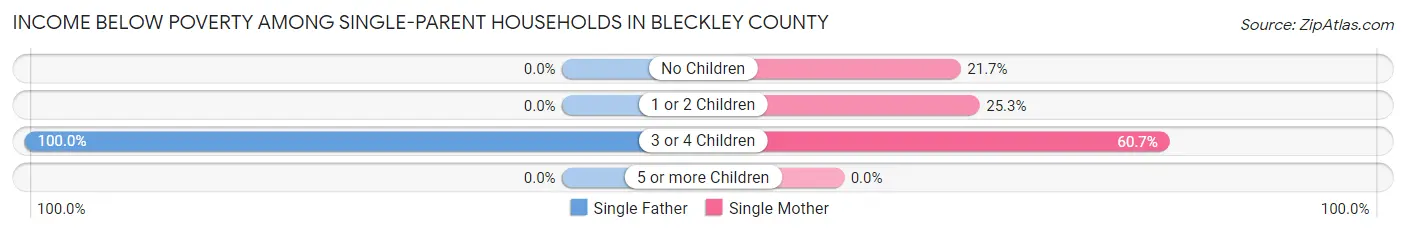
| Children | Single Father | Single Mother |
| No Children | 0 (0.0%) | 35 (21.7%) |
| 1 or 2 Children | 0 (0.0%) | 123 (25.3%) |
| 3 or 4 Children | 61 (100.0%) | 51 (60.7%) |
| 5 or more Children | 0 (0.0%) | 0 (0.0%) |
| Total | 61 (26.6%) | 209 (28.5%) |
Income Below Poverty Among Married-Couple vs Single-Parent Households in Bleckley County
The poverty data for Bleckley County shows that 153 of the married-couple family households (7.1%) and 270 of the single-parent households (28.1%) are living below the poverty level. Within the married-couple family households, those with 1 or 2 children have the highest poverty rate, with 110 households (15.7%) falling below the poverty line. Among the single-parent households, those with 3 or 4 children have the highest poverty rate, with 112 household (77.2%) living below poverty.
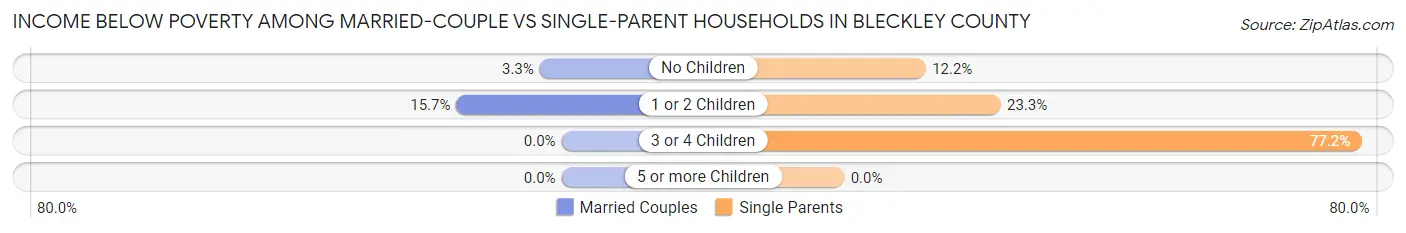
| Children | Married-Couple Families | Single-Parent Households |
| No Children | 43 (3.3%) | 35 (12.1%) |
| 1 or 2 Children | 110 (15.7%) | 123 (23.3%) |
| 3 or 4 Children | 0 (0.0%) | 112 (77.2%) |
| 5 or more Children | 0 (0.0%) | 0 (0.0%) |
| Total | 153 (7.1%) | 270 (28.1%) |
Race in Bleckley County
The most populous races in Bleckley County are White / Caucasian (8,731 | 70.3%), Black / African American (3,259 | 26.3%), and Hispanic or Latino (425 | 3.4%).
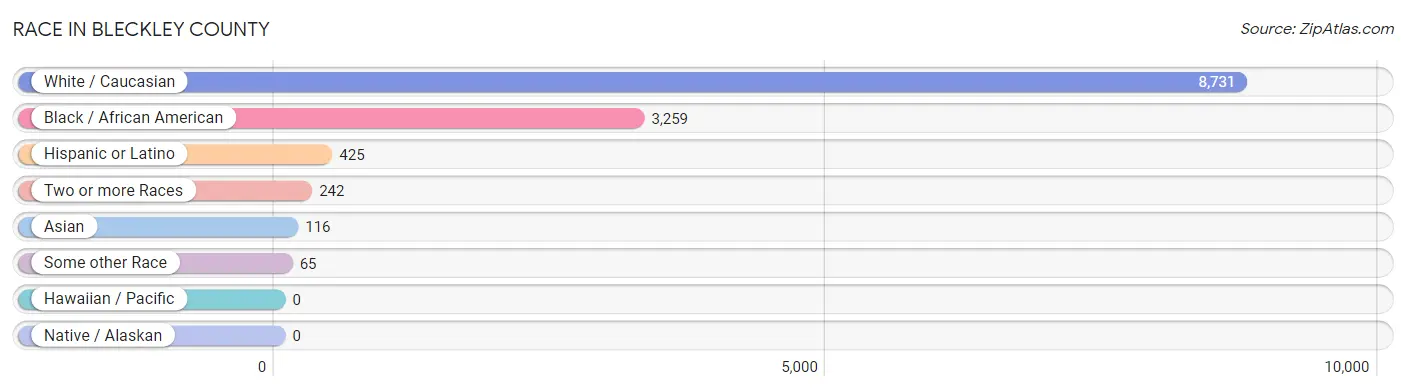
| Race | # Population | % Population |
| Asian | 116 | 0.9% |
| Black / African American | 3,259 | 26.3% |
| Hawaiian / Pacific | 0 | 0.0% |
| Hispanic or Latino | 425 | 3.4% |
| Native / Alaskan | 0 | 0.0% |
| White / Caucasian | 8,731 | 70.3% |
| Two or more Races | 242 | 1.9% |
| Some other Race | 65 | 0.5% |
| Total | 12,413 | 100.0% |
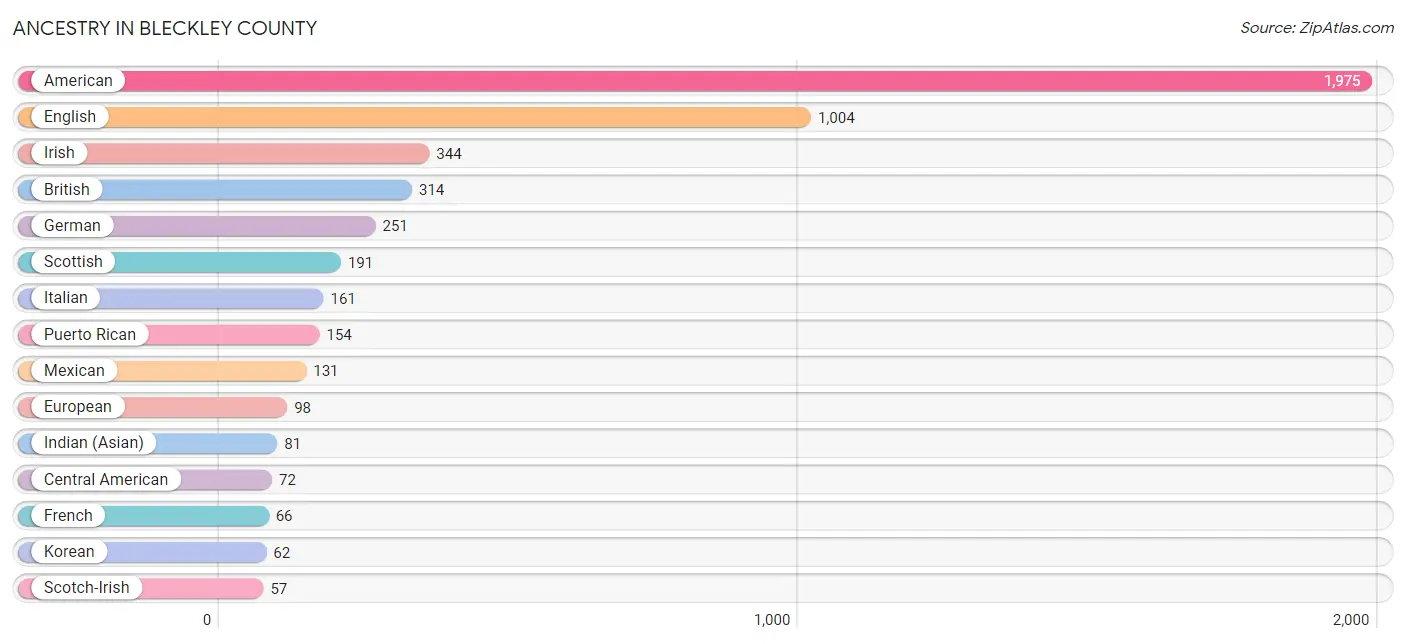
Ancestry in Bleckley County
The most populous ancestries reported in Bleckley County are American (1,975 | 15.9%), English (1,004 | 8.1%), Irish (344 | 2.8%), British (314 | 2.5%), and German (251 | 2.0%), together accounting for 31.3% of all Bleckley County residents.
| Ancestry | # Population | % Population |
| African | 13 | 0.1% |
| American | 1,975 | 15.9% |
| Arab | 25 | 0.2% |
| Austrian | 23 | 0.2% |
| British | 314 | 2.5% |
| British West Indian | 5 | 0.0% |
| Burmese | 1 | 0.0% |
| Canadian | 48 | 0.4% |
| Central American | 72 | 0.6% |
| Cherokee | 9 | 0.1% |
| Colombian | 11 | 0.1% |
| Costa Rican | 25 | 0.2% |
| Cuban | 14 | 0.1% |
| Czech | 5 | 0.0% |
| Dutch | 18 | 0.2% |
| English | 1,004 | 8.1% |
| European | 98 | 0.8% |
| Finnish | 15 | 0.1% |
| French | 66 | 0.5% |
| German | 251 | 2.0% |
| Guatemalan | 37 | 0.3% |
| Haitian | 6 | 0.1% |
| Honduran | 10 | 0.1% |
| Hungarian | 6 | 0.1% |
| Indian (Asian) | 81 | 0.6% |
| Indonesian | 8 | 0.1% |
| Iranian | 6 | 0.1% |
| Irish | 344 | 2.8% |
| Italian | 161 | 1.3% |
| Korean | 62 | 0.5% |
| Lebanese | 25 | 0.2% |
| Mexican | 131 | 1.1% |
| Northern European | 27 | 0.2% |
| Norwegian | 30 | 0.2% |
| Polish | 16 | 0.1% |
| Portuguese | 3 | 0.0% |
| Puerto Rican | 154 | 1.2% |
| Scandinavian | 35 | 0.3% |
| Scotch-Irish | 57 | 0.5% |
| Scottish | 191 | 1.5% |
| Slovak | 9 | 0.1% |
| South American | 11 | 0.1% |
| Spanish | 6 | 0.1% |
| Sri Lankan | 22 | 0.2% |
| Subsaharan African | 13 | 0.1% |
| Welsh | 56 | 0.4% | View All 46 Rows |
Immigrants in Bleckley County
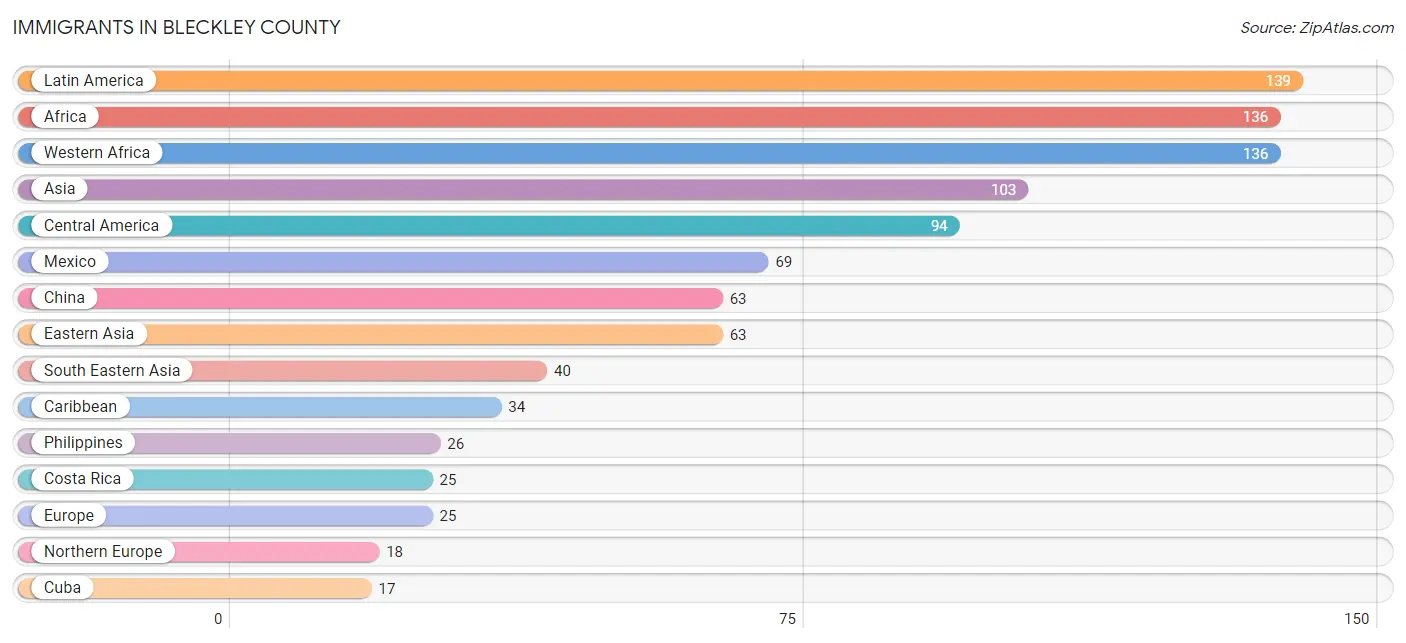
The most numerous immigrant groups reported in Bleckley County came from Latin America (139 | 1.1%), Africa (136 | 1.1%), Western Africa (136 | 1.1%), Asia (103 | 0.8%), and Central America (94 | 0.8%), together accounting for 4.9% of all Bleckley County residents.
| Immigration Origin | # Population | % Population |
| Africa | 136 | 1.1% |
| Asia | 103 | 0.8% |
| Caribbean | 34 | 0.3% |
| Central America | 94 | 0.8% |
| China | 63 | 0.5% |
| Colombia | 11 | 0.1% |
| Costa Rica | 25 | 0.2% |
| Cuba | 17 | 0.1% |
| Eastern Asia | 63 | 0.5% |
| Eastern Europe | 7 | 0.1% |
| Europe | 25 | 0.2% |
| Latin America | 139 | 1.1% |
| Mexico | 69 | 0.6% |
| Nigeria | 7 | 0.1% |
| Northern Europe | 18 | 0.2% |
| Philippines | 26 | 0.2% |
| Poland | 7 | 0.1% |
| South America | 11 | 0.1% |
| South Eastern Asia | 40 | 0.3% |
| Trinidad and Tobago | 17 | 0.1% |
| Vietnam | 6 | 0.1% |
| Western Africa | 136 | 1.1% | View All 22 Rows |
Sex and Age in Bleckley County
Sex and Age in Bleckley County
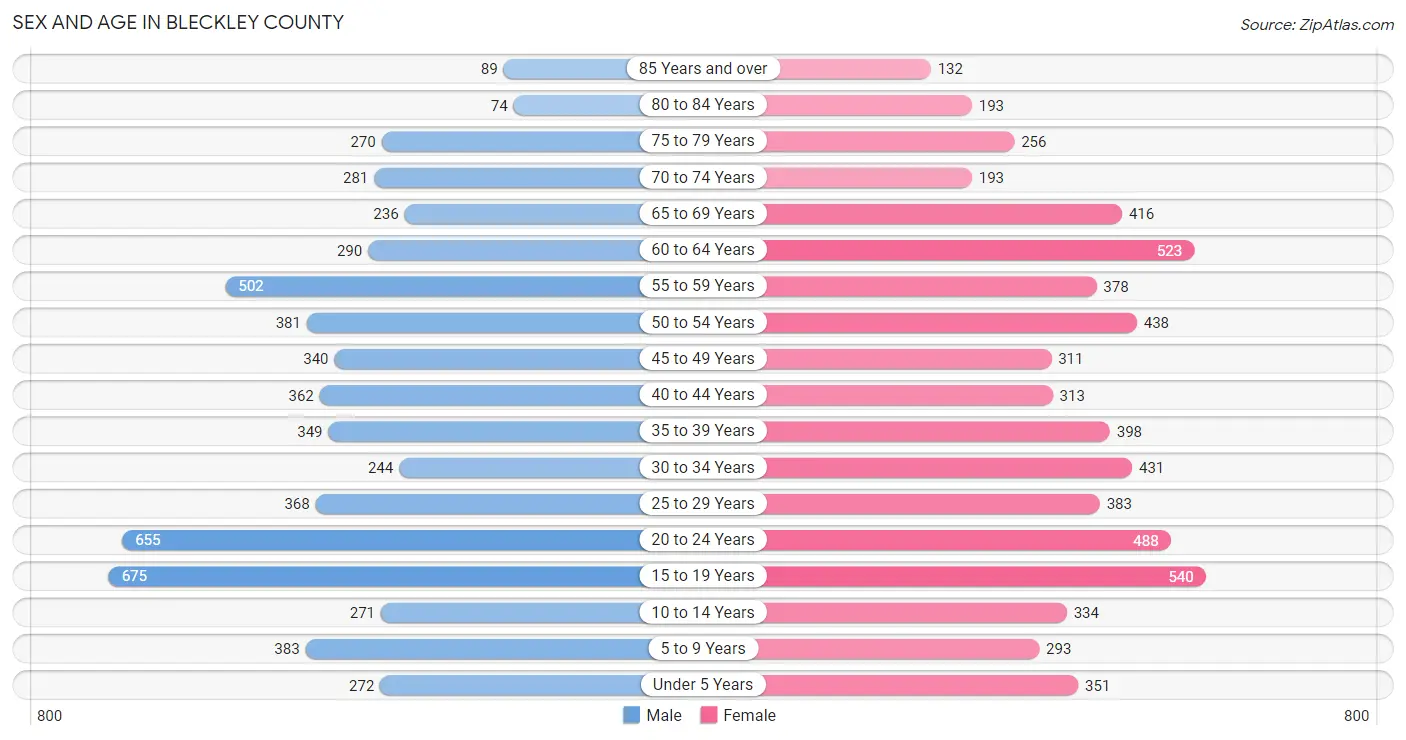
The most populous age groups in Bleckley County are 15 to 19 Years (675 | 11.2%) for men and 15 to 19 Years (540 | 8.5%) for women.
| Age Bracket | Male | Female |
| Under 5 Years | 272 (4.5%) | 351 (5.5%) |
| 5 to 9 Years | 383 (6.3%) | 293 (4.6%) |
| 10 to 14 Years | 271 (4.5%) | 334 (5.2%) |
| 15 to 19 Years | 675 (11.2%) | 540 (8.5%) |
| 20 to 24 Years | 655 (10.8%) | 488 (7.7%) |
| 25 to 29 Years | 368 (6.1%) | 383 (6.0%) |
| 30 to 34 Years | 244 (4.0%) | 431 (6.8%) |
| 35 to 39 Years | 349 (5.8%) | 398 (6.2%) |
| 40 to 44 Years | 362 (6.0%) | 313 (4.9%) |
| 45 to 49 Years | 340 (5.6%) | 311 (4.9%) |
| 50 to 54 Years | 381 (6.3%) | 438 (6.9%) |
| 55 to 59 Years | 502 (8.3%) | 378 (5.9%) |
| 60 to 64 Years | 290 (4.8%) | 523 (8.2%) |
| 65 to 69 Years | 236 (3.9%) | 416 (6.5%) |
| 70 to 74 Years | 281 (4.6%) | 193 (3.0%) |
| 75 to 79 Years | 270 (4.5%) | 256 (4.0%) |
| 80 to 84 Years | 74 (1.2%) | 193 (3.0%) |
| 85 Years and over | 89 (1.5%) | 132 (2.1%) |
| Total | 6,042 (100.0%) | 6,371 (100.0%) |
Families and Households in Bleckley County
Median Family Size in Bleckley County
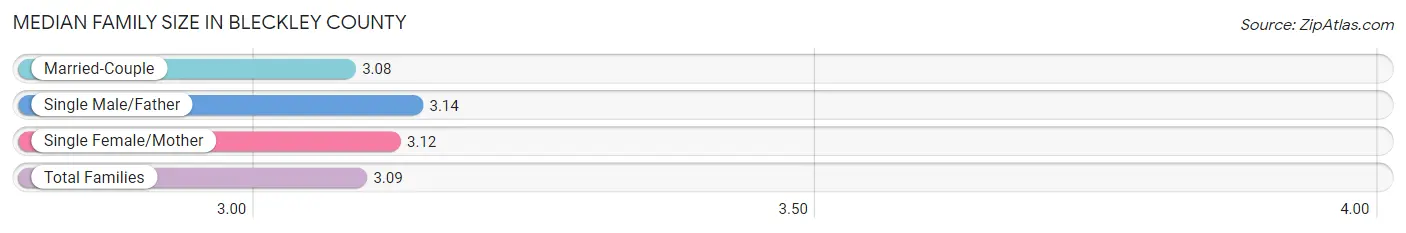
The median family size in Bleckley County is 3.09 persons per family, with single male/father families (229 | 7.4%) accounting for the largest median family size of 3.14 persons per family. On the other hand, married-couple families (2,140 | 69.0%) represent the smallest median family size with 3.08 persons per family.
| Family Type | # Families | Family Size |
| Married-Couple | 2,140 (69.0%) | 3.08 |
| Single Male/Father | 229 (7.4%) | 3.14 |
| Single Female/Mother | 732 (23.6%) | 3.12 |
| Total Families | 3,101 (100.0%) | 3.09 |
Median Household Size in Bleckley County
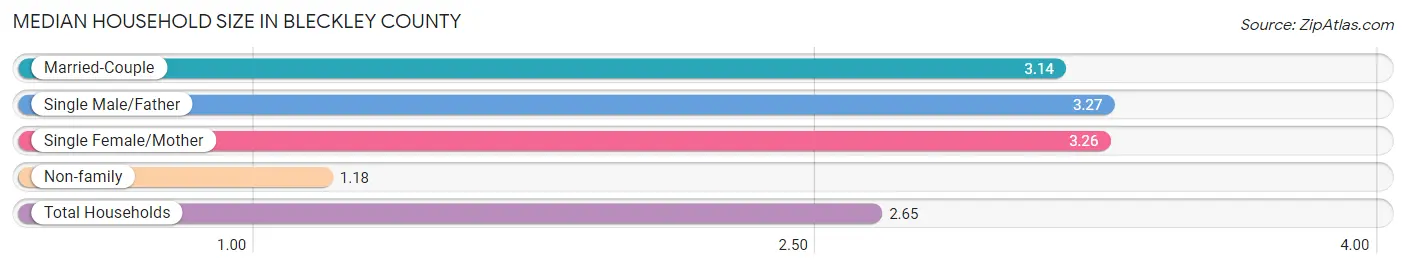
The median household size in Bleckley County is 2.65 persons per household, with single male/father households (229 | 5.4%) accounting for the largest median household size of 3.27 persons per household. non-family households (1,122 | 26.6%) represent the smallest median household size with 1.18 persons per household.
| Household Type | # Households | Household Size |
| Married-Couple | 2,140 (50.7%) | 3.14 |
| Single Male/Father | 229 (5.4%) | 3.27 |
| Single Female/Mother | 732 (17.3%) | 3.26 |
| Non-family | 1,122 (26.6%) | 1.18 |
| Total Households | 4,223 (100.0%) | 2.65 |
Household Size by Marriage Status in Bleckley County
Out of a total of 4,223 households in Bleckley County, 3,101 (73.4%) are family households, while 1,122 (26.6%) are nonfamily households. The most numerous type of family households are 2-person households, comprising 1,532, and the most common type of nonfamily households are 1-person households, comprising 992.
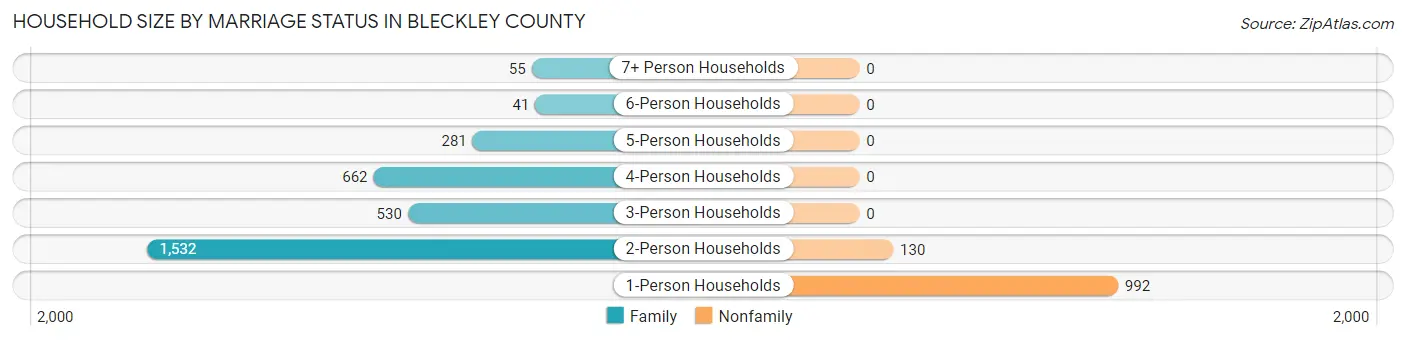
| Household Size | Family Households | Nonfamily Households |
| 1-Person Households | - | 992 (23.5%) |
| 2-Person Households | 1,532 (36.3%) | 130 (3.1%) |
| 3-Person Households | 530 (12.6%) | 0 (0.0%) |
| 4-Person Households | 662 (15.7%) | 0 (0.0%) |
| 5-Person Households | 281 (6.7%) | 0 (0.0%) |
| 6-Person Households | 41 (1.0%) | 0 (0.0%) |
| 7+ Person Households | 55 (1.3%) | 0 (0.0%) |
| Total | 3,101 (73.4%) | 1,122 (26.6%) |
Female Fertility in Bleckley County
Fertility by Age in Bleckley County
Average fertility rate in Bleckley County is 88.0 births per 1,000 women. Women in the age bracket of 35 to 50 years have the highest fertility rate with 107.0 births per 1,000 women. Women in the age bracket of 20 to 34 years acount for 45.0% of all women with births.
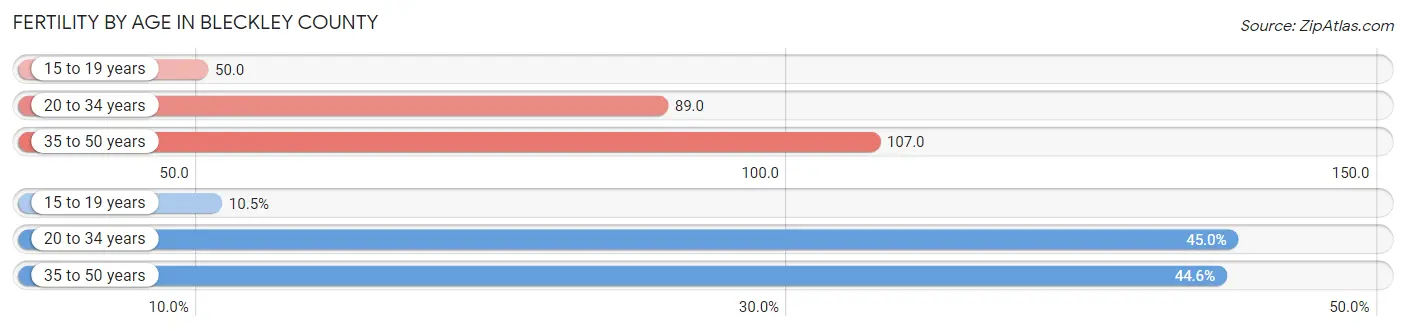
| Age Bracket | Women with Births | Births / 1,000 Women |
| 15 to 19 years | 27 (10.5%) | 50.0 |
| 20 to 34 years | 116 (45.0%) | 89.0 |
| 35 to 50 years | 115 (44.6%) | 107.0 |
| Total | 258 (100.0%) | 88.0 |
Fertility by Age by Marriage Status in Bleckley County
69.4% of women with births (258) in Bleckley County are married. The highest percentage of unmarried women with births falls into 20 to 34 years age bracket with 68.1% of them unmarried at the time of birth, while the lowest percentage of unmarried women with births belong to 15 to 19 years age bracket with 0.0% of them unmarried.
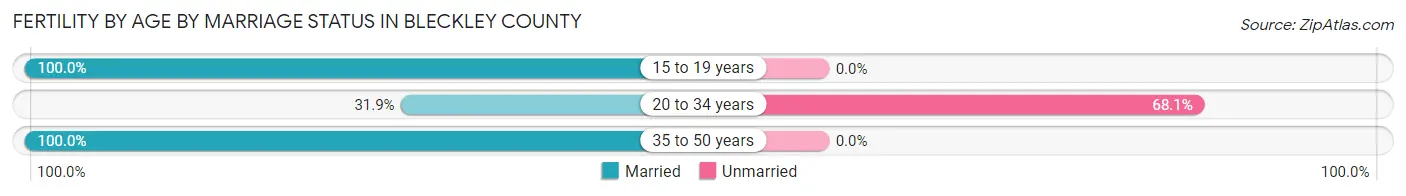
| Age Bracket | Married | Unmarried |
| 15 to 19 years | 27 (100.0%) | 0 (0.0%) |
| 20 to 34 years | 37 (31.9%) | 79 (68.1%) |
| 35 to 50 years | 115 (100.0%) | 0 (0.0%) |
| Total | 179 (69.4%) | 79 (30.6%) |
Fertility by Education in Bleckley County
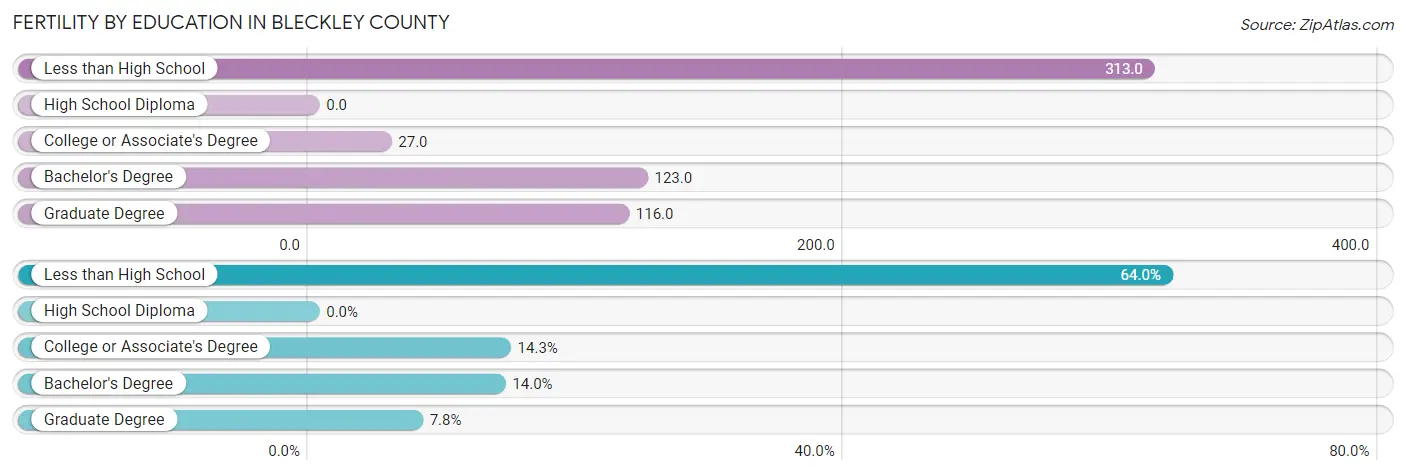
| Educational Attainment | Women with Births | Births / 1,000 Women |
| Less than High School | 165 (63.9%) | 313.0 |
| High School Diploma | 0 (0.0%) | 0.0 |
| College or Associate's Degree | 37 (14.3%) | 27.0 |
| Bachelor's Degree | 36 (14.0%) | 123.0 |
| Graduate Degree | 20 (7.7%) | 116.0 |
| Total | 258 (100.0%) | 88.0 |
Fertility by Education by Marriage Status in Bleckley County
30.6% of women with births in Bleckley County are unmarried. Women with the educational attainment of college or associate's degree are most likely to be married with 100.0% of them married at childbirth, while women with the educational attainment of less than high school are least likely to be married with 47.9% of them unmarried at childbirth.
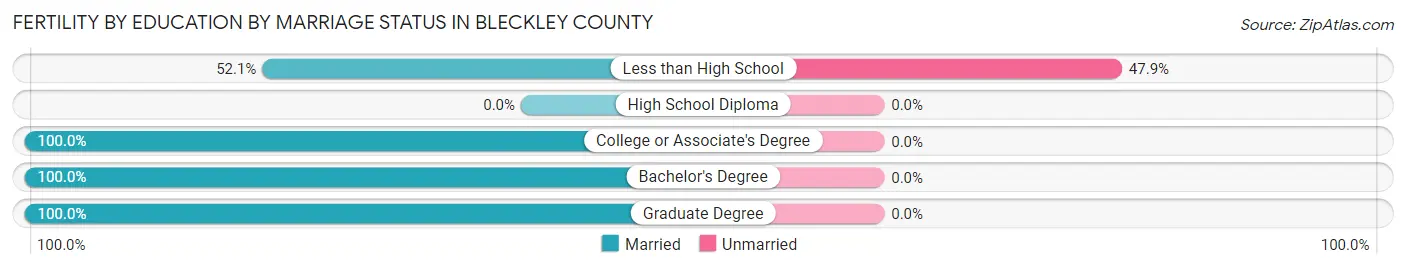
| Educational Attainment | Married | Unmarried |
| Less than High School | 86 (52.1%) | 79 (47.9%) |
| High School Diploma | 0 (0.0%) | 0 (0.0%) |
| College or Associate's Degree | 37 (100.0%) | 0 (0.0%) |
| Bachelor's Degree | 36 (100.0%) | 0 (0.0%) |
| Graduate Degree | 20 (100.0%) | 0 (0.0%) |
| Total | 179 (69.4%) | 79 (30.6%) |
Employment Characteristics in Bleckley County
Employment by Class of Employer in Bleckley County
Among the 4,963 employed individuals in Bleckley County, private company employees (2,649 | 53.4%), federal government employees (831 | 16.7%), and state government employees (615 | 12.4%) make up the most common classes of employment.
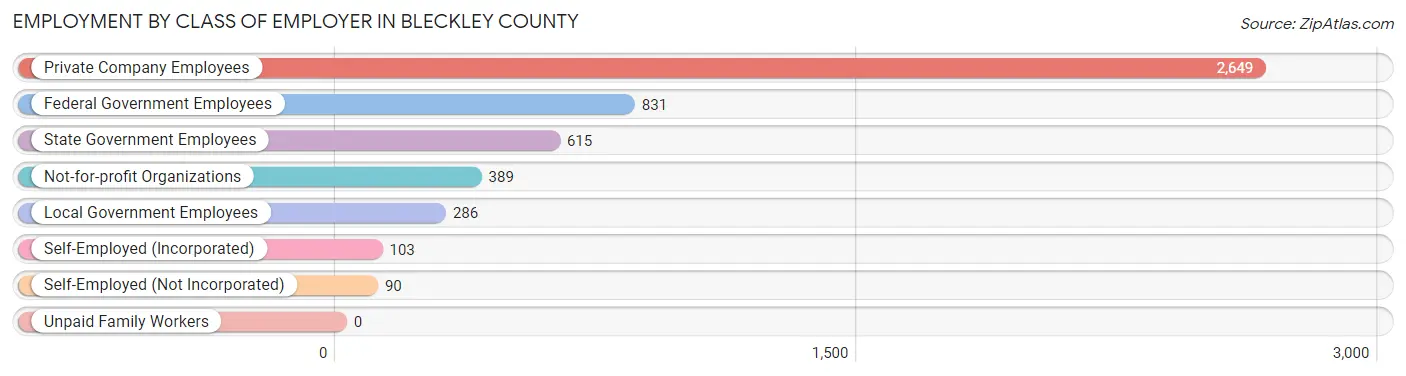
| Employer Class | # Employees | % Employees |
| Private Company Employees | 2,649 | 53.4% |
| Self-Employed (Incorporated) | 103 | 2.1% |
| Self-Employed (Not Incorporated) | 90 | 1.8% |
| Not-for-profit Organizations | 389 | 7.8% |
| Local Government Employees | 286 | 5.8% |
| State Government Employees | 615 | 12.4% |
| Federal Government Employees | 831 | 16.7% |
| Unpaid Family Workers | 0 | 0.0% |
| Total | 4,963 | 100.0% |
Employment Status by Age in Bleckley County
According to the labor force statistics for Bleckley County, out of the total population over 16 years of age (10,406), 51.3% or 5,338 individuals are in the labor force, with 6.1% or 326 of them unemployed. The age group with the highest labor force participation rate is 30 to 34 years, with 84.9% or 573 individuals in the labor force. Within the labor force, the 30 to 34 years age range has the highest percentage of unemployed individuals, with 16.9% or 97 of them being unemployed.
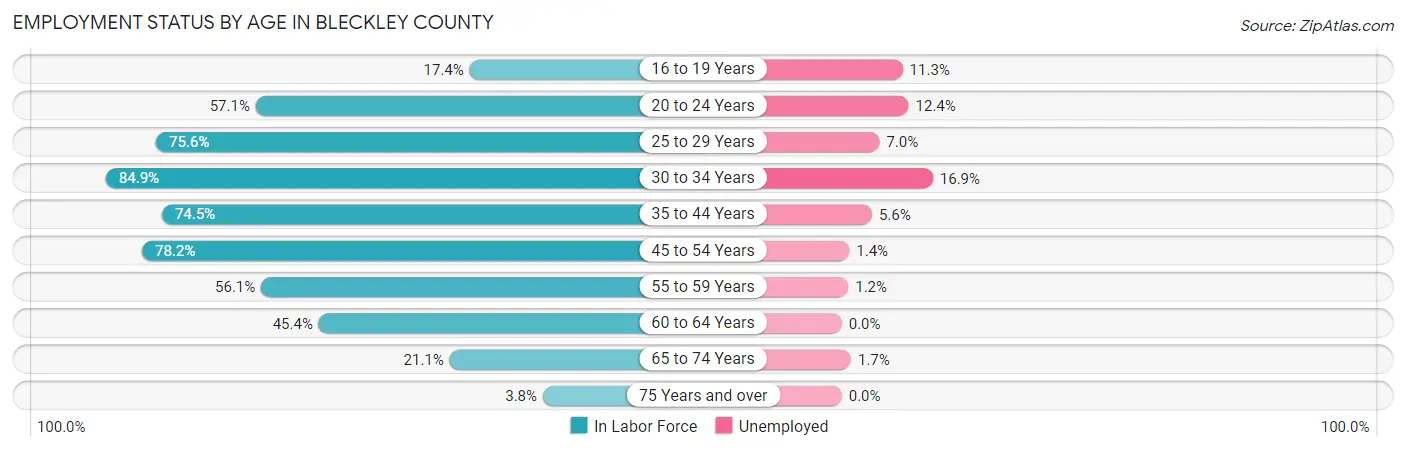
| Age Bracket | In Labor Force | Unemployed |
| 16 to 19 Years | 193 (17.4%) | 22 (11.3%) |
| 20 to 24 Years | 653 (57.1%) | 81 (12.4%) |
| 25 to 29 Years | 568 (75.6%) | 40 (7.0%) |
| 30 to 34 Years | 573 (84.9%) | 97 (16.9%) |
| 35 to 44 Years | 1,059 (74.5%) | 59 (5.6%) |
| 45 to 54 Years | 1,150 (78.2%) | 16 (1.4%) |
| 55 to 59 Years | 494 (56.1%) | 6 (1.2%) |
| 60 to 64 Years | 369 (45.4%) | 0 (0.0%) |
| 65 to 74 Years | 238 (21.1%) | 4 (1.7%) |
| 75 Years and over | 39 (3.8%) | 0 (0.0%) |
| Total | 5,338 (51.3%) | 326 (6.1%) |
Employment Status by Educational Attainment in Bleckley County
According to labor force statistics for Bleckley County, 70.1% of individuals (4,214) out of the total population between 25 and 64 years of age (6,011) are in the labor force, with 5.2% or 219 of them being unemployed. The group with the highest labor force participation rate are those with the educational attainment of bachelor's degree or higher, with 87.4% or 1,002 individuals in the labor force. Within the labor force, individuals with less than high school education have the highest percentage of unemployment, with 35.9% or 75 of them being unemployed.
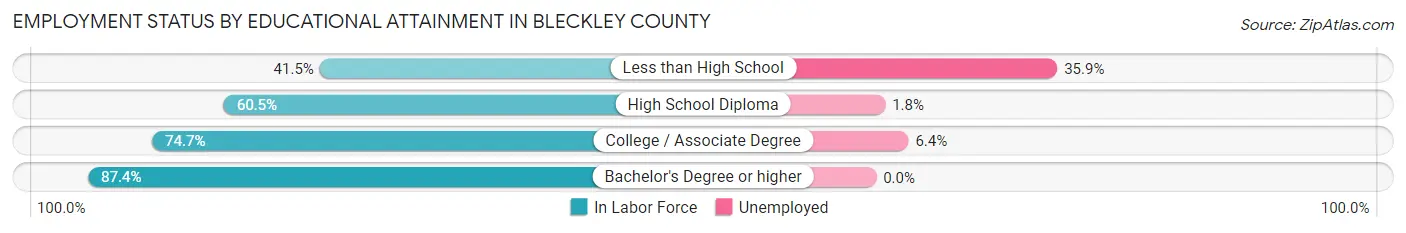
| Educational Attainment | In Labor Force | Unemployed |
| Less than High School | 209 (41.5%) | 181 (35.9%) |
| High School Diploma | 1,083 (60.5%) | 32 (1.8%) |
| College / Associate Degree | 1,920 (74.7%) | 164 (6.4%) |
| Bachelor's Degree or higher | 1,002 (87.4%) | 0 (0.0%) |
| Total | 4,214 (70.1%) | 313 (5.2%) |
Employment Occupations by Sex in Bleckley County
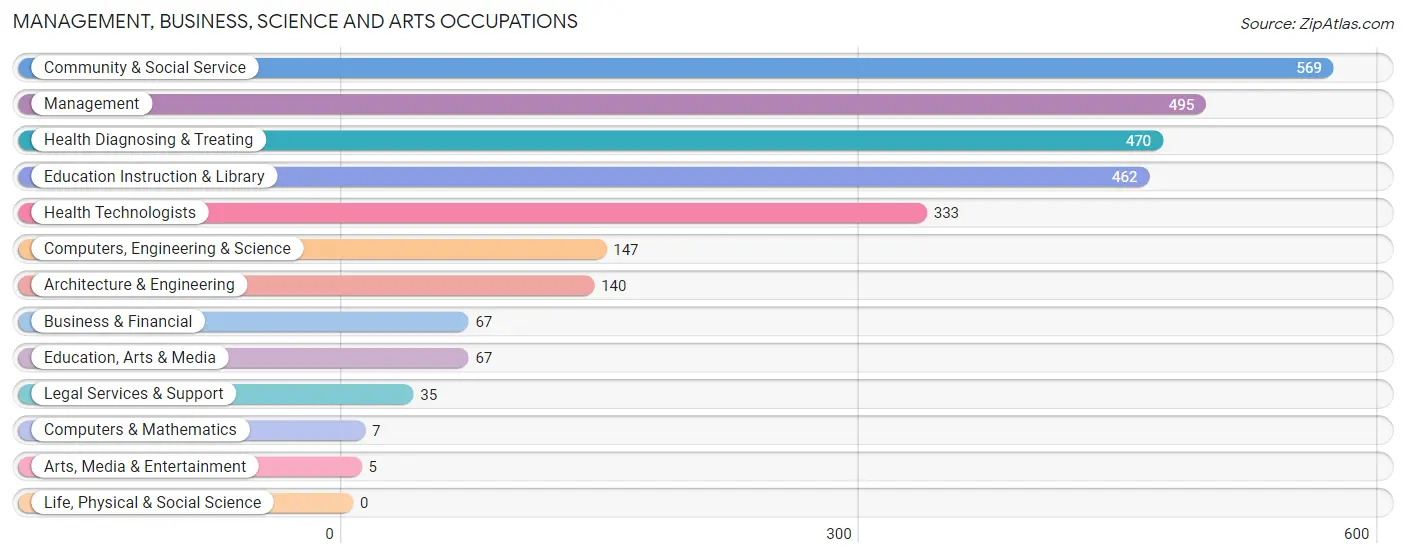
Management, Business, Science and Arts Occupations
The most common Management, Business, Science and Arts occupations in Bleckley County are Community & Social Service (569 | 11.4%), Management (495 | 9.9%), Health Diagnosing & Treating (470 | 9.4%), Education Instruction & Library (462 | 9.2%), and Health Technologists (333 | 6.7%).
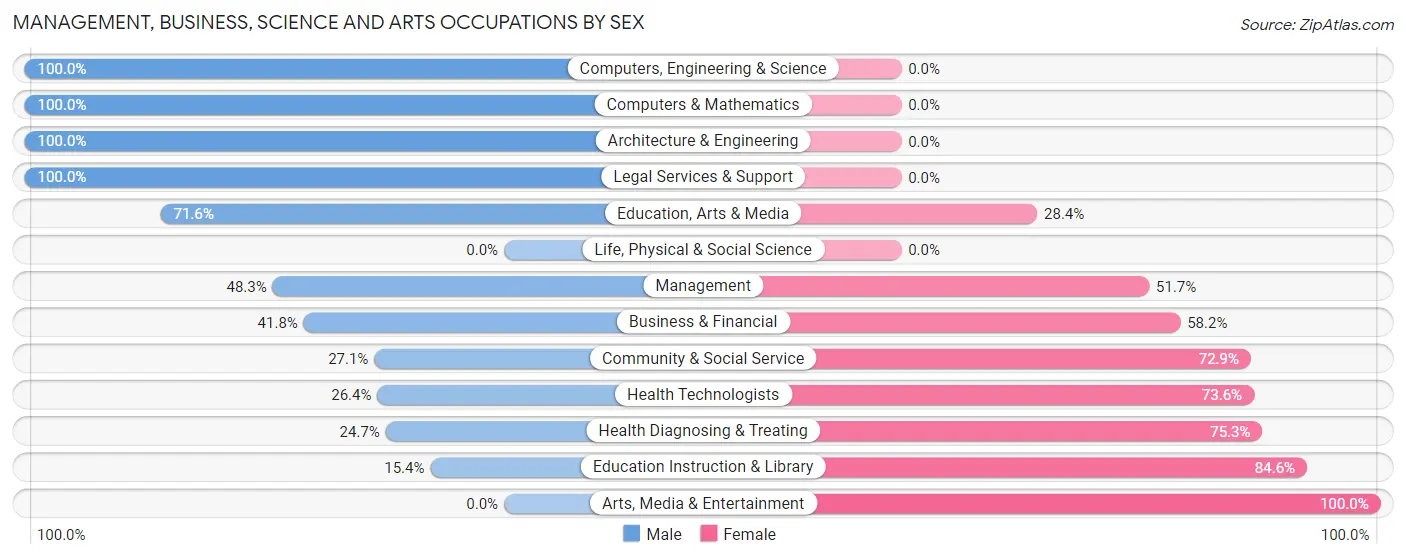
Management, Business, Science and Arts Occupations by Sex
Within the Management, Business, Science and Arts occupations in Bleckley County, the most male-oriented occupations are Computers, Engineering & Science (100.0%), Computers & Mathematics (100.0%), and Architecture & Engineering (100.0%), while the most female-oriented occupations are Arts, Media & Entertainment (100.0%), Education Instruction & Library (84.6%), and Health Diagnosing & Treating (75.3%).
| Occupation | Male | Female |
| Management | 239 (48.3%) | 256 (51.7%) |
| Business & Financial | 28 (41.8%) | 39 (58.2%) |
| Computers, Engineering & Science | 147 (100.0%) | 0 (0.0%) |
| Computers & Mathematics | 7 (100.0%) | 0 (0.0%) |
| Architecture & Engineering | 140 (100.0%) | 0 (0.0%) |
| Life, Physical & Social Science | 0 (0.0%) | 0 (0.0%) |
| Community & Social Service | 154 (27.1%) | 415 (72.9%) |
| Education, Arts & Media | 48 (71.6%) | 19 (28.4%) |
| Legal Services & Support | 35 (100.0%) | 0 (0.0%) |
| Education Instruction & Library | 71 (15.4%) | 391 (84.6%) |
| Arts, Media & Entertainment | 0 (0.0%) | 5 (100.0%) |
| Health Diagnosing & Treating | 116 (24.7%) | 354 (75.3%) |
| Health Technologists | 88 (26.4%) | 245 (73.6%) |
| Total (Category) | 684 (39.1%) | 1,064 (60.9%) |
| Total (Overall) | 2,571 (51.4%) | 2,434 (48.6%) |
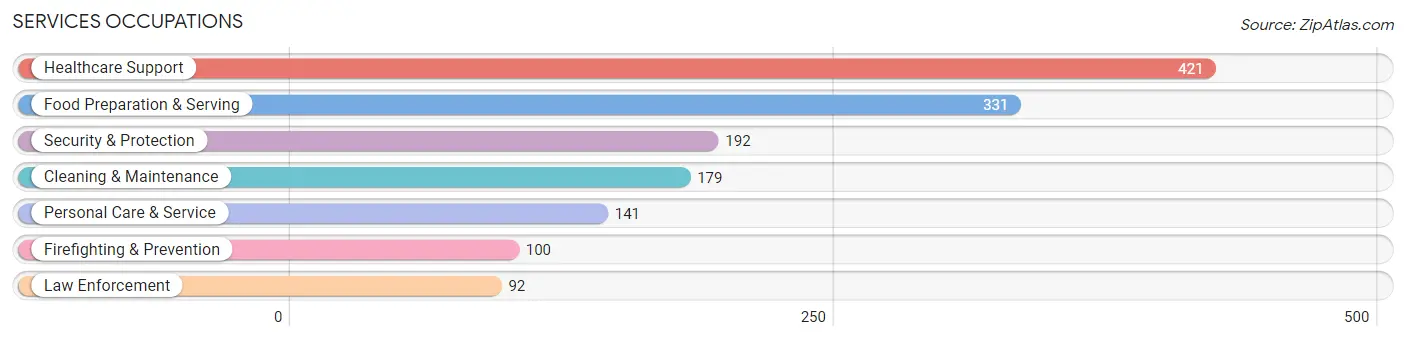
Services Occupations
The most common Services occupations in Bleckley County are Healthcare Support (421 | 8.4%), Food Preparation & Serving (331 | 6.6%), Security & Protection (192 | 3.8%), Cleaning & Maintenance (179 | 3.6%), and Personal Care & Service (141 | 2.8%).
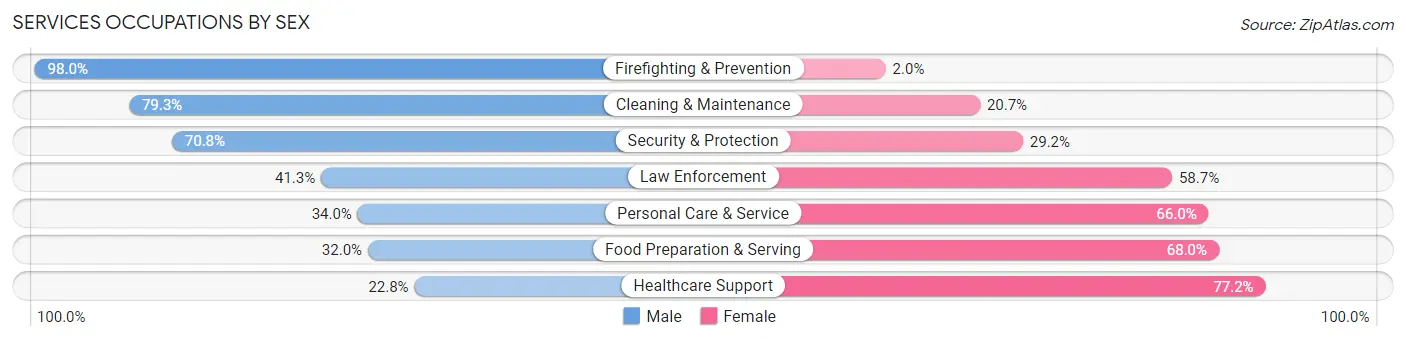
Services Occupations by Sex
Within the Services occupations in Bleckley County, the most male-oriented occupations are Firefighting & Prevention (98.0%), Cleaning & Maintenance (79.3%), and Security & Protection (70.8%), while the most female-oriented occupations are Healthcare Support (77.2%), Food Preparation & Serving (68.0%), and Personal Care & Service (66.0%).
| Occupation | Male | Female |
| Healthcare Support | 96 (22.8%) | 325 (77.2%) |
| Security & Protection | 136 (70.8%) | 56 (29.2%) |
| Firefighting & Prevention | 98 (98.0%) | 2 (2.0%) |
| Law Enforcement | 38 (41.3%) | 54 (58.7%) |
| Food Preparation & Serving | 106 (32.0%) | 225 (68.0%) |
| Cleaning & Maintenance | 142 (79.3%) | 37 (20.7%) |
| Personal Care & Service | 48 (34.0%) | 93 (66.0%) |
| Total (Category) | 528 (41.8%) | 736 (58.2%) |
| Total (Overall) | 2,571 (51.4%) | 2,434 (48.6%) |
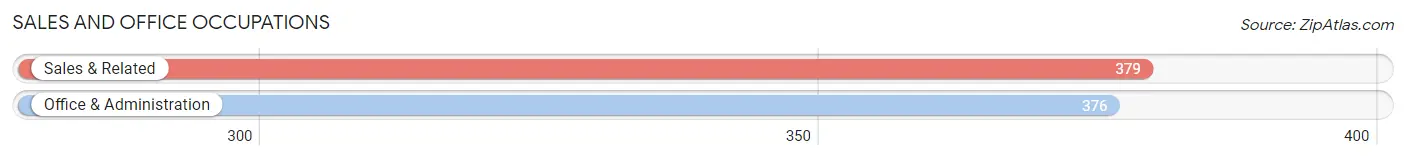
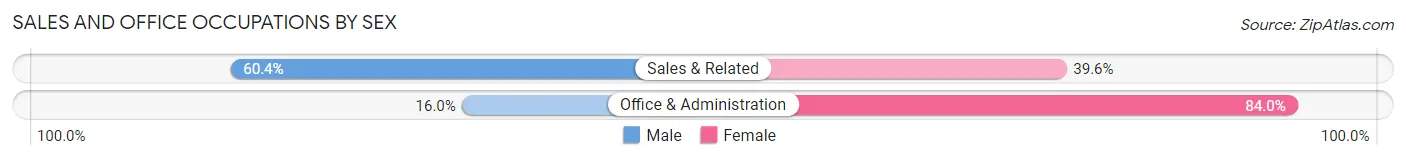
Sales and Office Occupations
The most common Sales and Office occupations in Bleckley County are Sales & Related (379 | 7.6%), and Office & Administration (376 | 7.5%).
Sales and Office Occupations by Sex
| Occupation | Male | Female |
| Sales & Related | 229 (60.4%) | 150 (39.6%) |
| Office & Administration | 60 (16.0%) | 316 (84.0%) |
| Total (Category) | 289 (38.3%) | 466 (61.7%) |
| Total (Overall) | 2,571 (51.4%) | 2,434 (48.6%) |
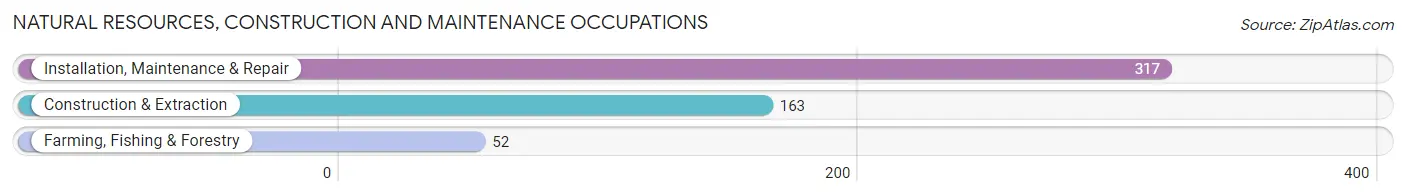
Natural Resources, Construction and Maintenance Occupations
The most common Natural Resources, Construction and Maintenance occupations in Bleckley County are Installation, Maintenance & Repair (317 | 6.3%), Construction & Extraction (163 | 3.3%), and Farming, Fishing & Forestry (52 | 1.0%).
Natural Resources, Construction and Maintenance Occupations by Sex
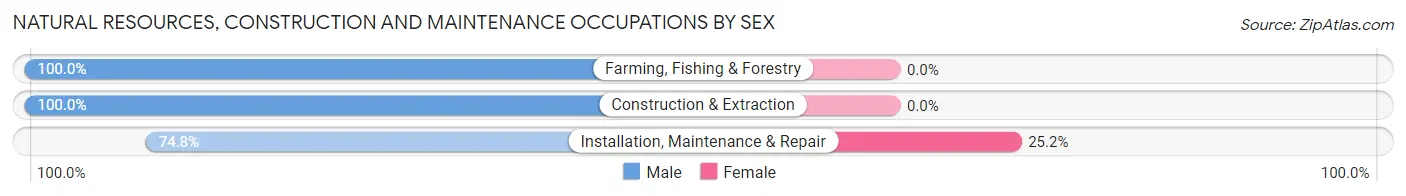
| Occupation | Male | Female |
| Farming, Fishing & Forestry | 52 (100.0%) | 0 (0.0%) |
| Construction & Extraction | 163 (100.0%) | 0 (0.0%) |
| Installation, Maintenance & Repair | 237 (74.8%) | 80 (25.2%) |
| Total (Category) | 452 (85.0%) | 80 (15.0%) |
| Total (Overall) | 2,571 (51.4%) | 2,434 (48.6%) |
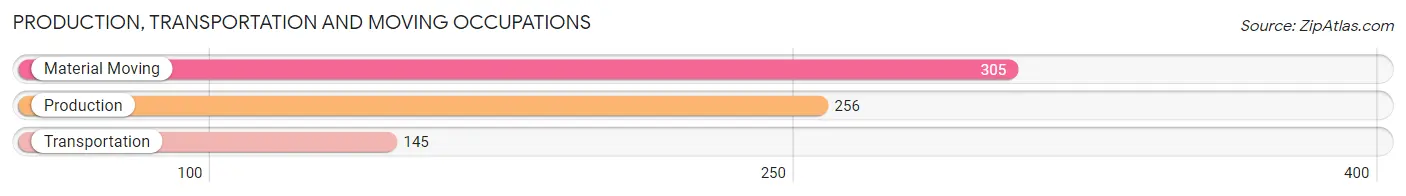
Production, Transportation and Moving Occupations
The most common Production, Transportation and Moving occupations in Bleckley County are Material Moving (305 | 6.1%), Production (256 | 5.1%), and Transportation (145 | 2.9%).
Production, Transportation and Moving Occupations by Sex
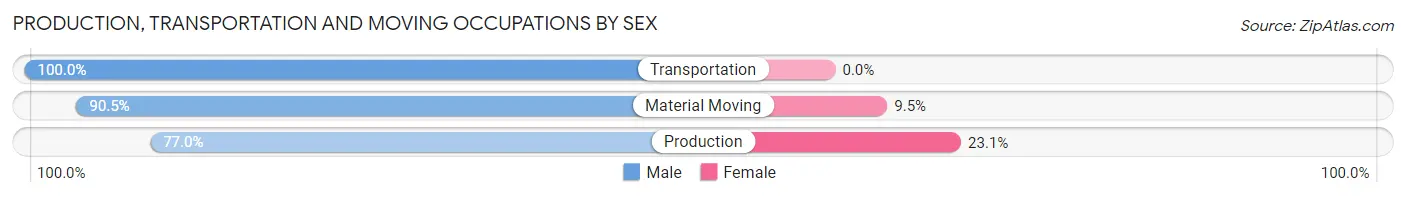
| Occupation | Male | Female |
| Production | 197 (76.9%) | 59 (23.1%) |
| Transportation | 145 (100.0%) | 0 (0.0%) |
| Material Moving | 276 (90.5%) | 29 (9.5%) |
| Total (Category) | 618 (87.5%) | 88 (12.5%) |
| Total (Overall) | 2,571 (51.4%) | 2,434 (48.6%) |
Employment Industries by Sex in Bleckley County
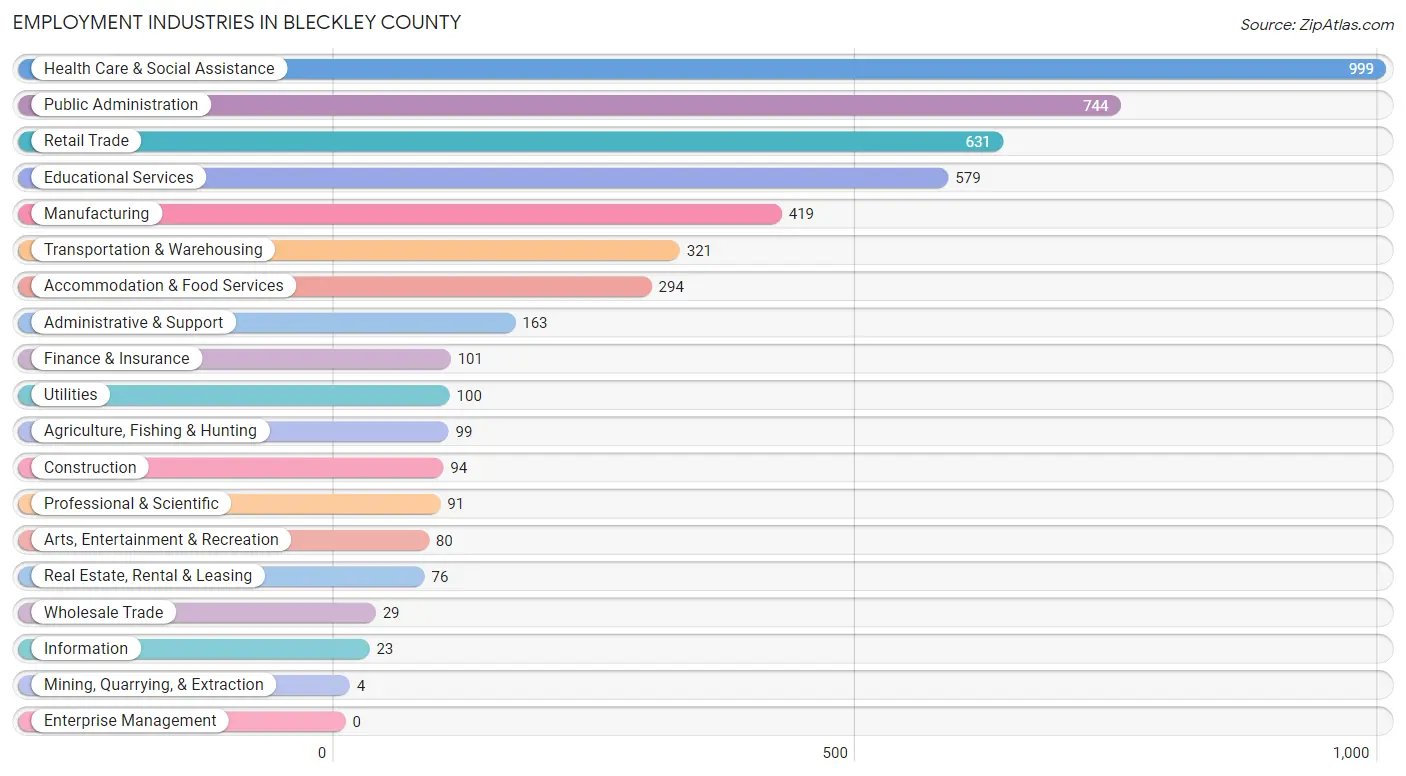
Employment Industries in Bleckley County
The major employment industries in Bleckley County include Health Care & Social Assistance (999 | 20.0%), Public Administration (744 | 14.9%), Retail Trade (631 | 12.6%), Educational Services (579 | 11.6%), and Manufacturing (419 | 8.4%).
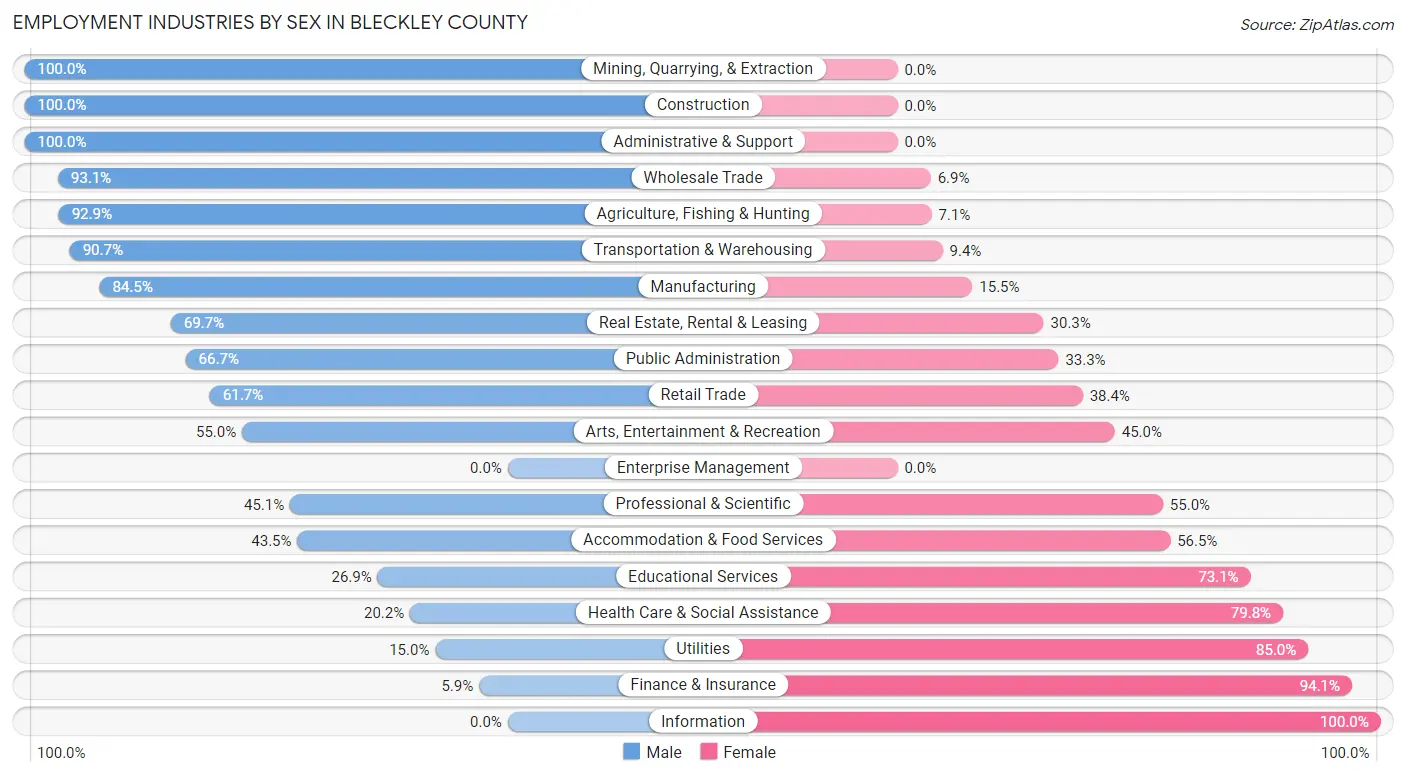
Employment Industries by Sex in Bleckley County
The Bleckley County industries that see more men than women are Mining, Quarrying, & Extraction (100.0%), Construction (100.0%), and Administrative & Support (100.0%), whereas the industries that tend to have a higher number of women are Information (100.0%), Finance & Insurance (94.1%), and Utilities (85.0%).
| Industry | Male | Female |
| Agriculture, Fishing & Hunting | 92 (92.9%) | 7 (7.1%) |
| Mining, Quarrying, & Extraction | 4 (100.0%) | 0 (0.0%) |
| Construction | 94 (100.0%) | 0 (0.0%) |
| Manufacturing | 354 (84.5%) | 65 (15.5%) |
| Wholesale Trade | 27 (93.1%) | 2 (6.9%) |
| Retail Trade | 389 (61.7%) | 242 (38.4%) |
| Transportation & Warehousing | 291 (90.6%) | 30 (9.3%) |
| Utilities | 15 (15.0%) | 85 (85.0%) |
| Information | 0 (0.0%) | 23 (100.0%) |
| Finance & Insurance | 6 (5.9%) | 95 (94.1%) |
| Real Estate, Rental & Leasing | 53 (69.7%) | 23 (30.3%) |
| Professional & Scientific | 41 (45.1%) | 50 (54.9%) |
| Enterprise Management | 0 (0.0%) | 0 (0.0%) |
| Administrative & Support | 163 (100.0%) | 0 (0.0%) |
| Educational Services | 156 (26.9%) | 423 (73.1%) |
| Health Care & Social Assistance | 202 (20.2%) | 797 (79.8%) |
| Arts, Entertainment & Recreation | 44 (55.0%) | 36 (45.0%) |
| Accommodation & Food Services | 128 (43.5%) | 166 (56.5%) |
| Public Administration | 496 (66.7%) | 248 (33.3%) |
| Total | 2,571 (51.4%) | 2,434 (48.6%) |
Education in Bleckley County
School Enrollment in Bleckley County
The most common levels of schooling among the 3,518 students in Bleckley County are college / undergraduate (1,432 | 40.7%), high school (584 | 16.6%), and elementary school (553 | 15.7%).
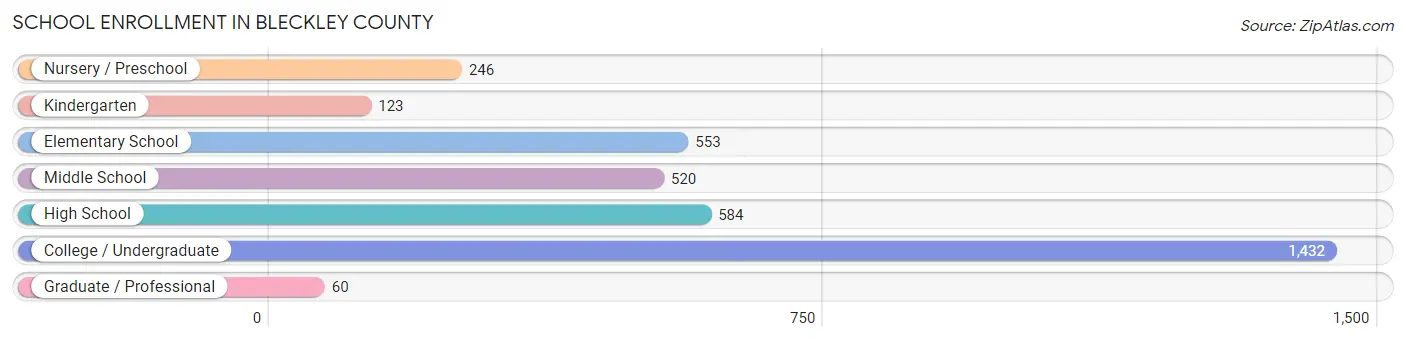
| School Level | # Students | % Students |
| Nursery / Preschool | 246 | 7.0% |
| Kindergarten | 123 | 3.5% |
| Elementary School | 553 | 15.7% |
| Middle School | 520 | 14.8% |
| High School | 584 | 16.6% |
| College / Undergraduate | 1,432 | 40.7% |
| Graduate / Professional | 60 | 1.7% |
| Total | 3,518 | 100.0% |
School Enrollment by Age by Funding Source in Bleckley County
Out of a total of 3,518 students who are enrolled in schools in Bleckley County, 88 (2.5%) attend a private institution, while the remaining 3,430 (97.5%) are enrolled in public schools. The age group of 3 to 4 year olds has the highest likelihood of being enrolled in private schools, with 19 (7.9% in the age bracket) enrolled. Conversely, the age group of 5 to 9 year old has the lowest likelihood of being enrolled in a private school, with 597 (100.0% in the age bracket) attending a public institution.
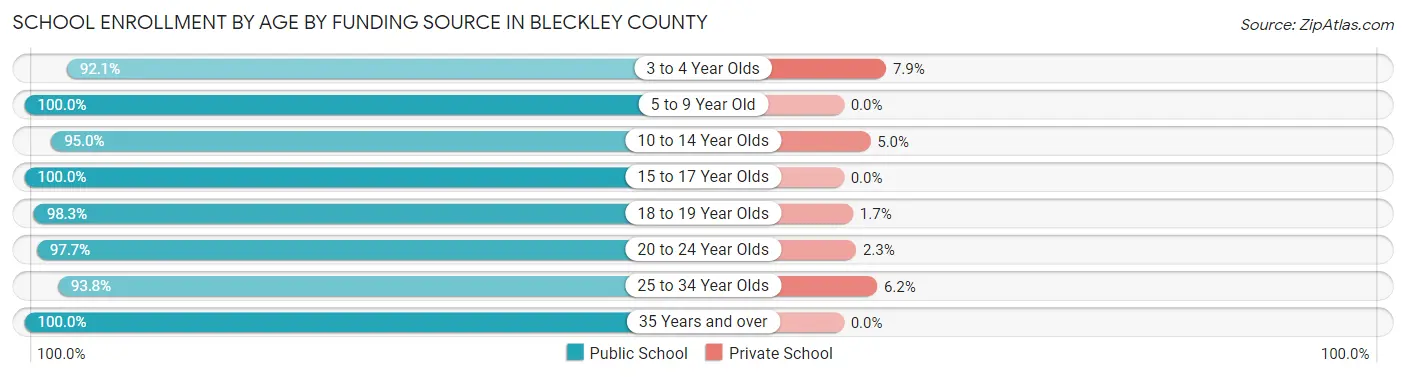
| Age Bracket | Public School | Private School |
| 3 to 4 Year Olds | 222 (92.1%) | 19 (7.9%) |
| 5 to 9 Year Old | 597 (100.0%) | 0 (0.0%) |
| 10 to 14 Year Olds | 575 (95.0%) | 30 (5.0%) |
| 15 to 17 Year Olds | 467 (100.0%) | 0 (0.0%) |
| 18 to 19 Year Olds | 686 (98.3%) | 12 (1.7%) |
| 20 to 24 Year Olds | 470 (97.7%) | 11 (2.3%) |
| 25 to 34 Year Olds | 257 (93.8%) | 17 (6.2%) |
| 35 Years and over | 155 (100.0%) | 0 (0.0%) |
| Total | 3,430 (97.5%) | 88 (2.5%) |
Educational Attainment by Field of Study in Bleckley County
Education (393 | 25.0%), science & technology (371 | 23.6%), arts & humanities (206 | 13.1%), business (203 | 12.9%), and bio, nature & agricultural (77 | 4.9%) are the most common fields of study among 1,573 individuals in Bleckley County who have obtained a bachelor's degree or higher.
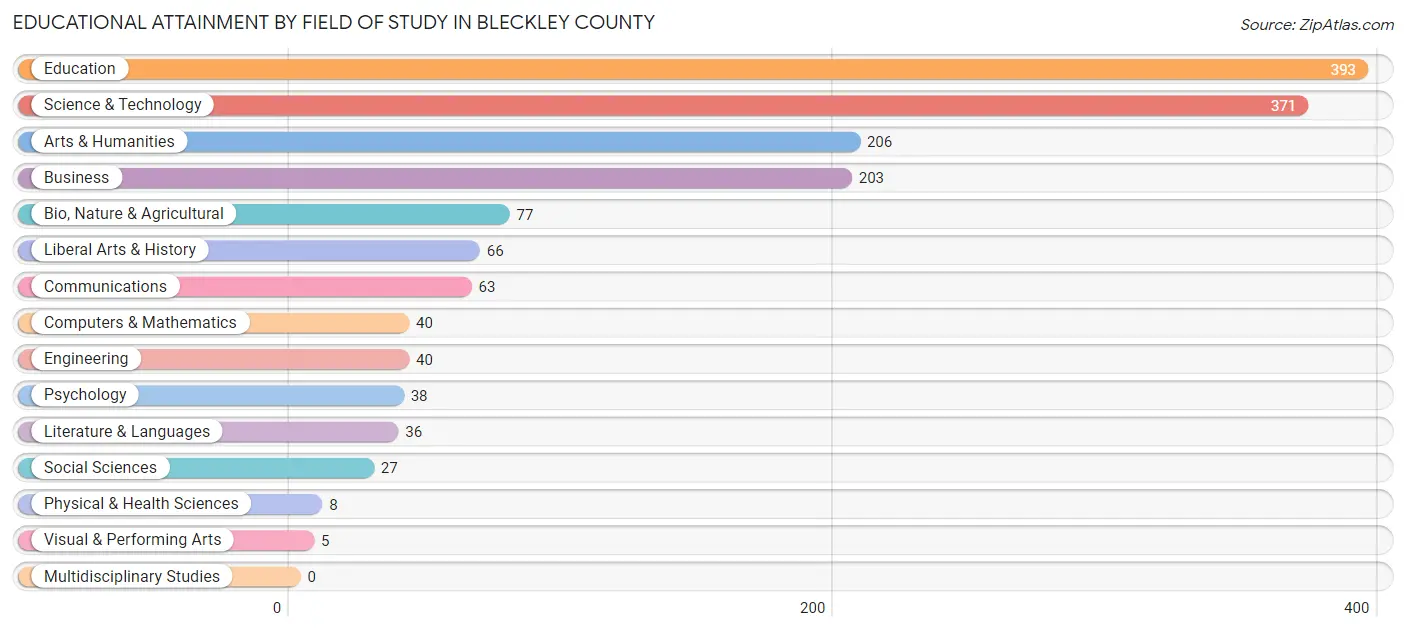
| Field of Study | # Graduates | % Graduates |
| Computers & Mathematics | 40 | 2.5% |
| Bio, Nature & Agricultural | 77 | 4.9% |
| Physical & Health Sciences | 8 | 0.5% |
| Psychology | 38 | 2.4% |
| Social Sciences | 27 | 1.7% |
| Engineering | 40 | 2.5% |
| Multidisciplinary Studies | 0 | 0.0% |
| Science & Technology | 371 | 23.6% |
| Business | 203 | 12.9% |
| Education | 393 | 25.0% |
| Literature & Languages | 36 | 2.3% |
| Liberal Arts & History | 66 | 4.2% |
| Visual & Performing Arts | 5 | 0.3% |
| Communications | 63 | 4.0% |
| Arts & Humanities | 206 | 13.1% |
| Total | 1,573 | 100.0% |
Transportation & Commute in Bleckley County
Vehicle Availability by Sex in Bleckley County
The most prevalent vehicle ownership categories in Bleckley County are males with 2 vehicles (1,276, accounting for 51.6%) and females with 2 vehicles (994, making up 53.5%).
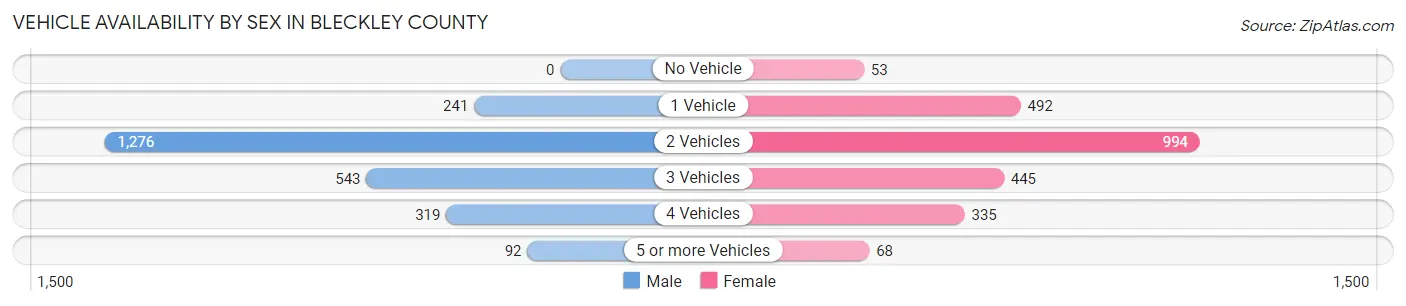
| Vehicles Available | Male | Female |
| No Vehicle | 0 (0.0%) | 53 (2.2%) |
| 1 Vehicle | 241 (9.8%) | 492 (20.6%) |
| 2 Vehicles | 1,276 (51.6%) | 994 (41.6%) |
| 3 Vehicles | 543 (22.0%) | 445 (18.6%) |
| 4 Vehicles | 319 (12.9%) | 335 (14.0%) |
| 5 or more Vehicles | 92 (3.7%) | 68 (2.9%) |
| Total | 2,471 (100.0%) | 2,387 (100.0%) |
Commute Time in Bleckley County
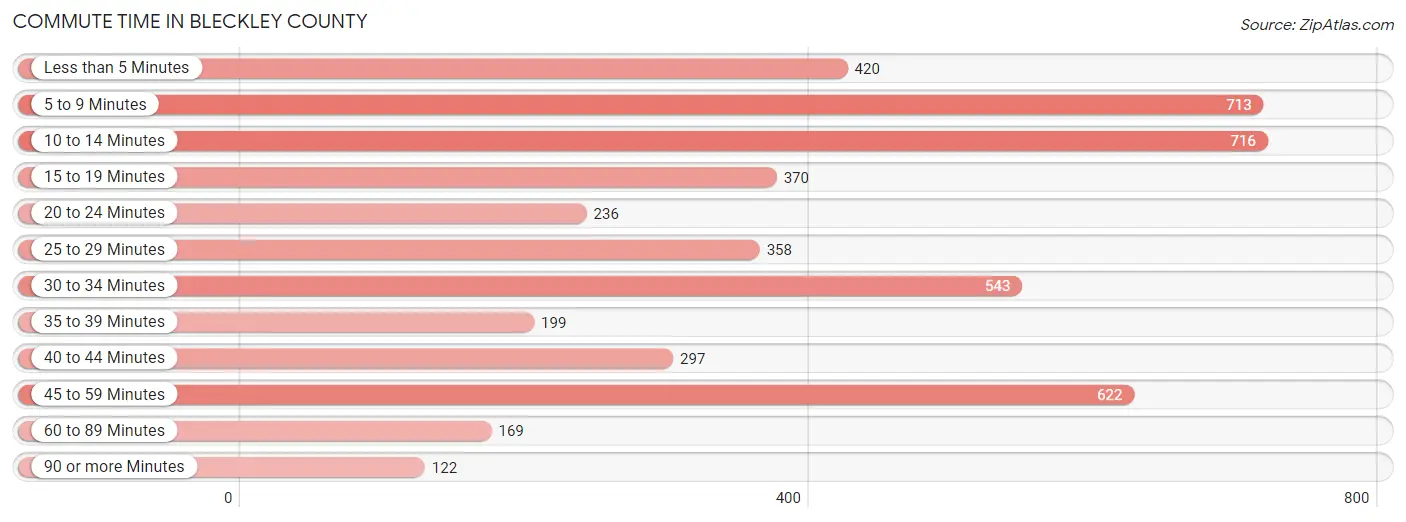
The most frequently occuring commute durations in Bleckley County are 10 to 14 minutes (716 commuters, 15.0%), 5 to 9 minutes (713 commuters, 15.0%), and 45 to 59 minutes (622 commuters, 13.1%).
| Commute Time | # Commuters | % Commuters |
| Less than 5 Minutes | 420 | 8.8% |
| 5 to 9 Minutes | 713 | 15.0% |
| 10 to 14 Minutes | 716 | 15.0% |
| 15 to 19 Minutes | 370 | 7.8% |
| 20 to 24 Minutes | 236 | 5.0% |
| 25 to 29 Minutes | 358 | 7.5% |
| 30 to 34 Minutes | 543 | 11.4% |
| 35 to 39 Minutes | 199 | 4.2% |
| 40 to 44 Minutes | 297 | 6.2% |
| 45 to 59 Minutes | 622 | 13.1% |
| 60 to 89 Minutes | 169 | 3.5% |
| 90 or more Minutes | 122 | 2.6% |
Commute Time by Sex in Bleckley County
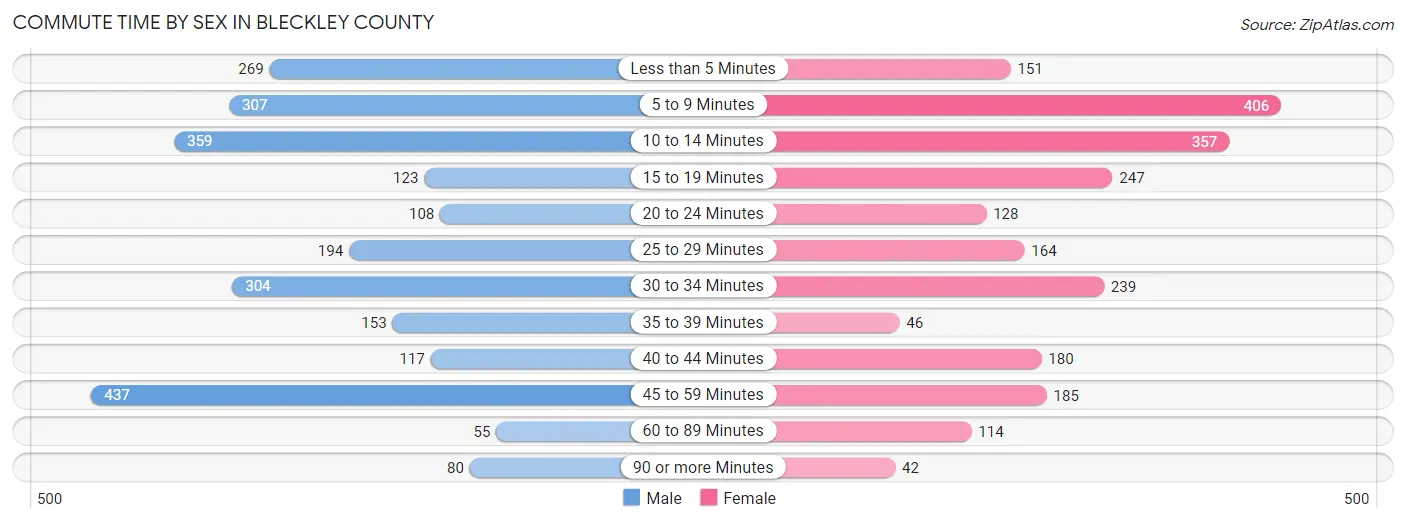
The most common commute times in Bleckley County are 45 to 59 minutes (437 commuters, 17.4%) for males and 5 to 9 minutes (406 commuters, 18.0%) for females.
| Commute Time | Male | Female |
| Less than 5 Minutes | 269 (10.7%) | 151 (6.7%) |
| 5 to 9 Minutes | 307 (12.2%) | 406 (18.0%) |
| 10 to 14 Minutes | 359 (14.3%) | 357 (15.8%) |
| 15 to 19 Minutes | 123 (4.9%) | 247 (10.9%) |
| 20 to 24 Minutes | 108 (4.3%) | 128 (5.7%) |
| 25 to 29 Minutes | 194 (7.7%) | 164 (7.3%) |
| 30 to 34 Minutes | 304 (12.1%) | 239 (10.6%) |
| 35 to 39 Minutes | 153 (6.1%) | 46 (2.0%) |
| 40 to 44 Minutes | 117 (4.7%) | 180 (8.0%) |
| 45 to 59 Minutes | 437 (17.4%) | 185 (8.2%) |
| 60 to 89 Minutes | 55 (2.2%) | 114 (5.1%) |
| 90 or more Minutes | 80 (3.2%) | 42 (1.9%) |
Time of Departure to Work by Sex in Bleckley County
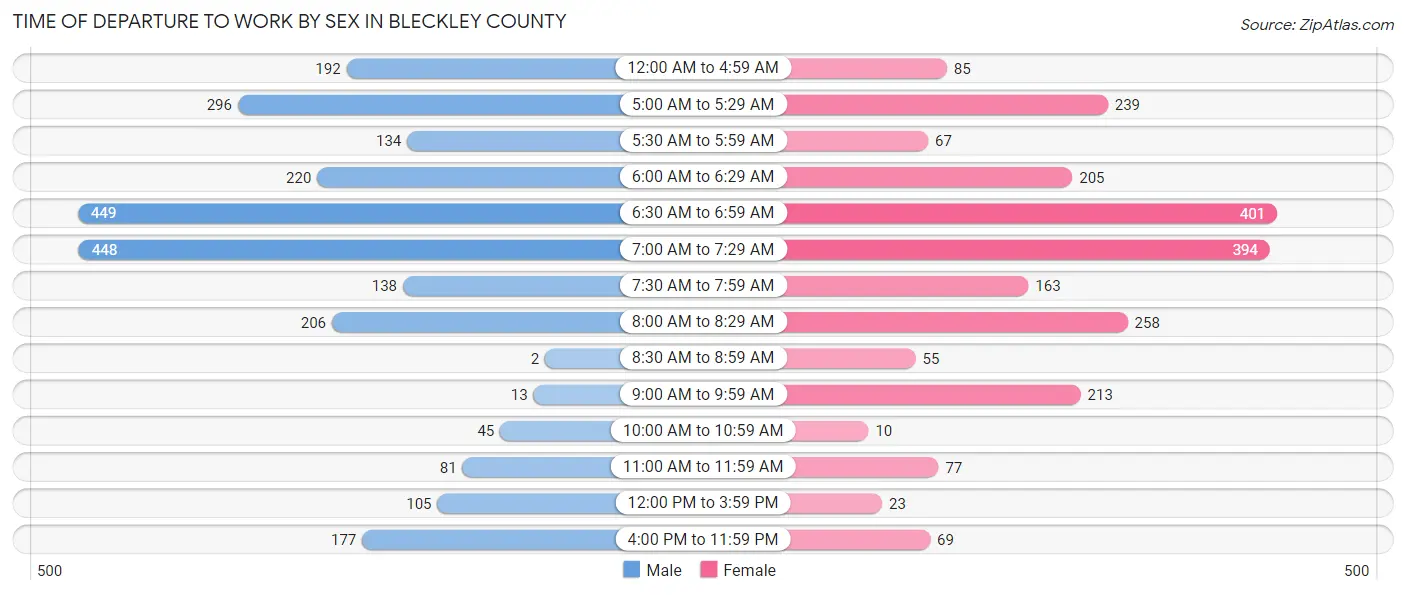
The most frequent times of departure to work in Bleckley County are 6:30 AM to 6:59 AM (449, 17.9%) for males and 6:30 AM to 6:59 AM (401, 17.7%) for females.
| Time of Departure | Male | Female |
| 12:00 AM to 4:59 AM | 192 (7.7%) | 85 (3.8%) |
| 5:00 AM to 5:29 AM | 296 (11.8%) | 239 (10.6%) |
| 5:30 AM to 5:59 AM | 134 (5.3%) | 67 (3.0%) |
| 6:00 AM to 6:29 AM | 220 (8.8%) | 205 (9.1%) |
| 6:30 AM to 6:59 AM | 449 (17.9%) | 401 (17.7%) |
| 7:00 AM to 7:29 AM | 448 (17.9%) | 394 (17.4%) |
| 7:30 AM to 7:59 AM | 138 (5.5%) | 163 (7.2%) |
| 8:00 AM to 8:29 AM | 206 (8.2%) | 258 (11.4%) |
| 8:30 AM to 8:59 AM | 2 (0.1%) | 55 (2.4%) |
| 9:00 AM to 9:59 AM | 13 (0.5%) | 213 (9.4%) |
| 10:00 AM to 10:59 AM | 45 (1.8%) | 10 (0.4%) |
| 11:00 AM to 11:59 AM | 81 (3.2%) | 77 (3.4%) |
| 12:00 PM to 3:59 PM | 105 (4.2%) | 23 (1.0%) |
| 4:00 PM to 11:59 PM | 177 (7.1%) | 69 (3.0%) |
| Total | 2,506 (100.0%) | 2,259 (100.0%) |
Housing Occupancy in Bleckley County
Occupancy by Ownership in Bleckley County
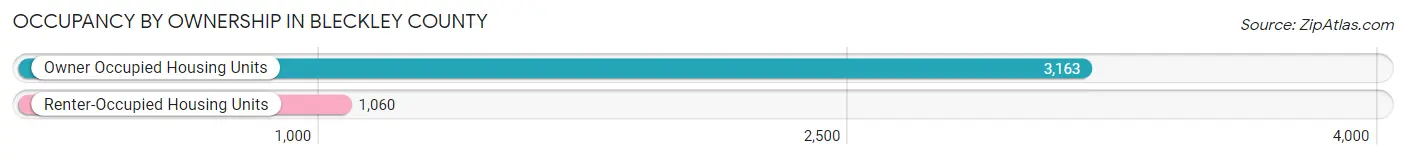
Of the total 4,223 dwellings in Bleckley County, owner-occupied units account for 3,163 (74.9%), while renter-occupied units make up 1,060 (25.1%).
| Occupancy | # Housing Units | % Housing Units |
| Owner Occupied Housing Units | 3,163 | 74.9% |
| Renter-Occupied Housing Units | 1,060 | 25.1% |
| Total Occupied Housing Units | 4,223 | 100.0% |
Occupancy by Household Size in Bleckley County
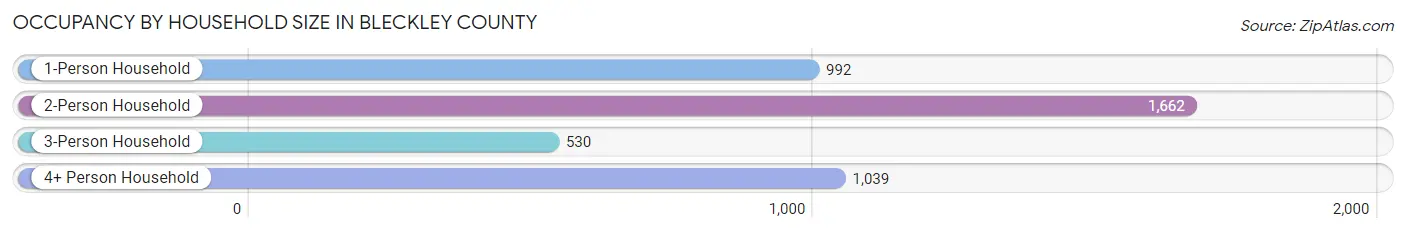
| Household Size | # Housing Units | % Housing Units |
| 1-Person Household | 992 | 23.5% |
| 2-Person Household | 1,662 | 39.4% |
| 3-Person Household | 530 | 12.6% |
| 4+ Person Household | 1,039 | 24.6% |
| Total Housing Units | 4,223 | 100.0% |
Occupancy by Ownership by Household Size in Bleckley County
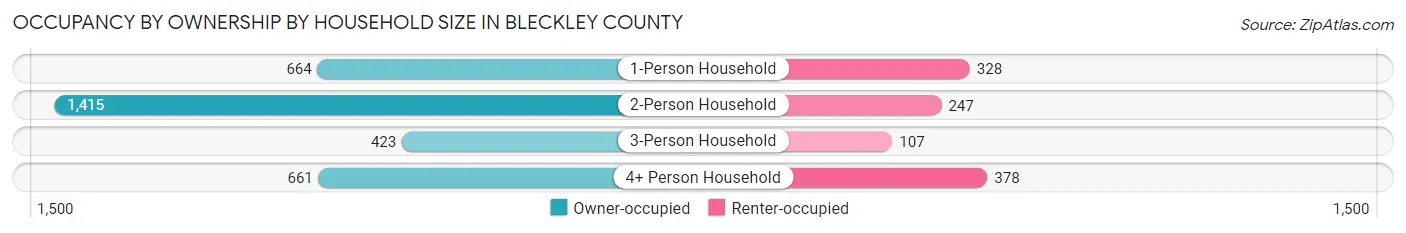
| Household Size | Owner-occupied | Renter-occupied |
| 1-Person Household | 664 (66.9%) | 328 (33.1%) |
| 2-Person Household | 1,415 (85.1%) | 247 (14.9%) |
| 3-Person Household | 423 (79.8%) | 107 (20.2%) |
| 4+ Person Household | 661 (63.6%) | 378 (36.4%) |
| Total Housing Units | 3,163 (74.9%) | 1,060 (25.1%) |
Occupancy by Educational Attainment in Bleckley County
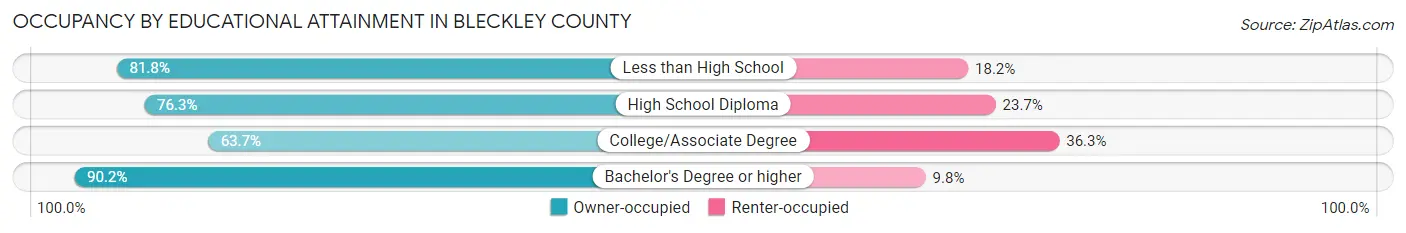
| Household Size | Owner-occupied | Renter-occupied |
| Less than High School | 462 (81.8%) | 103 (18.2%) |
| High School Diploma | 889 (76.3%) | 276 (23.7%) |
| College/Associate Degree | 1,049 (63.7%) | 598 (36.3%) |
| Bachelor's Degree or higher | 763 (90.2%) | 83 (9.8%) |
Occupancy by Age of Householder in Bleckley County
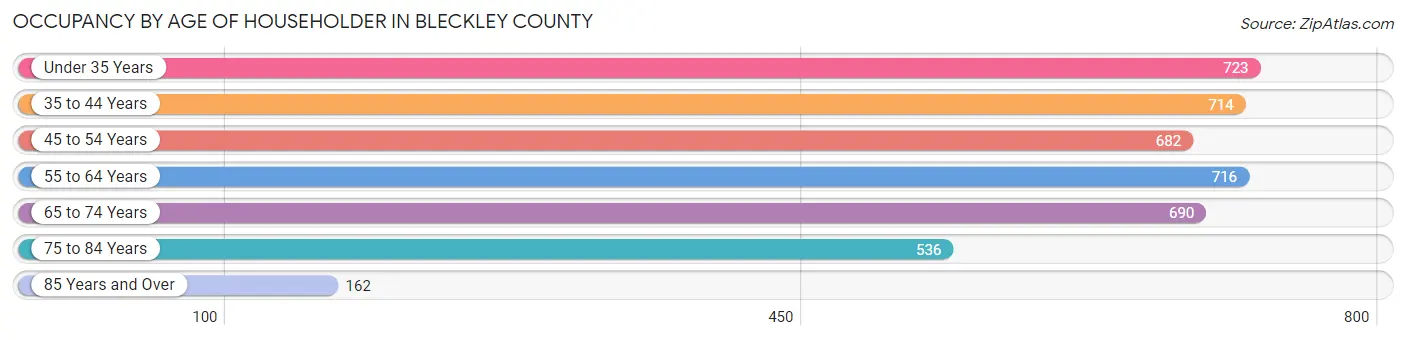
| Age Bracket | # Households | % Households |
| Under 35 Years | 723 | 17.1% |
| 35 to 44 Years | 714 | 16.9% |
| 45 to 54 Years | 682 | 16.2% |
| 55 to 64 Years | 716 | 17.0% |
| 65 to 74 Years | 690 | 16.3% |
| 75 to 84 Years | 536 | 12.7% |
| 85 Years and Over | 162 | 3.8% |
| Total | 4,223 | 100.0% |
Housing Finances in Bleckley County
Median Income by Occupancy in Bleckley County
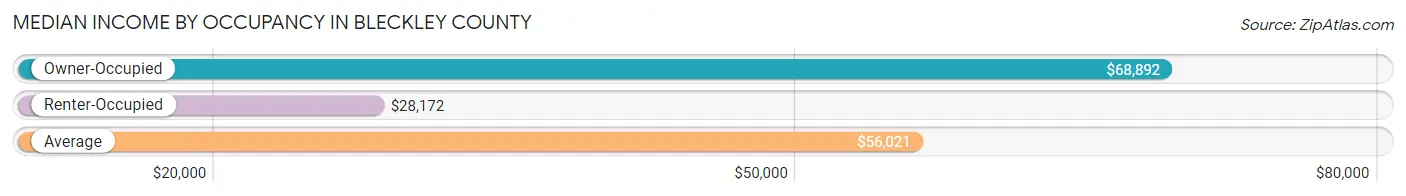
| Occupancy Type | # Households | Median Income |
| Owner-Occupied | 3,163 (74.9%) | $68,892 |
| Renter-Occupied | 1,060 (25.1%) | $28,172 |
| Average | 4,223 (100.0%) | $56,021 |
Occupancy by Householder Income Bracket in Bleckley County
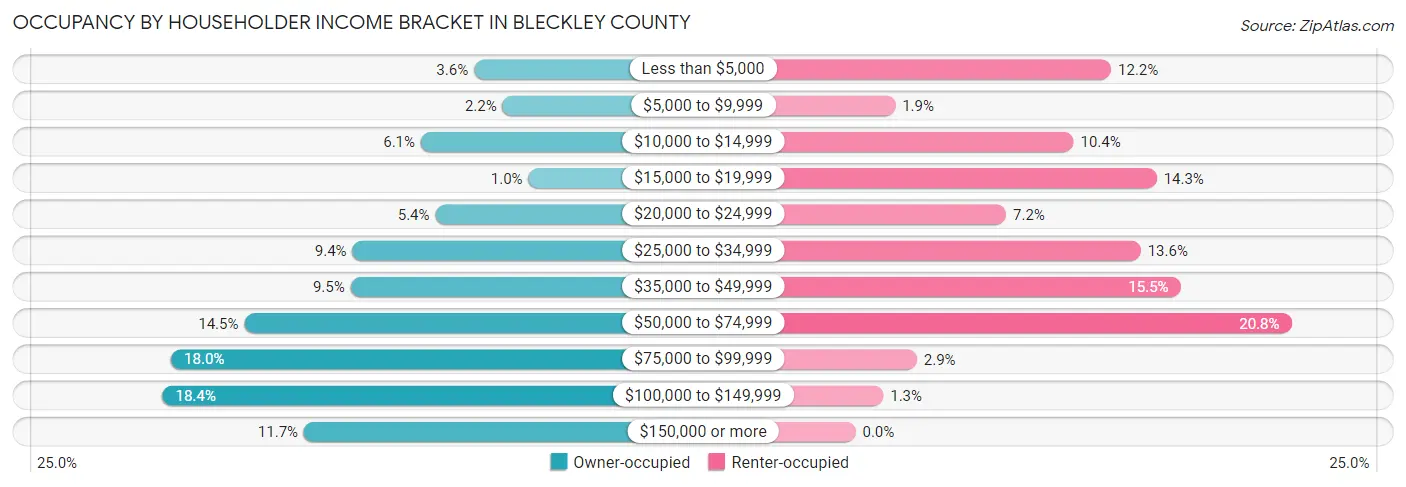
| Income Bracket | Owner-occupied | Renter-occupied |
| Less than $5,000 | 114 (3.6%) | 129 (12.2%) |
| $5,000 to $9,999 | 71 (2.2%) | 20 (1.9%) |
| $10,000 to $14,999 | 194 (6.1%) | 110 (10.4%) |
| $15,000 to $19,999 | 32 (1.0%) | 152 (14.3%) |
| $20,000 to $24,999 | 172 (5.4%) | 76 (7.2%) |
| $25,000 to $34,999 | 297 (9.4%) | 144 (13.6%) |
| $35,000 to $49,999 | 300 (9.5%) | 164 (15.5%) |
| $50,000 to $74,999 | 460 (14.5%) | 220 (20.7%) |
| $75,000 to $99,999 | 570 (18.0%) | 31 (2.9%) |
| $100,000 to $149,999 | 583 (18.4%) | 14 (1.3%) |
| $150,000 or more | 370 (11.7%) | 0 (0.0%) |
| Total | 3,163 (100.0%) | 1,060 (100.0%) |
Monthly Housing Cost Tiers in Bleckley County
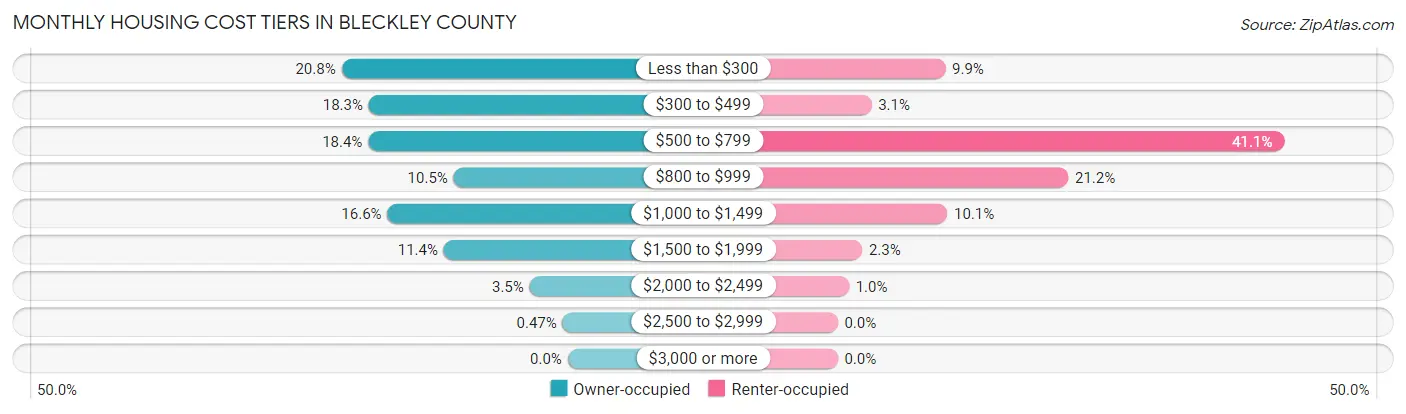
| Monthly Cost | Owner-occupied | Renter-occupied |
| Less than $300 | 659 (20.8%) | 105 (9.9%) |
| $300 to $499 | 579 (18.3%) | 33 (3.1%) |
| $500 to $799 | 581 (18.4%) | 436 (41.1%) |
| $800 to $999 | 332 (10.5%) | 225 (21.2%) |
| $1,000 to $1,499 | 525 (16.6%) | 107 (10.1%) |
| $1,500 to $1,999 | 361 (11.4%) | 24 (2.3%) |
| $2,000 to $2,499 | 111 (3.5%) | 11 (1.0%) |
| $2,500 to $2,999 | 15 (0.5%) | 0 (0.0%) |
| $3,000 or more | 0 (0.0%) | 0 (0.0%) |
| Total | 3,163 (100.0%) | 1,060 (100.0%) |
Physical Housing Characteristics in Bleckley County
Housing Structures in Bleckley County
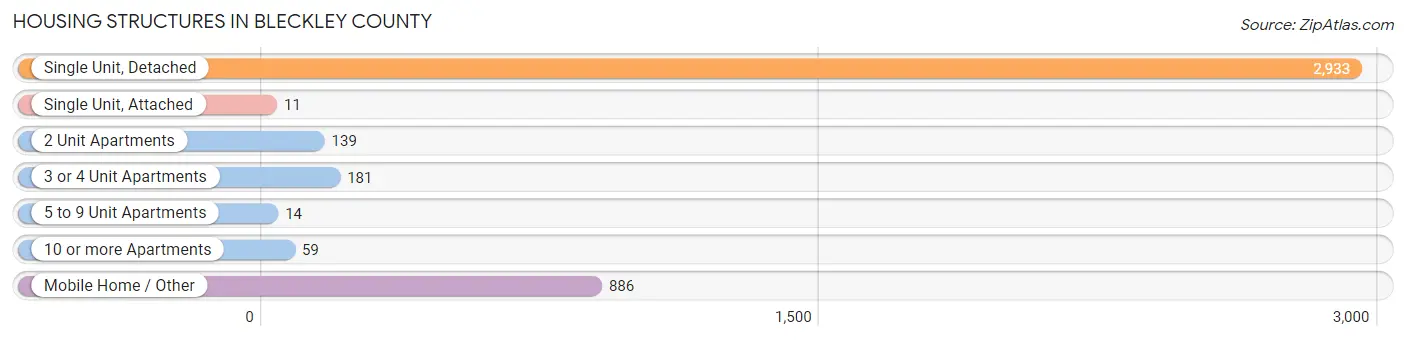
| Structure Type | # Housing Units | % Housing Units |
| Single Unit, Detached | 2,933 | 69.5% |
| Single Unit, Attached | 11 | 0.3% |
| 2 Unit Apartments | 139 | 3.3% |
| 3 or 4 Unit Apartments | 181 | 4.3% |
| 5 to 9 Unit Apartments | 14 | 0.3% |
| 10 or more Apartments | 59 | 1.4% |
| Mobile Home / Other | 886 | 21.0% |
| Total | 4,223 | 100.0% |
Housing Structures by Occupancy in Bleckley County
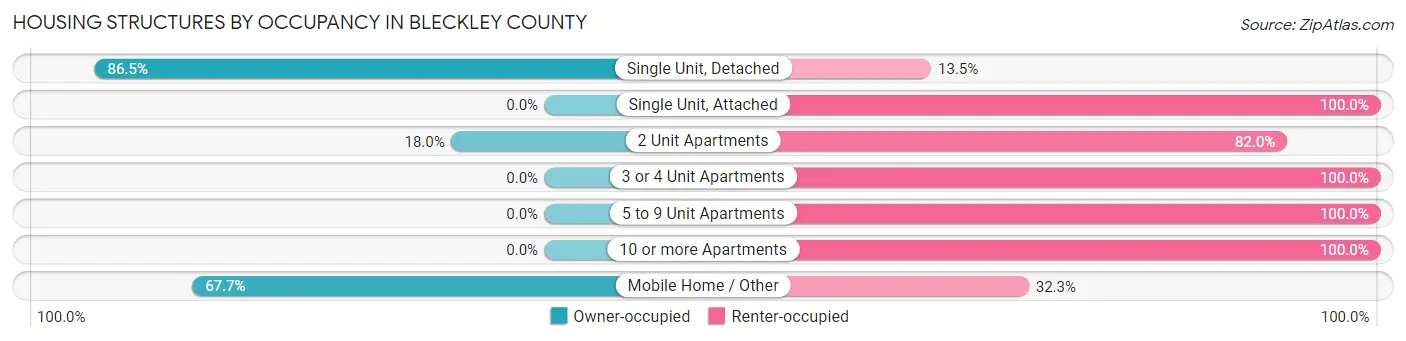
| Structure Type | Owner-occupied | Renter-occupied |
| Single Unit, Detached | 2,538 (86.5%) | 395 (13.5%) |
| Single Unit, Attached | 0 (0.0%) | 11 (100.0%) |
| 2 Unit Apartments | 25 (18.0%) | 114 (82.0%) |
| 3 or 4 Unit Apartments | 0 (0.0%) | 181 (100.0%) |
| 5 to 9 Unit Apartments | 0 (0.0%) | 14 (100.0%) |
| 10 or more Apartments | 0 (0.0%) | 59 (100.0%) |
| Mobile Home / Other | 600 (67.7%) | 286 (32.3%) |
| Total | 3,163 (74.9%) | 1,060 (25.1%) |
Housing Structures by Number of Rooms in Bleckley County
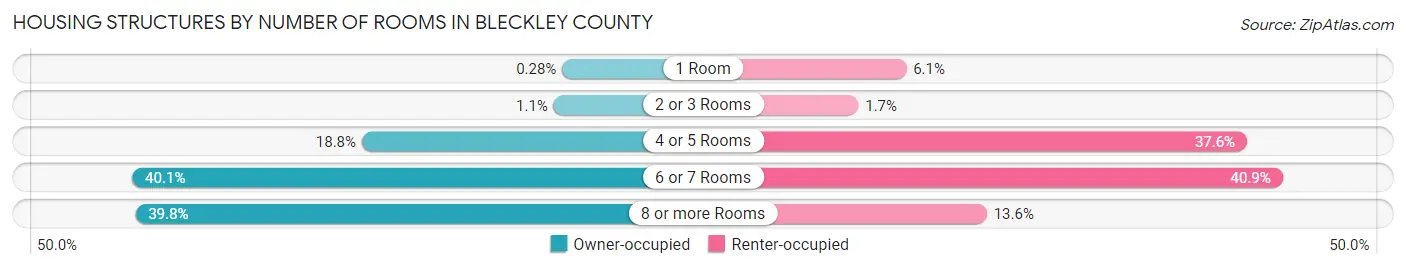
| Number of Rooms | Owner-occupied | Renter-occupied |
| 1 Room | 9 (0.3%) | 65 (6.1%) |
| 2 or 3 Rooms | 34 (1.1%) | 18 (1.7%) |
| 4 or 5 Rooms | 595 (18.8%) | 399 (37.6%) |
| 6 or 7 Rooms | 1,267 (40.1%) | 434 (40.9%) |
| 8 or more Rooms | 1,258 (39.8%) | 144 (13.6%) |
| Total | 3,163 (100.0%) | 1,060 (100.0%) |
Housing Structure by Heating Type in Bleckley County
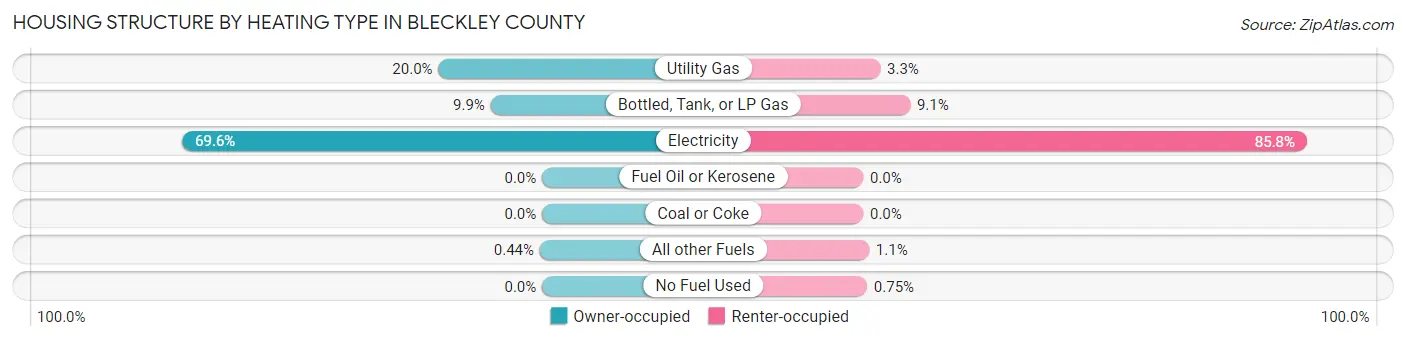
| Heating Type | Owner-occupied | Renter-occupied |
| Utility Gas | 634 (20.0%) | 35 (3.3%) |
| Bottled, Tank, or LP Gas | 314 (9.9%) | 96 (9.1%) |
| Electricity | 2,201 (69.6%) | 909 (85.8%) |
| Fuel Oil or Kerosene | 0 (0.0%) | 0 (0.0%) |
| Coal or Coke | 0 (0.0%) | 0 (0.0%) |
| All other Fuels | 14 (0.4%) | 12 (1.1%) |
| No Fuel Used | 0 (0.0%) | 8 (0.7%) |
| Total | 3,163 (100.0%) | 1,060 (100.0%) |
Household Vehicle Usage in Bleckley County
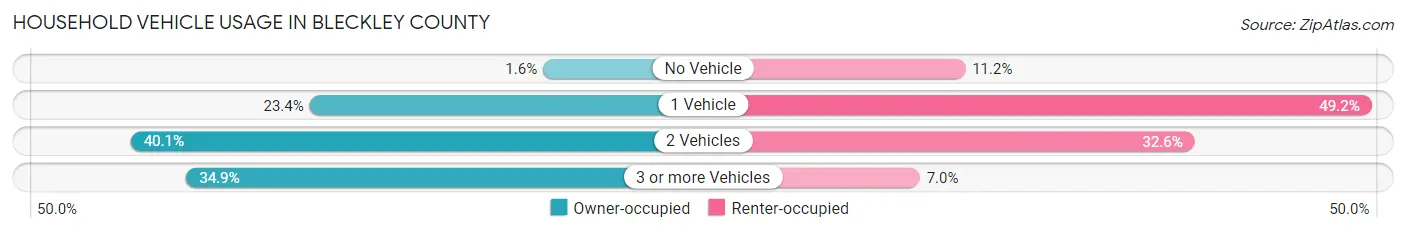
| Vehicles per Household | Owner-occupied | Renter-occupied |
| No Vehicle | 51 (1.6%) | 119 (11.2%) |
| 1 Vehicle | 740 (23.4%) | 521 (49.1%) |
| 2 Vehicles | 1,268 (40.1%) | 346 (32.6%) |
| 3 or more Vehicles | 1,104 (34.9%) | 74 (7.0%) |
| Total | 3,163 (100.0%) | 1,060 (100.0%) |
Real Estate & Mortgages in Bleckley County
Real Estate and Mortgage Overview in Bleckley County
| Characteristic | Without Mortgage | With Mortgage |
| Housing Units | 1,848 | 1,315 |
| Median Property Value | $83,900 | $161,900 |
| Median Household Income | $51,964 | $248 |
| Monthly Housing Costs | $340 | $0 |
| Real Estate Taxes | $1,140 | $122 |
Property Value by Mortgage Status in Bleckley County
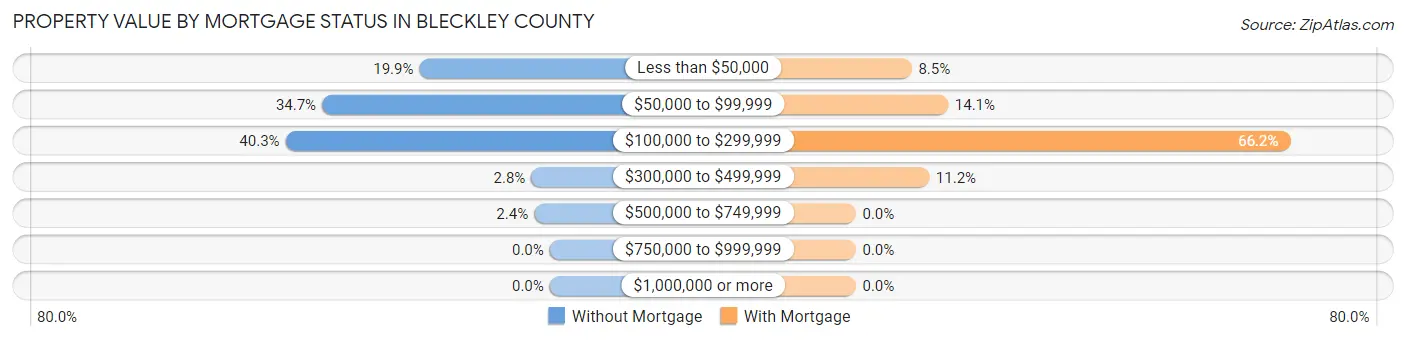
| Property Value | Without Mortgage | With Mortgage |
| Less than $50,000 | 367 (19.9%) | 112 (8.5%) |
| $50,000 to $99,999 | 641 (34.7%) | 185 (14.1%) |
| $100,000 to $299,999 | 744 (40.3%) | 871 (66.2%) |
| $300,000 to $499,999 | 52 (2.8%) | 147 (11.2%) |
| $500,000 to $749,999 | 44 (2.4%) | 0 (0.0%) |
| $750,000 to $999,999 | 0 (0.0%) | 0 (0.0%) |
| $1,000,000 or more | 0 (0.0%) | 0 (0.0%) |
| Total | 1,848 (100.0%) | 1,315 (100.0%) |
Household Income by Mortgage Status in Bleckley County
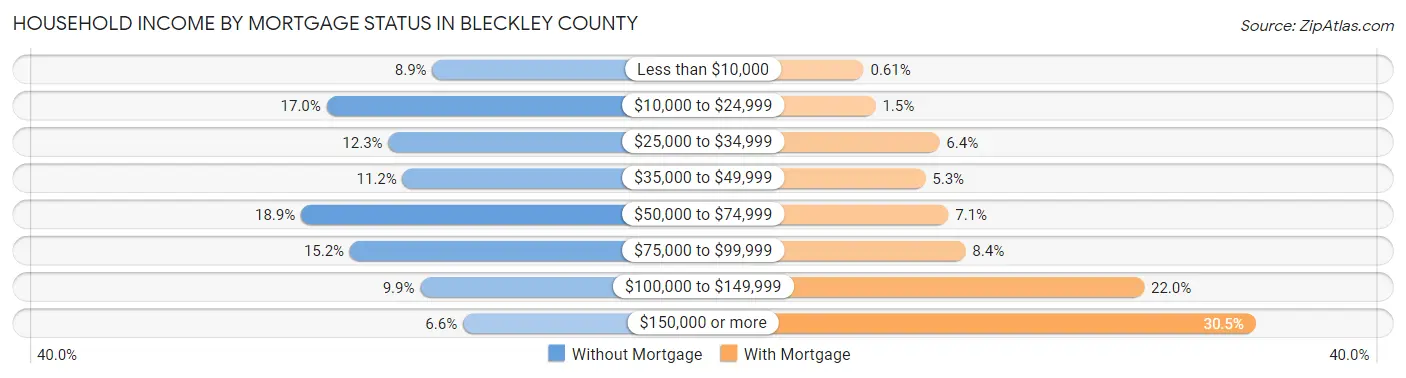
| Household Income | Without Mortgage | With Mortgage |
| Less than $10,000 | 165 (8.9%) | 8 (0.6%) |
| $10,000 to $24,999 | 314 (17.0%) | 20 (1.5%) |
| $25,000 to $34,999 | 227 (12.3%) | 84 (6.4%) |
| $35,000 to $49,999 | 207 (11.2%) | 70 (5.3%) |
| $50,000 to $74,999 | 350 (18.9%) | 93 (7.1%) |
| $75,000 to $99,999 | 281 (15.2%) | 110 (8.4%) |
| $100,000 to $149,999 | 182 (9.9%) | 289 (22.0%) |
| $150,000 or more | 122 (6.6%) | 401 (30.5%) |
| Total | 1,848 (100.0%) | 1,315 (100.0%) |
Property Value to Household Income Ratio in Bleckley County
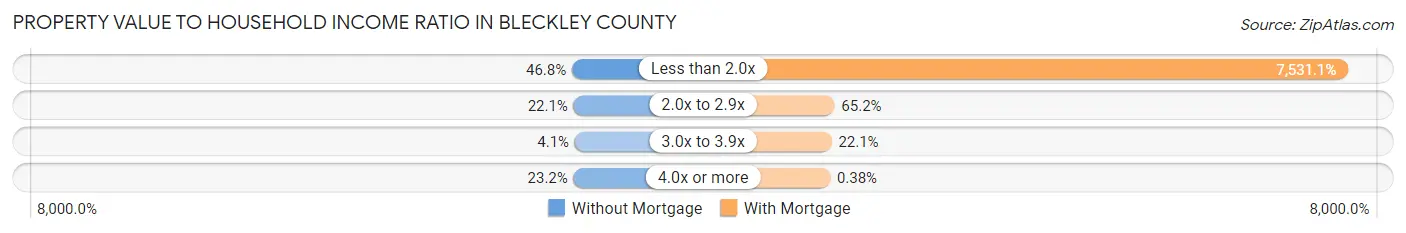
| Value-to-Income Ratio | Without Mortgage | With Mortgage |
| Less than 2.0x | 865 (46.8%) | 99,034 (7,531.1%) |
| 2.0x to 2.9x | 409 (22.1%) | 857 (65.2%) |
| 3.0x to 3.9x | 75 (4.1%) | 290 (22.1%) |
| 4.0x or more | 428 (23.2%) | 5 (0.4%) |
| Total | 1,848 (100.0%) | 1,315 (100.0%) |
Real Estate Taxes by Mortgage Status in Bleckley County
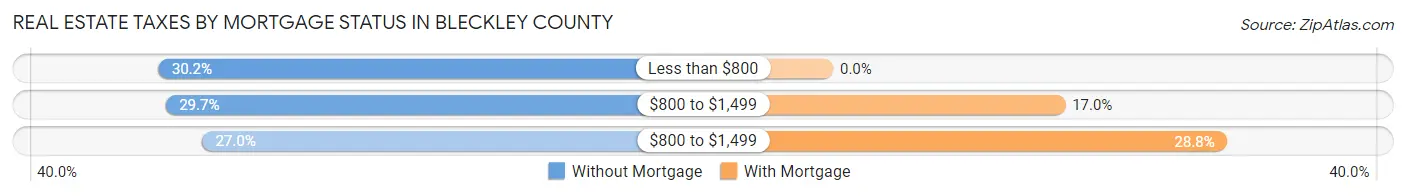
| Property Taxes | Without Mortgage | With Mortgage |
| Less than $800 | 558 (30.2%) | 0 (0.0%) |
| $800 to $1,499 | 548 (29.6%) | 223 (17.0%) |
| $800 to $1,499 | 499 (27.0%) | 378 (28.7%) |
| Total | 1,848 (100.0%) | 1,315 (100.0%) |
Health & Disability in Bleckley County
Health Insurance Coverage by Age in Bleckley County
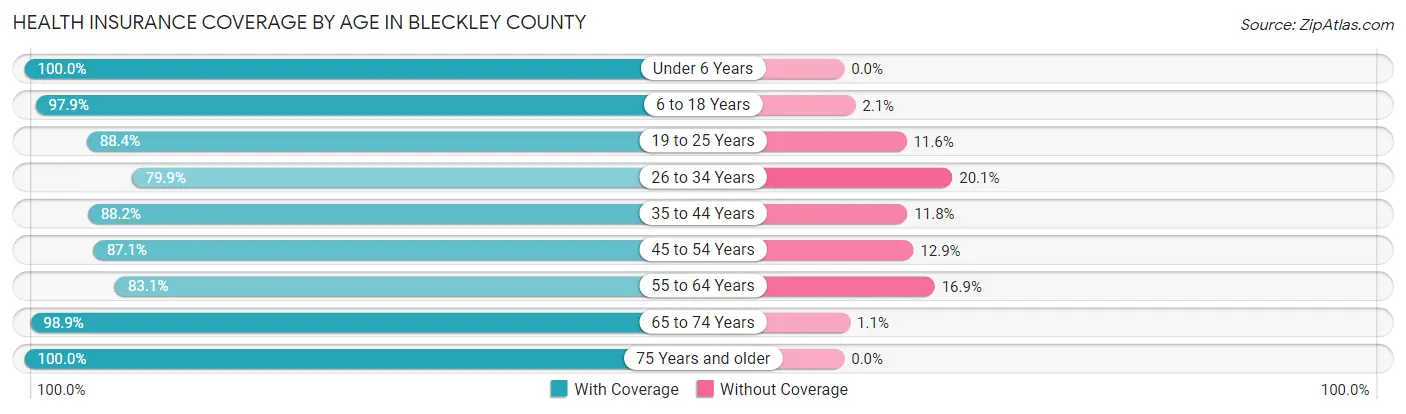
| Age Bracket | With Coverage | Without Coverage |
| Under 6 Years | 723 (100.0%) | 0 (0.0%) |
| 6 to 18 Years | 1,899 (97.9%) | 40 (2.1%) |
| 19 to 25 Years | 1,555 (88.4%) | 204 (11.6%) |
| 26 to 34 Years | 896 (79.9%) | 226 (20.1%) |
| 35 to 44 Years | 1,184 (88.2%) | 158 (11.8%) |
| 45 to 54 Years | 1,243 (87.1%) | 184 (12.9%) |
| 55 to 64 Years | 1,400 (83.1%) | 284 (16.9%) |
| 65 to 74 Years | 1,085 (98.9%) | 12 (1.1%) |
| 75 Years and older | 919 (100.0%) | 0 (0.0%) |
| Total | 10,904 (90.8%) | 1,108 (9.2%) |
Health Insurance Coverage by Citizenship Status in Bleckley County
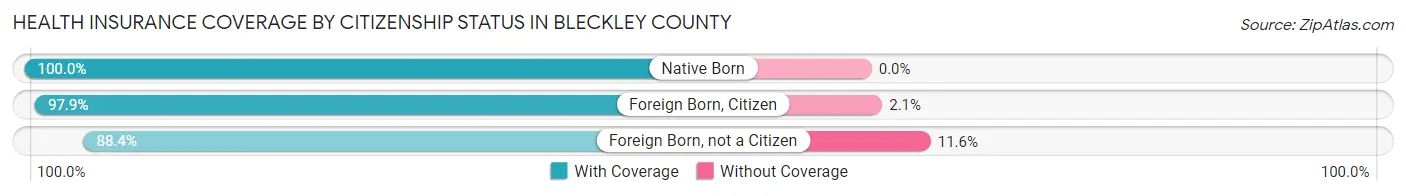
| Citizenship Status | With Coverage | Without Coverage |
| Native Born | 723 (100.0%) | 0 (0.0%) |
| Foreign Born, Citizen | 1,899 (97.9%) | 40 (2.1%) |
| Foreign Born, not a Citizen | 1,555 (88.4%) | 204 (11.6%) |
Health Insurance Coverage by Household Income in Bleckley County
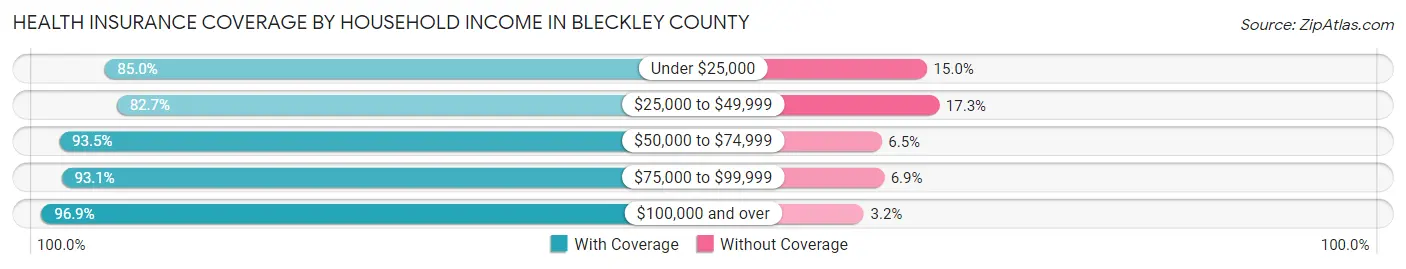
| Household Income | With Coverage | Without Coverage |
| Under $25,000 | 1,762 (85.0%) | 310 (15.0%) |
| $25,000 to $49,999 | 1,783 (82.7%) | 372 (17.3%) |
| $50,000 to $74,999 | 1,789 (93.5%) | 124 (6.5%) |
| $75,000 to $99,999 | 1,522 (93.1%) | 113 (6.9%) |
| $100,000 and over | 3,290 (96.9%) | 107 (3.2%) |
Public vs Private Health Insurance Coverage by Age in Bleckley County
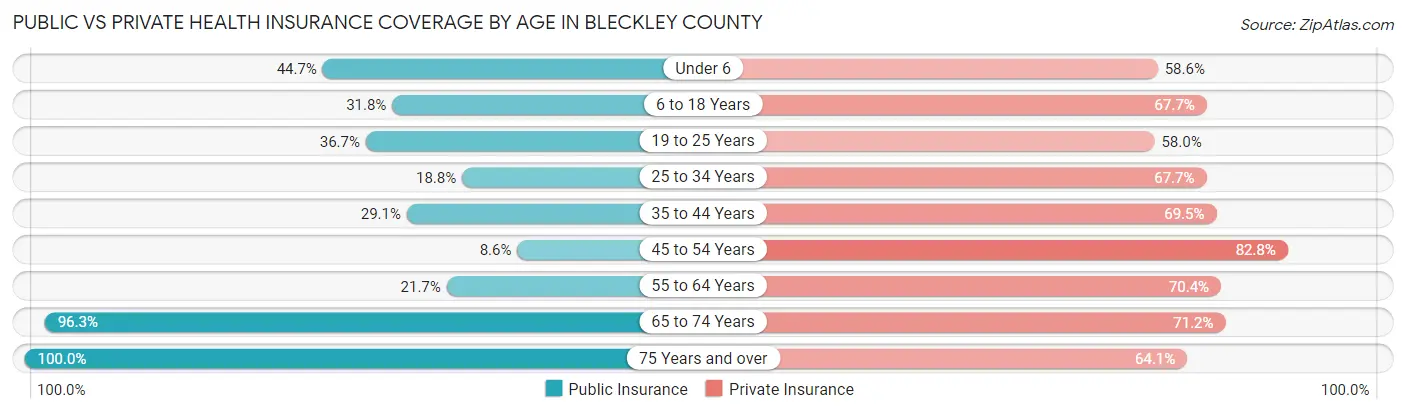
| Age Bracket | Public Insurance | Private Insurance |
| Under 6 | 323 (44.7%) | 424 (58.6%) |
| 6 to 18 Years | 616 (31.8%) | 1,313 (67.7%) |
| 19 to 25 Years | 645 (36.7%) | 1,021 (58.0%) |
| 25 to 34 Years | 211 (18.8%) | 759 (67.6%) |
| 35 to 44 Years | 390 (29.1%) | 933 (69.5%) |
| 45 to 54 Years | 122 (8.6%) | 1,181 (82.8%) |
| 55 to 64 Years | 365 (21.7%) | 1,185 (70.4%) |
| 65 to 74 Years | 1,056 (96.3%) | 781 (71.2%) |
| 75 Years and over | 919 (100.0%) | 589 (64.1%) |
| Total | 4,647 (38.7%) | 8,186 (68.1%) |
Disability Status by Sex by Age in Bleckley County
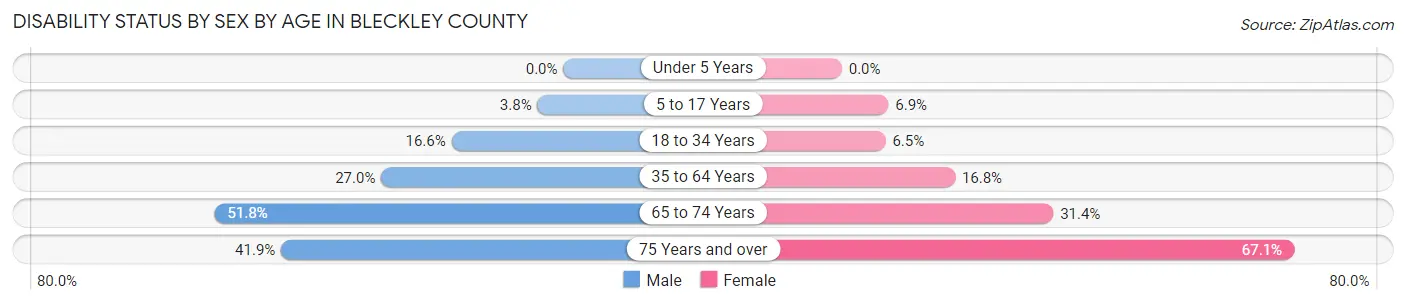
| Age Bracket | Male | Female |
| Under 5 Years | 0 (0.0%) | 0 (0.0%) |
| 5 to 17 Years | 36 (3.8%) | 54 (6.9%) |
| 18 to 34 Years | 268 (16.6%) | 103 (6.5%) |
| 35 to 64 Years | 599 (27.0%) | 376 (16.8%) |
| 65 to 74 Years | 258 (51.8%) | 188 (31.4%) |
| 75 Years and over | 176 (41.9%) | 335 (67.1%) |
Disability Class by Sex by Age in Bleckley County
Disability Class: Hearing Difficulty
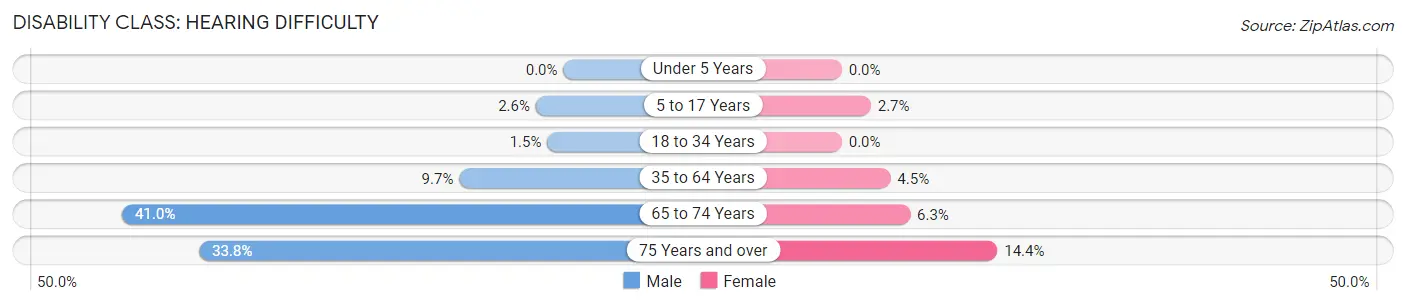
| Age Bracket | Male | Female |
| Under 5 Years | 0 (0.0%) | 0 (0.0%) |
| 5 to 17 Years | 24 (2.6%) | 21 (2.7%) |
| 18 to 34 Years | 24 (1.5%) | 0 (0.0%) |
| 35 to 64 Years | 214 (9.7%) | 101 (4.5%) |
| 65 to 74 Years | 204 (41.0%) | 38 (6.3%) |
| 75 Years and over | 142 (33.8%) | 72 (14.4%) |
Disability Class: Vision Difficulty
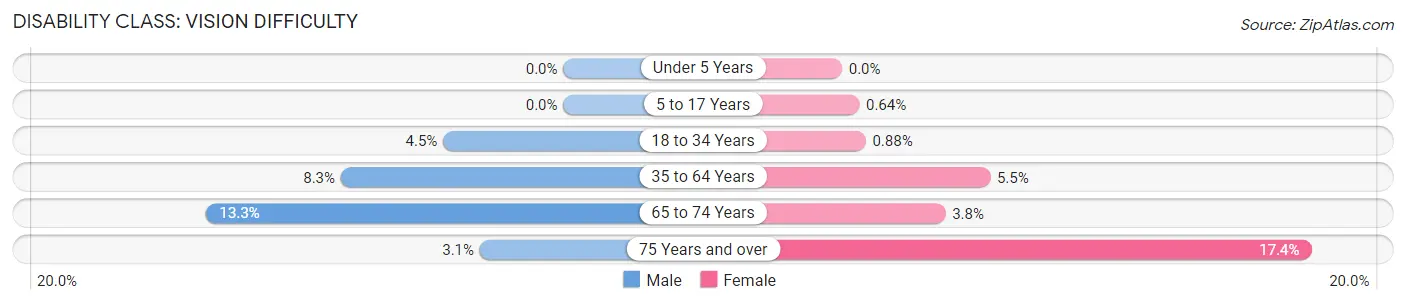
| Age Bracket | Male | Female |
| Under 5 Years | 0 (0.0%) | 0 (0.0%) |
| 5 to 17 Years | 0 (0.0%) | 5 (0.6%) |
| 18 to 34 Years | 72 (4.5%) | 14 (0.9%) |
| 35 to 64 Years | 183 (8.3%) | 123 (5.5%) |
| 65 to 74 Years | 66 (13.3%) | 23 (3.8%) |
| 75 Years and over | 13 (3.1%) | 87 (17.4%) |
Disability Class: Cognitive Difficulty
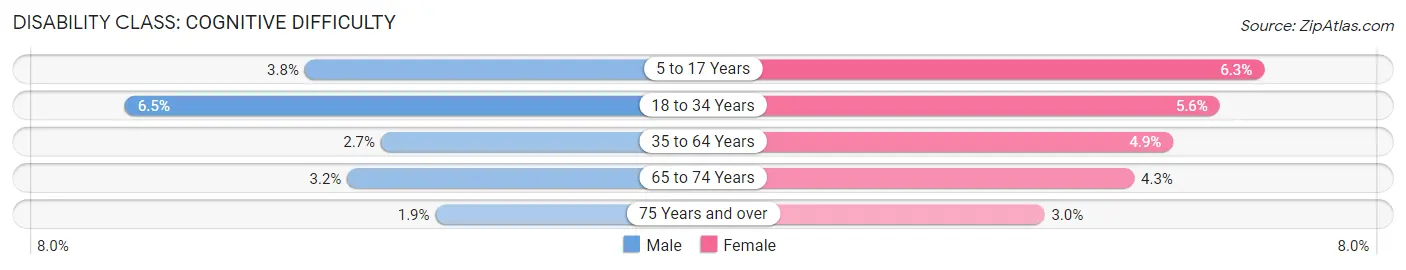
| Age Bracket | Male | Female |
| 5 to 17 Years | 36 (3.8%) | 49 (6.3%) |
| 18 to 34 Years | 105 (6.5%) | 89 (5.6%) |
| 35 to 64 Years | 60 (2.7%) | 110 (4.9%) |
| 65 to 74 Years | 16 (3.2%) | 26 (4.3%) |
| 75 Years and over | 8 (1.9%) | 15 (3.0%) |
Disability Class: Ambulatory Difficulty
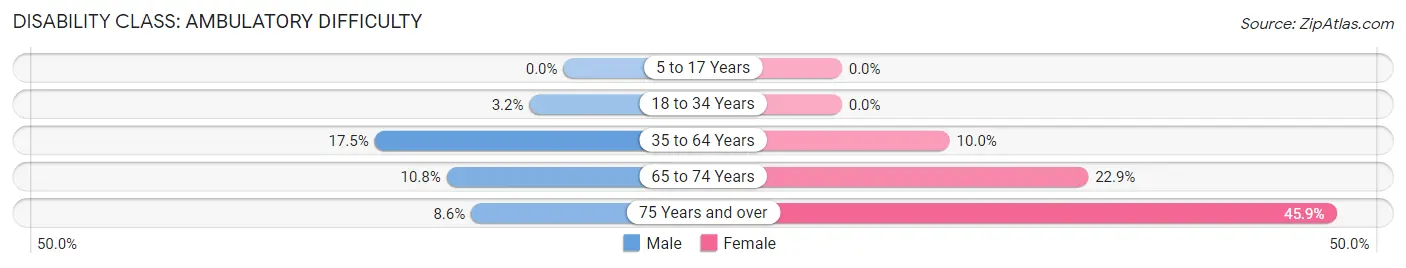
| Age Bracket | Male | Female |
| 5 to 17 Years | 0 (0.0%) | 0 (0.0%) |
| 18 to 34 Years | 51 (3.2%) | 0 (0.0%) |
| 35 to 64 Years | 388 (17.5%) | 224 (10.0%) |
| 65 to 74 Years | 54 (10.8%) | 137 (22.9%) |
| 75 Years and over | 36 (8.6%) | 229 (45.9%) |
Disability Class: Self-Care Difficulty
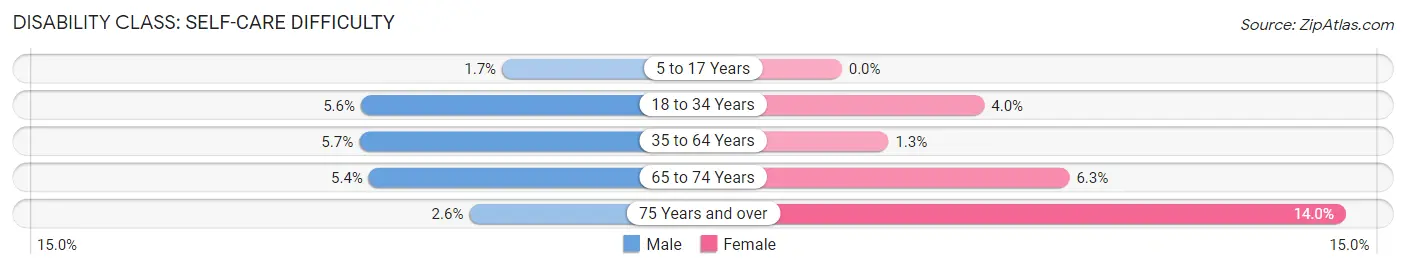
| Age Bracket | Male | Female |
| 5 to 17 Years | 16 (1.7%) | 0 (0.0%) |
| 18 to 34 Years | 91 (5.6%) | 63 (4.0%) |
| 35 to 64 Years | 126 (5.7%) | 29 (1.3%) |
| 65 to 74 Years | 27 (5.4%) | 38 (6.3%) |
| 75 Years and over | 11 (2.6%) | 70 (14.0%) |
Technology Access in Bleckley County
Computing Device Access in Bleckley County
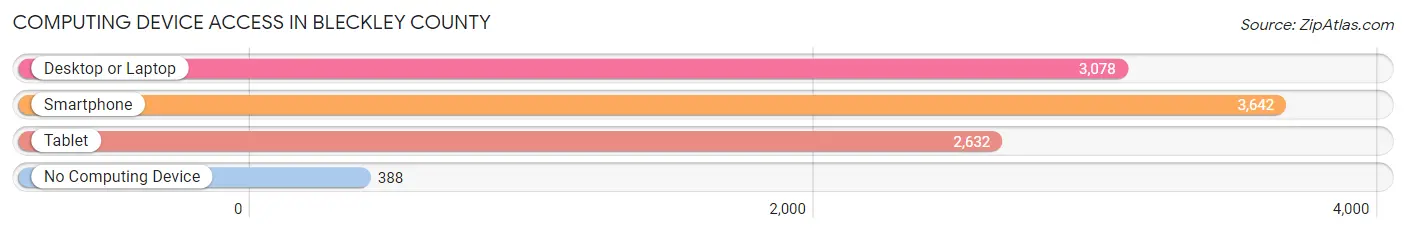
| Device Type | # Households | % Households |
| Desktop or Laptop | 3,078 | 72.9% |
| Smartphone | 3,642 | 86.2% |
| Tablet | 2,632 | 62.3% |
| No Computing Device | 388 | 9.2% |
| Total | 4,223 | 100.0% |
Internet Access in Bleckley County
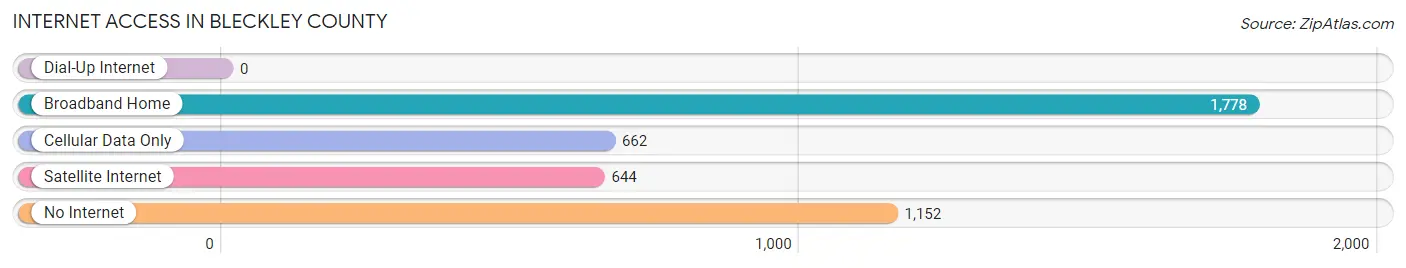
| Internet Type | # Households | % Households |
| Dial-Up Internet | 0 | 0.0% |
| Broadband Home | 1,778 | 42.1% |
| Cellular Data Only | 662 | 15.7% |
| Satellite Internet | 644 | 15.2% |
| No Internet | 1,152 | 27.3% |
| Total | 4,223 | 100.0% |
Bleckley County Summary
Bleckley County is a county located in the central part of the state of Georgia, in the United States. It is part of the Macon metropolitan statistical area. As of the 2010 census, the population was 13,063. The county seat is Cochran.
History
Bleckley County was created in 1912 from parts of Pulaski, Laurens, and Wilcox counties. It was named for Logan Edwin Bleckley, a Confederate soldier and Georgia Supreme Court justice.
Geography
Bleckley County is located in the central part of Georgia, approximately 100 miles south of Atlanta. It is bordered by Pulaski County to the north, Wilcox County to the east, Laurens County to the south, and Houston County to the west. The county has a total area of 287 square miles, of which 285 square miles is land and 2 square miles (0.7%) is water.
The county is located in the Upper Ocmulgee River sub-basin of the Altamaha River basin. The western portion of the county is located in the Lower Ocmulgee River sub-basin of the same Altamaha River basin.
Economy
The economy of Bleckley County is largely based on agriculture. The county is home to several large farms, including the Bleckley County Farm Bureau, which is the largest farm in the county. The county also has a number of small businesses, including a number of restaurants, retail stores, and service providers.
The county is also home to a number of manufacturing companies, including a number of automotive parts suppliers. The county is also home to a number of industrial parks, which provide jobs for many of the county's residents.
Demographics
As of the 2010 census, there were 13,063 people, 4,845 households, and 3,521 families residing in the county. The population density was 45.7 people per square mile (17.7/km2). There were 5,541 housing units at an average density of 19.4 per square mile (7.5/km2). The racial makeup of the county was 68.2% White, 28.3% Black or African American, 0.3% Native American, 0.5% Asian, 0.1% Pacific Islander, 1.2% from other races, and 1.5% from two or more races. 2.7% of the population were Hispanic or Latino of any race.
There were 4,845 households, out of which 33.2% had children under the age of 18 living with them, 51.2% were married couples living together, 15.3% had a female householder with no husband present, and 28.7% were non-families. 24.7% of all households were made up of individuals, and 10.7% had someone living alone who was 65 years of age or older. The average household size was 2.60 and the average family size was 3.09.
In the county, the population was spread out, with 25.7% under the age of 18, 8.7% from 18 to 24, 27.2% from 25 to 44, 24.2% from 45 to 64, and 14.2% who were 65 years of age or older. The median age was 37 years. For every 100 females, there were 93.2 males. For every 100 females age 18 and over, there were 89.7 males.
The median income for a household in the county was $32,845, and the median income for a family was $39,845. Males had a median income of $30,917 versus $21,917 for females. The per capita income for the county was $16,845. About 14.2% of families and 17.7% of the population were below the poverty line, including 24.2% of those under age 18 and 16.2% of those age 65 or over.
Common Questions
What is Per Capita Income in Bleckley County?
Per Capita income in Bleckley County is $28,207.
What is the Median Family Income in Bleckley County?
Median Family Income in Bleckley County is $62,701.
What is the Median Household income in Bleckley County?
Median Household Income in Bleckley County is $56,021.
What is Income or Wage Gap in Bleckley County?
Income or Wage Gap in Bleckley County is 30.5%.
Women in Bleckley County earn 69.5 cents for every dollar earned by a man.
What is Inequality or Gini Index in Bleckley County?
Inequality or Gini Index in Bleckley County is 0.47.
What is the Total Population of Bleckley County?
Total Population of Bleckley County is 12,413.
What is the Total Male Population of Bleckley County?
Total Male Population of Bleckley County is 6,042.
What is the Total Female Population of Bleckley County?
Total Female Population of Bleckley County is 6,371.
What is the Ratio of Males per 100 Females in Bleckley County?
There are 94.84 Males per 100 Females in Bleckley County.
What is the Ratio of Females per 100 Males in Bleckley County?
There are 105.45 Females per 100 Males in Bleckley County.
What is the Median Population Age in Bleckley County?
Median Population Age in Bleckley County is 37.7 Years.
What is the Average Family Size in Bleckley County
Average Family Size in Bleckley County is 3.1 People.
What is the Average Household Size in Bleckley County
Average Household Size in Bleckley County is 2.6 People.
How Large is the Labor Force in Bleckley County?
There are 5,338 People in the Labor Forcein in Bleckley County.
What is the Percentage of People in the Labor Force in Bleckley County?
51.3% of People are in the Labor Force in Bleckley County.
What is the Unemployment Rate in Bleckley County?
Unemployment Rate in Bleckley County is 6.1%.