Bacon County, GA Map & Demographics
Bacon County Map
Bacon County Overview
$24,654
PER CAPITA INCOME
$56,098
AVG FAMILY INCOME
$43,938
AVG HOUSEHOLD INCOME
3.7%
WAGE / INCOME GAP [ % ]
96.3¢/ $1
WAGE / INCOME GAP [ $ ]
$13,722
FAMILY INCOME DEFICIT
0.49
INEQUALITY / GINI INDEX
11,138
TOTAL POPULATION
5,525
MALE POPULATION
5,613
FEMALE POPULATION
98.43
MALES / 100 FEMALES
101.59
FEMALES / 100 MALES
38.1
MEDIAN AGE
3.3
AVG FAMILY SIZE
2.7
AVG HOUSEHOLD SIZE
4,458
LABOR FORCE [ PEOPLE ]
51.6%
PERCENT IN LABOR FORCE
4.3%
UNEMPLOYMENT RATE
Bacon County Area Codes
Income in Bacon County
Income Overview in Bacon County
Per Capita Income in Bacon County is $24,654, while median incomes of families and households are $56,098 and $43,938 respectively.
| Characteristic | Number | Measure |
| Per Capita Income | 11,138 | $24,654 |
| Median Family Income | 2,573 | $56,098 |
| Mean Family Income | 2,573 | $78,175 |
| Median Household Income | 3,909 | $43,938 |
| Mean Household Income | 3,909 | $64,535 |
| Income Deficit | 2,573 | $13,722 |
| Wage / Income Gap (%) | 11,138 | 3.73% |
| Wage / Income Gap ($) | 11,138 | 96.27¢ per $1 |
| Gini / Inequality Index | 11,138 | 0.49 |
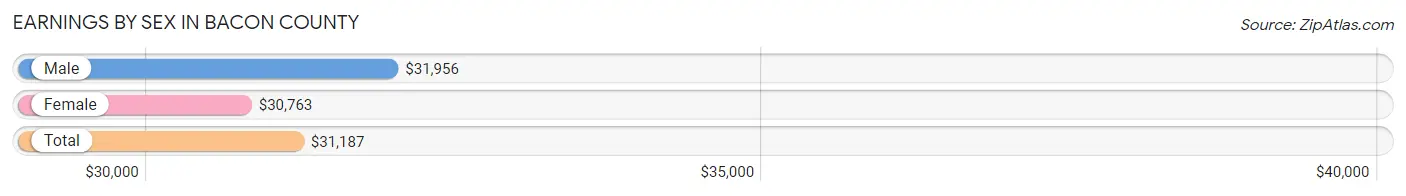
Earnings by Sex in Bacon County
Average Earnings in Bacon County are $31,187, $31,956 for men and $30,763 for women, a difference of 3.7%.
| Sex | Number | Average Earnings |
| Male | 2,635 (54.4%) | $31,956 |
| Female | 2,204 (45.6%) | $30,763 |
| Total | 4,839 (100.0%) | $31,187 |
Earnings by Sex by Income Bracket in Bacon County
The most common earnings brackets in Bacon County are $100,000+ for men (281 | 10.7%) and $30,000 to $34,999 for women (277 | 12.6%).
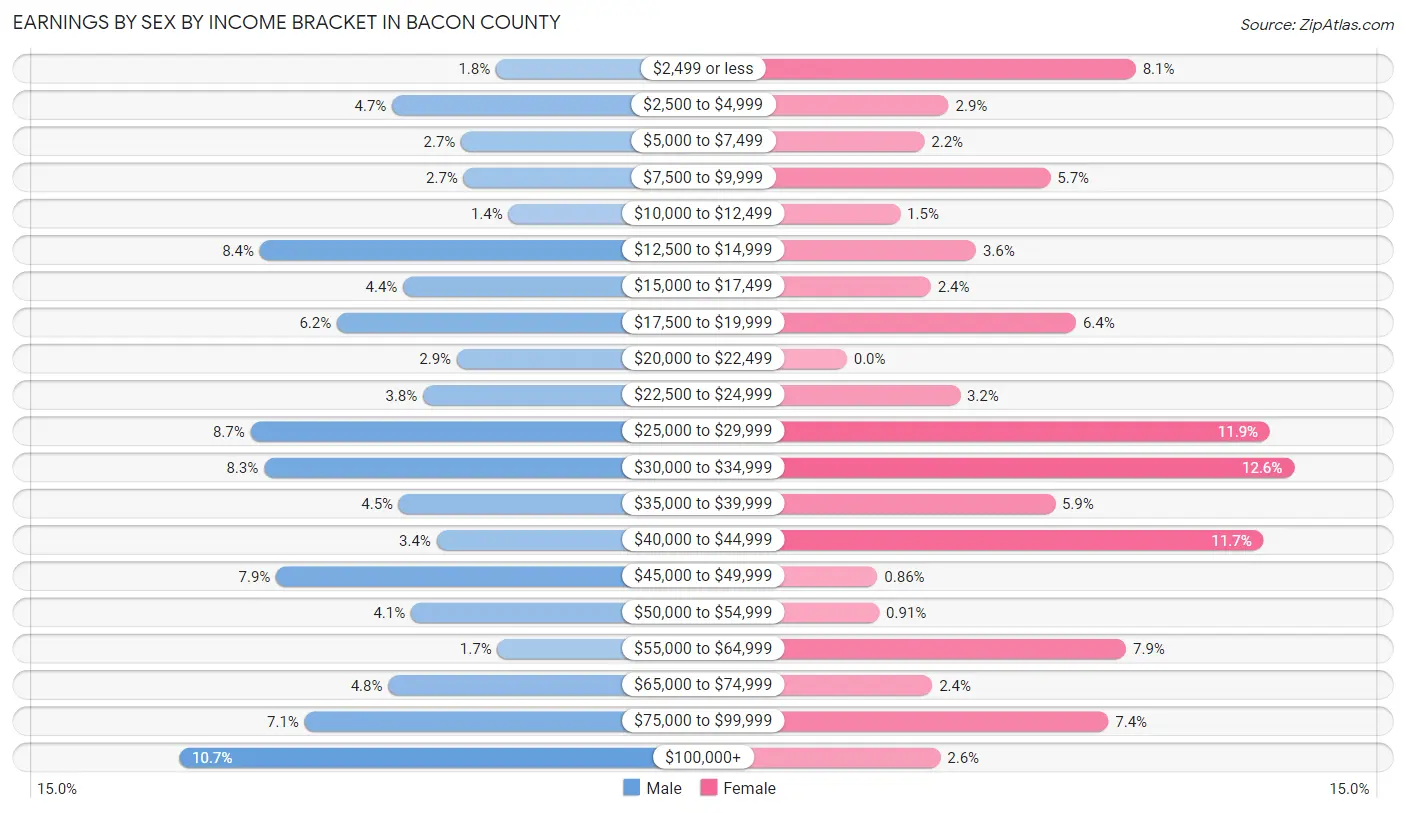
| Income | Male | Female |
| $2,499 or less | 46 (1.8%) | 179 (8.1%) |
| $2,500 to $4,999 | 123 (4.7%) | 63 (2.9%) |
| $5,000 to $7,499 | 72 (2.7%) | 48 (2.2%) |
| $7,500 to $9,999 | 70 (2.7%) | 126 (5.7%) |
| $10,000 to $12,499 | 37 (1.4%) | 33 (1.5%) |
| $12,500 to $14,999 | 221 (8.4%) | 80 (3.6%) |
| $15,000 to $17,499 | 115 (4.4%) | 52 (2.4%) |
| $17,500 to $19,999 | 164 (6.2%) | 142 (6.4%) |
| $20,000 to $22,499 | 75 (2.9%) | 0 (0.0%) |
| $22,500 to $24,999 | 100 (3.8%) | 70 (3.2%) |
| $25,000 to $29,999 | 228 (8.6%) | 262 (11.9%) |
| $30,000 to $34,999 | 218 (8.3%) | 277 (12.6%) |
| $35,000 to $39,999 | 118 (4.5%) | 129 (5.9%) |
| $40,000 to $44,999 | 90 (3.4%) | 258 (11.7%) |
| $45,000 to $49,999 | 209 (7.9%) | 19 (0.9%) |
| $50,000 to $54,999 | 109 (4.1%) | 20 (0.9%) |
| $55,000 to $64,999 | 45 (1.7%) | 173 (7.9%) |
| $65,000 to $74,999 | 126 (4.8%) | 53 (2.4%) |
| $75,000 to $99,999 | 188 (7.1%) | 162 (7.3%) |
| $100,000+ | 281 (10.7%) | 58 (2.6%) |
| Total | 2,635 (100.0%) | 2,204 (100.0%) |
Earnings by Sex by Educational Attainment in Bacon County
Average earnings in Bacon County are $38,289 for men and $33,191 for women, a difference of 13.3%. Men with an educational attainment of graduate degree enjoy the highest average annual earnings of $65,714, while those with less than high school education earn the least with $18,324. Women with an educational attainment of graduate degree earn the most with the average annual earnings of $73,125, while those with less than high school education have the smallest earnings of $24,573.
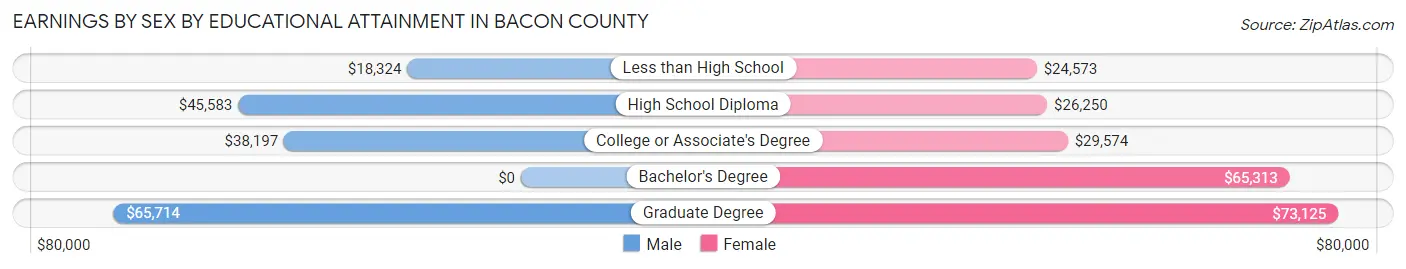
| Educational Attainment | Male Income | Female Income |
| Less than High School | $18,324 | $24,573 |
| High School Diploma | $45,583 | $26,250 |
| College or Associate's Degree | $38,197 | $29,574 |
| Bachelor's Degree | - | - |
| Graduate Degree | $65,714 | $73,125 |
| Total | $38,289 | $33,191 |
Family Income in Bacon County
Family Income Brackets in Bacon County
According to the Bacon County family income data, there are 458 families falling into the $50,000 to $74,999 income range, which is the most common income bracket and makes up 17.8% of all families. Conversely, the $10,000 to $14,999 income bracket is the least frequent group with only 54 families (2.1%) belonging to this category.
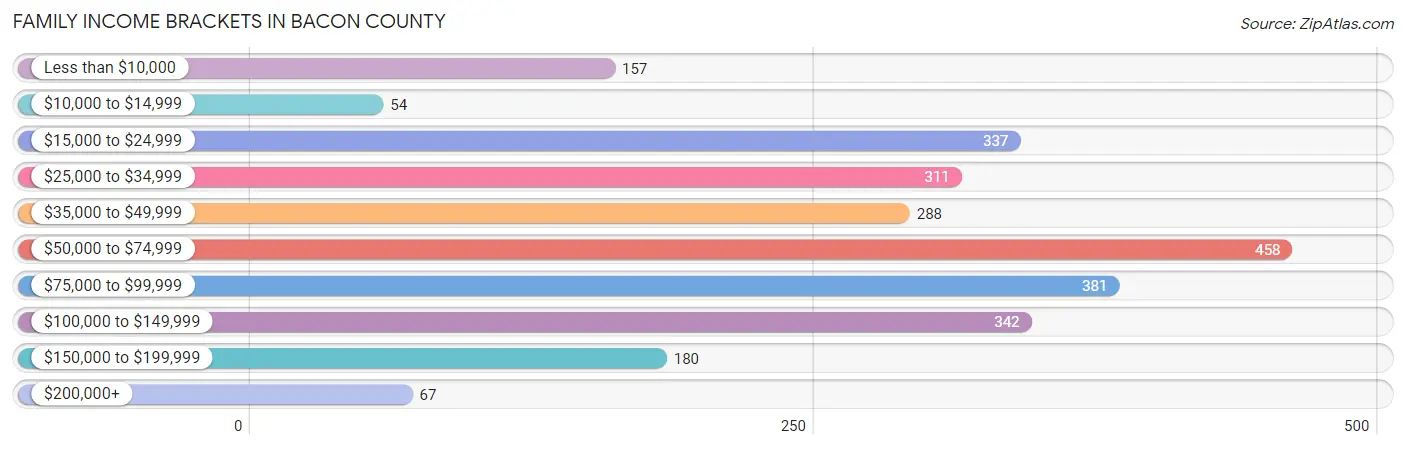
| Income Bracket | # Families | % Families |
| Less than $10,000 | 157 | 6.1% |
| $10,000 to $14,999 | 54 | 2.1% |
| $15,000 to $24,999 | 337 | 13.1% |
| $25,000 to $34,999 | 311 | 12.1% |
| $35,000 to $49,999 | 288 | 11.2% |
| $50,000 to $74,999 | 458 | 17.8% |
| $75,000 to $99,999 | 381 | 14.8% |
| $100,000 to $149,999 | 342 | 13.3% |
| $150,000 to $199,999 | 180 | 7.0% |
| $200,000+ | 67 | 2.6% |
Family Income by Famaliy Size in Bacon County
4-person families (571 | 22.2%) account for the highest median family income in Bacon County with $80,938 per family, while 2-person families (1,113 | 43.3%) have the highest median income of $23,166 per family member.
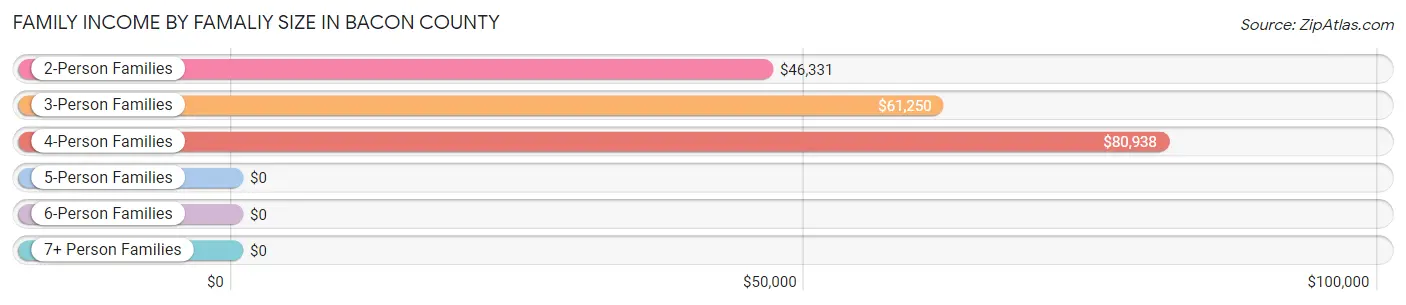
| Income Bracket | # Families | Median Income |
| 2-Person Families | 1,113 (43.3%) | $46,331 |
| 3-Person Families | 629 (24.4%) | $61,250 |
| 4-Person Families | 571 (22.2%) | $80,938 |
| 5-Person Families | 233 (9.1%) | $0 |
| 6-Person Families | 27 (1.1%) | $0 |
| 7+ Person Families | 0 (0.0%) | $0 |
| Total | 2,573 (100.0%) | $56,098 |
Family Income by Number of Earners in Bacon County
The median family income in Bacon County is $56,098, with families comprising 3+ earners (119) having the highest median family income of $108,681, while families with 1 earner (1,201) have the lowest median family income of $35,647, accounting for 4.6% and 46.7% of families, respectively.
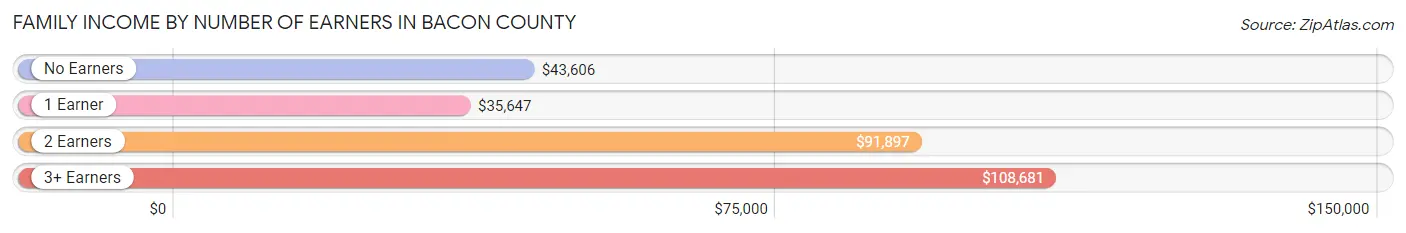
| Number of Earners | # Families | Median Income |
| No Earners | 327 (12.7%) | $43,606 |
| 1 Earner | 1,201 (46.7%) | $35,647 |
| 2 Earners | 926 (36.0%) | $91,897 |
| 3+ Earners | 119 (4.6%) | $108,681 |
| Total | 2,573 (100.0%) | $56,098 |
Household Income in Bacon County
Household Income Brackets in Bacon County
With 672 households falling in the category, the $50,000 to $74,999 income range is the most frequent in Bacon County, accounting for 17.2% of all households. In contrast, only 82 households (2.1%) fall into the $200,000+ income bracket, making it the least populous group.
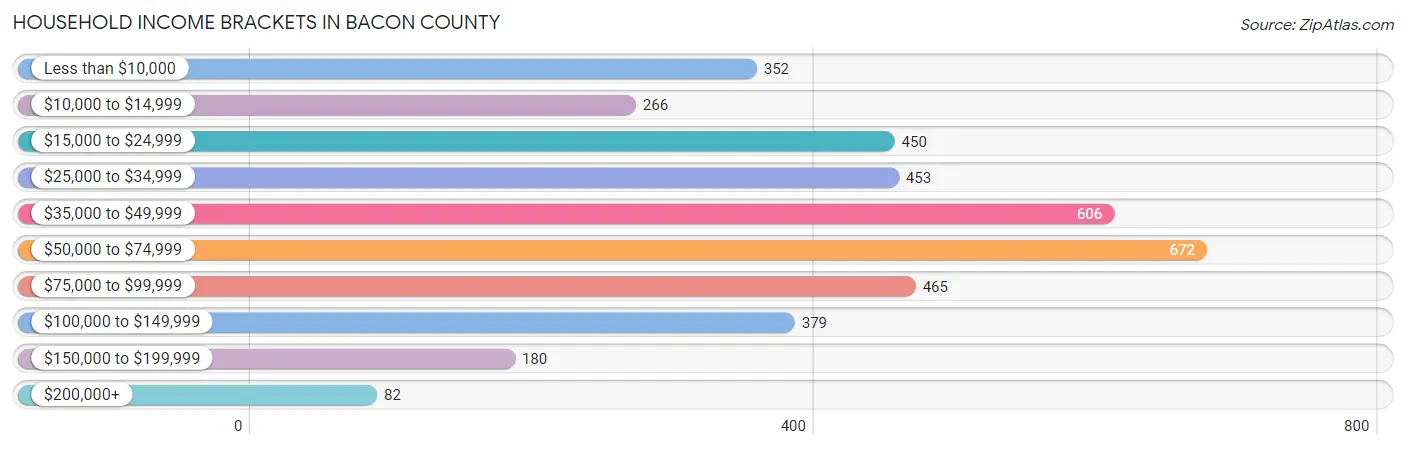
| Income Bracket | # Households | % Households |
| Less than $10,000 | 352 | 9.0% |
| $10,000 to $14,999 | 266 | 6.8% |
| $15,000 to $24,999 | 450 | 11.5% |
| $25,000 to $34,999 | 453 | 11.6% |
| $35,000 to $49,999 | 606 | 15.5% |
| $50,000 to $74,999 | 672 | 17.2% |
| $75,000 to $99,999 | 465 | 11.9% |
| $100,000 to $149,999 | 379 | 9.7% |
| $150,000 to $199,999 | 180 | 4.6% |
| $200,000+ | 82 | 2.1% |
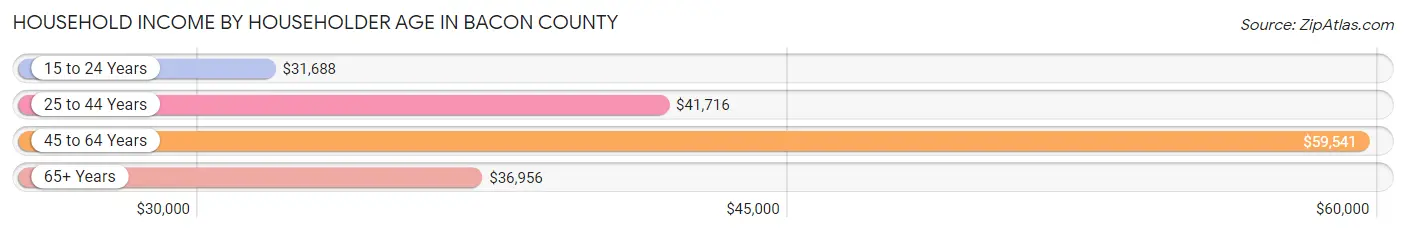
Household Income by Householder Age in Bacon County
The median household income in Bacon County is $43,938, with the highest median household income of $59,541 found in the 45 to 64 years age bracket for the primary householder. A total of 1,298 households (33.2%) fall into this category. Meanwhile, the 15 to 24 years age bracket for the primary householder has the lowest median household income of $31,688, with 140 households (3.6%) in this group.
| Income Bracket | # Households | Median Income |
| 15 to 24 Years | 140 (3.6%) | $31,688 |
| 25 to 44 Years | 1,236 (31.6%) | $41,716 |
| 45 to 64 Years | 1,298 (33.2%) | $59,541 |
| 65+ Years | 1,235 (31.6%) | $36,956 |
| Total | 3,909 (100.0%) | $43,938 |
Poverty in Bacon County
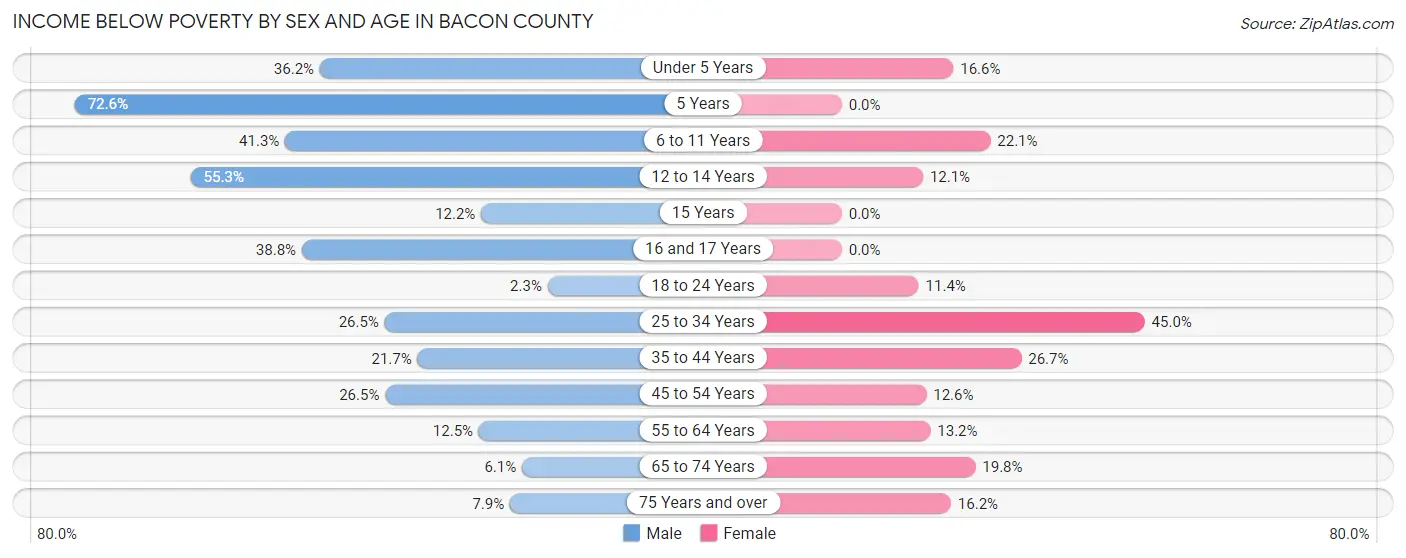
Income Below Poverty by Sex and Age in Bacon County
With 23.2% poverty level for males and 20.2% for females among the residents of Bacon County, 5 year old males and 25 to 34 year old females are the most vulnerable to poverty, with 74 males (72.6%) and 304 females (45.0%) in their respective age groups living below the poverty level.
| Age Bracket | Male | Female |
| Under 5 Years | 167 (36.1%) | 51 (16.6%) |
| 5 Years | 74 (72.6%) | 0 (0.0%) |
| 6 to 11 Years | 183 (41.3%) | 137 (22.1%) |
| 12 to 14 Years | 114 (55.3%) | 20 (12.0%) |
| 15 Years | 10 (12.2%) | 0 (0.0%) |
| 16 and 17 Years | 66 (38.8%) | 0 (0.0%) |
| 18 to 24 Years | 11 (2.3%) | 43 (11.4%) |
| 25 to 34 Years | 100 (26.5%) | 304 (45.0%) |
| 35 to 44 Years | 126 (21.6%) | 210 (26.7%) |
| 45 to 54 Years | 173 (26.5%) | 88 (12.6%) |
| 55 to 64 Years | 76 (12.5%) | 89 (13.2%) |
| 65 to 74 Years | 35 (6.1%) | 118 (19.8%) |
| 75 Years and over | 19 (7.9%) | 64 (16.2%) |
| Total | 1,154 (23.2%) | 1,124 (20.2%) |
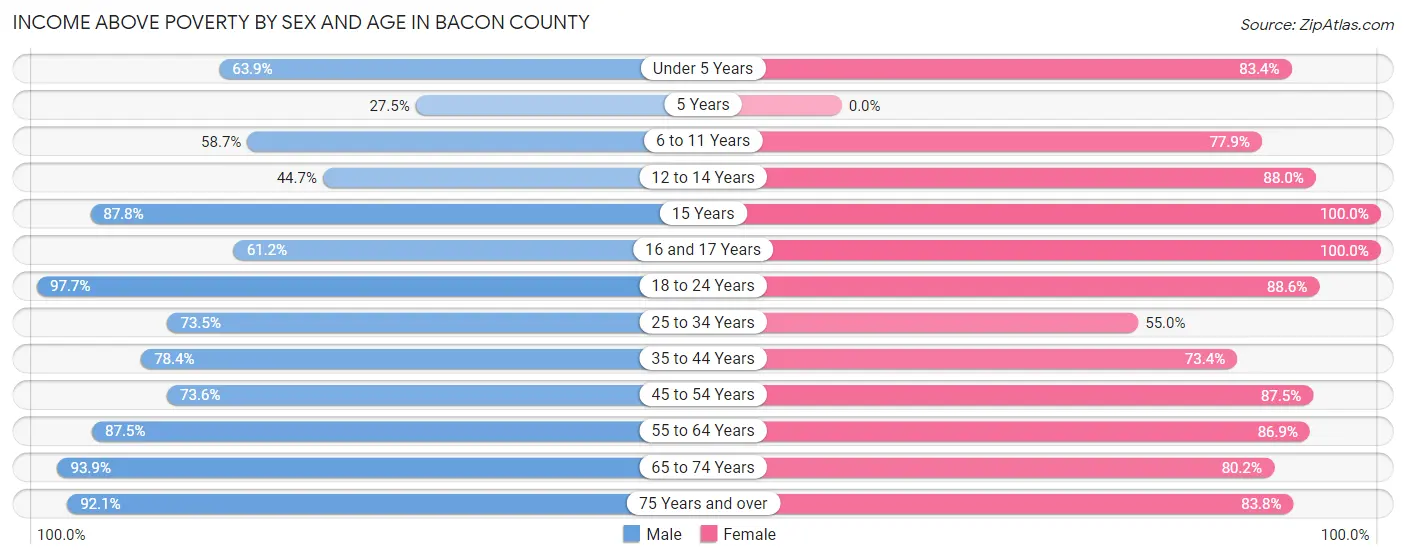
Income Above Poverty by Sex and Age in Bacon County
According to the poverty statistics in Bacon County, males aged 18 to 24 years and females aged 15 years are the age groups that are most secure financially, with 97.7% of males and 100.0% of females in these age groups living above the poverty line.
| Age Bracket | Male | Female |
| Under 5 Years | 295 (63.8%) | 257 (83.4%) |
| 5 Years | 28 (27.5%) | 0 (0.0%) |
| 6 to 11 Years | 260 (58.7%) | 484 (77.9%) |
| 12 to 14 Years | 92 (44.7%) | 146 (87.9%) |
| 15 Years | 72 (87.8%) | 74 (100.0%) |
| 16 and 17 Years | 104 (61.2%) | 180 (100.0%) |
| 18 to 24 Years | 464 (97.7%) | 334 (88.6%) |
| 25 to 34 Years | 277 (73.5%) | 372 (55.0%) |
| 35 to 44 Years | 456 (78.3%) | 578 (73.4%) |
| 45 to 54 Years | 481 (73.6%) | 613 (87.5%) |
| 55 to 64 Years | 530 (87.5%) | 588 (86.9%) |
| 65 to 74 Years | 536 (93.9%) | 477 (80.2%) |
| 75 Years and over | 221 (92.1%) | 331 (83.8%) |
| Total | 3,816 (76.8%) | 4,434 (79.8%) |
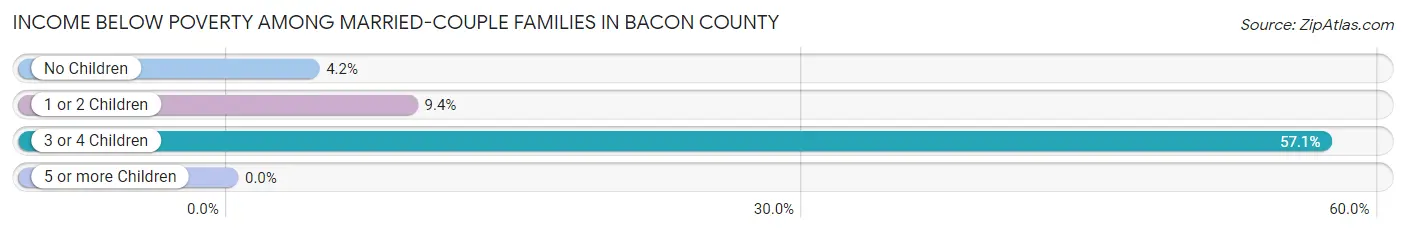
Income Below Poverty Among Married-Couple Families in Bacon County
The poverty statistics for married-couple families in Bacon County show that 10.5% or 183 of the total 1,736 families live below the poverty line. Families with 3 or 4 children have the highest poverty rate of 57.1%, comprising of 88 families. On the other hand, families with no children have the lowest poverty rate of 4.2%, which includes 44 families.
| Children | Above Poverty | Below Poverty |
| No Children | 994 (95.8%) | 44 (4.2%) |
| 1 or 2 Children | 493 (90.6%) | 51 (9.4%) |
| 3 or 4 Children | 66 (42.9%) | 88 (57.1%) |
| 5 or more Children | 0 (0.0%) | 0 (0.0%) |
| Total | 1,553 (89.5%) | 183 (10.5%) |
Income Below Poverty Among Single-Parent Households in Bacon County
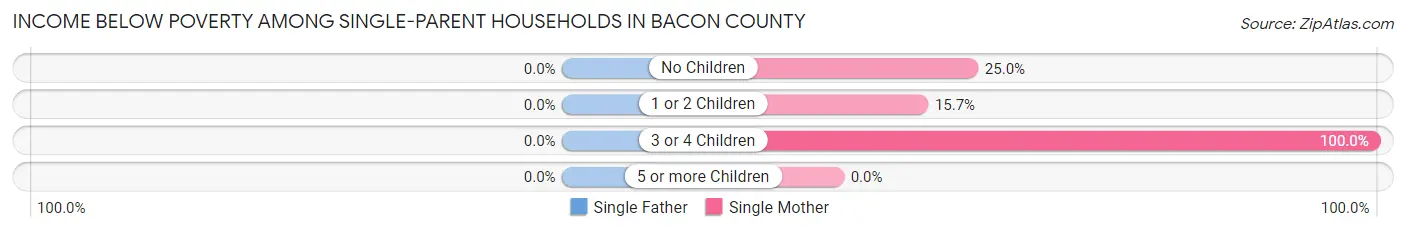
| Children | Single Father | Single Mother |
| No Children | 0 (0.0%) | 29 (25.0%) |
| 1 or 2 Children | 0 (0.0%) | 57 (15.7%) |
| 3 or 4 Children | 0 (0.0%) | 92 (100.0%) |
| 5 or more Children | 0 (0.0%) | 0 (0.0%) |
| Total | 0 (0.0%) | 178 (31.2%) |
Income Below Poverty Among Married-Couple vs Single-Parent Households in Bacon County
The poverty data for Bacon County shows that 183 of the married-couple family households (10.5%) and 178 of the single-parent households (21.3%) are living below the poverty level. Within the married-couple family households, those with 3 or 4 children have the highest poverty rate, with 88 households (57.1%) falling below the poverty line. Among the single-parent households, those with 3 or 4 children have the highest poverty rate, with 92 household (57.9%) living below poverty.
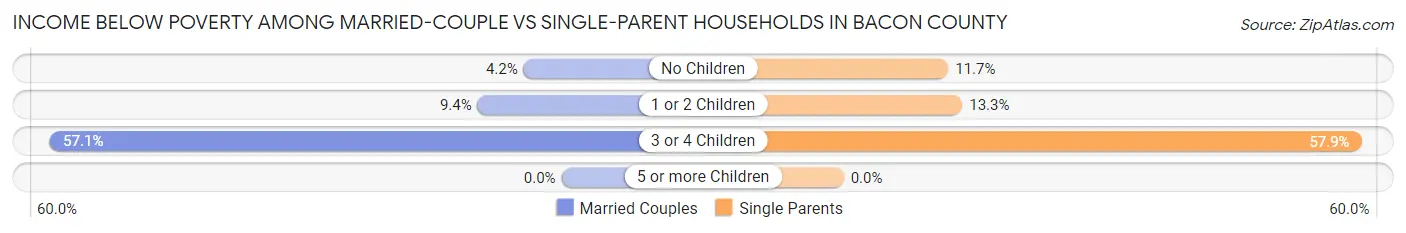
| Children | Married-Couple Families | Single-Parent Households |
| No Children | 44 (4.2%) | 29 (11.7%) |
| 1 or 2 Children | 51 (9.4%) | 57 (13.3%) |
| 3 or 4 Children | 88 (57.1%) | 92 (57.9%) |
| 5 or more Children | 0 (0.0%) | 0 (0.0%) |
| Total | 183 (10.5%) | 178 (21.3%) |
Race in Bacon County
The most populous races in Bacon County are White / Caucasian (8,229 | 73.9%), Black / African American (1,679 | 15.1%), and Hispanic or Latino (968 | 8.7%).
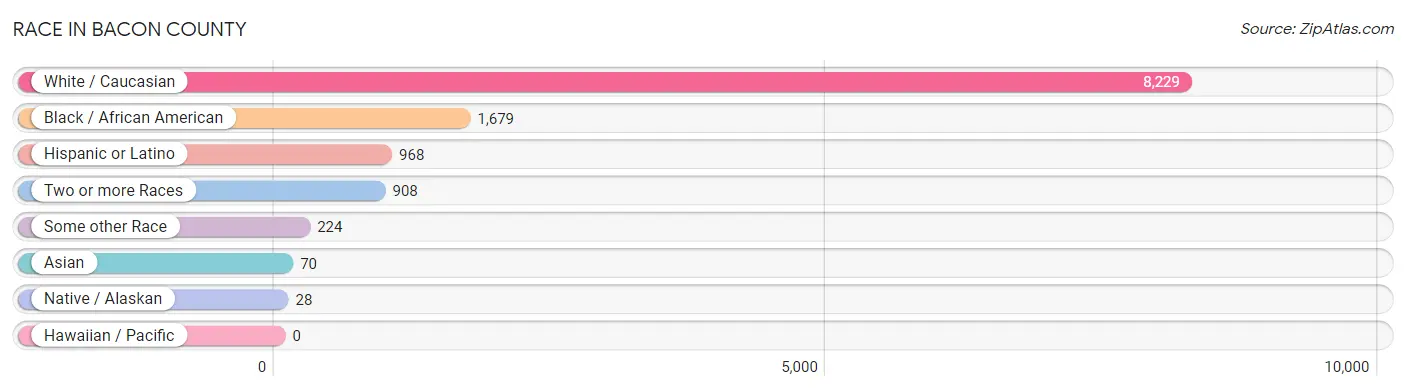
| Race | # Population | % Population |
| Asian | 70 | 0.6% |
| Black / African American | 1,679 | 15.1% |
| Hawaiian / Pacific | 0 | 0.0% |
| Hispanic or Latino | 968 | 8.7% |
| Native / Alaskan | 28 | 0.3% |
| White / Caucasian | 8,229 | 73.9% |
| Two or more Races | 908 | 8.2% |
| Some other Race | 224 | 2.0% |
| Total | 11,138 | 100.0% |
Ancestry in Bacon County
The most populous ancestries reported in Bacon County are Irish (1,029 | 9.2%), Mexican (778 | 7.0%), English (752 | 6.8%), American (710 | 6.4%), and German (565 | 5.1%), together accounting for 34.4% of all Bacon County residents.
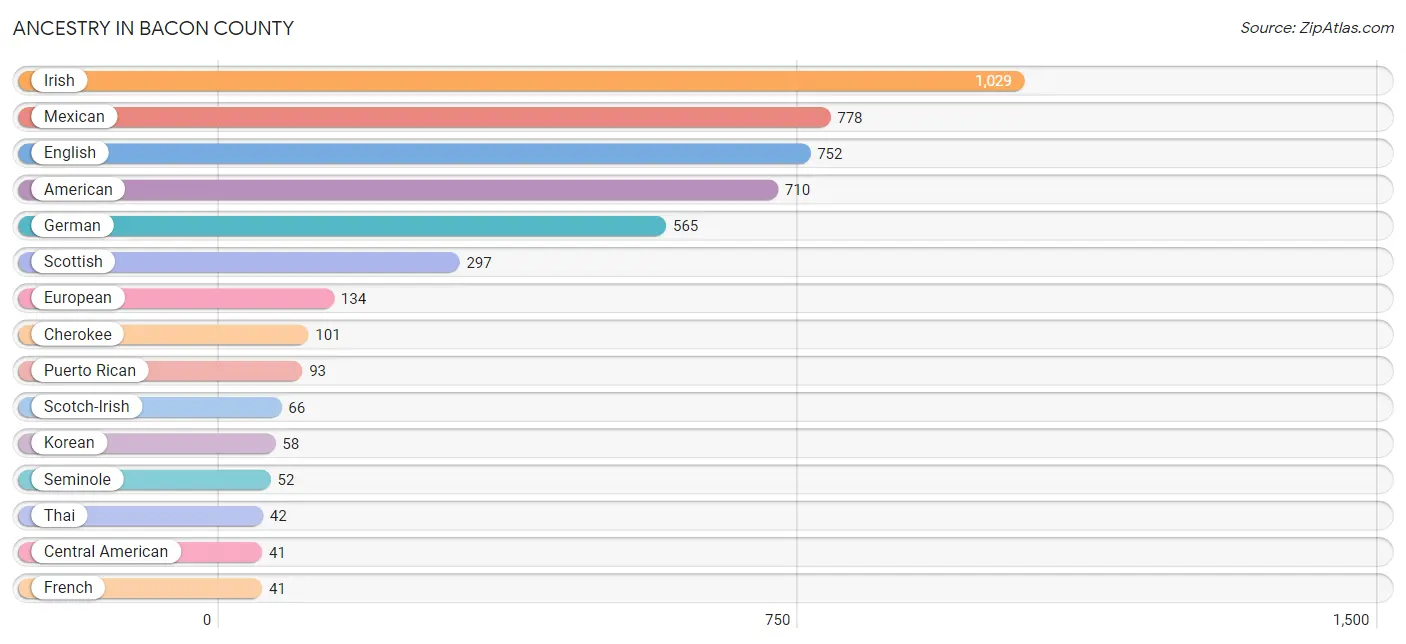
| Ancestry | # Population | % Population |
| African | 1 | 0.0% |
| Alaskan Athabascan | 1 | 0.0% |
| American | 710 | 6.4% |
| Bhutanese | 8 | 0.1% |
| British | 26 | 0.2% |
| Burmese | 6 | 0.1% |
| Central American | 41 | 0.4% |
| Central American Indian | 28 | 0.3% |
| Cherokee | 101 | 0.9% |
| English | 752 | 6.8% |
| European | 134 | 1.2% |
| French | 41 | 0.4% |
| French Canadian | 11 | 0.1% |
| German | 565 | 5.1% |
| Honduran | 28 | 0.3% |
| Irish | 1,029 | 9.2% |
| Jamaican | 10 | 0.1% |
| Korean | 58 | 0.5% |
| Mexican | 778 | 7.0% |
| Portuguese | 21 | 0.2% |
| Puerto Rican | 93 | 0.8% |
| Salvadoran | 13 | 0.1% |
| Scandinavian | 10 | 0.1% |
| Scotch-Irish | 66 | 0.6% |
| Scottish | 297 | 2.7% |
| Seminole | 52 | 0.5% |
| Spaniard | 20 | 0.2% |
| Sri Lankan | 7 | 0.1% |
| Subsaharan African | 1 | 0.0% |
| Swedish | 5 | 0.0% |
| Swiss | 21 | 0.2% |
| Thai | 42 | 0.4% |
| Welsh | 11 | 0.1% |
| West Indian | 13 | 0.1% | View All 34 Rows |
Immigrants in Bacon County
The most numerous immigrant groups reported in Bacon County came from Latin America (309 | 2.8%), Central America (306 | 2.8%), Mexico (265 | 2.4%), Asia (70 | 0.6%), and India (42 | 0.4%), together accounting for 8.9% of all Bacon County residents.
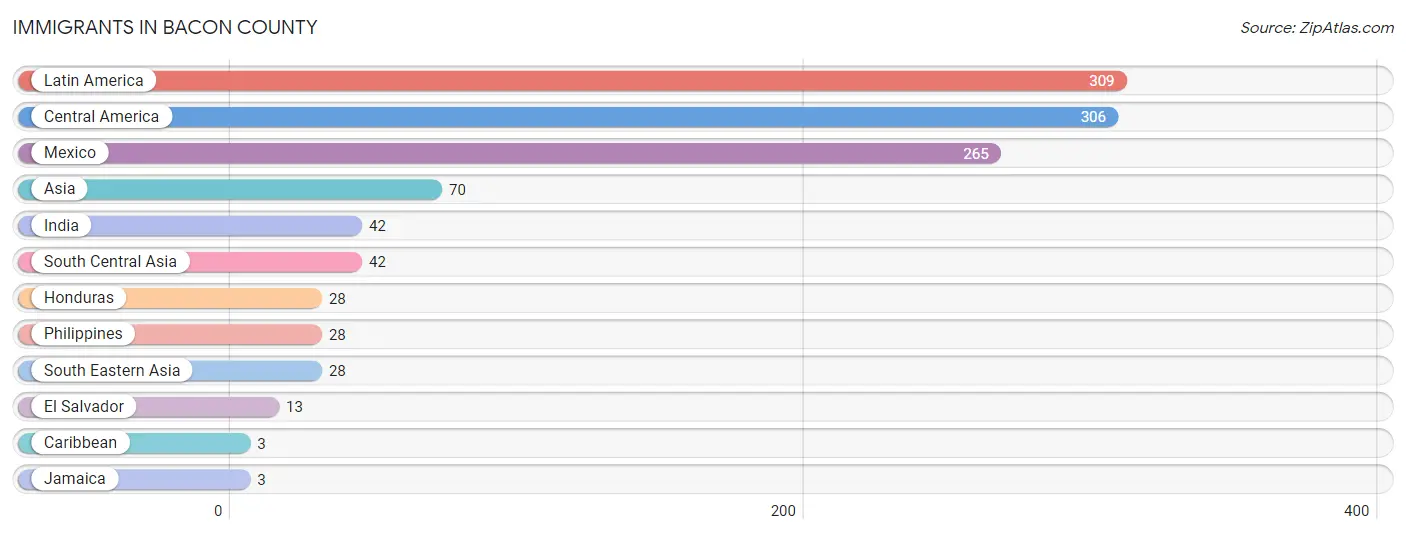
| Immigration Origin | # Population | % Population |
| Asia | 70 | 0.6% |
| Caribbean | 3 | 0.0% |
| Central America | 306 | 2.8% |
| El Salvador | 13 | 0.1% |
| Honduras | 28 | 0.3% |
| India | 42 | 0.4% |
| Jamaica | 3 | 0.0% |
| Latin America | 309 | 2.8% |
| Mexico | 265 | 2.4% |
| Philippines | 28 | 0.3% |
| South Central Asia | 42 | 0.4% |
| South Eastern Asia | 28 | 0.3% | View All 12 Rows |
Sex and Age in Bacon County
Sex and Age in Bacon County
The most populous age groups in Bacon County are 15 to 19 Years (482 | 8.7%) for men and 5 to 9 Years (535 | 9.5%) for women.
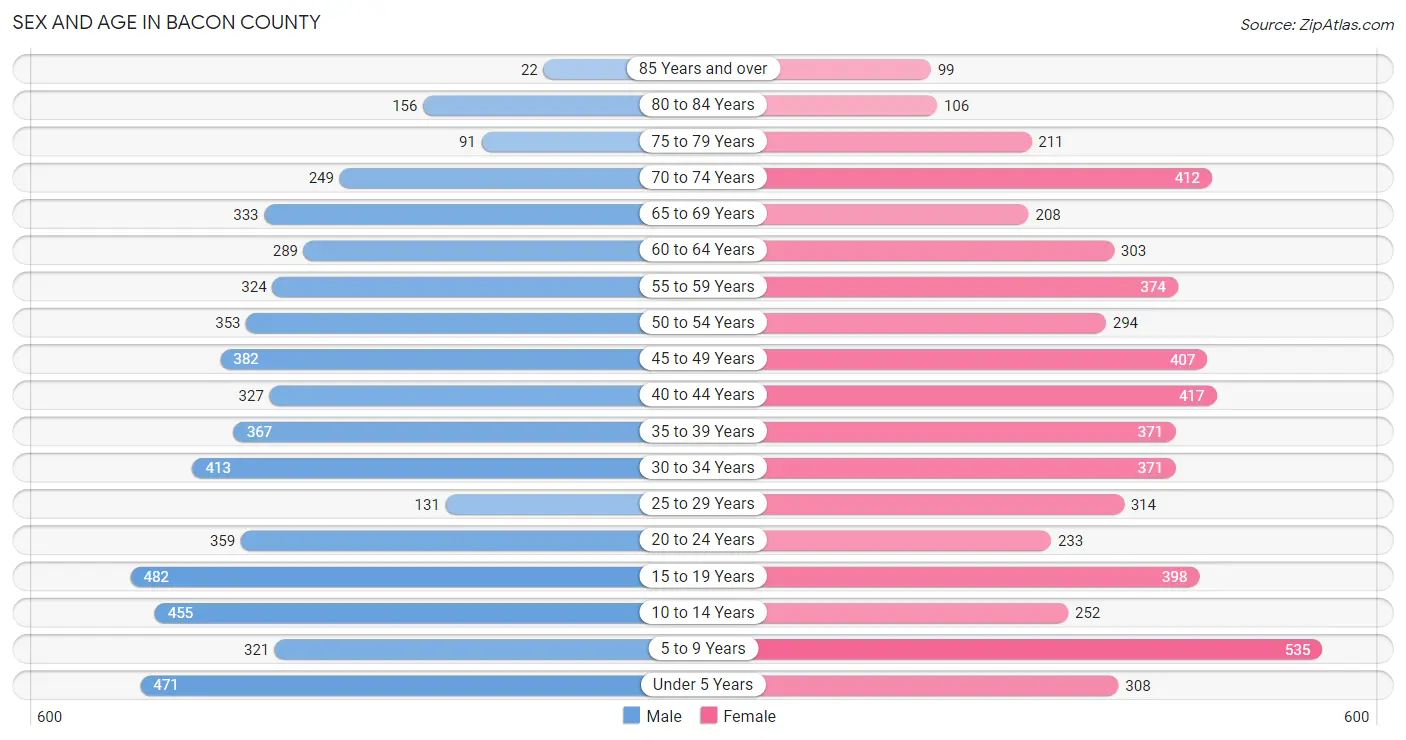
| Age Bracket | Male | Female |
| Under 5 Years | 471 (8.5%) | 308 (5.5%) |
| 5 to 9 Years | 321 (5.8%) | 535 (9.5%) |
| 10 to 14 Years | 455 (8.2%) | 252 (4.5%) |
| 15 to 19 Years | 482 (8.7%) | 398 (7.1%) |
| 20 to 24 Years | 359 (6.5%) | 233 (4.2%) |
| 25 to 29 Years | 131 (2.4%) | 314 (5.6%) |
| 30 to 34 Years | 413 (7.5%) | 371 (6.6%) |
| 35 to 39 Years | 367 (6.6%) | 371 (6.6%) |
| 40 to 44 Years | 327 (5.9%) | 417 (7.4%) |
| 45 to 49 Years | 382 (6.9%) | 407 (7.2%) |
| 50 to 54 Years | 353 (6.4%) | 294 (5.2%) |
| 55 to 59 Years | 324 (5.9%) | 374 (6.7%) |
| 60 to 64 Years | 289 (5.2%) | 303 (5.4%) |
| 65 to 69 Years | 333 (6.0%) | 208 (3.7%) |
| 70 to 74 Years | 249 (4.5%) | 412 (7.3%) |
| 75 to 79 Years | 91 (1.7%) | 211 (3.8%) |
| 80 to 84 Years | 156 (2.8%) | 106 (1.9%) |
| 85 Years and over | 22 (0.4%) | 99 (1.8%) |
| Total | 5,525 (100.0%) | 5,613 (100.0%) |
Families and Households in Bacon County
Median Family Size in Bacon County
The median family size in Bacon County is 3.31 persons per family, with single male/father families (266 | 10.3%) accounting for the largest median family size of 3.33 persons per family. On the other hand, single female/mother families (571 | 22.2%) represent the smallest median family size with 3.29 persons per family.
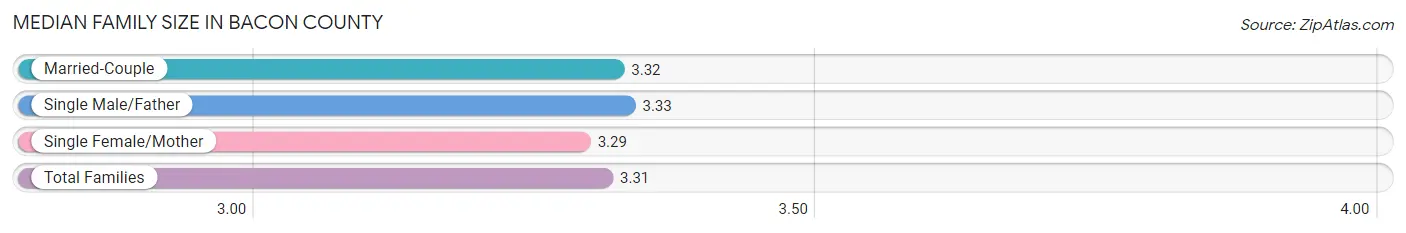
| Family Type | # Families | Family Size |
| Married-Couple | 1,736 (67.5%) | 3.32 |
| Single Male/Father | 266 (10.3%) | 3.33 |
| Single Female/Mother | 571 (22.2%) | 3.29 |
| Total Families | 2,573 (100.0%) | 3.31 |
Median Household Size in Bacon County
The median household size in Bacon County is 2.70 persons per household, with single male/father households (266 | 6.8%) accounting for the largest median household size of 4.17 persons per household. non-family households (1,336 | 34.2%) represent the smallest median household size with 1.27 persons per household.
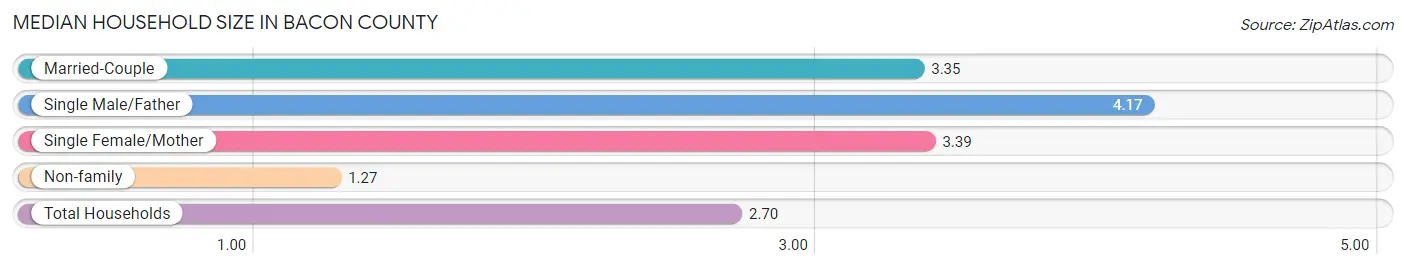
| Household Type | # Households | Household Size |
| Married-Couple | 1,736 (44.4%) | 3.35 |
| Single Male/Father | 266 (6.8%) | 4.17 |
| Single Female/Mother | 571 (14.6%) | 3.39 |
| Non-family | 1,336 (34.2%) | 1.27 |
| Total Households | 3,909 (100.0%) | 2.70 |
Household Size by Marriage Status in Bacon County
Out of a total of 3,909 households in Bacon County, 2,573 (65.8%) are family households, while 1,336 (34.2%) are nonfamily households. The most numerous type of family households are 2-person households, comprising 1,067, and the most common type of nonfamily households are 1-person households, comprising 1,134.
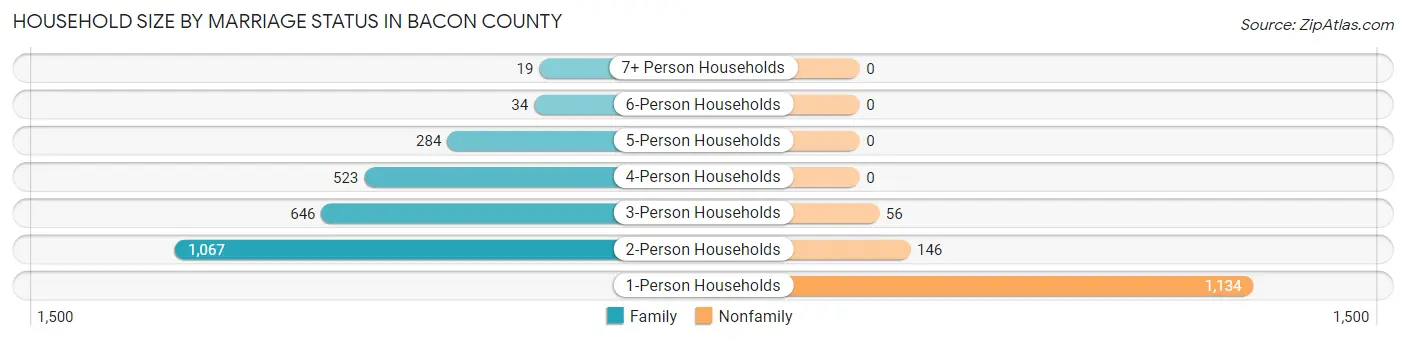
| Household Size | Family Households | Nonfamily Households |
| 1-Person Households | - | 1,134 (29.0%) |
| 2-Person Households | 1,067 (27.3%) | 146 (3.7%) |
| 3-Person Households | 646 (16.5%) | 56 (1.4%) |
| 4-Person Households | 523 (13.4%) | 0 (0.0%) |
| 5-Person Households | 284 (7.3%) | 0 (0.0%) |
| 6-Person Households | 34 (0.9%) | 0 (0.0%) |
| 7+ Person Households | 19 (0.5%) | 0 (0.0%) |
| Total | 2,573 (65.8%) | 1,336 (34.2%) |
Female Fertility in Bacon County
Fertility by Age in Bacon County
Average fertility rate in Bacon County is 45.0 births per 1,000 women. Women in the age bracket of 20 to 34 years have the highest fertility rate with 90.0 births per 1,000 women. Women in the age bracket of 20 to 34 years acount for 73.5% of all women with births.
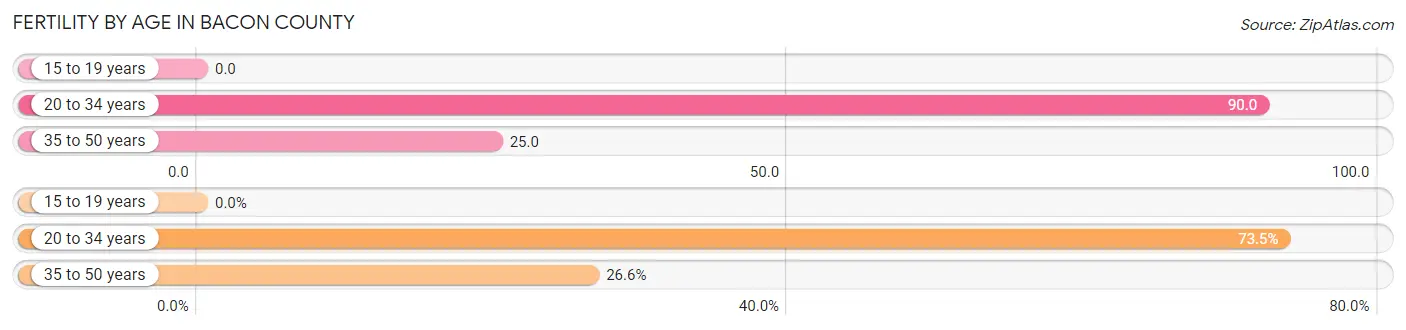
| Age Bracket | Women with Births | Births / 1,000 Women |
| 15 to 19 years | 0 (0.0%) | 0.0 |
| 20 to 34 years | 83 (73.5%) | 90.0 |
| 35 to 50 years | 30 (26.6%) | 25.0 |
| Total | 113 (100.0%) | 45.0 |
Fertility by Age by Marriage Status in Bacon County
68.1% of women with births (113) in Bacon County are married. The highest percentage of unmarried women with births falls into 20 to 34 years age bracket with 43.4% of them unmarried at the time of birth, while the lowest percentage of unmarried women with births belong to 35 to 50 years age bracket with 0.0% of them unmarried.
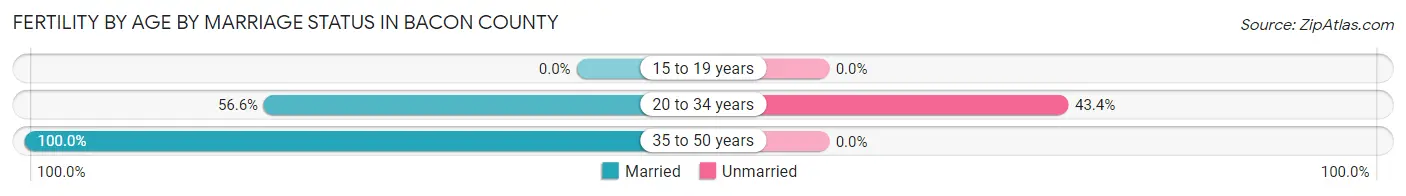
| Age Bracket | Married | Unmarried |
| 15 to 19 years | 0 (0.0%) | 0 (0.0%) |
| 20 to 34 years | 47 (56.6%) | 36 (43.4%) |
| 35 to 50 years | 30 (100.0%) | 0 (0.0%) |
| Total | 77 (68.1%) | 36 (31.9%) |
Fertility by Education in Bacon County
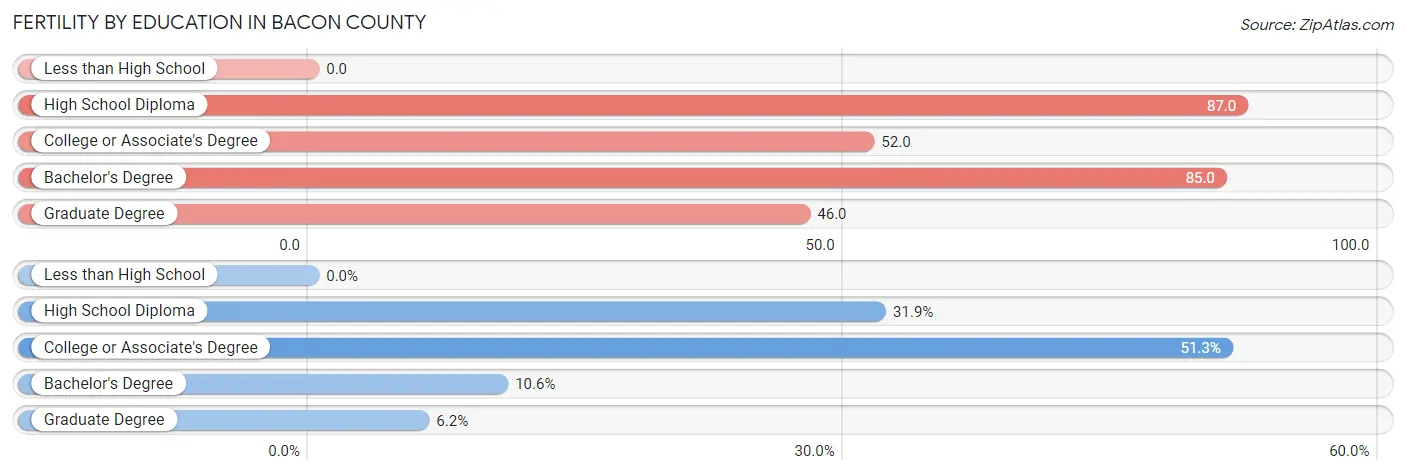
| Educational Attainment | Women with Births | Births / 1,000 Women |
| Less than High School | 0 (0.0%) | 0.0 |
| High School Diploma | 36 (31.9%) | 87.0 |
| College or Associate's Degree | 58 (51.3%) | 52.0 |
| Bachelor's Degree | 12 (10.6%) | 85.0 |
| Graduate Degree | 7 (6.2%) | 46.0 |
| Total | 113 (100.0%) | 45.0 |
Fertility by Education by Marriage Status in Bacon County
31.9% of women with births in Bacon County are unmarried. Women with the educational attainment of college or associate's degree are most likely to be married with 100.0% of them married at childbirth, while women with the educational attainment of high school diploma are least likely to be married with 100.0% of them unmarried at childbirth.
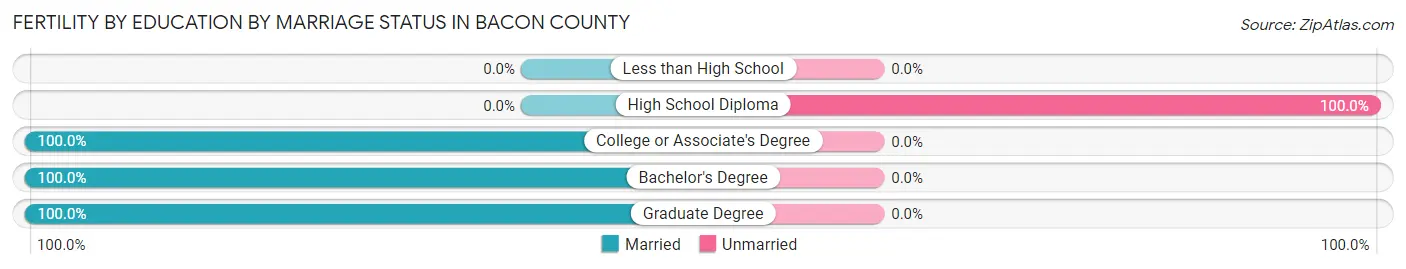
| Educational Attainment | Married | Unmarried |
| Less than High School | 0 (0.0%) | 0 (0.0%) |
| High School Diploma | 0 (0.0%) | 36 (100.0%) |
| College or Associate's Degree | 58 (100.0%) | 0 (0.0%) |
| Bachelor's Degree | 12 (100.0%) | 0 (0.0%) |
| Graduate Degree | 7 (100.0%) | 0 (0.0%) |
| Total | 77 (68.1%) | 36 (31.9%) |
Employment Characteristics in Bacon County
Employment by Class of Employer in Bacon County
Among the 4,213 employed individuals in Bacon County, private company employees (2,836 | 67.3%), local government employees (429 | 10.2%), and state government employees (279 | 6.6%) make up the most common classes of employment.
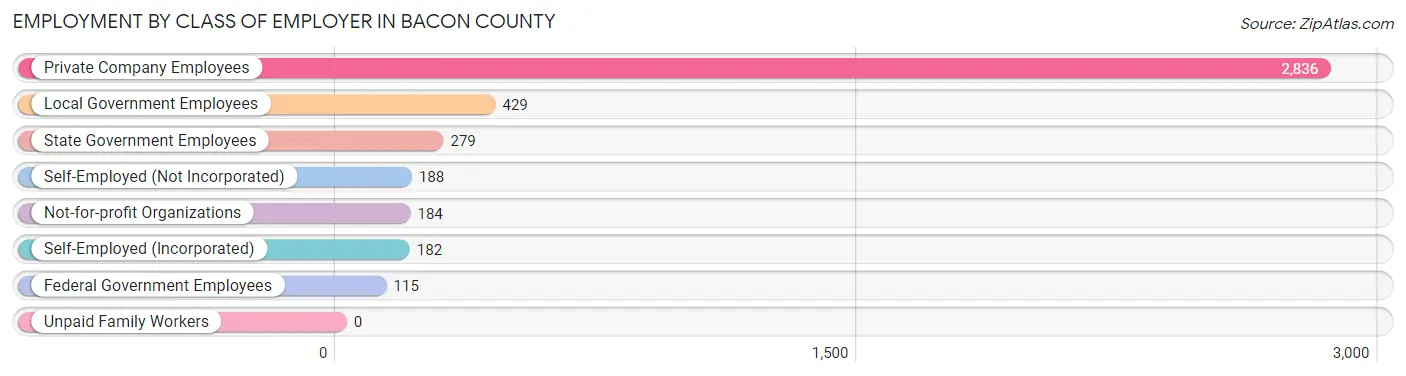
| Employer Class | # Employees | % Employees |
| Private Company Employees | 2,836 | 67.3% |
| Self-Employed (Incorporated) | 182 | 4.3% |
| Self-Employed (Not Incorporated) | 188 | 4.5% |
| Not-for-profit Organizations | 184 | 4.4% |
| Local Government Employees | 429 | 10.2% |
| State Government Employees | 279 | 6.6% |
| Federal Government Employees | 115 | 2.7% |
| Unpaid Family Workers | 0 | 0.0% |
| Total | 4,213 | 100.0% |
Employment Status by Age in Bacon County
According to the labor force statistics for Bacon County, out of the total population over 16 years of age (8,640), 51.6% or 4,458 individuals are in the labor force, with 4.3% or 192 of them unemployed. The age group with the highest labor force participation rate is 20 to 24 years, with 82.9% or 491 individuals in the labor force. Within the labor force, the 30 to 34 years age range has the highest percentage of unemployed individuals, with 11.3% or 55 of them being unemployed.
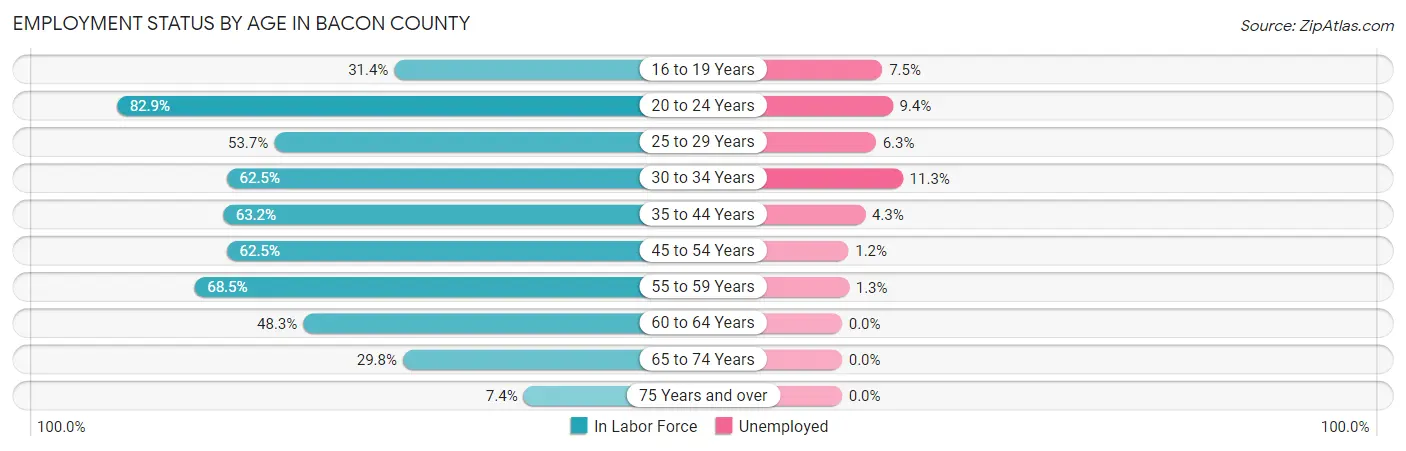
| Age Bracket | In Labor Force | Unemployed |
| 16 to 19 Years | 227 (31.4%) | 17 (7.5%) |
| 20 to 24 Years | 491 (82.9%) | 46 (9.4%) |
| 25 to 29 Years | 239 (53.7%) | 15 (6.3%) |
| 30 to 34 Years | 490 (62.5%) | 55 (11.3%) |
| 35 to 44 Years | 937 (63.2%) | 40 (4.3%) |
| 45 to 54 Years | 898 (62.5%) | 11 (1.2%) |
| 55 to 59 Years | 478 (68.5%) | 6 (1.3%) |
| 60 to 64 Years | 286 (48.3%) | 0 (0.0%) |
| 65 to 74 Years | 358 (29.8%) | 0 (0.0%) |
| 75 Years and over | 51 (7.4%) | 0 (0.0%) |
| Total | 4,458 (51.6%) | 192 (4.3%) |
Employment Status by Educational Attainment in Bacon County
According to labor force statistics for Bacon County, 61.2% of individuals (3,327) out of the total population between 25 and 64 years of age (5,437) are in the labor force, with 3.8% or 126 of them being unemployed. The group with the highest labor force participation rate are those with the educational attainment of bachelor's degree or higher, with 78.6% or 438 individuals in the labor force. Within the labor force, individuals with college / associate degree education have the highest percentage of unemployment, with 5.4% or 71 of them being unemployed.
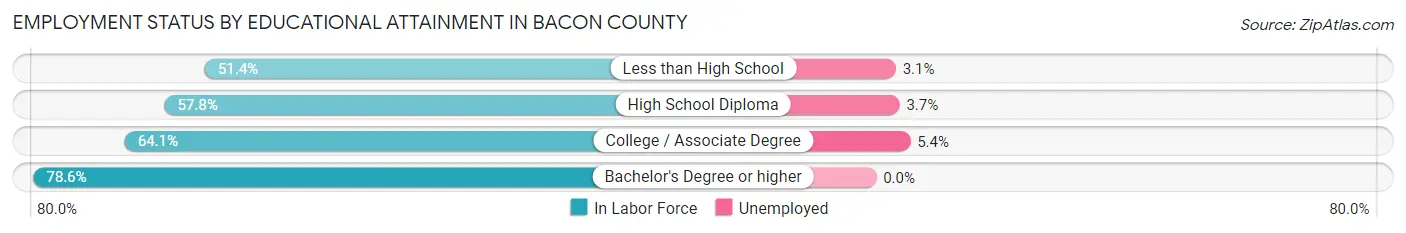
| Educational Attainment | In Labor Force | Unemployed |
| Less than High School | 485 (51.4%) | 29 (3.1%) |
| High School Diploma | 1,089 (57.8%) | 70 (3.7%) |
| College / Associate Degree | 1,315 (64.1%) | 111 (5.4%) |
| Bachelor's Degree or higher | 438 (78.6%) | 0 (0.0%) |
| Total | 3,327 (61.2%) | 207 (3.8%) |
Employment Occupations by Sex in Bacon County
Management, Business, Science and Arts Occupations
The most common Management, Business, Science and Arts occupations in Bacon County are Community & Social Service (379 | 8.9%), Health Diagnosing & Treating (328 | 7.7%), Management (282 | 6.6%), Education Instruction & Library (213 | 5.0%), and Health Technologists (189 | 4.4%).
Management, Business, Science and Arts Occupations by Sex
Within the Management, Business, Science and Arts occupations in Bacon County, the most male-oriented occupations are Computers, Engineering & Science (100.0%), Computers & Mathematics (100.0%), and Architecture & Engineering (100.0%), while the most female-oriented occupations are Legal Services & Support (100.0%), Education Instruction & Library (100.0%), and Health Technologists (95.8%).
| Occupation | Male | Female |
| Management | 159 (56.4%) | 123 (43.6%) |
| Business & Financial | 6 (14.3%) | 36 (85.7%) |
| Computers, Engineering & Science | 41 (100.0%) | 0 (0.0%) |
| Computers & Mathematics | 3 (100.0%) | 0 (0.0%) |
| Architecture & Engineering | 38 (100.0%) | 0 (0.0%) |
| Life, Physical & Social Science | 0 (0.0%) | 0 (0.0%) |
| Community & Social Service | 44 (11.6%) | 335 (88.4%) |
| Education, Arts & Media | 22 (27.9%) | 57 (72.2%) |
| Legal Services & Support | 0 (0.0%) | 9 (100.0%) |
| Education Instruction & Library | 0 (0.0%) | 213 (100.0%) |
| Arts, Media & Entertainment | 22 (28.2%) | 56 (71.8%) |
| Health Diagnosing & Treating | 32 (9.8%) | 296 (90.2%) |
| Health Technologists | 8 (4.2%) | 181 (95.8%) |
| Total (Category) | 282 (26.3%) | 790 (73.7%) |
| Total (Overall) | 2,213 (52.0%) | 2,040 (48.0%) |
Services Occupations
The most common Services occupations in Bacon County are Security & Protection (194 | 4.6%), Law Enforcement (168 | 4.0%), Healthcare Support (160 | 3.8%), Food Preparation & Serving (146 | 3.4%), and Cleaning & Maintenance (90 | 2.1%).
Services Occupations by Sex
Within the Services occupations in Bacon County, the most male-oriented occupations are Cleaning & Maintenance (40.0%), Food Preparation & Serving (36.3%), and Healthcare Support (32.5%), while the most female-oriented occupations are Firefighting & Prevention (80.8%), Security & Protection (79.4%), and Law Enforcement (79.2%).
| Occupation | Male | Female |
| Healthcare Support | 52 (32.5%) | 108 (67.5%) |
| Security & Protection | 40 (20.6%) | 154 (79.4%) |
| Firefighting & Prevention | 5 (19.2%) | 21 (80.8%) |
| Law Enforcement | 35 (20.8%) | 133 (79.2%) |
| Food Preparation & Serving | 53 (36.3%) | 93 (63.7%) |
| Cleaning & Maintenance | 36 (40.0%) | 54 (60.0%) |
| Personal Care & Service | 16 (21.9%) | 57 (78.1%) |
| Total (Category) | 197 (29.7%) | 466 (70.3%) |
| Total (Overall) | 2,213 (52.0%) | 2,040 (48.0%) |
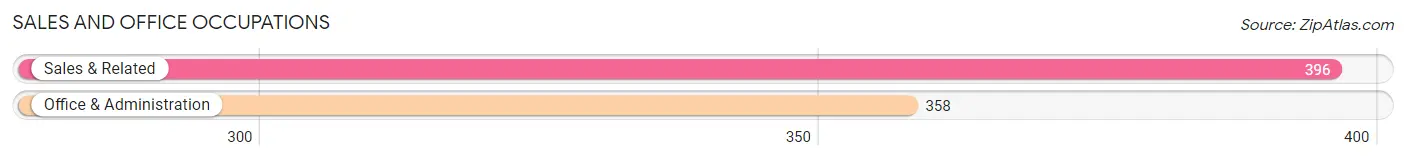
Sales and Office Occupations
The most common Sales and Office occupations in Bacon County are Sales & Related (396 | 9.3%), and Office & Administration (358 | 8.4%).
Sales and Office Occupations by Sex

| Occupation | Male | Female |
| Sales & Related | 240 (60.6%) | 156 (39.4%) |
| Office & Administration | 31 (8.7%) | 327 (91.3%) |
| Total (Category) | 271 (35.9%) | 483 (64.1%) |
| Total (Overall) | 2,213 (52.0%) | 2,040 (48.0%) |
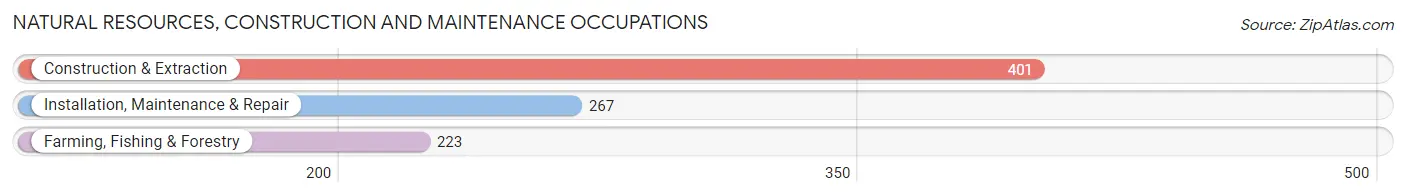
Natural Resources, Construction and Maintenance Occupations
The most common Natural Resources, Construction and Maintenance occupations in Bacon County are Construction & Extraction (401 | 9.4%), Installation, Maintenance & Repair (267 | 6.3%), and Farming, Fishing & Forestry (223 | 5.2%).
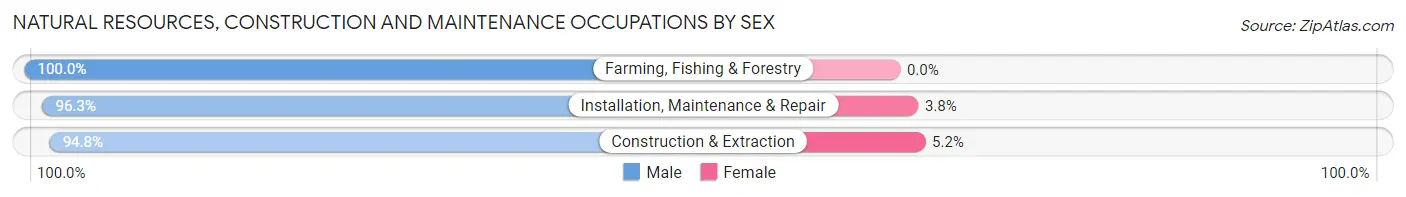
Natural Resources, Construction and Maintenance Occupations by Sex
| Occupation | Male | Female |
| Farming, Fishing & Forestry | 223 (100.0%) | 0 (0.0%) |
| Construction & Extraction | 380 (94.8%) | 21 (5.2%) |
| Installation, Maintenance & Repair | 257 (96.3%) | 10 (3.7%) |
| Total (Category) | 860 (96.5%) | 31 (3.5%) |
| Total (Overall) | 2,213 (52.0%) | 2,040 (48.0%) |
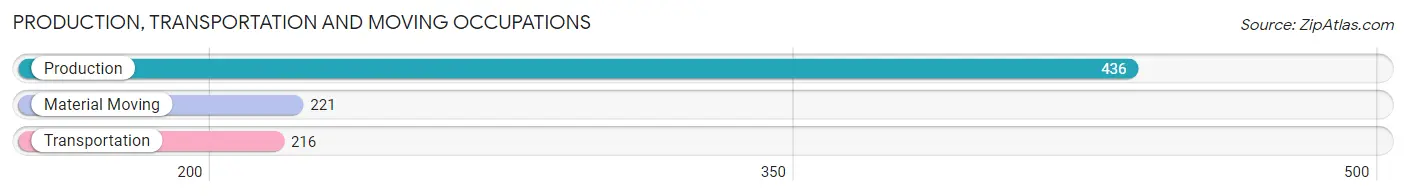
Production, Transportation and Moving Occupations
The most common Production, Transportation and Moving occupations in Bacon County are Production (436 | 10.2%), Material Moving (221 | 5.2%), and Transportation (216 | 5.1%).
Production, Transportation and Moving Occupations by Sex
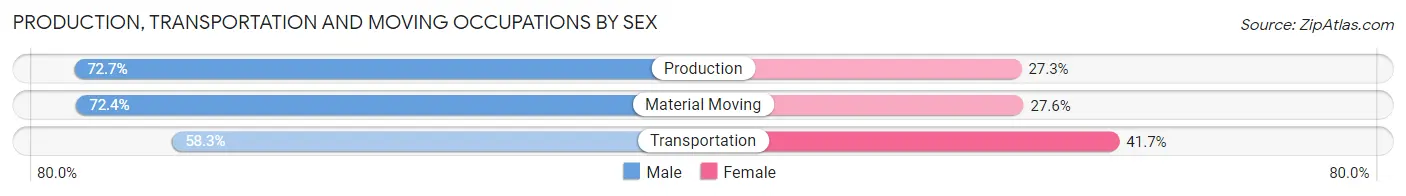
| Occupation | Male | Female |
| Production | 317 (72.7%) | 119 (27.3%) |
| Transportation | 126 (58.3%) | 90 (41.7%) |
| Material Moving | 160 (72.4%) | 61 (27.6%) |
| Total (Category) | 603 (69.1%) | 270 (30.9%) |
| Total (Overall) | 2,213 (52.0%) | 2,040 (48.0%) |
Employment Industries by Sex in Bacon County
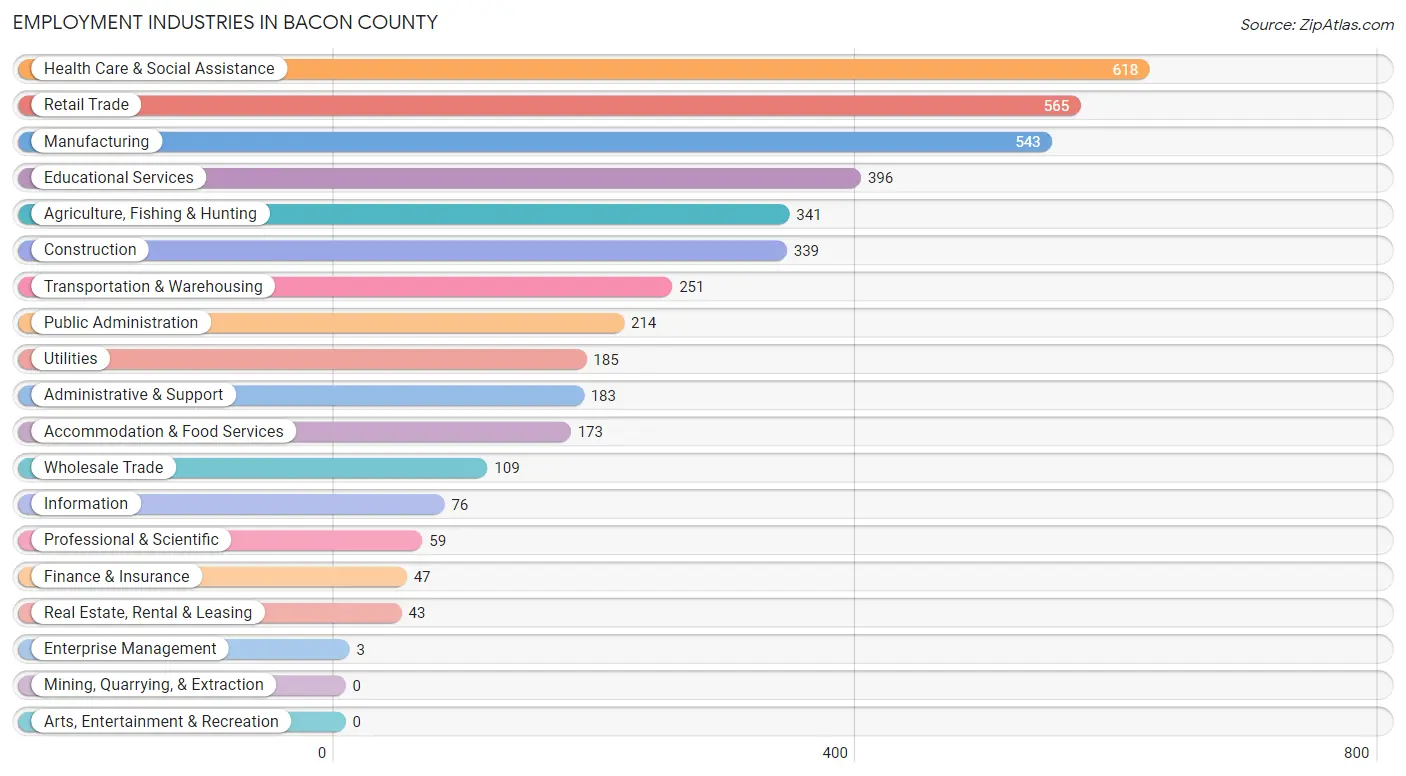
Employment Industries in Bacon County
The major employment industries in Bacon County include Health Care & Social Assistance (618 | 14.5%), Retail Trade (565 | 13.3%), Manufacturing (543 | 12.8%), Educational Services (396 | 9.3%), and Agriculture, Fishing & Hunting (341 | 8.0%).
Employment Industries by Sex in Bacon County
The Bacon County industries that see more men than women are Enterprise Management (100.0%), Construction (93.8%), and Agriculture, Fishing & Hunting (93.3%), whereas the industries that tend to have a higher number of women are Finance & Insurance (85.1%), Health Care & Social Assistance (84.3%), and Information (84.2%).
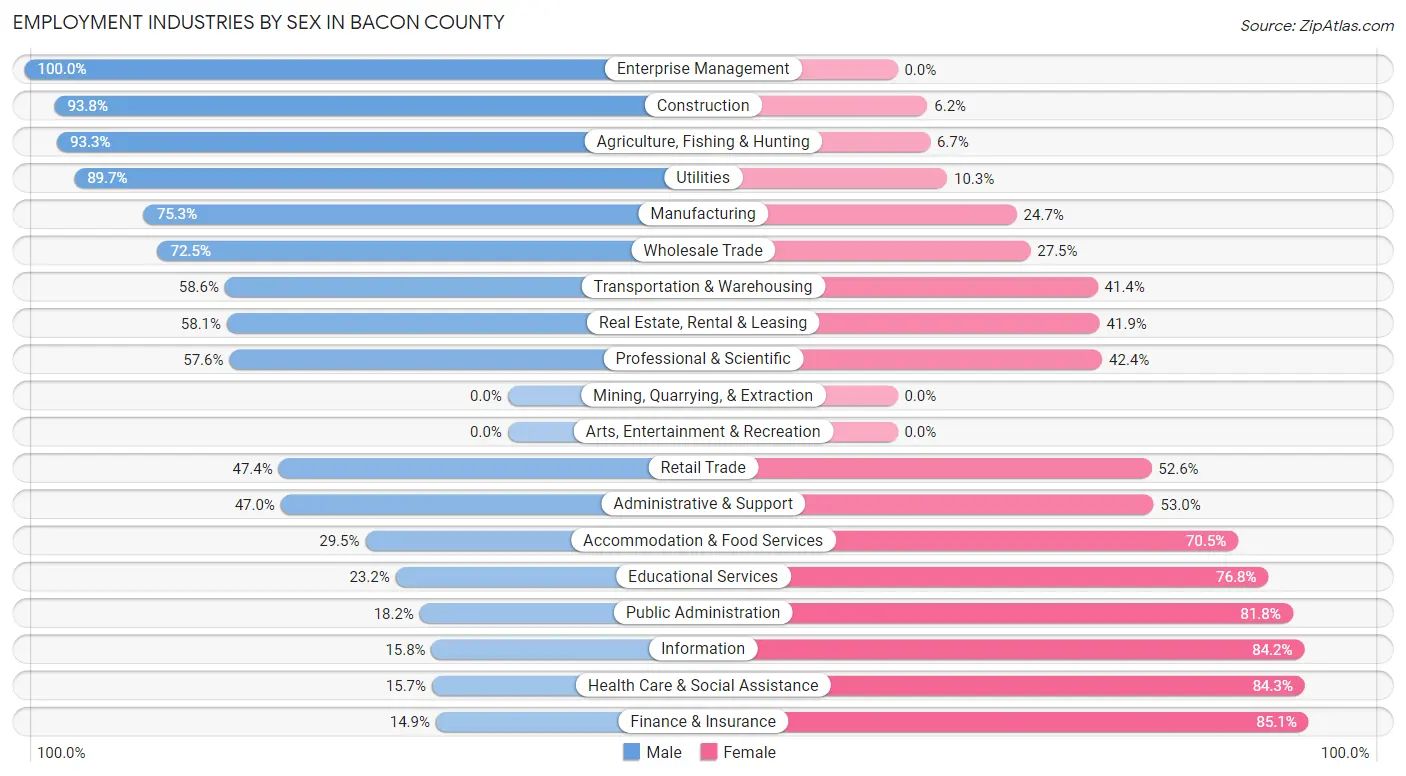
| Industry | Male | Female |
| Agriculture, Fishing & Hunting | 318 (93.3%) | 23 (6.7%) |
| Mining, Quarrying, & Extraction | 0 (0.0%) | 0 (0.0%) |
| Construction | 318 (93.8%) | 21 (6.2%) |
| Manufacturing | 409 (75.3%) | 134 (24.7%) |
| Wholesale Trade | 79 (72.5%) | 30 (27.5%) |
| Retail Trade | 268 (47.4%) | 297 (52.6%) |
| Transportation & Warehousing | 147 (58.6%) | 104 (41.4%) |
| Utilities | 166 (89.7%) | 19 (10.3%) |
| Information | 12 (15.8%) | 64 (84.2%) |
| Finance & Insurance | 7 (14.9%) | 40 (85.1%) |
| Real Estate, Rental & Leasing | 25 (58.1%) | 18 (41.9%) |
| Professional & Scientific | 34 (57.6%) | 25 (42.4%) |
| Enterprise Management | 3 (100.0%) | 0 (0.0%) |
| Administrative & Support | 86 (47.0%) | 97 (53.0%) |
| Educational Services | 92 (23.2%) | 304 (76.8%) |
| Health Care & Social Assistance | 97 (15.7%) | 521 (84.3%) |
| Arts, Entertainment & Recreation | 0 (0.0%) | 0 (0.0%) |
| Accommodation & Food Services | 51 (29.5%) | 122 (70.5%) |
| Public Administration | 39 (18.2%) | 175 (81.8%) |
| Total | 2,213 (52.0%) | 2,040 (48.0%) |
Education in Bacon County
School Enrollment in Bacon County
The most common levels of schooling among the 2,524 students in Bacon County are elementary school (814 | 32.3%), high school (658 | 26.1%), and middle school (567 | 22.5%).
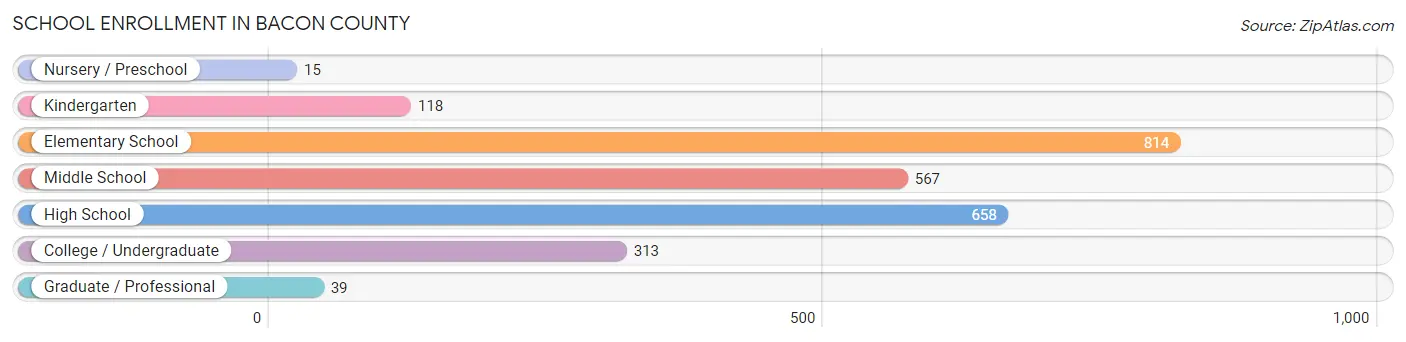
| School Level | # Students | % Students |
| Nursery / Preschool | 15 | 0.6% |
| Kindergarten | 118 | 4.7% |
| Elementary School | 814 | 32.3% |
| Middle School | 567 | 22.5% |
| High School | 658 | 26.1% |
| College / Undergraduate | 313 | 12.4% |
| Graduate / Professional | 39 | 1.5% |
| Total | 2,524 | 100.0% |
School Enrollment by Age by Funding Source in Bacon County
Out of a total of 2,524 students who are enrolled in schools in Bacon County, 202 (8.0%) attend a private institution, while the remaining 2,322 (92.0%) are enrolled in public schools. The age group of 18 to 19 year olds has the highest likelihood of being enrolled in private schools, with 83 (35.3% in the age bracket) enrolled. Conversely, the age group of 3 to 4 year olds has the lowest likelihood of being enrolled in a private school, with 44 (100.0% in the age bracket) attending a public institution.
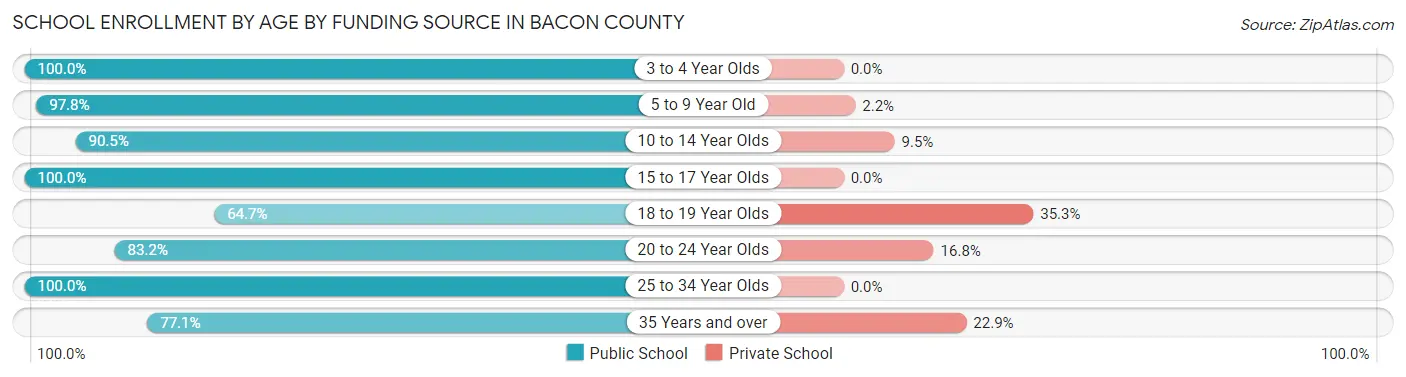
| Age Bracket | Public School | Private School |
| 3 to 4 Year Olds | 44 (100.0%) | 0 (0.0%) |
| 5 to 9 Year Old | 807 (97.8%) | 18 (2.2%) |
| 10 to 14 Year Olds | 620 (90.5%) | 65 (9.5%) |
| 15 to 17 Year Olds | 487 (100.0%) | 0 (0.0%) |
| 18 to 19 Year Olds | 152 (64.7%) | 83 (35.3%) |
| 20 to 24 Year Olds | 144 (83.2%) | 29 (16.8%) |
| 25 to 34 Year Olds | 40 (100.0%) | 0 (0.0%) |
| 35 Years and over | 27 (77.1%) | 8 (22.9%) |
| Total | 2,322 (92.0%) | 202 (8.0%) |
Educational Attainment by Field of Study in Bacon County
Education (267 | 32.9%), business (150 | 18.5%), science & technology (144 | 17.7%), bio, nature & agricultural (81 | 10.0%), and physical & health sciences (48 | 5.9%) are the most common fields of study among 812 individuals in Bacon County who have obtained a bachelor's degree or higher.
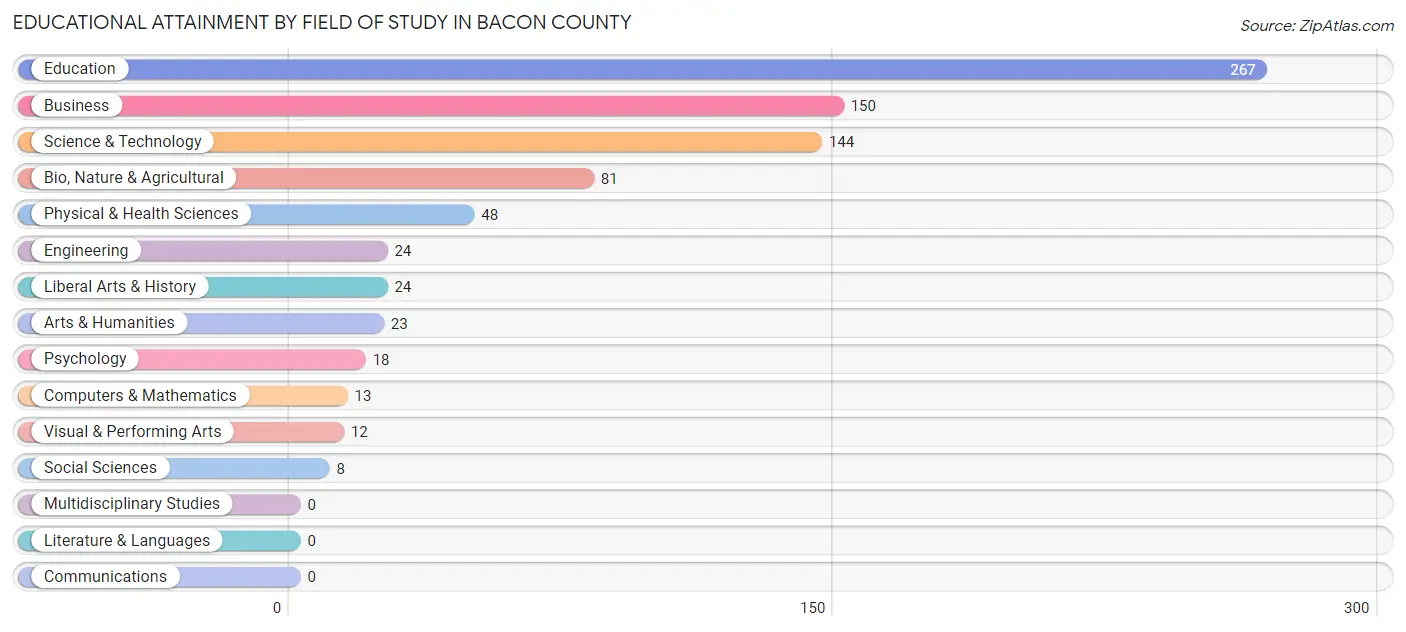
| Field of Study | # Graduates | % Graduates |
| Computers & Mathematics | 13 | 1.6% |
| Bio, Nature & Agricultural | 81 | 10.0% |
| Physical & Health Sciences | 48 | 5.9% |
| Psychology | 18 | 2.2% |
| Social Sciences | 8 | 1.0% |
| Engineering | 24 | 3.0% |
| Multidisciplinary Studies | 0 | 0.0% |
| Science & Technology | 144 | 17.7% |
| Business | 150 | 18.5% |
| Education | 267 | 32.9% |
| Literature & Languages | 0 | 0.0% |
| Liberal Arts & History | 24 | 3.0% |
| Visual & Performing Arts | 12 | 1.5% |
| Communications | 0 | 0.0% |
| Arts & Humanities | 23 | 2.8% |
| Total | 812 | 100.0% |
Transportation & Commute in Bacon County
Vehicle Availability by Sex in Bacon County
The most prevalent vehicle ownership categories in Bacon County are males with 2 vehicles (786, accounting for 35.8%) and females with 2 vehicles (650, making up 39.0%).
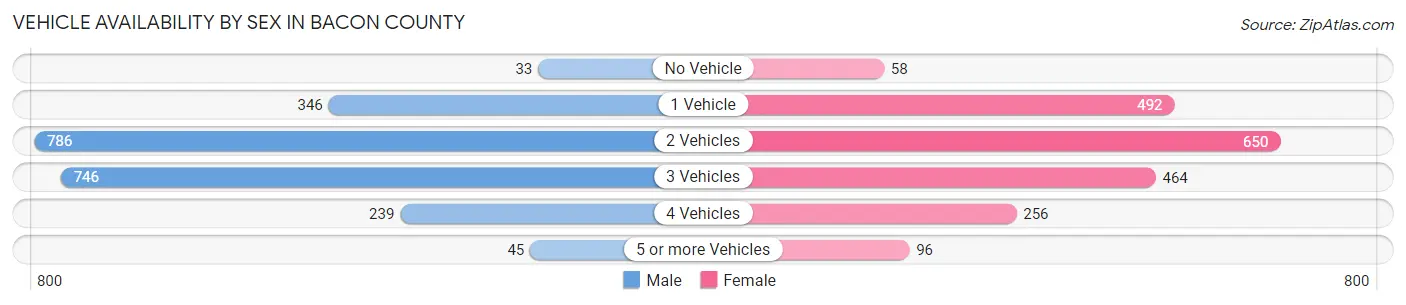
| Vehicles Available | Male | Female |
| No Vehicle | 33 (1.5%) | 58 (2.9%) |
| 1 Vehicle | 346 (15.8%) | 492 (24.4%) |
| 2 Vehicles | 786 (35.8%) | 650 (32.2%) |
| 3 Vehicles | 746 (34.0%) | 464 (23.0%) |
| 4 Vehicles | 239 (10.9%) | 256 (12.7%) |
| 5 or more Vehicles | 45 (2.1%) | 96 (4.8%) |
| Total | 2,195 (100.0%) | 2,016 (100.0%) |
Commute Time in Bacon County
The most frequently occuring commute durations in Bacon County are 10 to 14 minutes (1,271 commuters, 31.0%), 30 to 34 minutes (713 commuters, 17.4%), and 5 to 9 minutes (532 commuters, 13.0%).
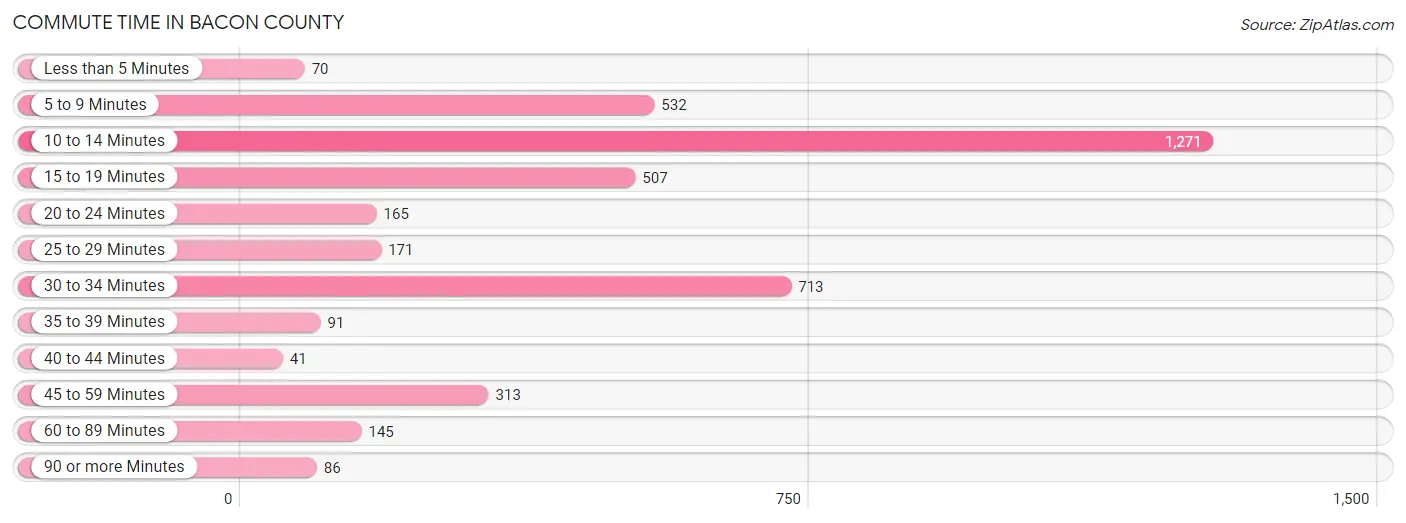
| Commute Time | # Commuters | % Commuters |
| Less than 5 Minutes | 70 | 1.7% |
| 5 to 9 Minutes | 532 | 13.0% |
| 10 to 14 Minutes | 1,271 | 31.0% |
| 15 to 19 Minutes | 507 | 12.3% |
| 20 to 24 Minutes | 165 | 4.0% |
| 25 to 29 Minutes | 171 | 4.2% |
| 30 to 34 Minutes | 713 | 17.4% |
| 35 to 39 Minutes | 91 | 2.2% |
| 40 to 44 Minutes | 41 | 1.0% |
| 45 to 59 Minutes | 313 | 7.6% |
| 60 to 89 Minutes | 145 | 3.5% |
| 90 or more Minutes | 86 | 2.1% |
Commute Time by Sex in Bacon County
The most common commute times in Bacon County are 10 to 14 minutes (810 commuters, 37.5%) for males and 10 to 14 minutes (461 commuters, 23.7%) for females.
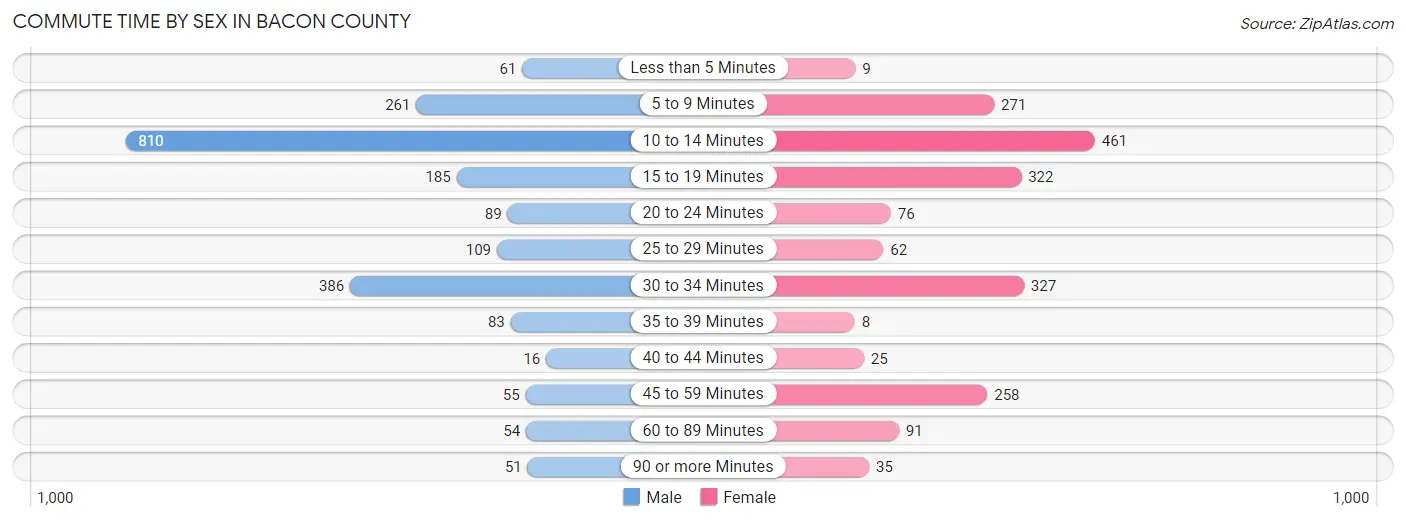
| Commute Time | Male | Female |
| Less than 5 Minutes | 61 (2.8%) | 9 (0.5%) |
| 5 to 9 Minutes | 261 (12.1%) | 271 (13.9%) |
| 10 to 14 Minutes | 810 (37.5%) | 461 (23.7%) |
| 15 to 19 Minutes | 185 (8.6%) | 322 (16.6%) |
| 20 to 24 Minutes | 89 (4.1%) | 76 (3.9%) |
| 25 to 29 Minutes | 109 (5.1%) | 62 (3.2%) |
| 30 to 34 Minutes | 386 (17.9%) | 327 (16.8%) |
| 35 to 39 Minutes | 83 (3.8%) | 8 (0.4%) |
| 40 to 44 Minutes | 16 (0.7%) | 25 (1.3%) |
| 45 to 59 Minutes | 55 (2.5%) | 258 (13.3%) |
| 60 to 89 Minutes | 54 (2.5%) | 91 (4.7%) |
| 90 or more Minutes | 51 (2.4%) | 35 (1.8%) |
Time of Departure to Work by Sex in Bacon County
The most frequent times of departure to work in Bacon County are 6:00 AM to 6:29 AM (389, 18.0%) for males and 7:30 AM to 7:59 AM (324, 16.7%) for females.
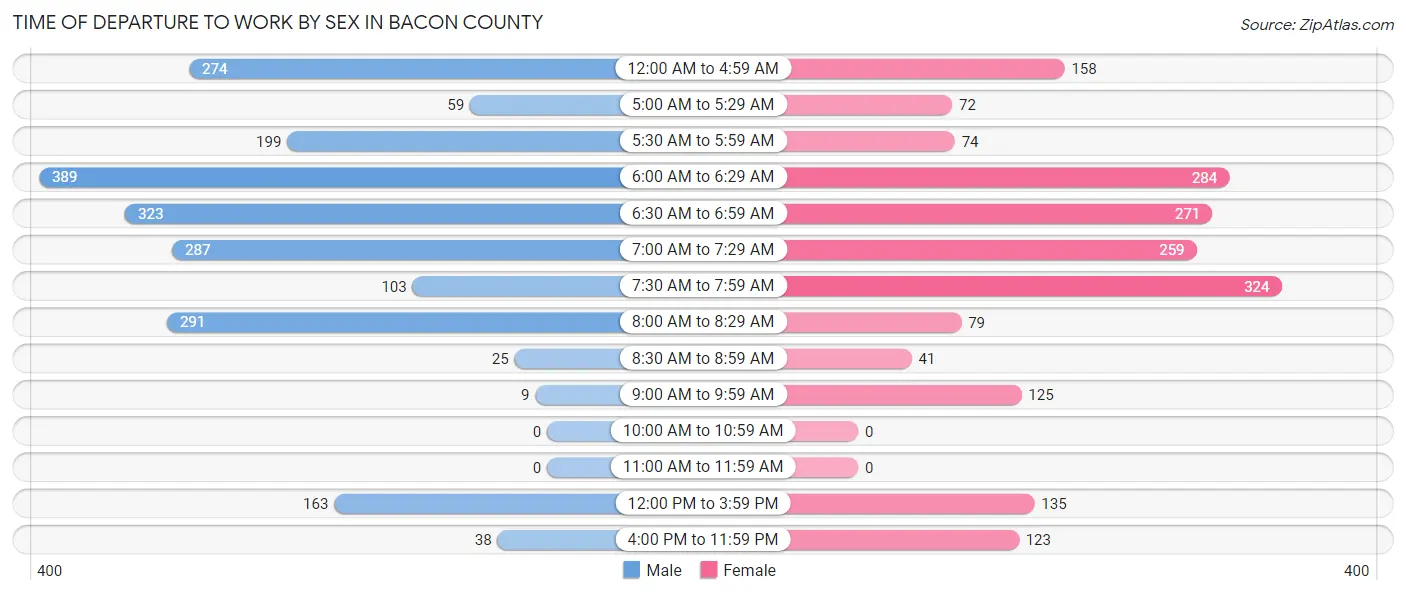
| Time of Departure | Male | Female |
| 12:00 AM to 4:59 AM | 274 (12.7%) | 158 (8.1%) |
| 5:00 AM to 5:29 AM | 59 (2.7%) | 72 (3.7%) |
| 5:30 AM to 5:59 AM | 199 (9.2%) | 74 (3.8%) |
| 6:00 AM to 6:29 AM | 389 (18.0%) | 284 (14.6%) |
| 6:30 AM to 6:59 AM | 323 (14.9%) | 271 (13.9%) |
| 7:00 AM to 7:29 AM | 287 (13.3%) | 259 (13.3%) |
| 7:30 AM to 7:59 AM | 103 (4.8%) | 324 (16.7%) |
| 8:00 AM to 8:29 AM | 291 (13.5%) | 79 (4.1%) |
| 8:30 AM to 8:59 AM | 25 (1.2%) | 41 (2.1%) |
| 9:00 AM to 9:59 AM | 9 (0.4%) | 125 (6.4%) |
| 10:00 AM to 10:59 AM | 0 (0.0%) | 0 (0.0%) |
| 11:00 AM to 11:59 AM | 0 (0.0%) | 0 (0.0%) |
| 12:00 PM to 3:59 PM | 163 (7.5%) | 135 (6.9%) |
| 4:00 PM to 11:59 PM | 38 (1.8%) | 123 (6.3%) |
| Total | 2,160 (100.0%) | 1,945 (100.0%) |
Housing Occupancy in Bacon County
Occupancy by Ownership in Bacon County
Of the total 3,909 dwellings in Bacon County, owner-occupied units account for 2,814 (72.0%), while renter-occupied units make up 1,095 (28.0%).
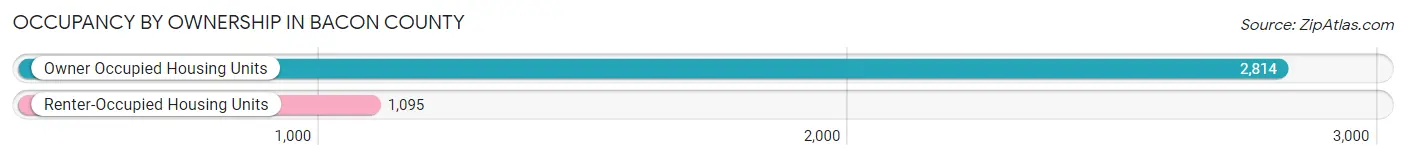
| Occupancy | # Housing Units | % Housing Units |
| Owner Occupied Housing Units | 2,814 | 72.0% |
| Renter-Occupied Housing Units | 1,095 | 28.0% |
| Total Occupied Housing Units | 3,909 | 100.0% |
Occupancy by Household Size in Bacon County
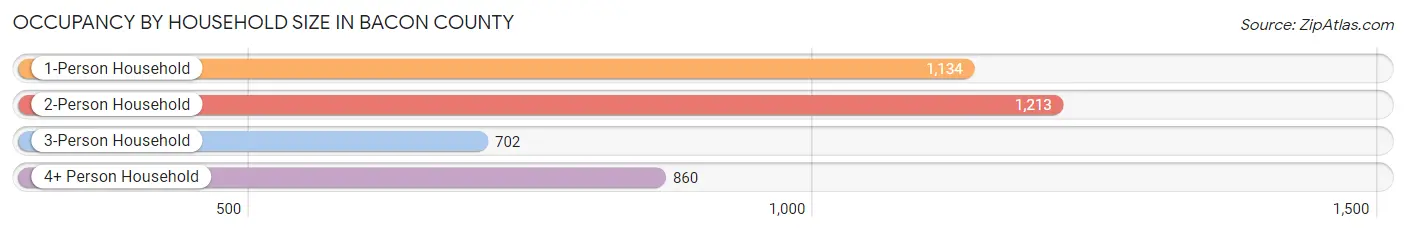
| Household Size | # Housing Units | % Housing Units |
| 1-Person Household | 1,134 | 29.0% |
| 2-Person Household | 1,213 | 31.0% |
| 3-Person Household | 702 | 18.0% |
| 4+ Person Household | 860 | 22.0% |
| Total Housing Units | 3,909 | 100.0% |
Occupancy by Ownership by Household Size in Bacon County
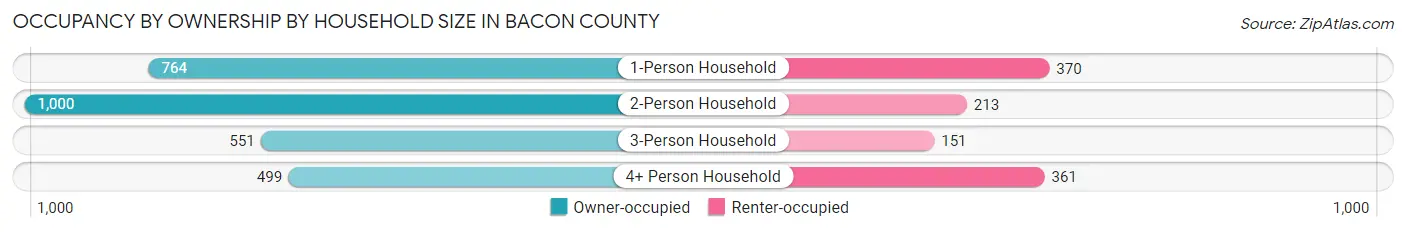
| Household Size | Owner-occupied | Renter-occupied |
| 1-Person Household | 764 (67.4%) | 370 (32.6%) |
| 2-Person Household | 1,000 (82.4%) | 213 (17.6%) |
| 3-Person Household | 551 (78.5%) | 151 (21.5%) |
| 4+ Person Household | 499 (58.0%) | 361 (42.0%) |
| Total Housing Units | 2,814 (72.0%) | 1,095 (28.0%) |
Occupancy by Educational Attainment in Bacon County
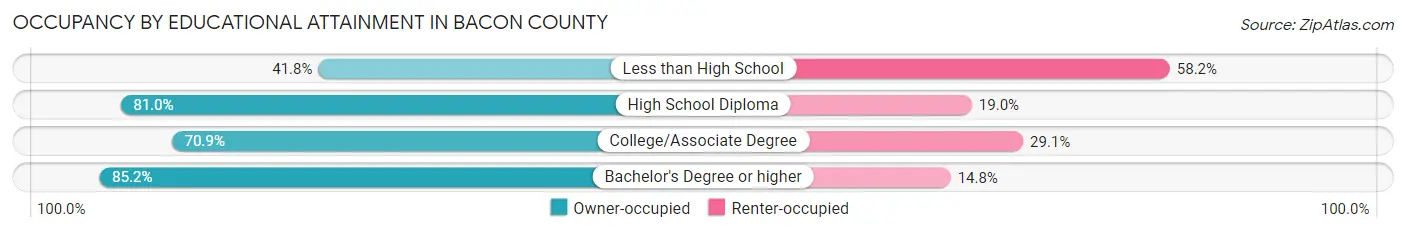
| Household Size | Owner-occupied | Renter-occupied |
| Less than High School | 246 (41.8%) | 343 (58.2%) |
| High School Diploma | 1,191 (81.0%) | 279 (19.0%) |
| College/Associate Degree | 985 (70.9%) | 405 (29.1%) |
| Bachelor's Degree or higher | 392 (85.2%) | 68 (14.8%) |
Occupancy by Age of Householder in Bacon County
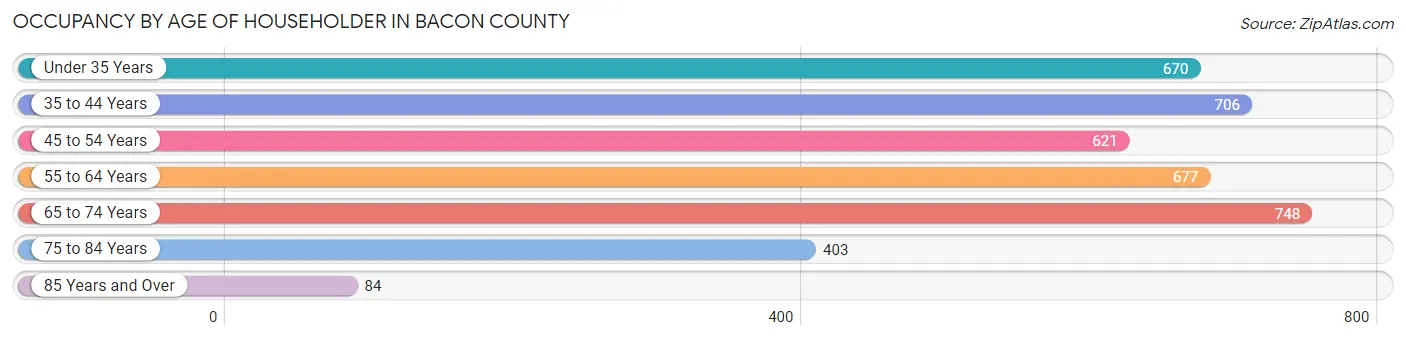
| Age Bracket | # Households | % Households |
| Under 35 Years | 670 | 17.1% |
| 35 to 44 Years | 706 | 18.1% |
| 45 to 54 Years | 621 | 15.9% |
| 55 to 64 Years | 677 | 17.3% |
| 65 to 74 Years | 748 | 19.1% |
| 75 to 84 Years | 403 | 10.3% |
| 85 Years and Over | 84 | 2.1% |
| Total | 3,909 | 100.0% |
Housing Finances in Bacon County
Median Income by Occupancy in Bacon County
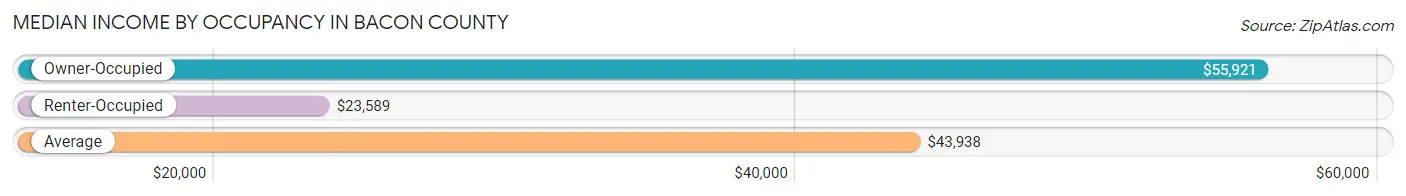
| Occupancy Type | # Households | Median Income |
| Owner-Occupied | 2,814 (72.0%) | $55,921 |
| Renter-Occupied | 1,095 (28.0%) | $23,589 |
| Average | 3,909 (100.0%) | $43,938 |
Occupancy by Householder Income Bracket in Bacon County
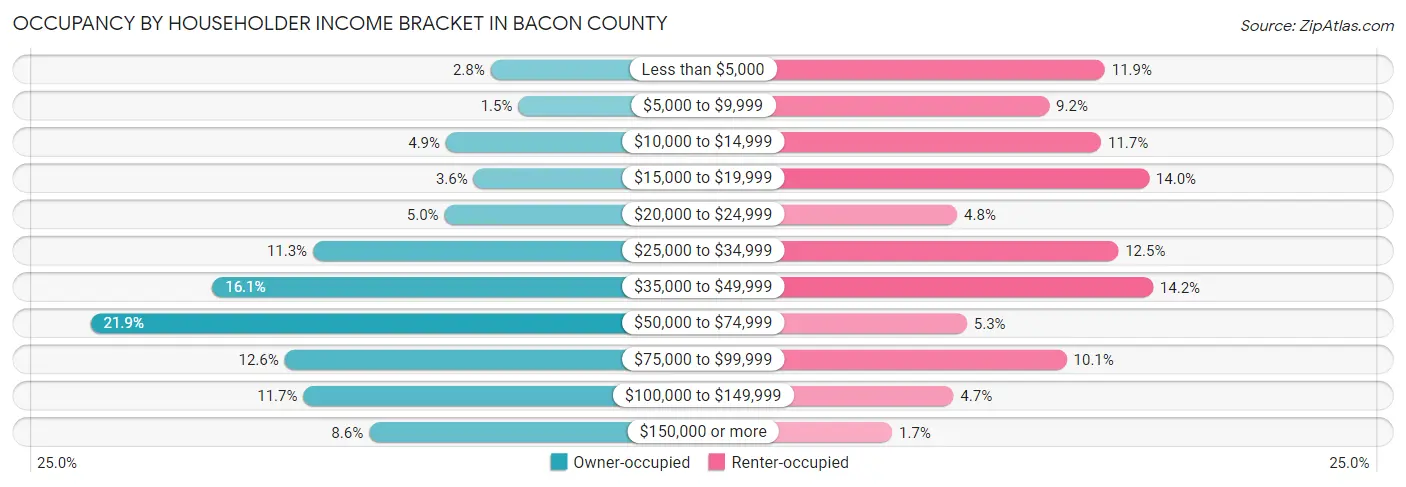
| Income Bracket | Owner-occupied | Renter-occupied |
| Less than $5,000 | 79 (2.8%) | 130 (11.9%) |
| $5,000 to $9,999 | 42 (1.5%) | 101 (9.2%) |
| $10,000 to $14,999 | 139 (4.9%) | 128 (11.7%) |
| $15,000 to $19,999 | 102 (3.6%) | 153 (14.0%) |
| $20,000 to $24,999 | 141 (5.0%) | 53 (4.8%) |
| $25,000 to $34,999 | 317 (11.3%) | 137 (12.5%) |
| $35,000 to $49,999 | 452 (16.1%) | 155 (14.2%) |
| $50,000 to $74,999 | 615 (21.9%) | 58 (5.3%) |
| $75,000 to $99,999 | 355 (12.6%) | 110 (10.1%) |
| $100,000 to $149,999 | 330 (11.7%) | 51 (4.7%) |
| $150,000 or more | 242 (8.6%) | 19 (1.7%) |
| Total | 2,814 (100.0%) | 1,095 (100.0%) |
Monthly Housing Cost Tiers in Bacon County
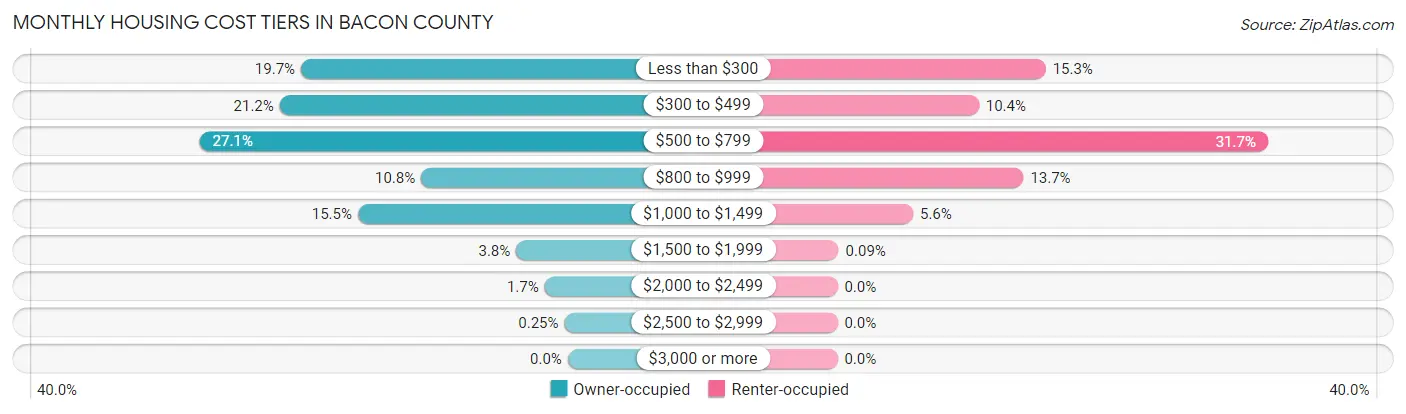
| Monthly Cost | Owner-occupied | Renter-occupied |
| Less than $300 | 553 (19.7%) | 168 (15.3%) |
| $300 to $499 | 597 (21.2%) | 114 (10.4%) |
| $500 to $799 | 763 (27.1%) | 347 (31.7%) |
| $800 to $999 | 304 (10.8%) | 150 (13.7%) |
| $1,000 to $1,499 | 435 (15.5%) | 61 (5.6%) |
| $1,500 to $1,999 | 107 (3.8%) | 1 (0.1%) |
| $2,000 to $2,499 | 48 (1.7%) | 0 (0.0%) |
| $2,500 to $2,999 | 7 (0.3%) | 0 (0.0%) |
| $3,000 or more | 0 (0.0%) | 0 (0.0%) |
| Total | 2,814 (100.0%) | 1,095 (100.0%) |
Physical Housing Characteristics in Bacon County
Housing Structures in Bacon County
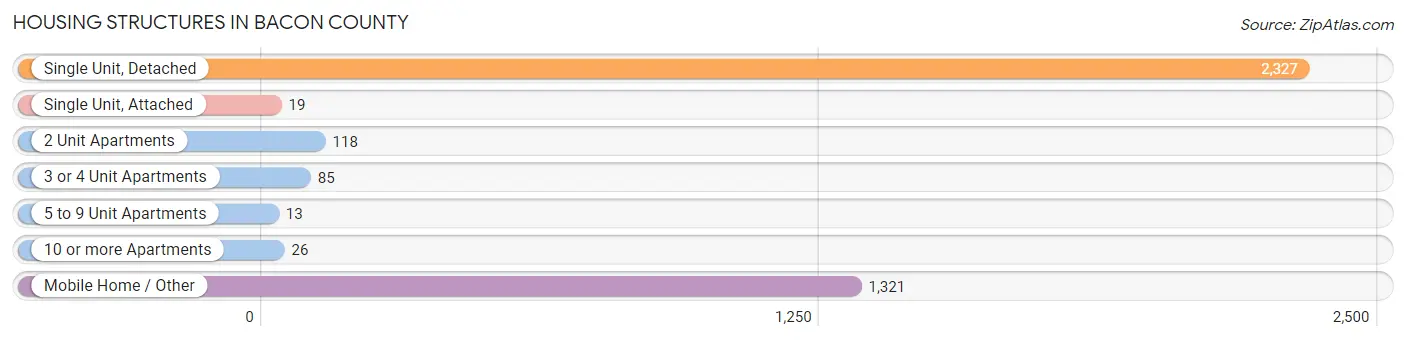
| Structure Type | # Housing Units | % Housing Units |
| Single Unit, Detached | 2,327 | 59.5% |
| Single Unit, Attached | 19 | 0.5% |
| 2 Unit Apartments | 118 | 3.0% |
| 3 or 4 Unit Apartments | 85 | 2.2% |
| 5 to 9 Unit Apartments | 13 | 0.3% |
| 10 or more Apartments | 26 | 0.7% |
| Mobile Home / Other | 1,321 | 33.8% |
| Total | 3,909 | 100.0% |
Housing Structures by Occupancy in Bacon County
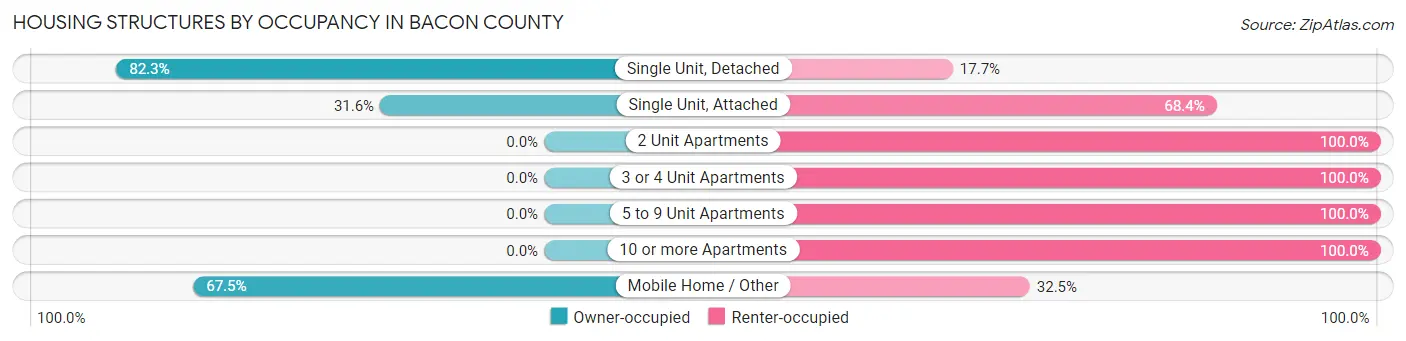
| Structure Type | Owner-occupied | Renter-occupied |
| Single Unit, Detached | 1,916 (82.3%) | 411 (17.7%) |
| Single Unit, Attached | 6 (31.6%) | 13 (68.4%) |
| 2 Unit Apartments | 0 (0.0%) | 118 (100.0%) |
| 3 or 4 Unit Apartments | 0 (0.0%) | 85 (100.0%) |
| 5 to 9 Unit Apartments | 0 (0.0%) | 13 (100.0%) |
| 10 or more Apartments | 0 (0.0%) | 26 (100.0%) |
| Mobile Home / Other | 892 (67.5%) | 429 (32.5%) |
| Total | 2,814 (72.0%) | 1,095 (28.0%) |
Housing Structures by Number of Rooms in Bacon County
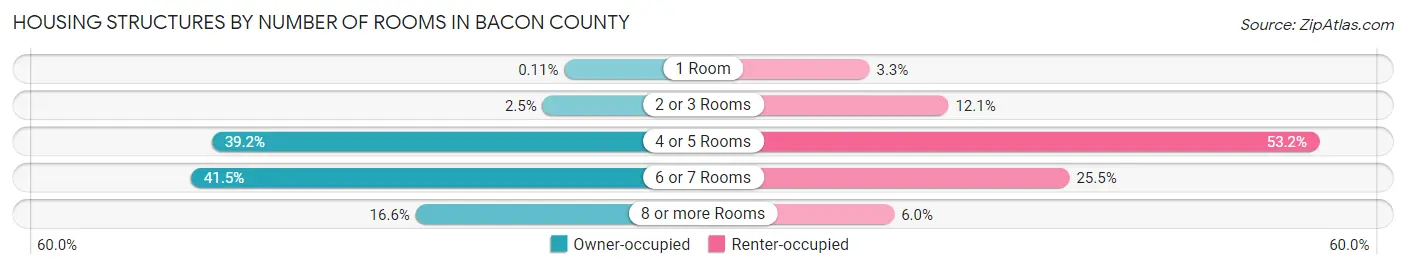
| Number of Rooms | Owner-occupied | Renter-occupied |
| 1 Room | 3 (0.1%) | 36 (3.3%) |
| 2 or 3 Rooms | 71 (2.5%) | 132 (12.0%) |
| 4 or 5 Rooms | 1,104 (39.2%) | 582 (53.1%) |
| 6 or 7 Rooms | 1,169 (41.5%) | 279 (25.5%) |
| 8 or more Rooms | 467 (16.6%) | 66 (6.0%) |
| Total | 2,814 (100.0%) | 1,095 (100.0%) |
Housing Structure by Heating Type in Bacon County
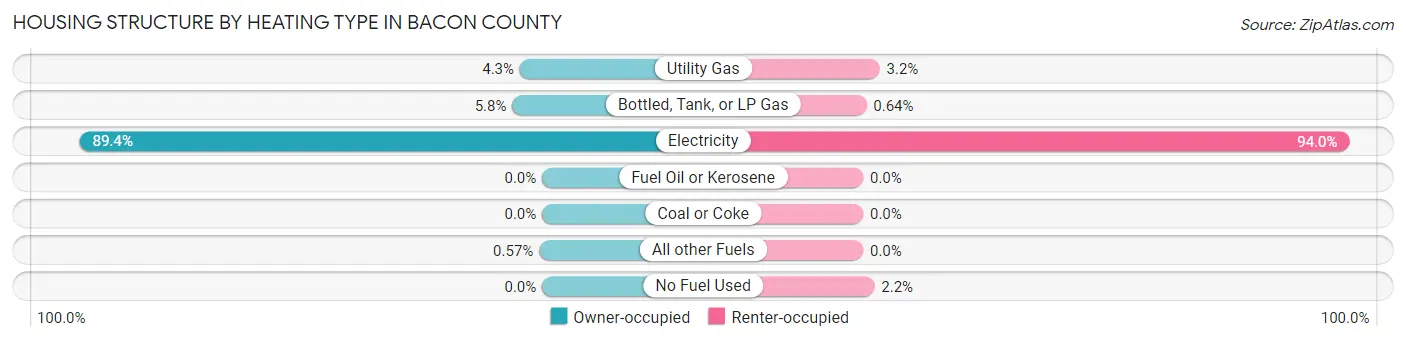
| Heating Type | Owner-occupied | Renter-occupied |
| Utility Gas | 121 (4.3%) | 35 (3.2%) |
| Bottled, Tank, or LP Gas | 162 (5.8%) | 7 (0.6%) |
| Electricity | 2,515 (89.4%) | 1,029 (94.0%) |
| Fuel Oil or Kerosene | 0 (0.0%) | 0 (0.0%) |
| Coal or Coke | 0 (0.0%) | 0 (0.0%) |
| All other Fuels | 16 (0.6%) | 0 (0.0%) |
| No Fuel Used | 0 (0.0%) | 24 (2.2%) |
| Total | 2,814 (100.0%) | 1,095 (100.0%) |
Household Vehicle Usage in Bacon County
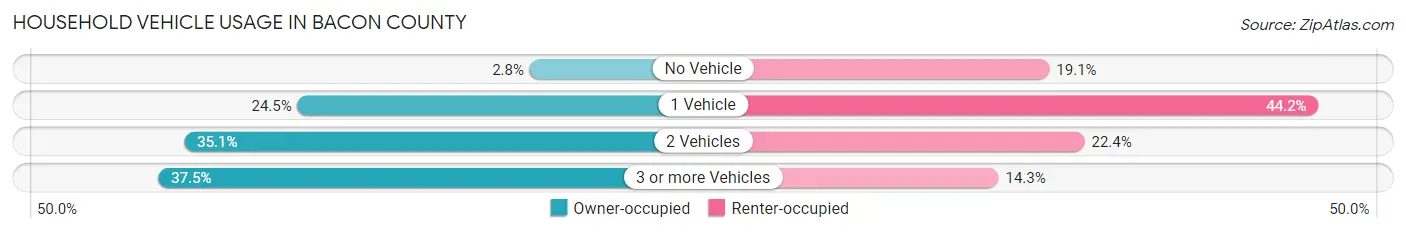
| Vehicles per Household | Owner-occupied | Renter-occupied |
| No Vehicle | 80 (2.8%) | 209 (19.1%) |
| 1 Vehicle | 690 (24.5%) | 484 (44.2%) |
| 2 Vehicles | 988 (35.1%) | 245 (22.4%) |
| 3 or more Vehicles | 1,056 (37.5%) | 157 (14.3%) |
| Total | 2,814 (100.0%) | 1,095 (100.0%) |
Real Estate & Mortgages in Bacon County
Real Estate and Mortgage Overview in Bacon County
| Characteristic | Without Mortgage | With Mortgage |
| Housing Units | 1,695 | 1,119 |
| Median Property Value | $86,900 | $125,100 |
| Median Household Income | $44,606 | $162 |
| Monthly Housing Costs | $383 | $0 |
| Real Estate Taxes | $795 | $40 |
Property Value by Mortgage Status in Bacon County
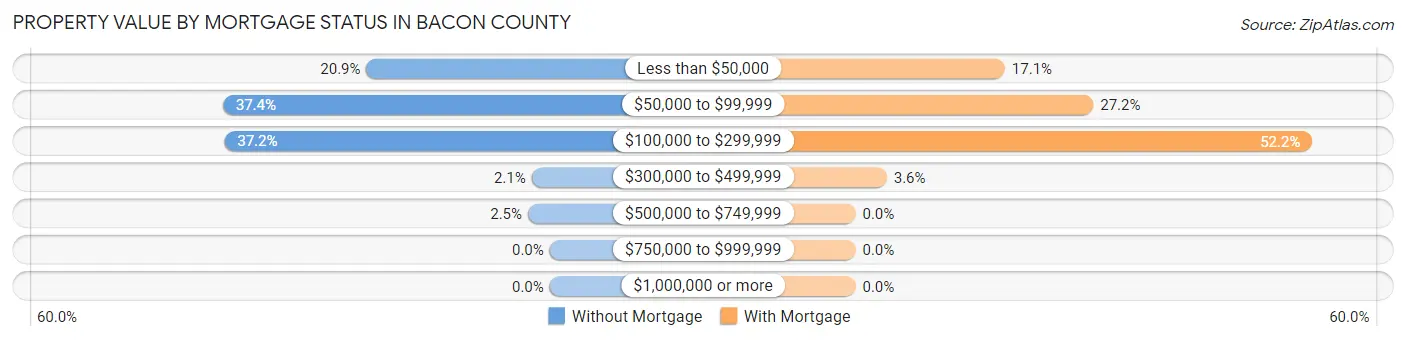
| Property Value | Without Mortgage | With Mortgage |
| Less than $50,000 | 355 (20.9%) | 191 (17.1%) |
| $50,000 to $99,999 | 633 (37.3%) | 304 (27.2%) |
| $100,000 to $299,999 | 630 (37.2%) | 584 (52.2%) |
| $300,000 to $499,999 | 35 (2.1%) | 40 (3.6%) |
| $500,000 to $749,999 | 42 (2.5%) | 0 (0.0%) |
| $750,000 to $999,999 | 0 (0.0%) | 0 (0.0%) |
| $1,000,000 or more | 0 (0.0%) | 0 (0.0%) |
| Total | 1,695 (100.0%) | 1,119 (100.0%) |
Household Income by Mortgage Status in Bacon County
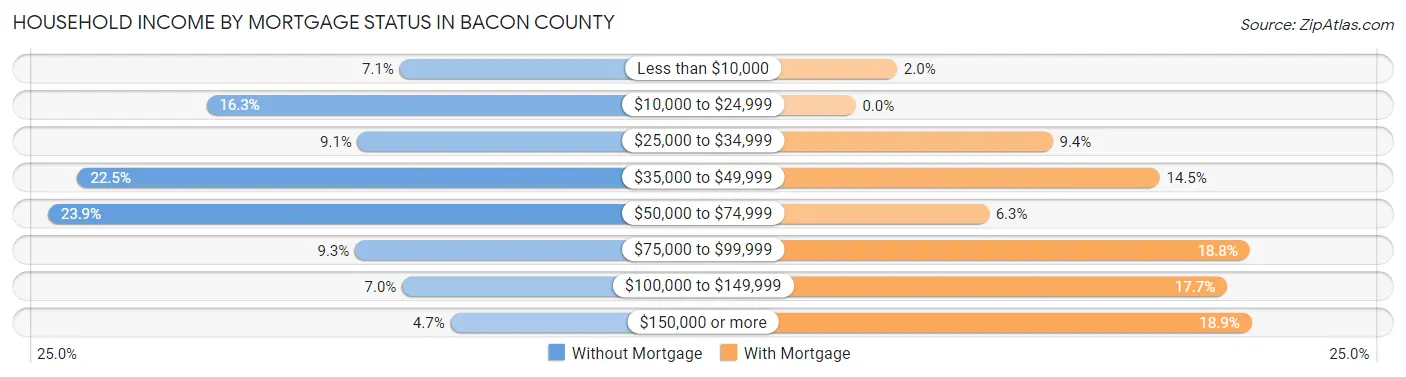
| Household Income | Without Mortgage | With Mortgage |
| Less than $10,000 | 121 (7.1%) | 22 (2.0%) |
| $10,000 to $24,999 | 277 (16.3%) | 0 (0.0%) |
| $25,000 to $34,999 | 155 (9.1%) | 105 (9.4%) |
| $35,000 to $49,999 | 381 (22.5%) | 162 (14.5%) |
| $50,000 to $74,999 | 405 (23.9%) | 71 (6.3%) |
| $75,000 to $99,999 | 157 (9.3%) | 210 (18.8%) |
| $100,000 to $149,999 | 119 (7.0%) | 198 (17.7%) |
| $150,000 or more | 80 (4.7%) | 211 (18.9%) |
| Total | 1,695 (100.0%) | 1,119 (100.0%) |
Property Value to Household Income Ratio in Bacon County
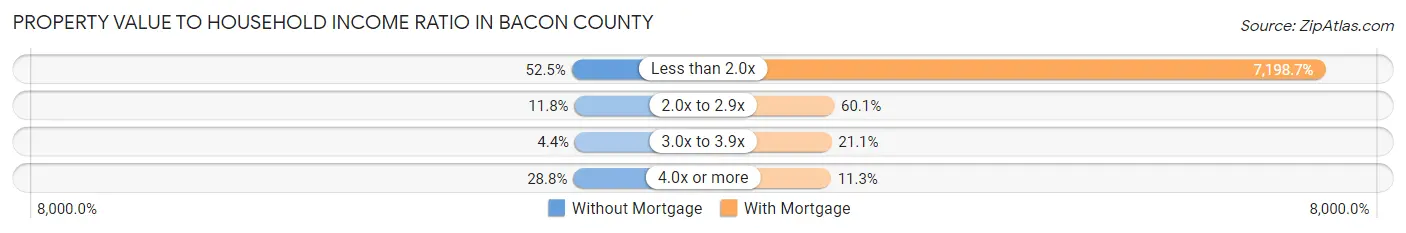
| Value-to-Income Ratio | Without Mortgage | With Mortgage |
| Less than 2.0x | 890 (52.5%) | 80,553 (7,198.7%) |
| 2.0x to 2.9x | 200 (11.8%) | 673 (60.1%) |
| 3.0x to 3.9x | 74 (4.4%) | 236 (21.1%) |
| 4.0x or more | 488 (28.8%) | 126 (11.3%) |
| Total | 1,695 (100.0%) | 1,119 (100.0%) |
Real Estate Taxes by Mortgage Status in Bacon County
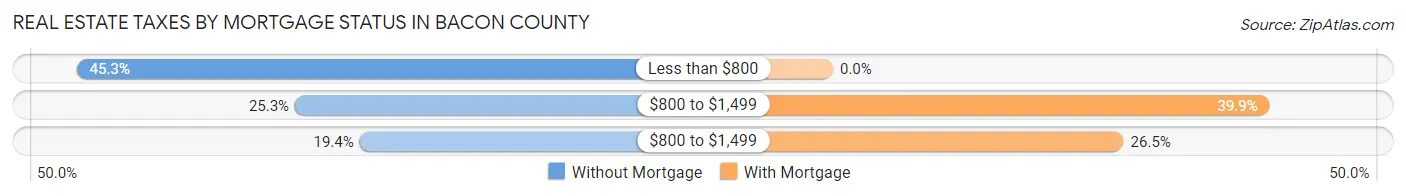
| Property Taxes | Without Mortgage | With Mortgage |
| Less than $800 | 767 (45.3%) | 0 (0.0%) |
| $800 to $1,499 | 429 (25.3%) | 446 (39.9%) |
| $800 to $1,499 | 329 (19.4%) | 297 (26.5%) |
| Total | 1,695 (100.0%) | 1,119 (100.0%) |
Health & Disability in Bacon County
Health Insurance Coverage by Age in Bacon County
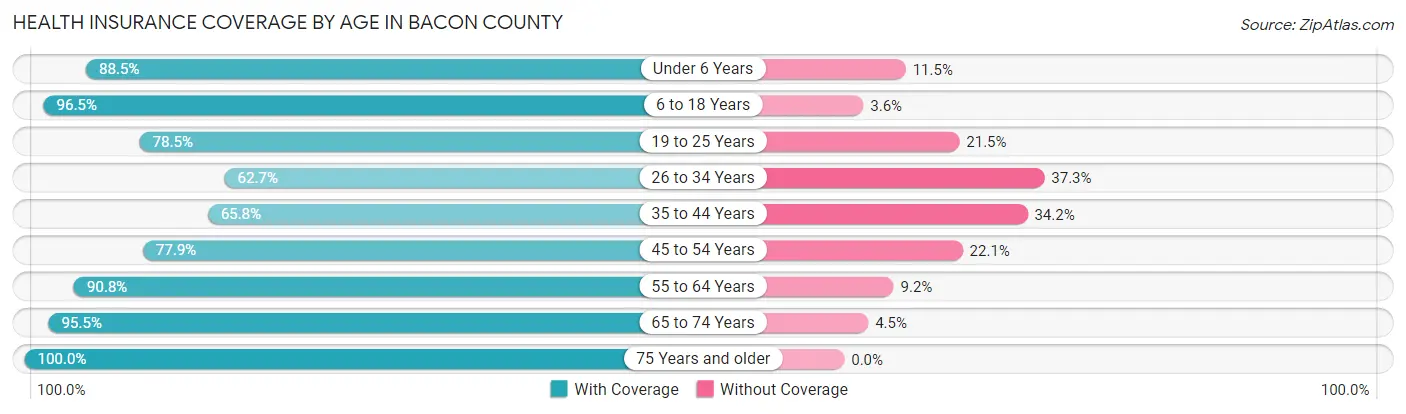
| Age Bracket | With Coverage | Without Coverage |
| Under 6 Years | 780 (88.5%) | 101 (11.5%) |
| 6 to 18 Years | 2,089 (96.5%) | 77 (3.5%) |
| 19 to 25 Years | 593 (78.5%) | 162 (21.5%) |
| 26 to 34 Years | 588 (62.7%) | 350 (37.3%) |
| 35 to 44 Years | 902 (65.8%) | 468 (34.2%) |
| 45 to 54 Years | 1,056 (77.9%) | 299 (22.1%) |
| 55 to 64 Years | 1,165 (90.8%) | 118 (9.2%) |
| 65 to 74 Years | 1,114 (95.5%) | 52 (4.5%) |
| 75 Years and older | 635 (100.0%) | 0 (0.0%) |
| Total | 8,922 (84.6%) | 1,627 (15.4%) |
Health Insurance Coverage by Citizenship Status in Bacon County
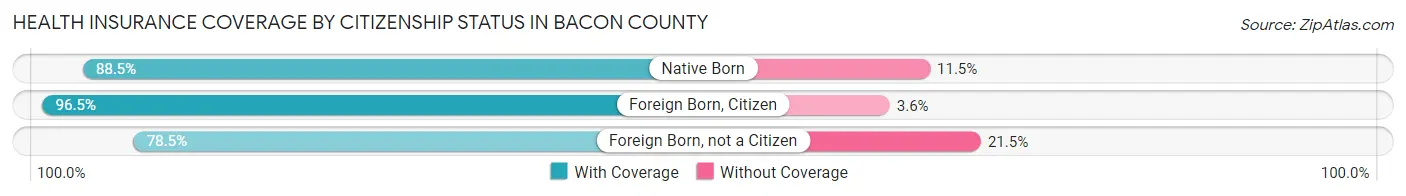
| Citizenship Status | With Coverage | Without Coverage |
| Native Born | 780 (88.5%) | 101 (11.5%) |
| Foreign Born, Citizen | 2,089 (96.5%) | 77 (3.5%) |
| Foreign Born, not a Citizen | 593 (78.5%) | 162 (21.5%) |
Health Insurance Coverage by Household Income in Bacon County
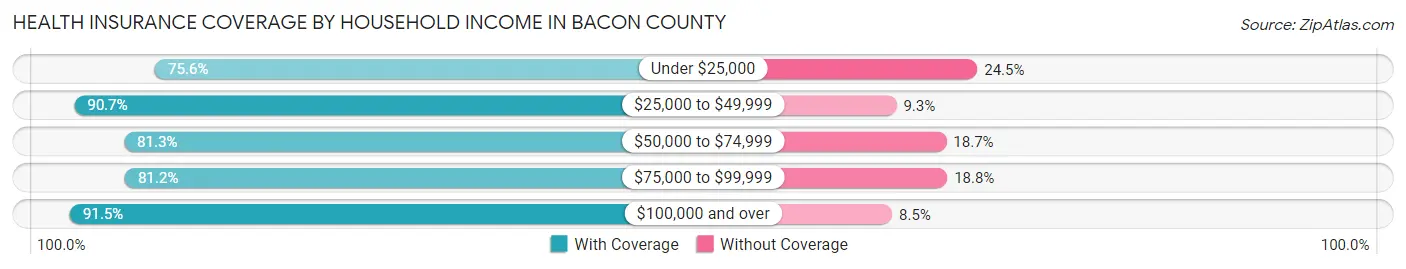
| Household Income | With Coverage | Without Coverage |
| Under $25,000 | 1,616 (75.5%) | 523 (24.4%) |
| $25,000 to $49,999 | 2,222 (90.7%) | 228 (9.3%) |
| $50,000 to $74,999 | 1,465 (81.3%) | 336 (18.7%) |
| $75,000 to $99,999 | 1,450 (81.2%) | 336 (18.8%) |
| $100,000 and over | 2,166 (91.5%) | 201 (8.5%) |
Public vs Private Health Insurance Coverage by Age in Bacon County
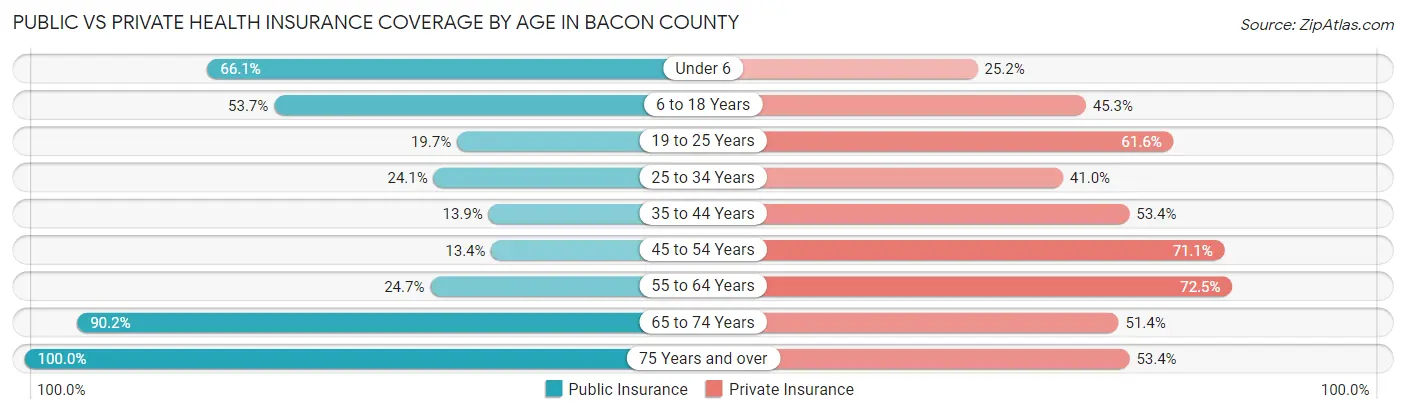
| Age Bracket | Public Insurance | Private Insurance |
| Under 6 | 582 (66.1%) | 222 (25.2%) |
| 6 to 18 Years | 1,163 (53.7%) | 981 (45.3%) |
| 19 to 25 Years | 149 (19.7%) | 465 (61.6%) |
| 25 to 34 Years | 226 (24.1%) | 385 (41.0%) |
| 35 to 44 Years | 190 (13.9%) | 731 (53.4%) |
| 45 to 54 Years | 181 (13.4%) | 963 (71.1%) |
| 55 to 64 Years | 317 (24.7%) | 930 (72.5%) |
| 65 to 74 Years | 1,052 (90.2%) | 599 (51.4%) |
| 75 Years and over | 635 (100.0%) | 339 (53.4%) |
| Total | 4,495 (42.6%) | 5,615 (53.2%) |
Disability Status by Sex by Age in Bacon County
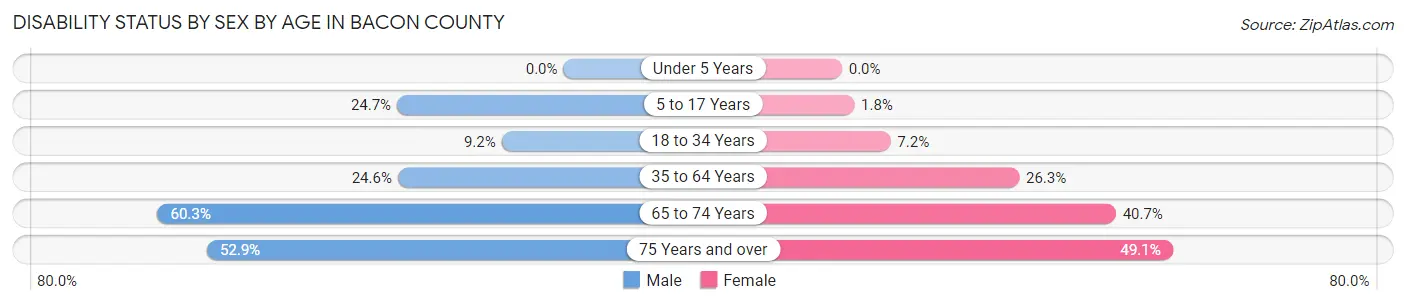
| Age Bracket | Male | Female |
| Under 5 Years | 0 (0.0%) | 0 (0.0%) |
| 5 to 17 Years | 254 (24.7%) | 19 (1.8%) |
| 18 to 34 Years | 77 (9.2%) | 76 (7.2%) |
| 35 to 64 Years | 453 (24.6%) | 570 (26.3%) |
| 65 to 74 Years | 344 (60.3%) | 242 (40.7%) |
| 75 Years and over | 127 (52.9%) | 194 (49.1%) |
Disability Class by Sex by Age in Bacon County
Disability Class: Hearing Difficulty
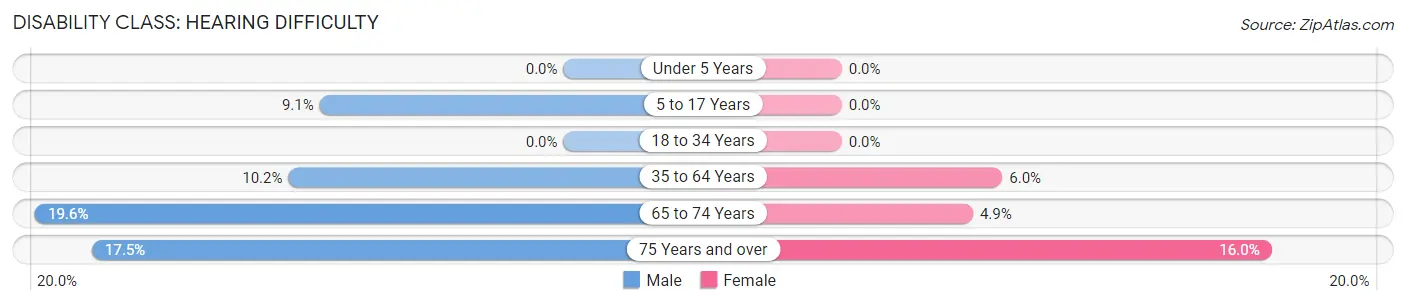
| Age Bracket | Male | Female |
| Under 5 Years | 0 (0.0%) | 0 (0.0%) |
| 5 to 17 Years | 93 (9.0%) | 0 (0.0%) |
| 18 to 34 Years | 0 (0.0%) | 0 (0.0%) |
| 35 to 64 Years | 188 (10.2%) | 129 (6.0%) |
| 65 to 74 Years | 112 (19.6%) | 29 (4.9%) |
| 75 Years and over | 42 (17.5%) | 63 (16.0%) |
Disability Class: Vision Difficulty
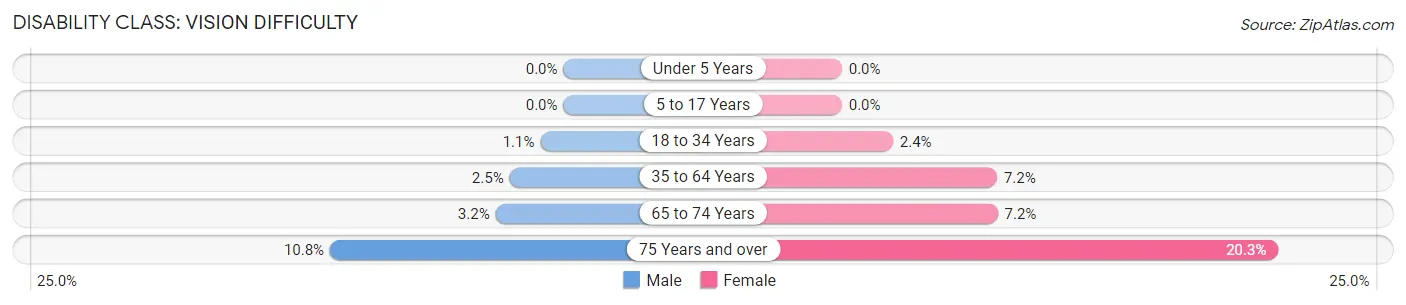
| Age Bracket | Male | Female |
| Under 5 Years | 0 (0.0%) | 0 (0.0%) |
| 5 to 17 Years | 0 (0.0%) | 0 (0.0%) |
| 18 to 34 Years | 9 (1.1%) | 25 (2.4%) |
| 35 to 64 Years | 46 (2.5%) | 156 (7.2%) |
| 65 to 74 Years | 18 (3.2%) | 43 (7.2%) |
| 75 Years and over | 26 (10.8%) | 80 (20.3%) |
Disability Class: Cognitive Difficulty
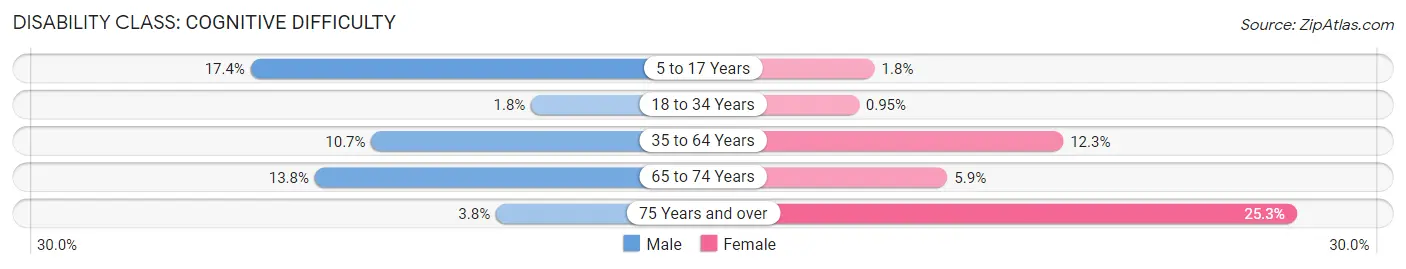
| Age Bracket | Male | Female |
| 5 to 17 Years | 179 (17.4%) | 19 (1.8%) |
| 18 to 34 Years | 15 (1.8%) | 10 (0.9%) |
| 35 to 64 Years | 197 (10.7%) | 267 (12.3%) |
| 65 to 74 Years | 79 (13.8%) | 35 (5.9%) |
| 75 Years and over | 9 (3.7%) | 100 (25.3%) |
Disability Class: Ambulatory Difficulty
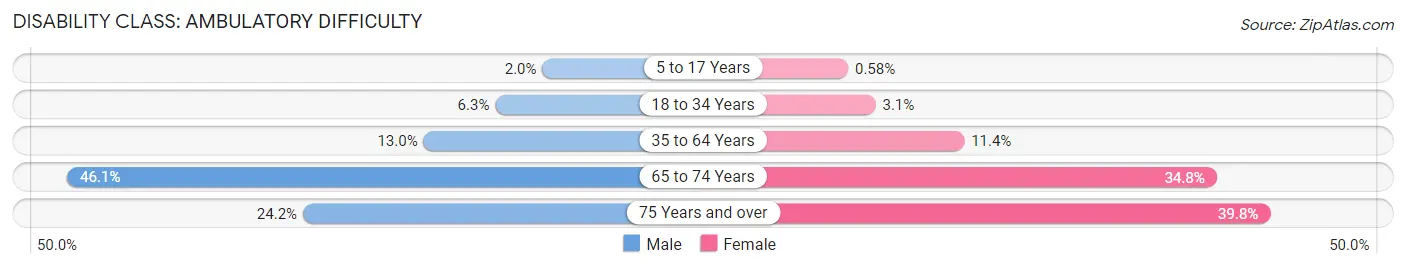
| Age Bracket | Male | Female |
| 5 to 17 Years | 20 (1.9%) | 6 (0.6%) |
| 18 to 34 Years | 53 (6.3%) | 33 (3.1%) |
| 35 to 64 Years | 239 (13.0%) | 246 (11.4%) |
| 65 to 74 Years | 263 (46.1%) | 207 (34.8%) |
| 75 Years and over | 58 (24.2%) | 157 (39.8%) |
Disability Class: Self-Care Difficulty
| Age Bracket | Male | Female |
| 5 to 17 Years | 19 (1.8%) | 19 (1.8%) |
| 18 to 34 Years | 11 (1.3%) | 0 (0.0%) |
| 35 to 64 Years | 100 (5.4%) | 60 (2.8%) |
| 65 to 74 Years | 60 (10.5%) | 55 (9.2%) |
| 75 Years and over | 9 (3.7%) | 66 (16.7%) |
Technology Access in Bacon County
Computing Device Access in Bacon County
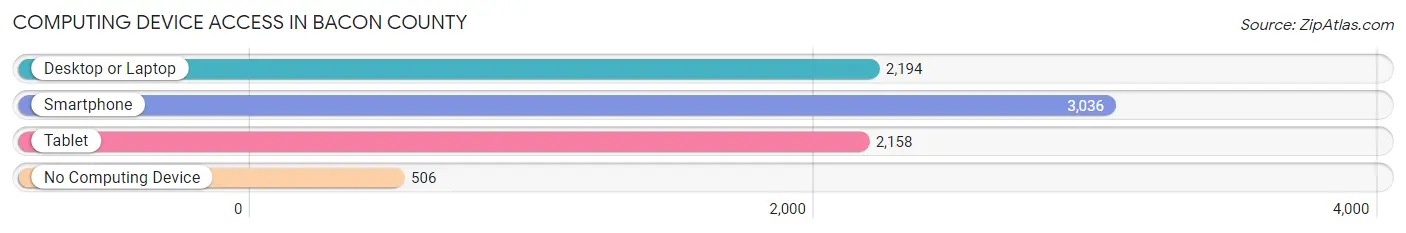
| Device Type | # Households | % Households |
| Desktop or Laptop | 2,194 | 56.1% |
| Smartphone | 3,036 | 77.7% |
| Tablet | 2,158 | 55.2% |
| No Computing Device | 506 | 12.9% |
| Total | 3,909 | 100.0% |
Internet Access in Bacon County
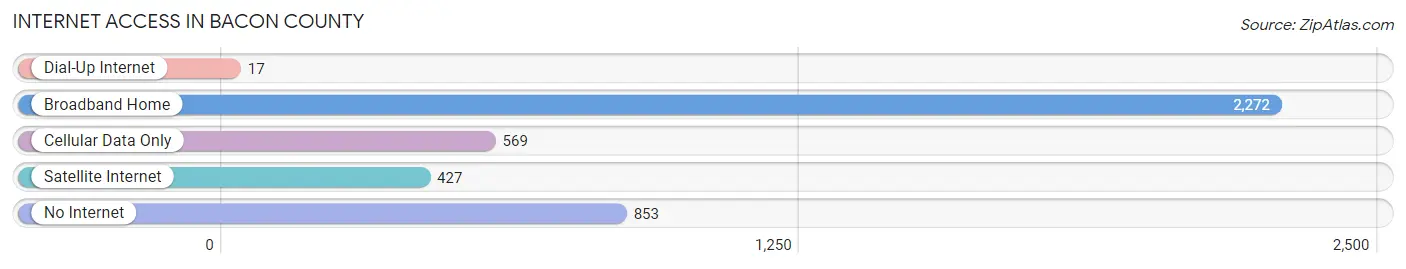
| Internet Type | # Households | % Households |
| Dial-Up Internet | 17 | 0.4% |
| Broadband Home | 2,272 | 58.1% |
| Cellular Data Only | 569 | 14.6% |
| Satellite Internet | 427 | 10.9% |
| No Internet | 853 | 21.8% |
| Total | 3,909 | 100.0% |
Bacon County Summary
Bacon County is a county located in the southeastern part of the U.S. state of Georgia. As of the 2010 census, the population was 11,096. The county seat is Alma. The county was created on December 9, 1914 and named for Augustus Bacon, a former United States Senator from Georgia.
Geography
Bacon County is located in the southeastern part of Georgia, in the coastal plain region of the state. It is bordered by Appling County to the north, Jeff Davis County to the west, Coffee County to the south, and Ware County to the east. The county has a total area of 441 square miles, of which 437 square miles is land and 4.2 square miles (1.0%) is water.
The county is located in the Satilla River basin, with the Satilla River forming the eastern border of the county. The Little Satilla River, a tributary of the Satilla, flows through the center of the county. Other major waterways include the Alapaha River, which forms the western border of the county, and the Ocmulgee River, which forms the northern border.
Demographics
As of the 2010 United States Census, there were 11,096 people, 4,093 households, and 2,945 families residing in the county. The population density was 25.2 inhabitants per square mile (9.7/km2). There were 4,817 housing units at an average density of 11.0 per square mile (4.3/km2). The racial makeup of the county was 68.2% white, 28.2% black or African American, 0.5% Asian, 0.3% American Indian, 0.7% from other races, and 2.1% from two or more races. Those of Hispanic or Latino origin made up 2.2% of the population. In terms of ancestry, 16.2% were American, 8.3% were English, and 6.2% were Irish.
Of the 4,093 households, 33.2% had children under the age of 18 living with them, 48.2% were married couples living together, 17.3% had a female householder with no husband present, 28.7% were non-families, and 24.7% of all households were made up of individuals. The average household size was 2.60 and the average family size was 3.09. The median age was 38.7 years.
The median income for a household in the county was $32,917 and the median income for a family was $41,845. Males had a median income of $31,945 versus $25,845 for females. The per capita income for the county was $16,845. About 16.2% of families and 20.2% of the population were below the poverty line, including 28.2% of those under age 18 and 16.2% of those age 65 or over.
Economy
Bacon County is primarily a rural county, with the majority of its population living in small towns and rural areas. The county’s economy is largely based on agriculture, with the main crops being cotton, peanuts, corn, and soybeans. The county also has a large timber industry, with pine and hardwood being the main products.
The county is home to several small businesses, including a few restaurants, convenience stores, and gas stations. The county also has a few manufacturing plants, including a paper mill and a poultry processing plant.
The county is served by the Bacon County School System, which consists of four elementary schools, one middle school, and one high school. The county also has a public library and a community college.
Conclusion
Bacon County is a rural county located in the southeastern part of Georgia. It is bordered by Appling, Jeff Davis, Coffee, and Ware counties. The county has a total area of 441 square miles, with the Satilla River forming the eastern border. The population of the county was 11,096 as of the 2010 census. The county’s economy is largely based on agriculture, with the main crops being cotton, peanuts, corn, and soybeans. The county also has a large timber industry, with pine and hardwood being the main products. The county is served by the Bacon County School System, which consists of four elementary schools, one middle school, and one high school. The county also has a public library and a community college.
Common Questions
What is Per Capita Income in Bacon County?
Per Capita income in Bacon County is $24,654.
What is the Median Family Income in Bacon County?
Median Family Income in Bacon County is $56,098.
What is the Median Household income in Bacon County?
Median Household Income in Bacon County is $43,938.
What is Income or Wage Gap in Bacon County?
Income or Wage Gap in Bacon County is 3.7%.
Women in Bacon County earn 96.3 cents for every dollar earned by a man.
What is Family Income Deficit in Bacon County?
Family Income Deficit in Bacon County is $13,722.
Families that are below poverty line in Bacon County earn $13,722 less on average than the poverty threshold level.
What is Inequality or Gini Index in Bacon County?
Inequality or Gini Index in Bacon County is 0.49.
What is the Total Population of Bacon County?
Total Population of Bacon County is 11,138.
What is the Total Male Population of Bacon County?
Total Male Population of Bacon County is 5,525.
What is the Total Female Population of Bacon County?
Total Female Population of Bacon County is 5,613.
What is the Ratio of Males per 100 Females in Bacon County?
There are 98.43 Males per 100 Females in Bacon County.
What is the Ratio of Females per 100 Males in Bacon County?
There are 101.59 Females per 100 Males in Bacon County.
What is the Median Population Age in Bacon County?
Median Population Age in Bacon County is 38.1 Years.
What is the Average Family Size in Bacon County
Average Family Size in Bacon County is 3.3 People.
What is the Average Household Size in Bacon County
Average Household Size in Bacon County is 2.7 People.
How Large is the Labor Force in Bacon County?
There are 4,458 People in the Labor Forcein in Bacon County.
What is the Percentage of People in the Labor Force in Bacon County?
51.6% of People are in the Labor Force in Bacon County.
What is the Unemployment Rate in Bacon County?
Unemployment Rate in Bacon County is 4.3%.