Appling County, GA Map & Demographics
Appling County Map
Appling County Overview
$23,940
PER CAPITA INCOME
$54,028
AVG FAMILY INCOME
$43,268
AVG HOUSEHOLD INCOME
30.2%
WAGE / INCOME GAP [ % ]
69.8¢/ $1
WAGE / INCOME GAP [ $ ]
0.47
INEQUALITY / GINI INDEX
18,441
TOTAL POPULATION
9,309
MALE POPULATION
9,132
FEMALE POPULATION
101.94
MALES / 100 FEMALES
98.10
FEMALES / 100 MALES
39.6
MEDIAN AGE
3.0
AVG FAMILY SIZE
2.6
AVG HOUSEHOLD SIZE
7,667
LABOR FORCE [ PEOPLE ]
53.2%
PERCENT IN LABOR FORCE
3.3%
UNEMPLOYMENT RATE
Appling County Area Codes
Income in Appling County
Income Overview in Appling County
Per Capita Income in Appling County is $23,940, while median incomes of families and households are $54,028 and $43,268 respectively.
| Characteristic | Number | Measure |
| Per Capita Income | 18,441 | $23,940 |
| Median Family Income | 5,132 | $54,028 |
| Mean Family Income | 5,132 | $69,003 |
| Median Household Income | 6,890 | $43,268 |
| Mean Household Income | 6,890 | $59,805 |
| Income Deficit | 5,132 | $0 |
| Wage / Income Gap (%) | 18,441 | 30.16% |
| Wage / Income Gap ($) | 18,441 | 69.84¢ per $1 |
| Gini / Inequality Index | 18,441 | 0.47 |
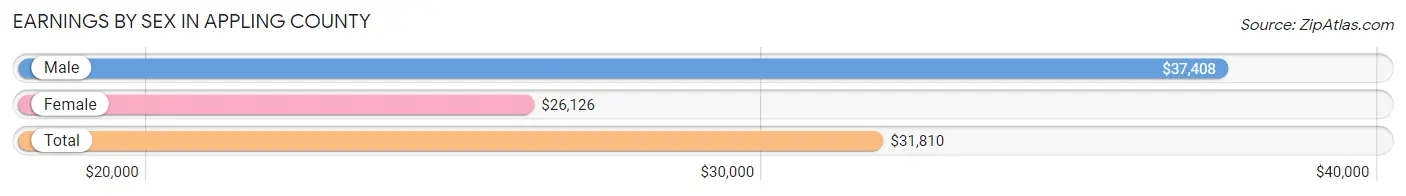
Earnings by Sex in Appling County
Average Earnings in Appling County are $31,810, $37,408 for men and $26,126 for women, a difference of 30.2%.
| Sex | Number | Average Earnings |
| Male | 4,345 (55.3%) | $37,408 |
| Female | 3,510 (44.7%) | $26,126 |
| Total | 7,855 (100.0%) | $31,810 |
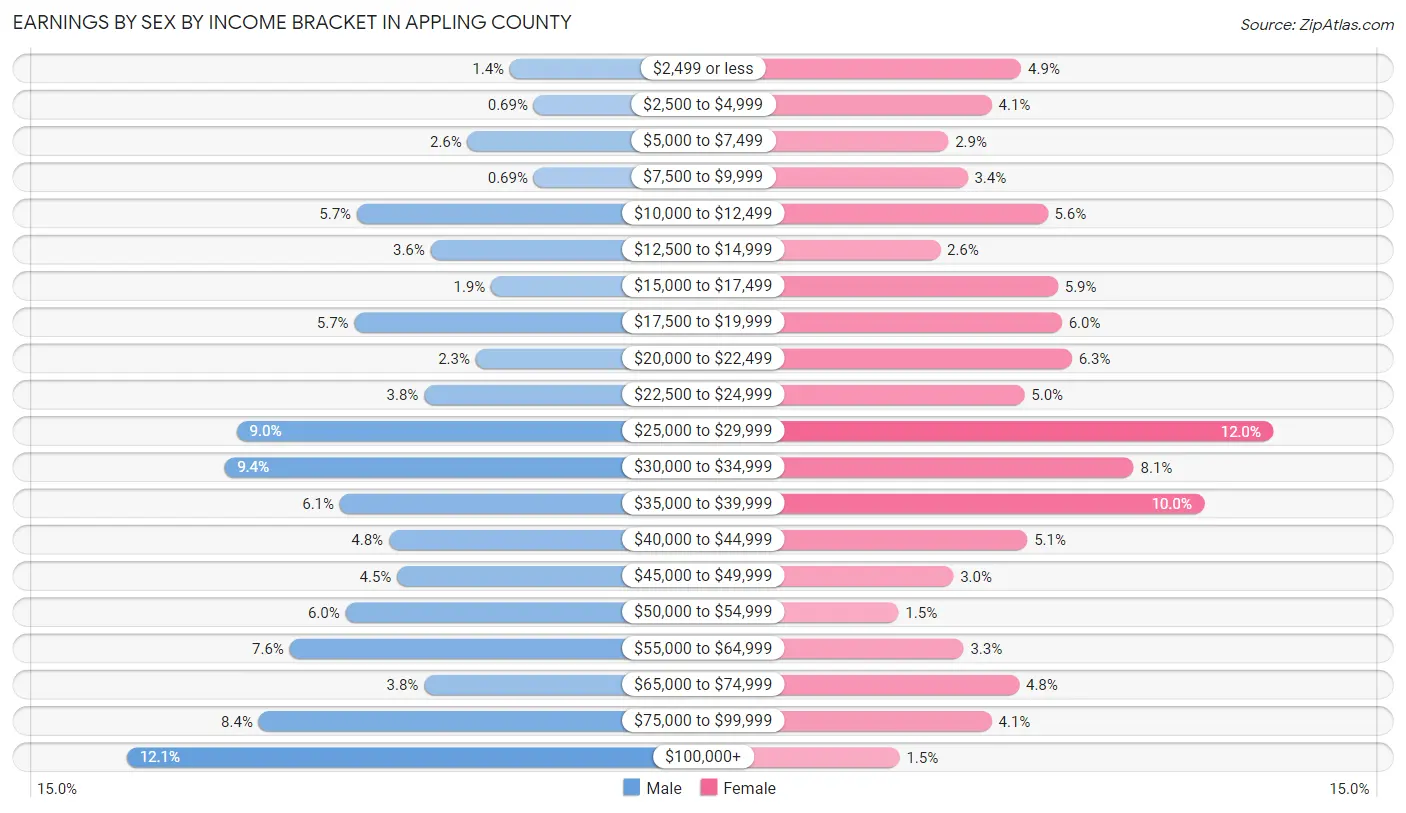
Earnings by Sex by Income Bracket in Appling County
The most common earnings brackets in Appling County are $100,000+ for men (527 | 12.1%) and $25,000 to $29,999 for women (420 | 12.0%).
| Income | Male | Female |
| $2,499 or less | 59 (1.4%) | 172 (4.9%) |
| $2,500 to $4,999 | 30 (0.7%) | 143 (4.1%) |
| $5,000 to $7,499 | 111 (2.5%) | 100 (2.9%) |
| $7,500 to $9,999 | 30 (0.7%) | 119 (3.4%) |
| $10,000 to $12,499 | 246 (5.7%) | 198 (5.6%) |
| $12,500 to $14,999 | 156 (3.6%) | 92 (2.6%) |
| $15,000 to $17,499 | 82 (1.9%) | 208 (5.9%) |
| $17,500 to $19,999 | 249 (5.7%) | 212 (6.0%) |
| $20,000 to $22,499 | 101 (2.3%) | 222 (6.3%) |
| $22,500 to $24,999 | 164 (3.8%) | 175 (5.0%) |
| $25,000 to $29,999 | 393 (9.0%) | 420 (12.0%) |
| $30,000 to $34,999 | 408 (9.4%) | 283 (8.1%) |
| $35,000 to $39,999 | 267 (6.1%) | 352 (10.0%) |
| $40,000 to $44,999 | 207 (4.8%) | 178 (5.1%) |
| $45,000 to $49,999 | 197 (4.5%) | 105 (3.0%) |
| $50,000 to $54,999 | 260 (6.0%) | 51 (1.5%) |
| $55,000 to $64,999 | 328 (7.5%) | 115 (3.3%) |
| $65,000 to $74,999 | 164 (3.8%) | 170 (4.8%) |
| $75,000 to $99,999 | 366 (8.4%) | 143 (4.1%) |
| $100,000+ | 527 (12.1%) | 52 (1.5%) |
| Total | 4,345 (100.0%) | 3,510 (100.0%) |
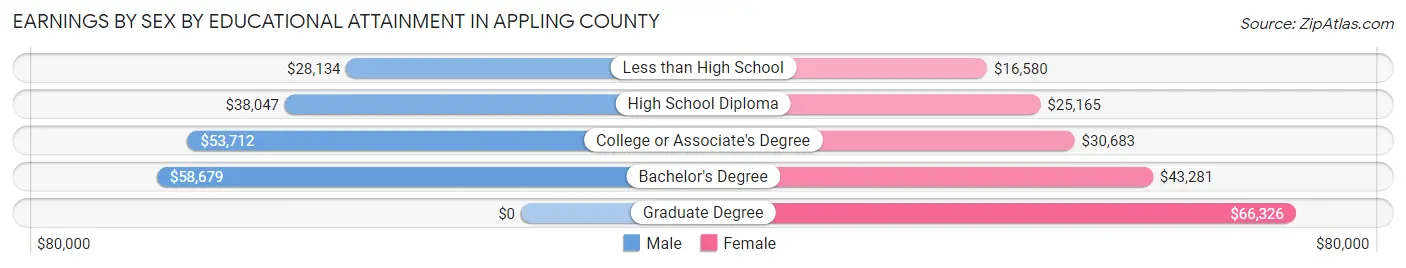
Earnings by Sex by Educational Attainment in Appling County
Average earnings in Appling County are $44,736 for men and $26,497 for women, a difference of 40.8%. Men with an educational attainment of bachelor's degree enjoy the highest average annual earnings of $58,679, while those with less than high school education earn the least with $28,134. Women with an educational attainment of graduate degree earn the most with the average annual earnings of $66,326, while those with less than high school education have the smallest earnings of $16,580.
| Educational Attainment | Male Income | Female Income |
| Less than High School | $28,134 | $16,580 |
| High School Diploma | $38,047 | $25,165 |
| College or Associate's Degree | $53,712 | $30,683 |
| Bachelor's Degree | $58,679 | $43,281 |
| Graduate Degree | - | - |
| Total | $44,736 | $26,497 |
Family Income in Appling County
Family Income Brackets in Appling County
According to the Appling County family income data, there are 1,026 families falling into the $50,000 to $74,999 income range, which is the most common income bracket and makes up 20.0% of all families. Conversely, the $200,000+ income bracket is the least frequent group with only 180 families (3.5%) belonging to this category.
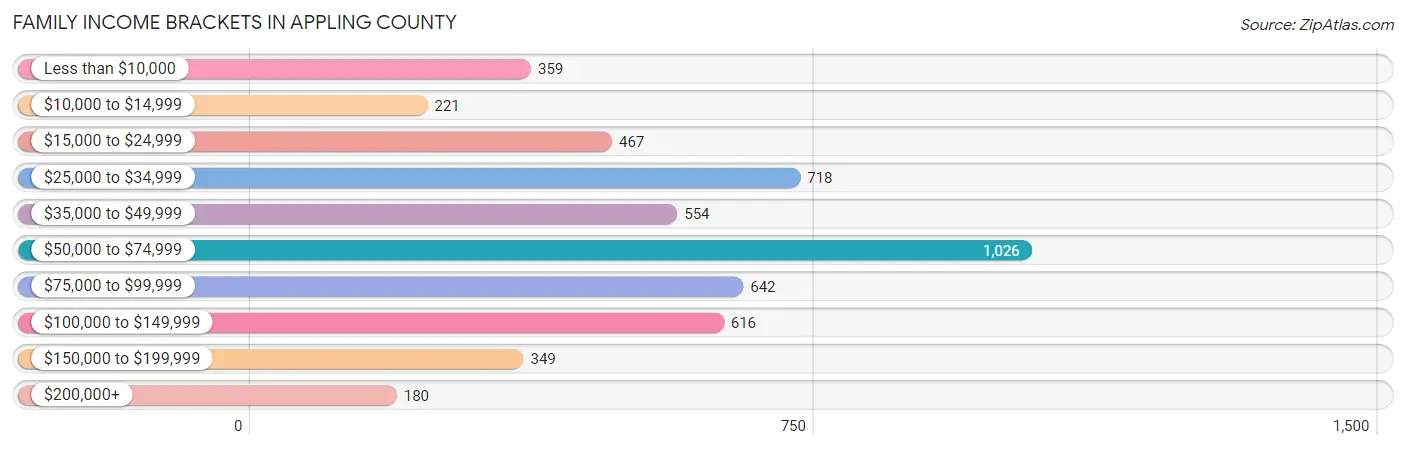
| Income Bracket | # Families | % Families |
| Less than $10,000 | 359 | 7.0% |
| $10,000 to $14,999 | 221 | 4.3% |
| $15,000 to $24,999 | 467 | 9.1% |
| $25,000 to $34,999 | 718 | 14.0% |
| $35,000 to $49,999 | 554 | 10.8% |
| $50,000 to $74,999 | 1,026 | 20.0% |
| $75,000 to $99,999 | 642 | 12.5% |
| $100,000 to $149,999 | 616 | 12.0% |
| $150,000 to $199,999 | 349 | 6.8% |
| $200,000+ | 180 | 3.5% |
Family Income by Famaliy Size in Appling County
4-person families (985 | 19.2%) account for the highest median family income in Appling County with $70,708 per family, while 2-person families (2,519 | 49.1%) have the highest median income of $24,157 per family member.
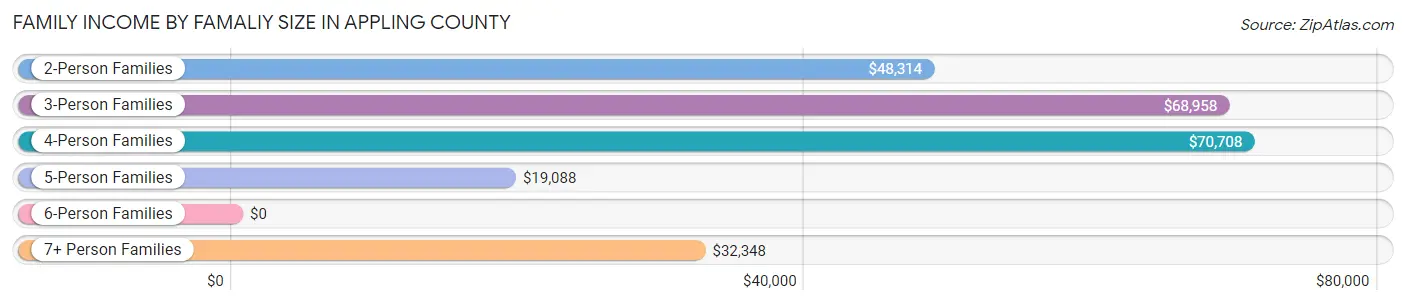
| Income Bracket | # Families | Median Income |
| 2-Person Families | 2,519 (49.1%) | $48,314 |
| 3-Person Families | 1,063 (20.7%) | $68,958 |
| 4-Person Families | 985 (19.2%) | $70,708 |
| 5-Person Families | 445 (8.7%) | $19,088 |
| 6-Person Families | 43 (0.8%) | $0 |
| 7+ Person Families | 77 (1.5%) | $32,348 |
| Total | 5,132 (100.0%) | $54,028 |
Family Income by Number of Earners in Appling County
The median family income in Appling County is $54,028, with families comprising 3+ earners (267) having the highest median family income of $110,369, while families with no earners (1,130) have the lowest median family income of $22,841, accounting for 5.2% and 22.0% of families, respectively.
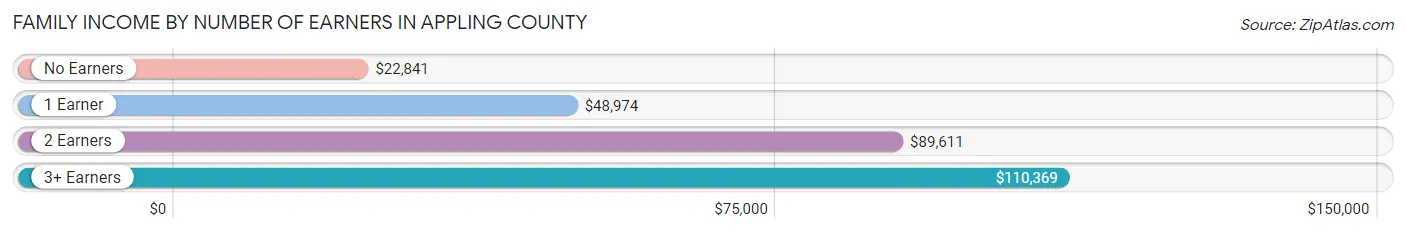
| Number of Earners | # Families | Median Income |
| No Earners | 1,130 (22.0%) | $22,841 |
| 1 Earner | 1,921 (37.4%) | $48,974 |
| 2 Earners | 1,814 (35.3%) | $89,611 |
| 3+ Earners | 267 (5.2%) | $110,369 |
| Total | 5,132 (100.0%) | $54,028 |
Household Income in Appling County
Household Income Brackets in Appling County
With 1,137 households falling in the category, the $50,000 to $74,999 income range is the most frequent in Appling County, accounting for 16.5% of all households. In contrast, only 193 households (2.8%) fall into the $200,000+ income bracket, making it the least populous group.
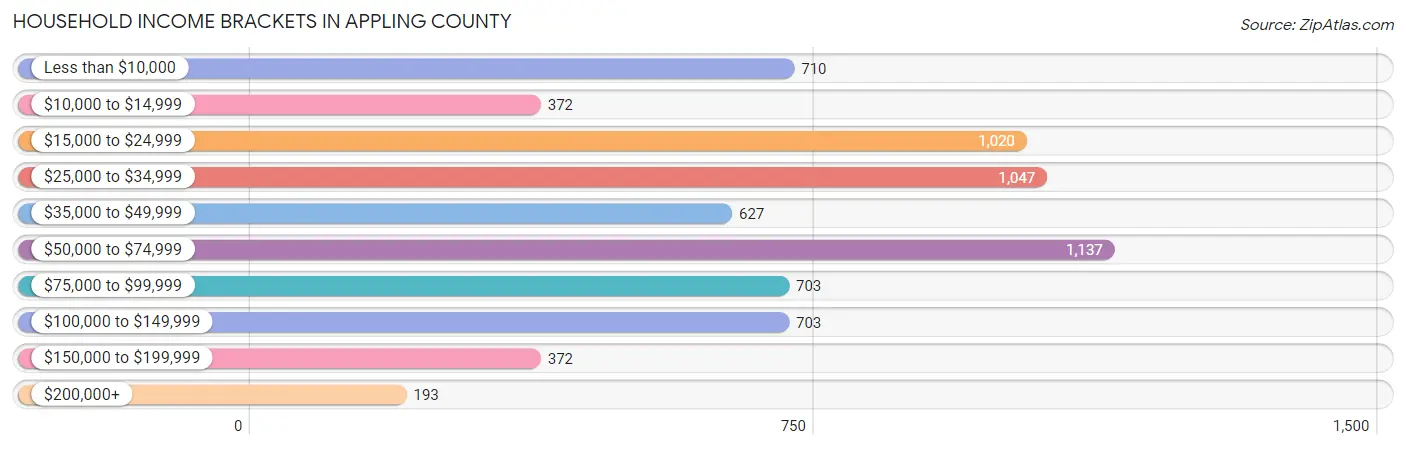
| Income Bracket | # Households | % Households |
| Less than $10,000 | 710 | 10.3% |
| $10,000 to $14,999 | 372 | 5.4% |
| $15,000 to $24,999 | 1,020 | 14.8% |
| $25,000 to $34,999 | 1,047 | 15.2% |
| $35,000 to $49,999 | 627 | 9.1% |
| $50,000 to $74,999 | 1,137 | 16.5% |
| $75,000 to $99,999 | 703 | 10.2% |
| $100,000 to $149,999 | 703 | 10.2% |
| $150,000 to $199,999 | 372 | 5.4% |
| $200,000+ | 193 | 2.8% |
Household Income by Householder Age in Appling County
The median household income in Appling County is $43,268, with the highest median household income of $60,482 found in the 25 to 44 years age bracket for the primary householder. A total of 1,984 households (28.8%) fall into this category. Meanwhile, the 65+ years age bracket for the primary householder has the lowest median household income of $30,786, with 1,991 households (28.9%) in this group.
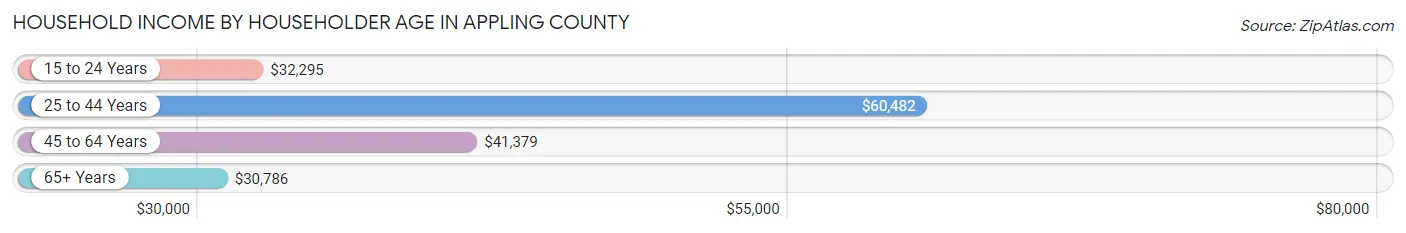
| Income Bracket | # Households | Median Income |
| 15 to 24 Years | 395 (5.7%) | $32,295 |
| 25 to 44 Years | 1,984 (28.8%) | $60,482 |
| 45 to 64 Years | 2,520 (36.6%) | $41,379 |
| 65+ Years | 1,991 (28.9%) | $30,786 |
| Total | 6,890 (100.0%) | $43,268 |
Poverty in Appling County
Income Below Poverty by Sex and Age in Appling County
With 25.4% poverty level for males and 25.2% for females among the residents of Appling County, 6 to 11 year old males and 16 and 17 year old females are the most vulnerable to poverty, with 486 males (56.8%) and 151 females (61.4%) in their respective age groups living below the poverty level.
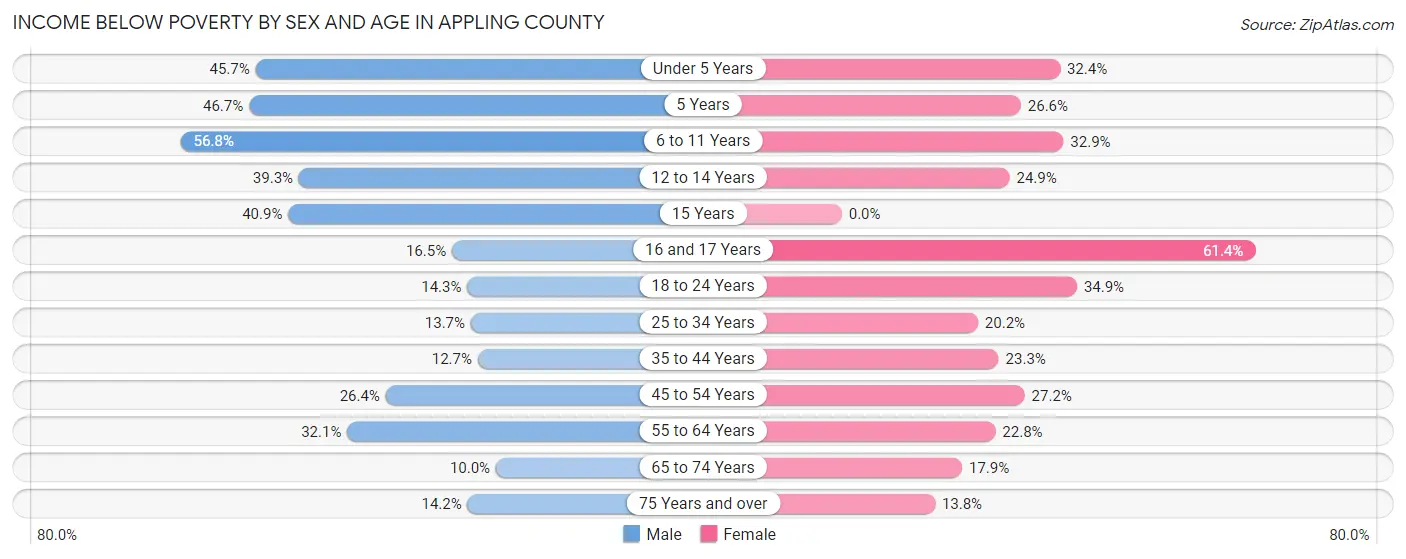
| Age Bracket | Male | Female |
| Under 5 Years | 261 (45.7%) | 185 (32.4%) |
| 5 Years | 42 (46.7%) | 46 (26.6%) |
| 6 to 11 Years | 486 (56.8%) | 260 (32.9%) |
| 12 to 14 Years | 150 (39.3%) | 73 (24.9%) |
| 15 Years | 87 (40.8%) | 0 (0.0%) |
| 16 and 17 Years | 43 (16.5%) | 151 (61.4%) |
| 18 to 24 Years | 133 (14.3%) | 227 (34.9%) |
| 25 to 34 Years | 133 (13.7%) | 209 (20.2%) |
| 35 to 44 Years | 140 (12.7%) | 258 (23.3%) |
| 45 to 54 Years | 277 (26.4%) | 313 (27.2%) |
| 55 to 64 Years | 378 (32.1%) | 287 (22.8%) |
| 65 to 74 Years | 94 (10.0%) | 172 (17.9%) |
| 75 Years and over | 73 (14.2%) | 99 (13.8%) |
| Total | 2,297 (25.4%) | 2,280 (25.2%) |
Income Above Poverty by Sex and Age in Appling County
According to the poverty statistics in Appling County, males aged 65 to 74 years and females aged 15 years are the age groups that are most secure financially, with 90.0% of males and 100.0% of females in these age groups living above the poverty line.
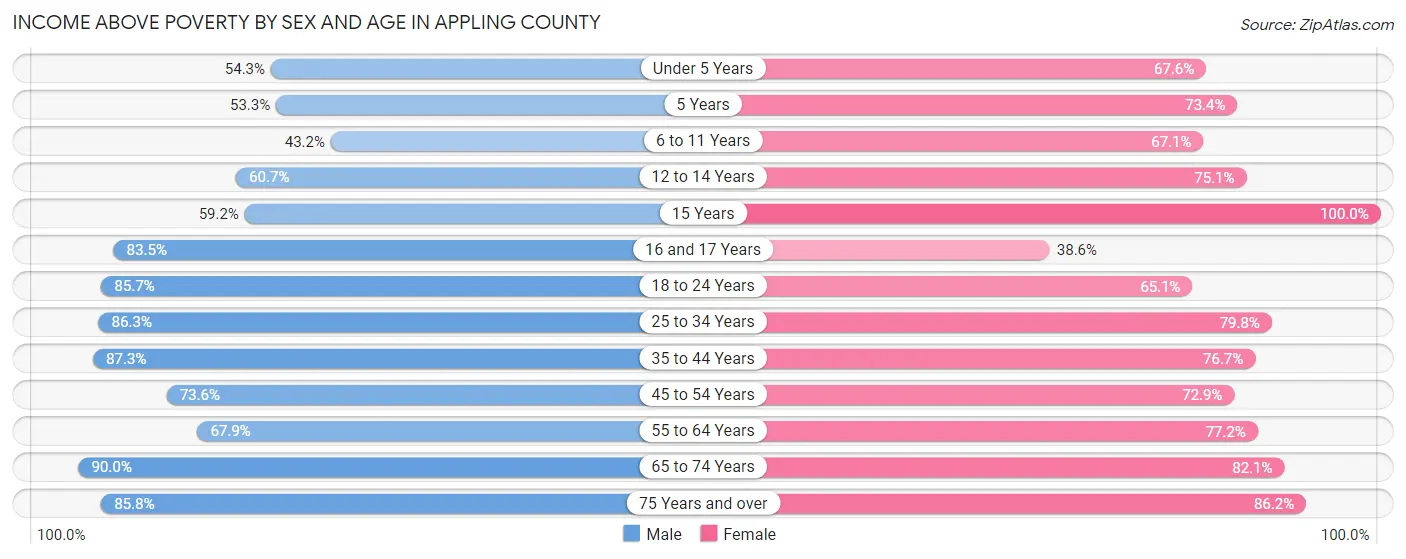
| Age Bracket | Male | Female |
| Under 5 Years | 310 (54.3%) | 386 (67.6%) |
| 5 Years | 48 (53.3%) | 127 (73.4%) |
| 6 to 11 Years | 369 (43.2%) | 530 (67.1%) |
| 12 to 14 Years | 232 (60.7%) | 220 (75.1%) |
| 15 Years | 126 (59.2%) | 77 (100.0%) |
| 16 and 17 Years | 217 (83.5%) | 95 (38.6%) |
| 18 to 24 Years | 800 (85.7%) | 423 (65.1%) |
| 25 to 34 Years | 836 (86.3%) | 825 (79.8%) |
| 35 to 44 Years | 962 (87.3%) | 850 (76.7%) |
| 45 to 54 Years | 773 (73.6%) | 840 (72.9%) |
| 55 to 64 Years | 800 (67.9%) | 971 (77.2%) |
| 65 to 74 Years | 845 (90.0%) | 791 (82.1%) |
| 75 Years and over | 440 (85.8%) | 617 (86.2%) |
| Total | 6,758 (74.6%) | 6,752 (74.8%) |
Income Below Poverty Among Married-Couple Families in Appling County
The poverty statistics for married-couple families in Appling County show that 18.5% or 737 of the total 3,973 families live below the poverty line. Families with 5 or more children have the highest poverty rate of 71.9%, comprising of 41 families. On the other hand, families with no children have the lowest poverty rate of 15.3%, which includes 369 families.
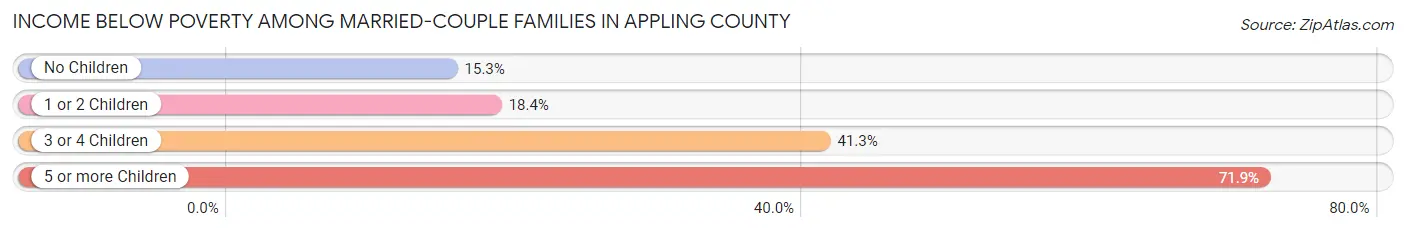
| Children | Above Poverty | Below Poverty |
| No Children | 2,044 (84.7%) | 369 (15.3%) |
| 1 or 2 Children | 1,045 (81.6%) | 235 (18.4%) |
| 3 or 4 Children | 131 (58.7%) | 92 (41.3%) |
| 5 or more Children | 16 (28.1%) | 41 (71.9%) |
| Total | 3,236 (81.5%) | 737 (18.5%) |
Income Below Poverty Among Single-Parent Households in Appling County
According to the poverty data in Appling County, 20.8% or 67 single-father households and 32.1% or 269 single-mother households are living below the poverty line. Among single-father households, those with 1 or 2 children have the highest poverty rate, with 67 households (26.4%) experiencing poverty. Likewise, among single-mother households, those with 3 or 4 children have the highest poverty rate, with 157 households (70.1%) falling below the poverty line.
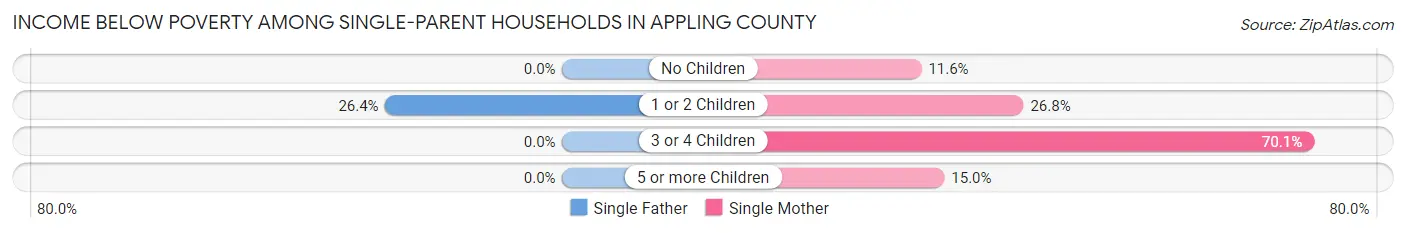
| Children | Single Father | Single Mother |
| No Children | 0 (0.0%) | 38 (11.6%) |
| 1 or 2 Children | 67 (26.4%) | 71 (26.8%) |
| 3 or 4 Children | 0 (0.0%) | 157 (70.1%) |
| 5 or more Children | 0 (0.0%) | 3 (15.0%) |
| Total | 67 (20.8%) | 269 (32.1%) |
Income Below Poverty Among Married-Couple vs Single-Parent Households in Appling County
The poverty data for Appling County shows that 737 of the married-couple family households (18.5%) and 336 of the single-parent households (29.0%) are living below the poverty level. Within the married-couple family households, those with 5 or more children have the highest poverty rate, with 41 households (71.9%) falling below the poverty line. Among the single-parent households, those with 3 or 4 children have the highest poverty rate, with 157 household (70.1%) living below poverty.
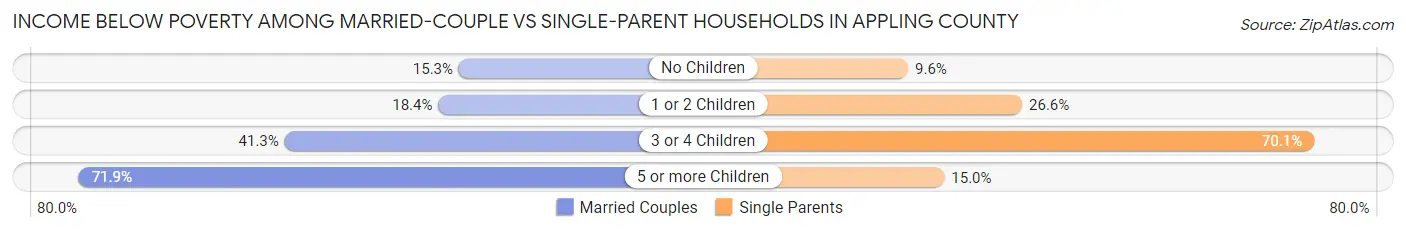
| Children | Married-Couple Families | Single-Parent Households |
| No Children | 369 (15.3%) | 38 (9.6%) |
| 1 or 2 Children | 235 (18.4%) | 138 (26.6%) |
| 3 or 4 Children | 92 (41.3%) | 157 (70.1%) |
| 5 or more Children | 41 (71.9%) | 3 (15.0%) |
| Total | 737 (18.5%) | 336 (29.0%) |
Race in Appling County
The most populous races in Appling County are White / Caucasian (13,032 | 70.7%), Black / African American (3,349 | 18.2%), and Hispanic or Latino (1,898 | 10.3%).
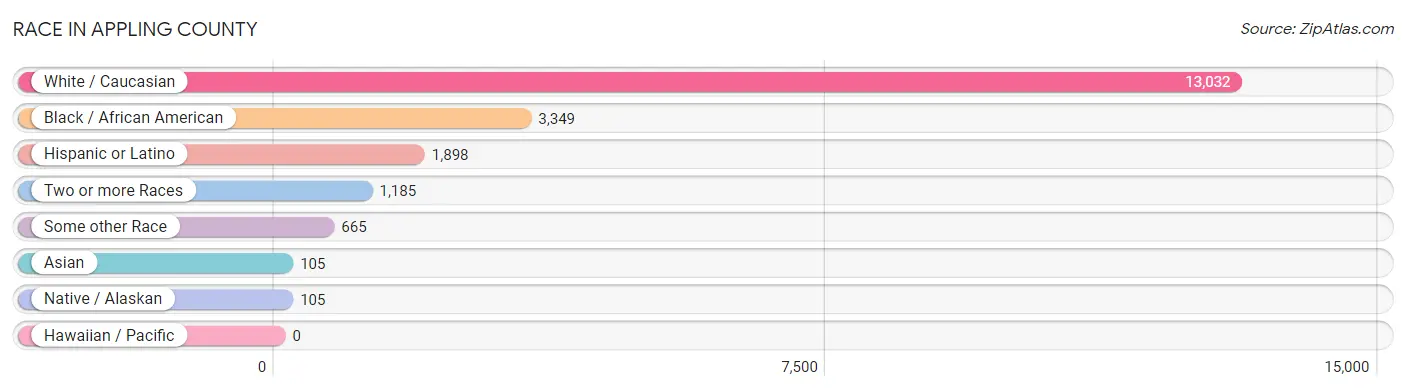
| Race | # Population | % Population |
| Asian | 105 | 0.6% |
| Black / African American | 3,349 | 18.2% |
| Hawaiian / Pacific | 0 | 0.0% |
| Hispanic or Latino | 1,898 | 10.3% |
| Native / Alaskan | 105 | 0.6% |
| White / Caucasian | 13,032 | 70.7% |
| Two or more Races | 1,185 | 6.4% |
| Some other Race | 665 | 3.6% |
| Total | 18,441 | 100.0% |
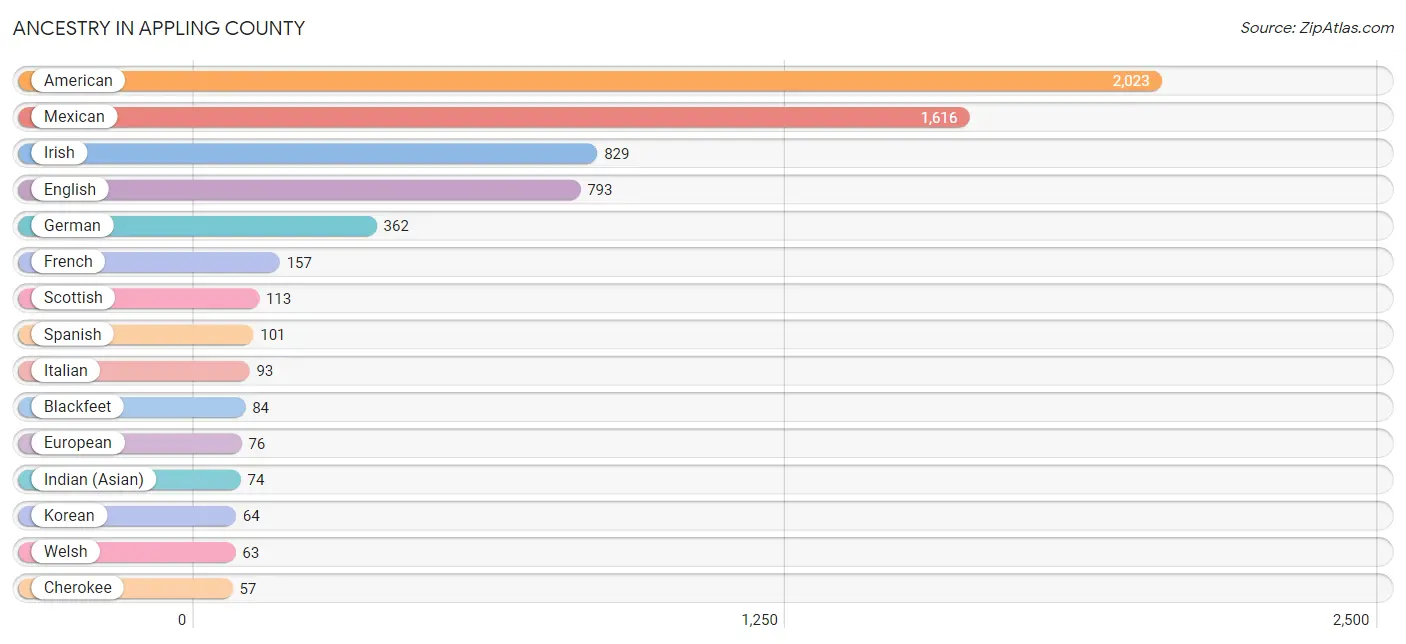
Ancestry in Appling County
The most populous ancestries reported in Appling County are American (2,023 | 11.0%), Mexican (1,616 | 8.8%), Irish (829 | 4.5%), English (793 | 4.3%), and German (362 | 2.0%), together accounting for 30.5% of all Appling County residents.
| Ancestry | # Population | % Population |
| African | 4 | 0.0% |
| Alaska Native | 2 | 0.0% |
| American | 2,023 | 11.0% |
| Arab | 35 | 0.2% |
| Argentinean | 35 | 0.2% |
| Blackfeet | 84 | 0.5% |
| British | 56 | 0.3% |
| Central American | 28 | 0.2% |
| Cherokee | 57 | 0.3% |
| Colombian | 14 | 0.1% |
| Creek | 33 | 0.2% |
| Dutch | 24 | 0.1% |
| Eastern European | 4 | 0.0% |
| English | 793 | 4.3% |
| European | 76 | 0.4% |
| French | 157 | 0.9% |
| German | 362 | 2.0% |
| Guamanian / Chamorro | 8 | 0.0% |
| Guatemalan | 26 | 0.1% |
| Indian (Asian) | 74 | 0.4% |
| Irish | 829 | 4.5% |
| Italian | 93 | 0.5% |
| Jamaican | 25 | 0.1% |
| Korean | 64 | 0.4% |
| Mexican | 1,616 | 8.8% |
| Mexican American Indian | 56 | 0.3% |
| Nicaraguan | 2 | 0.0% |
| Polish | 13 | 0.1% |
| Portuguese | 2 | 0.0% |
| Puerto Rican | 42 | 0.2% |
| Scotch-Irish | 15 | 0.1% |
| Scottish | 113 | 0.6% |
| South American | 49 | 0.3% |
| Spaniard | 42 | 0.2% |
| Spanish | 101 | 0.5% |
| Subsaharan African | 4 | 0.0% |
| Swedish | 21 | 0.1% |
| Syrian | 35 | 0.2% |
| Welsh | 63 | 0.3% | View All 39 Rows |
Immigrants in Appling County
The most numerous immigrant groups reported in Appling County came from Latin America (897 | 4.9%), Central America (845 | 4.6%), Mexico (845 | 4.6%), Asia (149 | 0.8%), and Europe (115 | 0.6%), together accounting for 15.4% of all Appling County residents.
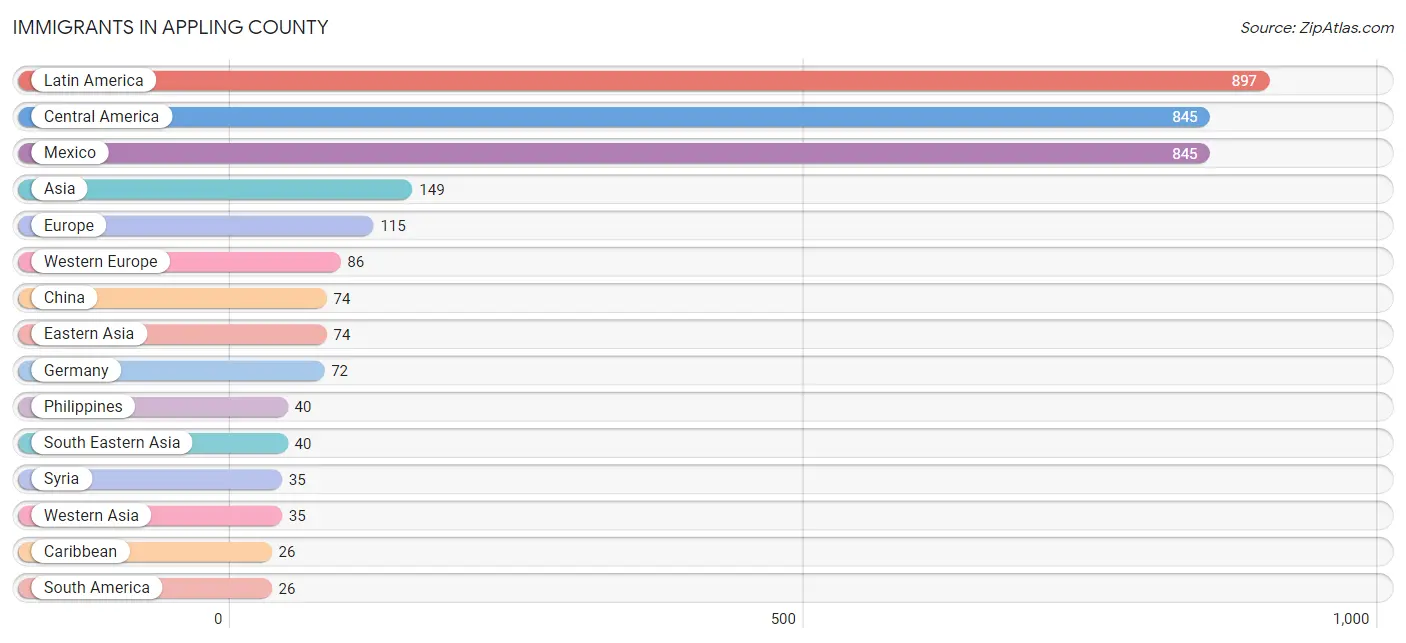
| Immigration Origin | # Population | % Population |
| Argentina | 12 | 0.1% |
| Asia | 149 | 0.8% |
| Caribbean | 26 | 0.1% |
| Central America | 845 | 4.6% |
| China | 74 | 0.4% |
| Colombia | 14 | 0.1% |
| Cuba | 1 | 0.0% |
| Eastern Asia | 74 | 0.4% |
| Eastern Europe | 11 | 0.1% |
| Europe | 115 | 0.6% |
| France | 14 | 0.1% |
| Germany | 72 | 0.4% |
| Ireland | 9 | 0.1% |
| Jamaica | 25 | 0.1% |
| Latin America | 897 | 4.9% |
| Mexico | 845 | 4.6% |
| Northern Europe | 18 | 0.1% |
| Philippines | 40 | 0.2% |
| Romania | 11 | 0.1% |
| South America | 26 | 0.1% |
| South Eastern Asia | 40 | 0.2% |
| Syria | 35 | 0.2% |
| Western Asia | 35 | 0.2% |
| Western Europe | 86 | 0.5% | View All 24 Rows |
Sex and Age in Appling County
Sex and Age in Appling County
The most populous age groups in Appling County are 15 to 19 Years (736 | 7.9%) for men and 50 to 54 Years (678 | 7.4%) for women.
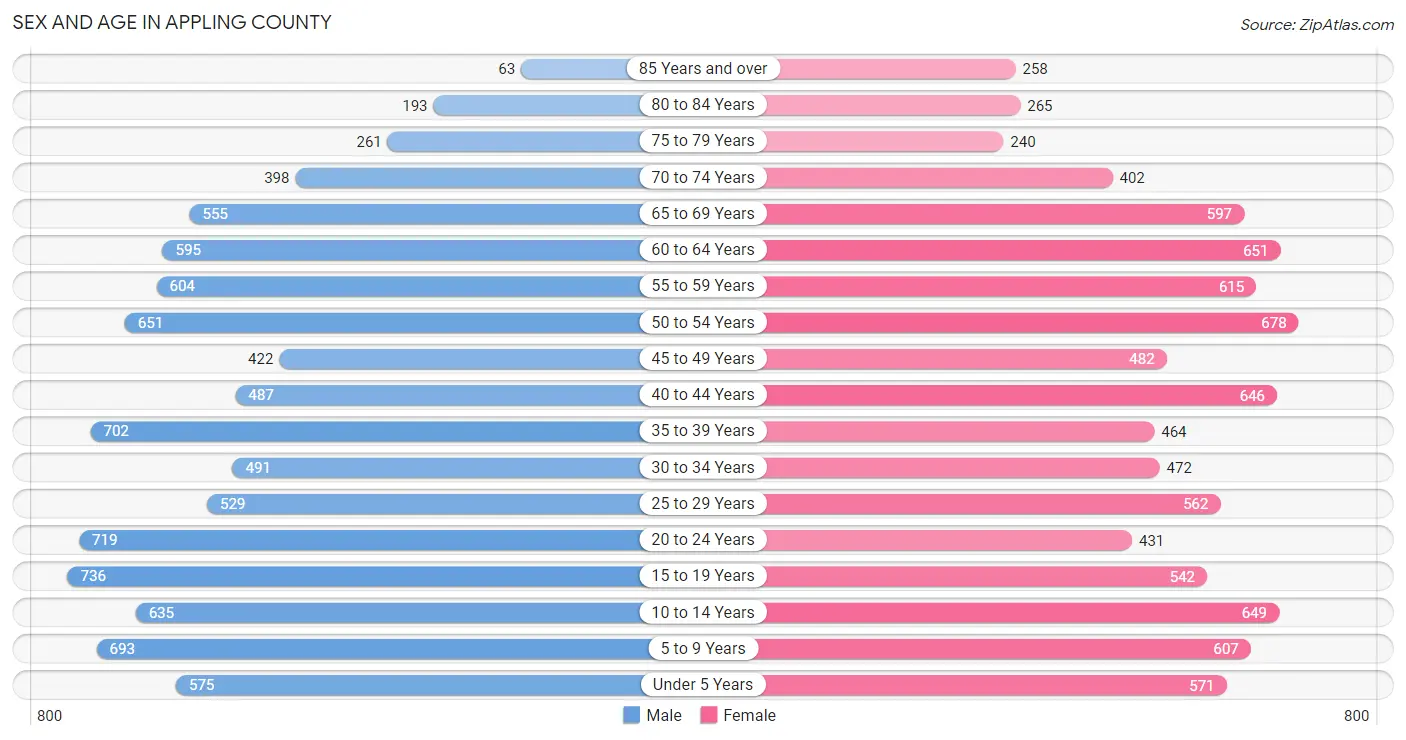
| Age Bracket | Male | Female |
| Under 5 Years | 575 (6.2%) | 571 (6.2%) |
| 5 to 9 Years | 693 (7.4%) | 607 (6.7%) |
| 10 to 14 Years | 635 (6.8%) | 649 (7.1%) |
| 15 to 19 Years | 736 (7.9%) | 542 (5.9%) |
| 20 to 24 Years | 719 (7.7%) | 431 (4.7%) |
| 25 to 29 Years | 529 (5.7%) | 562 (6.1%) |
| 30 to 34 Years | 491 (5.3%) | 472 (5.2%) |
| 35 to 39 Years | 702 (7.5%) | 464 (5.1%) |
| 40 to 44 Years | 487 (5.2%) | 646 (7.1%) |
| 45 to 49 Years | 422 (4.5%) | 482 (5.3%) |
| 50 to 54 Years | 651 (7.0%) | 678 (7.4%) |
| 55 to 59 Years | 604 (6.5%) | 615 (6.7%) |
| 60 to 64 Years | 595 (6.4%) | 651 (7.1%) |
| 65 to 69 Years | 555 (6.0%) | 597 (6.5%) |
| 70 to 74 Years | 398 (4.3%) | 402 (4.4%) |
| 75 to 79 Years | 261 (2.8%) | 240 (2.6%) |
| 80 to 84 Years | 193 (2.1%) | 265 (2.9%) |
| 85 Years and over | 63 (0.7%) | 258 (2.8%) |
| Total | 9,309 (100.0%) | 9,132 (100.0%) |
Families and Households in Appling County
Median Family Size in Appling County
The median family size in Appling County is 3.04 persons per family, with single female/mother families (837 | 16.3%) accounting for the largest median family size of 4.29 persons per family. On the other hand, single male/father families (322 | 6.3%) represent the smallest median family size with 2.16 persons per family.
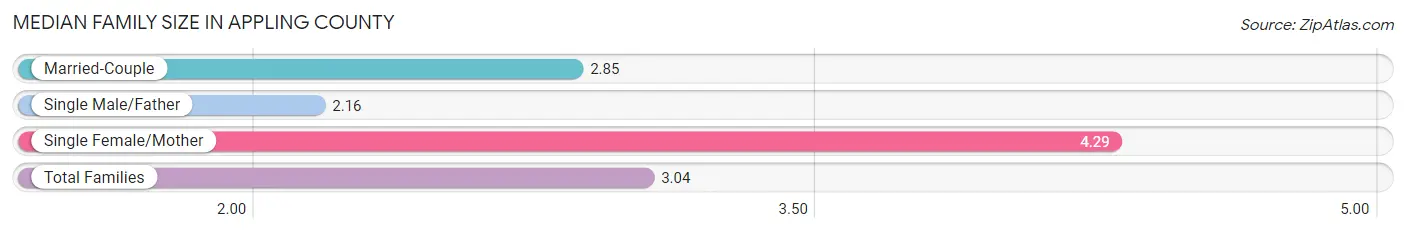
| Family Type | # Families | Family Size |
| Married-Couple | 3,973 (77.4%) | 2.85 |
| Single Male/Father | 322 (6.3%) | 2.16 |
| Single Female/Mother | 837 (16.3%) | 4.29 |
| Total Families | 5,132 (100.0%) | 3.04 |
Median Household Size in Appling County
The median household size in Appling County is 2.61 persons per household, with single female/mother households (837 | 12.1%) accounting for the largest median household size of 4.53 persons per household. non-family households (1,758 | 25.5%) represent the smallest median household size with 1.10 persons per household.
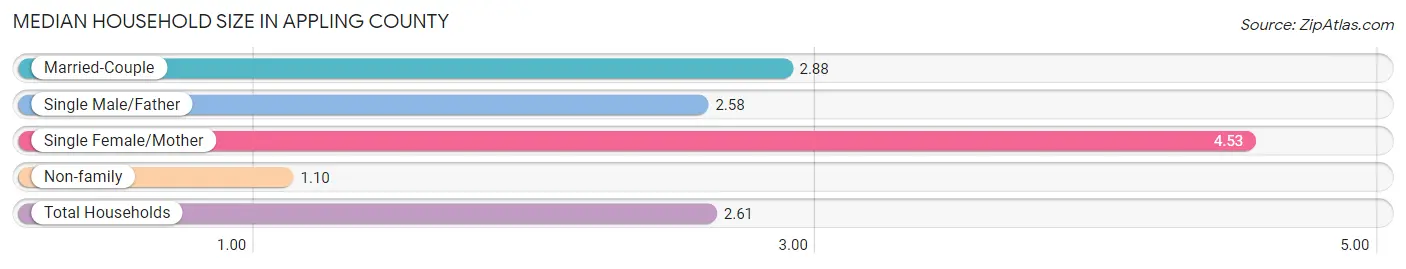
| Household Type | # Households | Household Size |
| Married-Couple | 3,973 (57.7%) | 2.88 |
| Single Male/Father | 322 (4.7%) | 2.58 |
| Single Female/Mother | 837 (12.1%) | 4.53 |
| Non-family | 1,758 (25.5%) | 1.10 |
| Total Households | 6,890 (100.0%) | 2.61 |
Household Size by Marriage Status in Appling County
Out of a total of 6,890 households in Appling County, 5,132 (74.5%) are family households, while 1,758 (25.5%) are nonfamily households. The most numerous type of family households are 2-person households, comprising 2,291, and the most common type of nonfamily households are 1-person households, comprising 1,632.
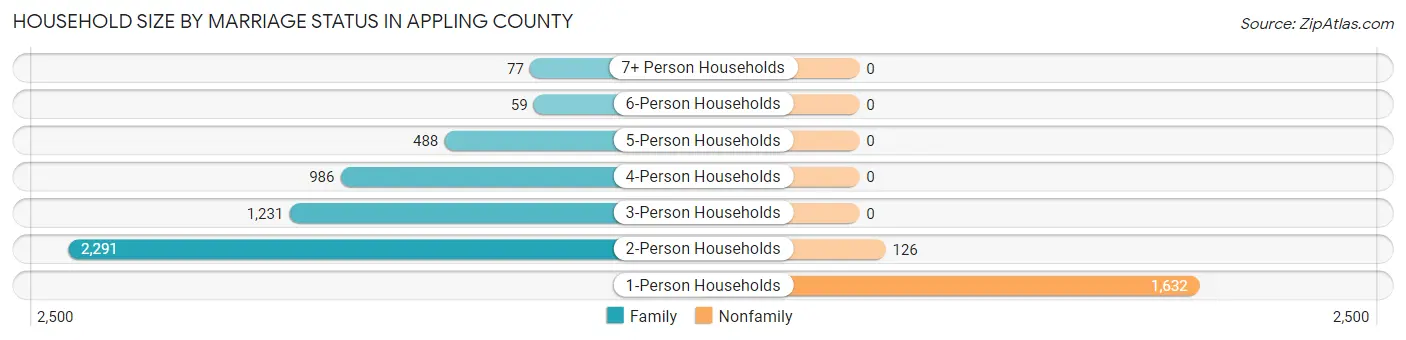
| Household Size | Family Households | Nonfamily Households |
| 1-Person Households | - | 1,632 (23.7%) |
| 2-Person Households | 2,291 (33.3%) | 126 (1.8%) |
| 3-Person Households | 1,231 (17.9%) | 0 (0.0%) |
| 4-Person Households | 986 (14.3%) | 0 (0.0%) |
| 5-Person Households | 488 (7.1%) | 0 (0.0%) |
| 6-Person Households | 59 (0.9%) | 0 (0.0%) |
| 7+ Person Households | 77 (1.1%) | 0 (0.0%) |
| Total | 5,132 (74.5%) | 1,758 (25.5%) |
Female Fertility in Appling County
Fertility by Age in Appling County
Average fertility rate in Appling County is 50.0 births per 1,000 women. Women in the age bracket of 20 to 34 years have the highest fertility rate with 91.0 births per 1,000 women. Women in the age bracket of 20 to 34 years acount for 71.3% of all women with births.
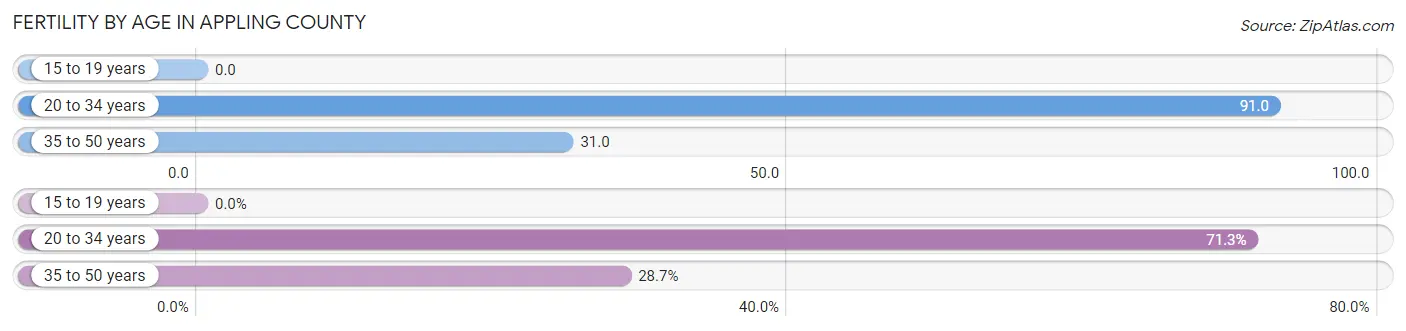
| Age Bracket | Women with Births | Births / 1,000 Women |
| 15 to 19 years | 0 (0.0%) | 0.0 |
| 20 to 34 years | 134 (71.3%) | 91.0 |
| 35 to 50 years | 54 (28.7%) | 31.0 |
| Total | 188 (100.0%) | 50.0 |
Fertility by Age by Marriage Status in Appling County
84.0% of women with births (188) in Appling County are married. The highest percentage of unmarried women with births falls into 20 to 34 years age bracket with 22.4% of them unmarried at the time of birth, while the lowest percentage of unmarried women with births belong to 35 to 50 years age bracket with 0.0% of them unmarried.
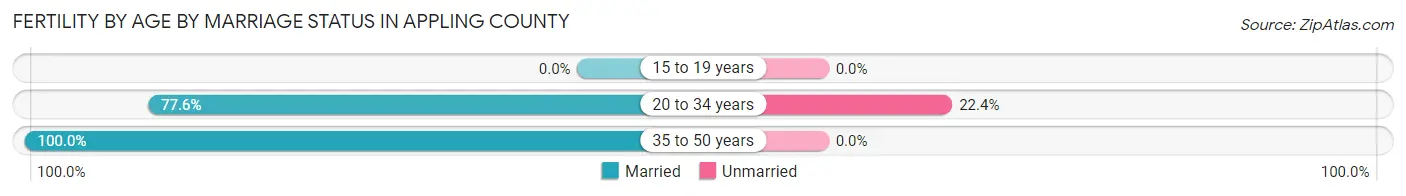
| Age Bracket | Married | Unmarried |
| 15 to 19 years | 0 (0.0%) | 0 (0.0%) |
| 20 to 34 years | 104 (77.6%) | 30 (22.4%) |
| 35 to 50 years | 54 (100.0%) | 0 (0.0%) |
| Total | 158 (84.0%) | 30 (16.0%) |
Fertility by Education in Appling County
Average fertility rate in Appling County is 50.0 births per 1,000 women. Women with the education attainment of bachelor's degree have the highest fertility rate of 240.0 births per 1,000 women, while women with the education attainment of less than high school have the lowest fertility at 22.0 births per 1,000 women. Women with the education attainment of college or associate's degree represent 30.8% of all women with births.
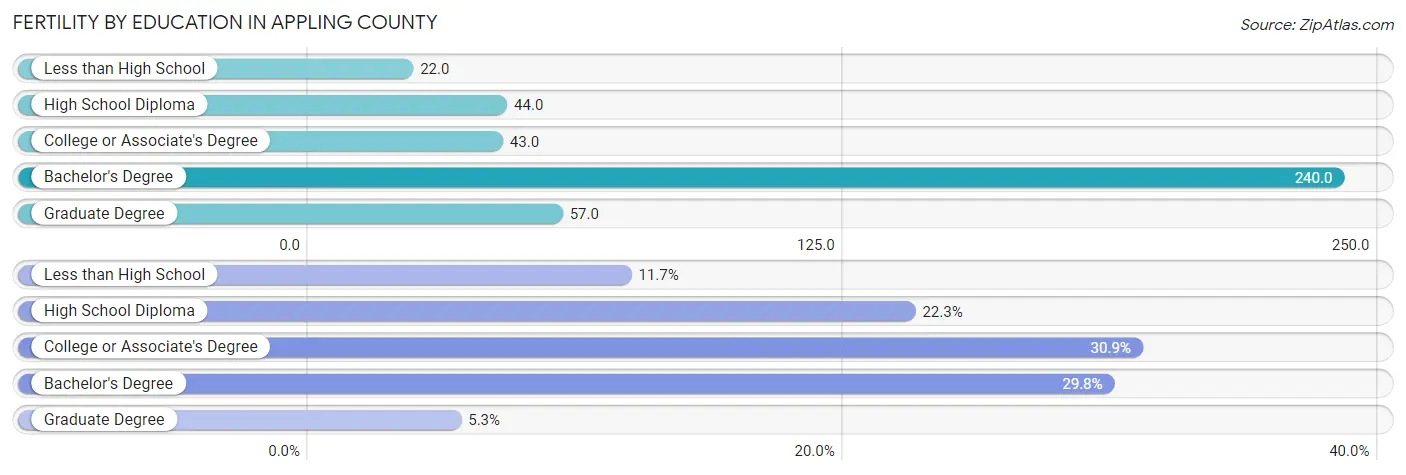
| Educational Attainment | Women with Births | Births / 1,000 Women |
| Less than High School | 22 (11.7%) | 22.0 |
| High School Diploma | 42 (22.3%) | 44.0 |
| College or Associate's Degree | 58 (30.8%) | 43.0 |
| Bachelor's Degree | 56 (29.8%) | 240.0 |
| Graduate Degree | 10 (5.3%) | 57.0 |
| Total | 188 (100.0%) | 50.0 |
Fertility by Education by Marriage Status in Appling County
16.0% of women with births in Appling County are unmarried. Women with the educational attainment of less than high school are most likely to be married with 100.0% of them married at childbirth, while women with the educational attainment of high school diploma are least likely to be married with 71.4% of them unmarried at childbirth.
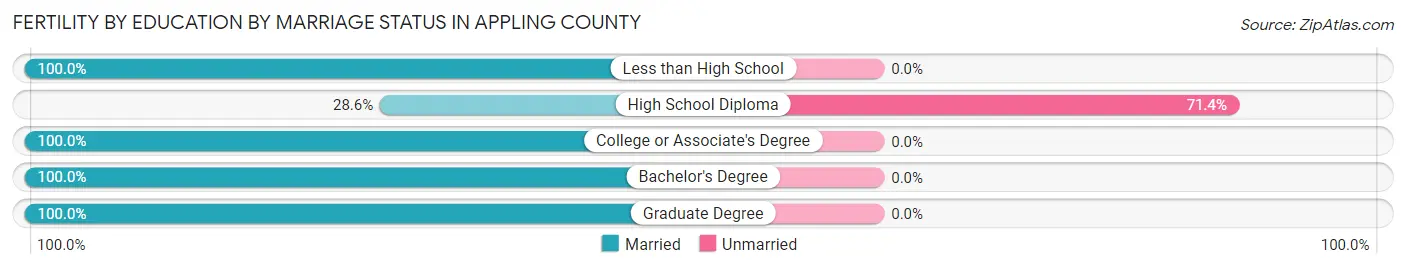
| Educational Attainment | Married | Unmarried |
| Less than High School | 22 (100.0%) | 0 (0.0%) |
| High School Diploma | 12 (28.6%) | 30 (71.4%) |
| College or Associate's Degree | 58 (100.0%) | 0 (0.0%) |
| Bachelor's Degree | 56 (100.0%) | 0 (0.0%) |
| Graduate Degree | 10 (100.0%) | 0 (0.0%) |
| Total | 158 (84.0%) | 30 (16.0%) |
Employment Characteristics in Appling County
Employment by Class of Employer in Appling County
Among the 7,195 employed individuals in Appling County, private company employees (4,966 | 69.0%), local government employees (641 | 8.9%), and state government employees (487 | 6.8%) make up the most common classes of employment.
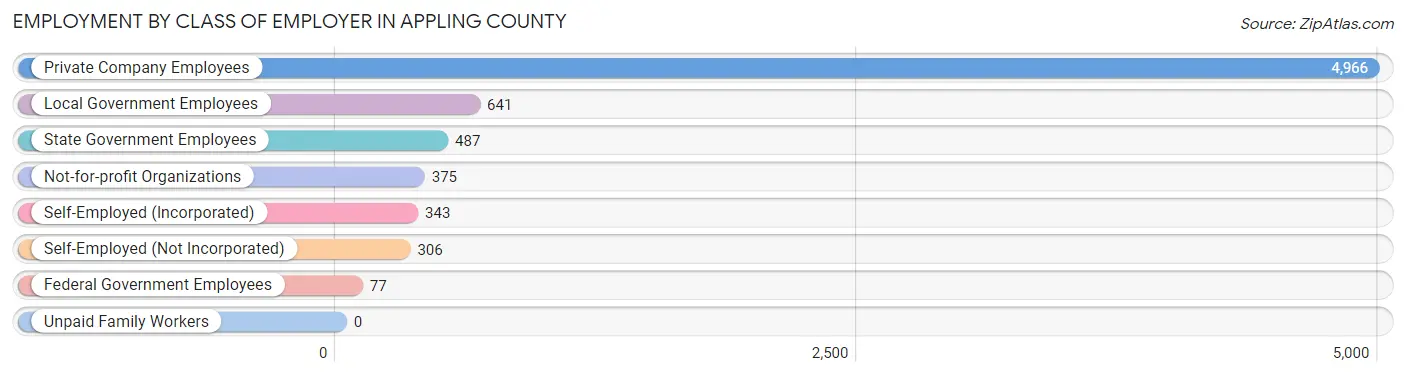
| Employer Class | # Employees | % Employees |
| Private Company Employees | 4,966 | 69.0% |
| Self-Employed (Incorporated) | 343 | 4.8% |
| Self-Employed (Not Incorporated) | 306 | 4.3% |
| Not-for-profit Organizations | 375 | 5.2% |
| Local Government Employees | 641 | 8.9% |
| State Government Employees | 487 | 6.8% |
| Federal Government Employees | 77 | 1.1% |
| Unpaid Family Workers | 0 | 0.0% |
| Total | 7,195 | 100.0% |
Employment Status by Age in Appling County
According to the labor force statistics for Appling County, out of the total population over 16 years of age (14,411), 53.2% or 7,667 individuals are in the labor force, with 3.3% or 253 of them unemployed. The age group with the highest labor force participation rate is 25 to 29 years, with 80.8% or 882 individuals in the labor force. Within the labor force, the 16 to 19 years age range has the highest percentage of unemployed individuals, with 17.7% or 39 of them being unemployed.
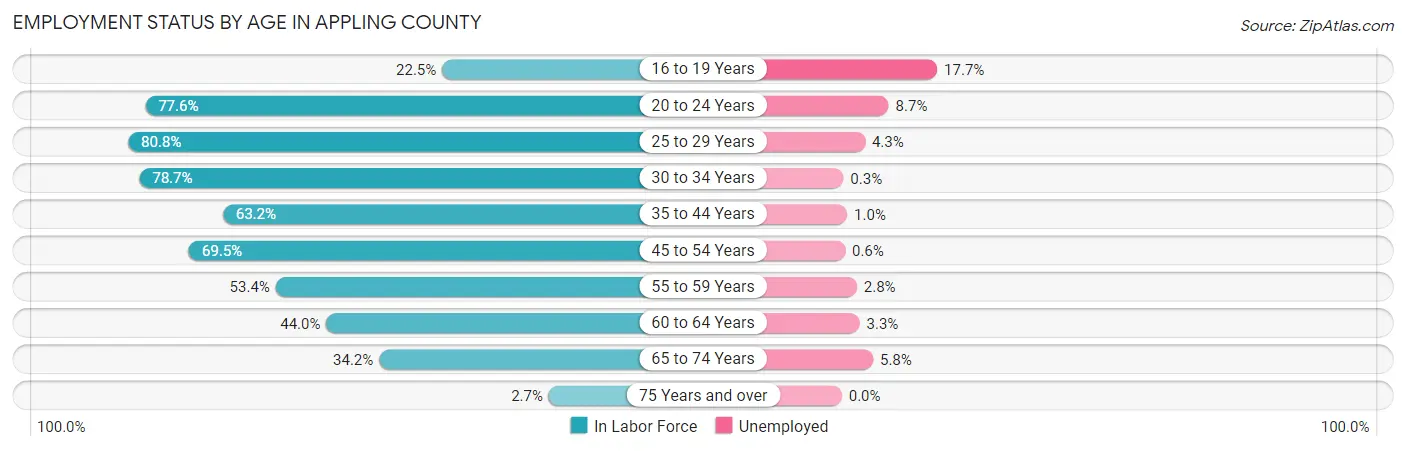
| Age Bracket | In Labor Force | Unemployed |
| 16 to 19 Years | 220 (22.5%) | 39 (17.7%) |
| 20 to 24 Years | 892 (77.6%) | 78 (8.7%) |
| 25 to 29 Years | 882 (80.8%) | 38 (4.3%) |
| 30 to 34 Years | 758 (78.7%) | 2 (0.3%) |
| 35 to 44 Years | 1,453 (63.2%) | 15 (1.0%) |
| 45 to 54 Years | 1,552 (69.5%) | 9 (0.6%) |
| 55 to 59 Years | 651 (53.4%) | 18 (2.8%) |
| 60 to 64 Years | 548 (44.0%) | 18 (3.3%) |
| 65 to 74 Years | 668 (34.2%) | 39 (5.8%) |
| 75 Years and over | 35 (2.7%) | 0 (0.0%) |
| Total | 7,667 (53.2%) | 253 (3.3%) |
Employment Status by Educational Attainment in Appling County
According to labor force statistics for Appling County, 64.6% of individuals (5,847) out of the total population between 25 and 64 years of age (9,051) are in the labor force, with 1.7% or 99 of them being unemployed. The group with the highest labor force participation rate are those with the educational attainment of bachelor's degree or higher, with 74.7% or 713 individuals in the labor force. Within the labor force, individuals with bachelor's degree or higher education have the highest percentage of unemployment, with 6.3% or 45 of them being unemployed.
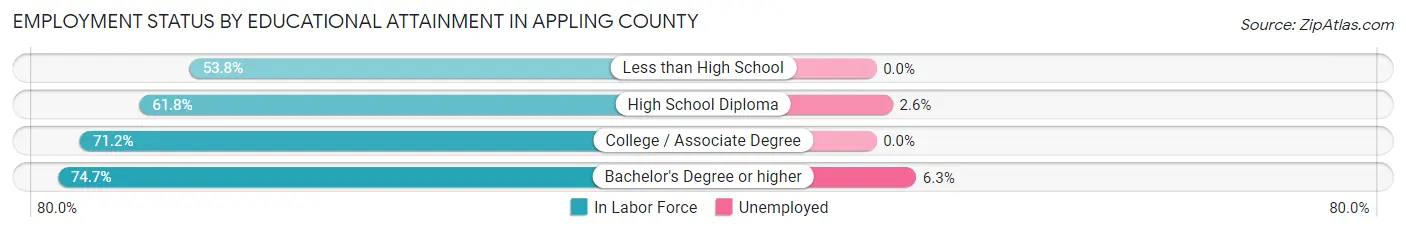
| Educational Attainment | In Labor Force | Unemployed |
| Less than High School | 954 (53.8%) | 0 (0.0%) |
| High School Diploma | 2,136 (61.8%) | 90 (2.6%) |
| College / Associate Degree | 2,040 (71.2%) | 0 (0.0%) |
| Bachelor's Degree or higher | 713 (74.7%) | 60 (6.3%) |
| Total | 5,847 (64.6%) | 154 (1.7%) |
Employment Occupations by Sex in Appling County
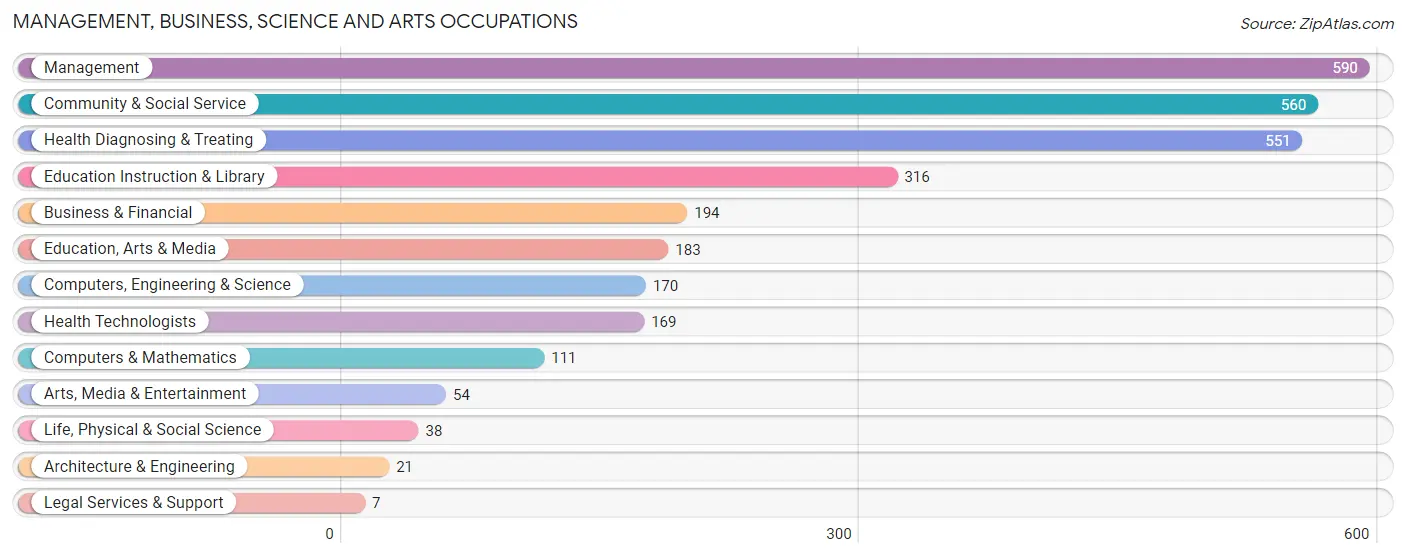
Management, Business, Science and Arts Occupations
The most common Management, Business, Science and Arts occupations in Appling County are Management (590 | 8.0%), Community & Social Service (560 | 7.6%), Health Diagnosing & Treating (551 | 7.4%), Education Instruction & Library (316 | 4.3%), and Business & Financial (194 | 2.6%).
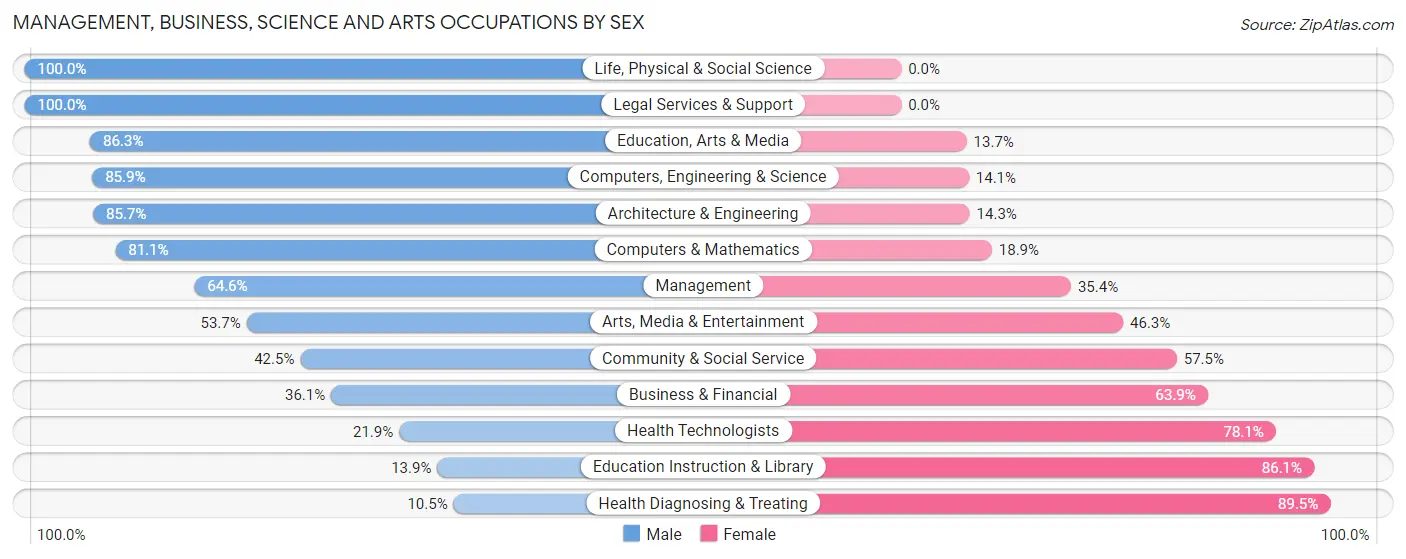
Management, Business, Science and Arts Occupations by Sex
Within the Management, Business, Science and Arts occupations in Appling County, the most male-oriented occupations are Life, Physical & Social Science (100.0%), Legal Services & Support (100.0%), and Education, Arts & Media (86.3%), while the most female-oriented occupations are Health Diagnosing & Treating (89.5%), Education Instruction & Library (86.1%), and Health Technologists (78.1%).
| Occupation | Male | Female |
| Management | 381 (64.6%) | 209 (35.4%) |
| Business & Financial | 70 (36.1%) | 124 (63.9%) |
| Computers, Engineering & Science | 146 (85.9%) | 24 (14.1%) |
| Computers & Mathematics | 90 (81.1%) | 21 (18.9%) |
| Architecture & Engineering | 18 (85.7%) | 3 (14.3%) |
| Life, Physical & Social Science | 38 (100.0%) | 0 (0.0%) |
| Community & Social Service | 238 (42.5%) | 322 (57.5%) |
| Education, Arts & Media | 158 (86.3%) | 25 (13.7%) |
| Legal Services & Support | 7 (100.0%) | 0 (0.0%) |
| Education Instruction & Library | 44 (13.9%) | 272 (86.1%) |
| Arts, Media & Entertainment | 29 (53.7%) | 25 (46.3%) |
| Health Diagnosing & Treating | 58 (10.5%) | 493 (89.5%) |
| Health Technologists | 37 (21.9%) | 132 (78.1%) |
| Total (Category) | 893 (43.2%) | 1,172 (56.8%) |
| Total (Overall) | 4,091 (55.3%) | 3,303 (44.7%) |
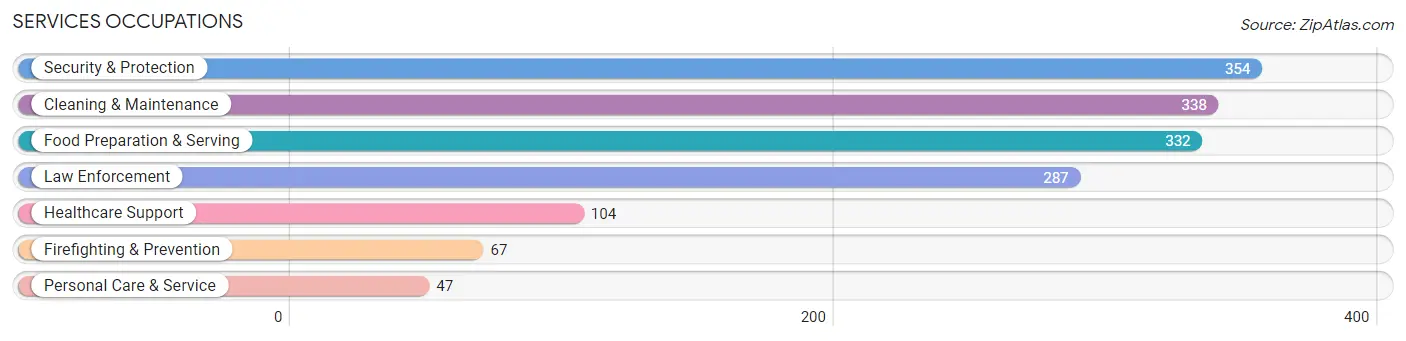
Services Occupations
The most common Services occupations in Appling County are Security & Protection (354 | 4.8%), Cleaning & Maintenance (338 | 4.6%), Food Preparation & Serving (332 | 4.5%), Law Enforcement (287 | 3.9%), and Healthcare Support (104 | 1.4%).
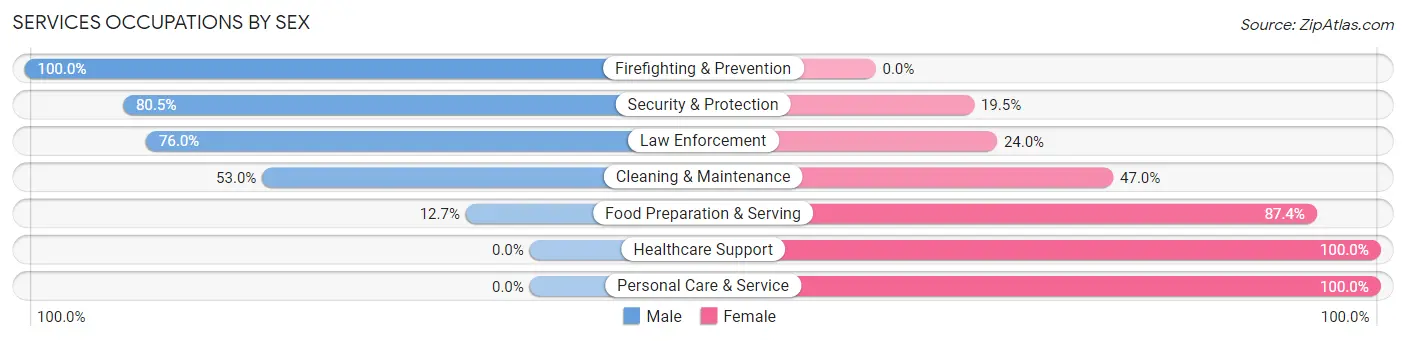
Services Occupations by Sex
Within the Services occupations in Appling County, the most male-oriented occupations are Firefighting & Prevention (100.0%), Security & Protection (80.5%), and Law Enforcement (76.0%), while the most female-oriented occupations are Healthcare Support (100.0%), Personal Care & Service (100.0%), and Food Preparation & Serving (87.4%).
| Occupation | Male | Female |
| Healthcare Support | 0 (0.0%) | 104 (100.0%) |
| Security & Protection | 285 (80.5%) | 69 (19.5%) |
| Firefighting & Prevention | 67 (100.0%) | 0 (0.0%) |
| Law Enforcement | 218 (76.0%) | 69 (24.0%) |
| Food Preparation & Serving | 42 (12.7%) | 290 (87.4%) |
| Cleaning & Maintenance | 179 (53.0%) | 159 (47.0%) |
| Personal Care & Service | 0 (0.0%) | 47 (100.0%) |
| Total (Category) | 506 (43.1%) | 669 (56.9%) |
| Total (Overall) | 4,091 (55.3%) | 3,303 (44.7%) |
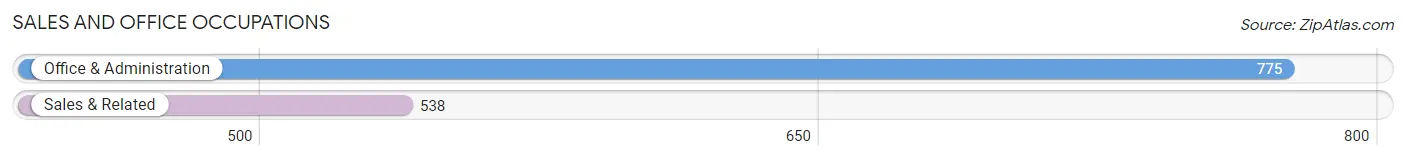
Sales and Office Occupations
The most common Sales and Office occupations in Appling County are Office & Administration (775 | 10.5%), and Sales & Related (538 | 7.3%).
Sales and Office Occupations by Sex
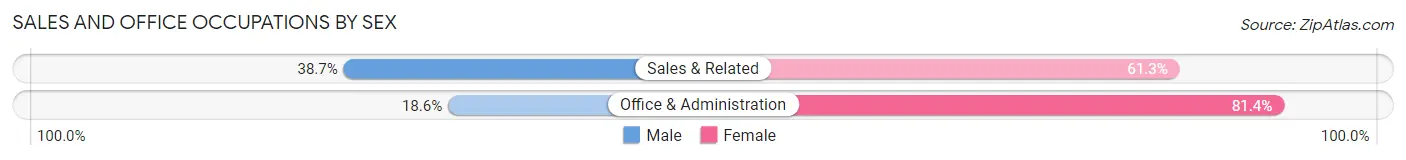
| Occupation | Male | Female |
| Sales & Related | 208 (38.7%) | 330 (61.3%) |
| Office & Administration | 144 (18.6%) | 631 (81.4%) |
| Total (Category) | 352 (26.8%) | 961 (73.2%) |
| Total (Overall) | 4,091 (55.3%) | 3,303 (44.7%) |
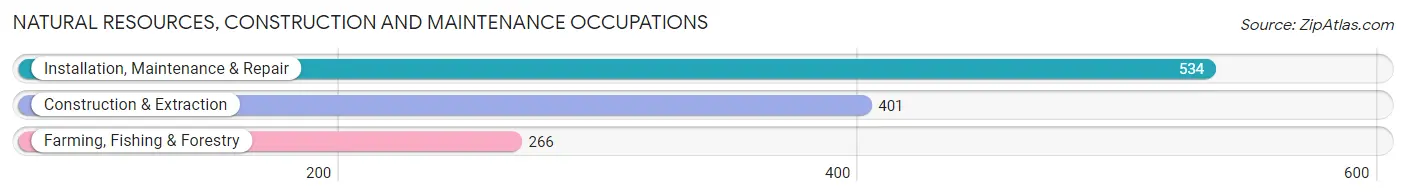
Natural Resources, Construction and Maintenance Occupations
The most common Natural Resources, Construction and Maintenance occupations in Appling County are Installation, Maintenance & Repair (534 | 7.2%), Construction & Extraction (401 | 5.4%), and Farming, Fishing & Forestry (266 | 3.6%).
Natural Resources, Construction and Maintenance Occupations by Sex
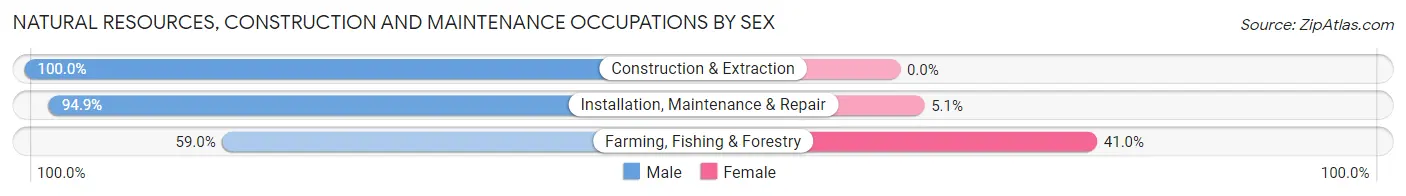
| Occupation | Male | Female |
| Farming, Fishing & Forestry | 157 (59.0%) | 109 (41.0%) |
| Construction & Extraction | 401 (100.0%) | 0 (0.0%) |
| Installation, Maintenance & Repair | 507 (94.9%) | 27 (5.1%) |
| Total (Category) | 1,065 (88.7%) | 136 (11.3%) |
| Total (Overall) | 4,091 (55.3%) | 3,303 (44.7%) |
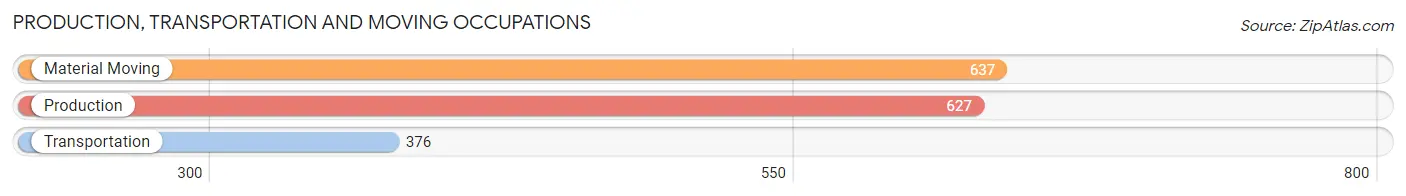
Production, Transportation and Moving Occupations
The most common Production, Transportation and Moving occupations in Appling County are Material Moving (637 | 8.6%), Production (627 | 8.5%), and Transportation (376 | 5.1%).
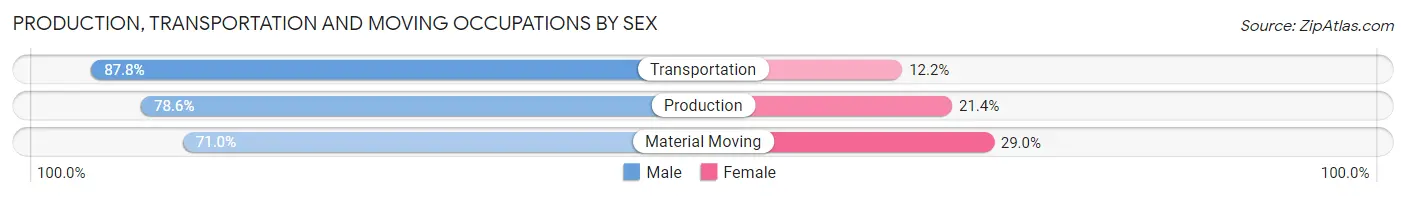
Production, Transportation and Moving Occupations by Sex
| Occupation | Male | Female |
| Production | 493 (78.6%) | 134 (21.4%) |
| Transportation | 330 (87.8%) | 46 (12.2%) |
| Material Moving | 452 (71.0%) | 185 (29.0%) |
| Total (Category) | 1,275 (77.7%) | 365 (22.3%) |
| Total (Overall) | 4,091 (55.3%) | 3,303 (44.7%) |
Employment Industries by Sex in Appling County
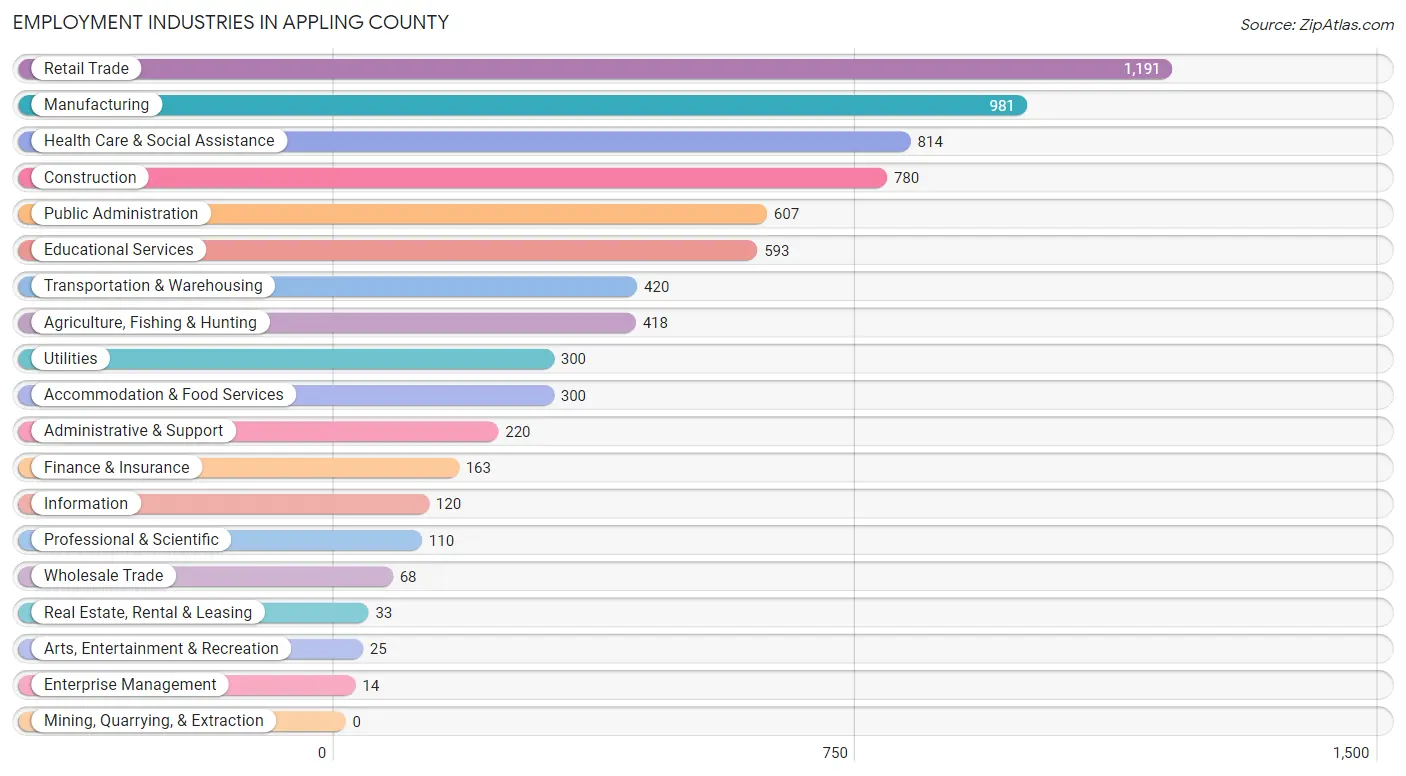
Employment Industries in Appling County
The major employment industries in Appling County include Retail Trade (1,191 | 16.1%), Manufacturing (981 | 13.3%), Health Care & Social Assistance (814 | 11.0%), Construction (780 | 10.5%), and Public Administration (607 | 8.2%).
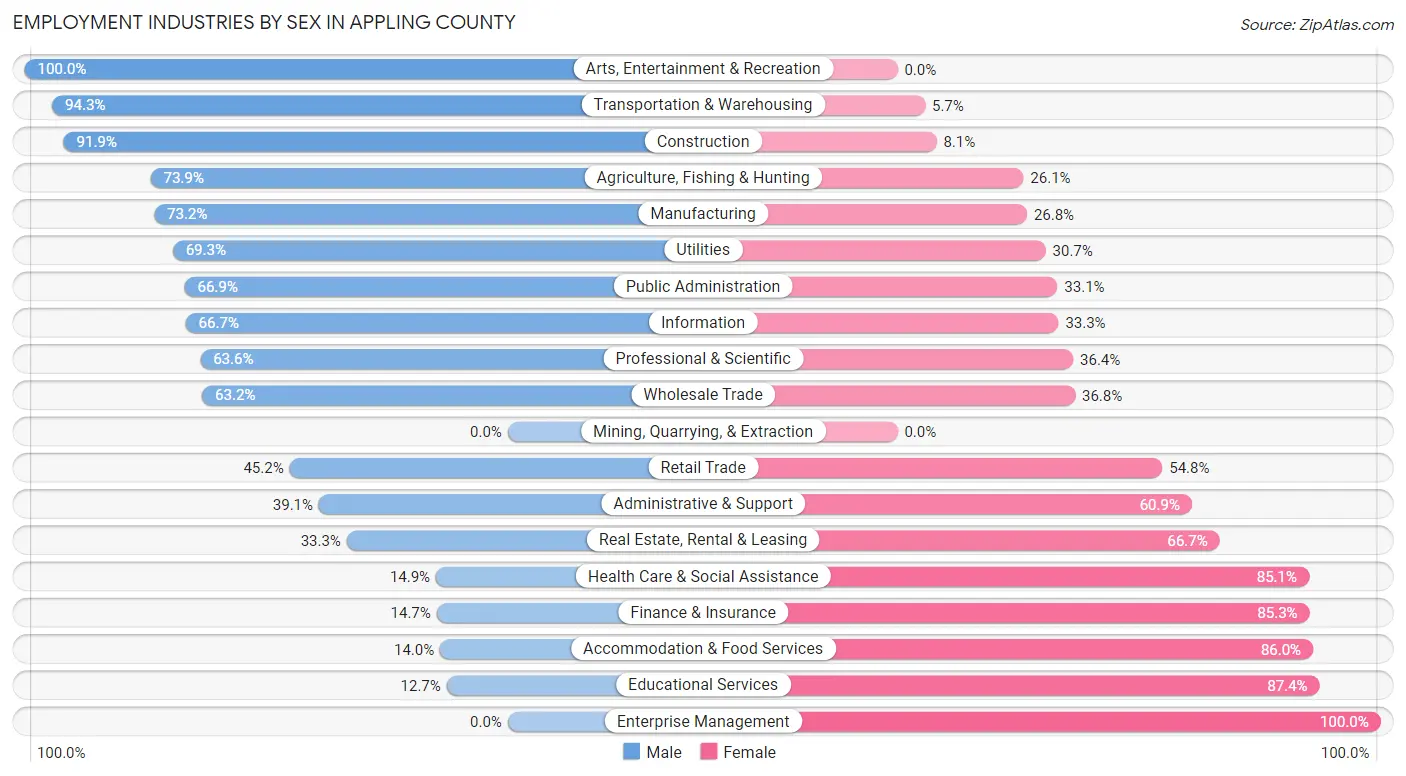
Employment Industries by Sex in Appling County
The Appling County industries that see more men than women are Arts, Entertainment & Recreation (100.0%), Transportation & Warehousing (94.3%), and Construction (91.9%), whereas the industries that tend to have a higher number of women are Enterprise Management (100.0%), Educational Services (87.4%), and Accommodation & Food Services (86.0%).
| Industry | Male | Female |
| Agriculture, Fishing & Hunting | 309 (73.9%) | 109 (26.1%) |
| Mining, Quarrying, & Extraction | 0 (0.0%) | 0 (0.0%) |
| Construction | 717 (91.9%) | 63 (8.1%) |
| Manufacturing | 718 (73.2%) | 263 (26.8%) |
| Wholesale Trade | 43 (63.2%) | 25 (36.8%) |
| Retail Trade | 538 (45.2%) | 653 (54.8%) |
| Transportation & Warehousing | 396 (94.3%) | 24 (5.7%) |
| Utilities | 208 (69.3%) | 92 (30.7%) |
| Information | 80 (66.7%) | 40 (33.3%) |
| Finance & Insurance | 24 (14.7%) | 139 (85.3%) |
| Real Estate, Rental & Leasing | 11 (33.3%) | 22 (66.7%) |
| Professional & Scientific | 70 (63.6%) | 40 (36.4%) |
| Enterprise Management | 0 (0.0%) | 14 (100.0%) |
| Administrative & Support | 86 (39.1%) | 134 (60.9%) |
| Educational Services | 75 (12.7%) | 518 (87.4%) |
| Health Care & Social Assistance | 121 (14.9%) | 693 (85.1%) |
| Arts, Entertainment & Recreation | 25 (100.0%) | 0 (0.0%) |
| Accommodation & Food Services | 42 (14.0%) | 258 (86.0%) |
| Public Administration | 406 (66.9%) | 201 (33.1%) |
| Total | 4,091 (55.3%) | 3,303 (44.7%) |
Education in Appling County
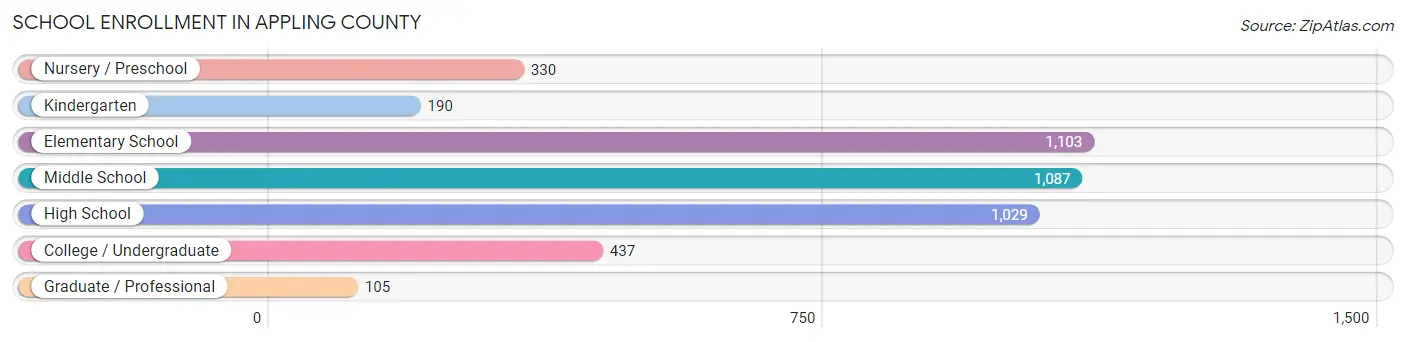
School Enrollment in Appling County
The most common levels of schooling among the 4,281 students in Appling County are elementary school (1,103 | 25.8%), middle school (1,087 | 25.4%), and high school (1,029 | 24.0%).
| School Level | # Students | % Students |
| Nursery / Preschool | 330 | 7.7% |
| Kindergarten | 190 | 4.4% |
| Elementary School | 1,103 | 25.8% |
| Middle School | 1,087 | 25.4% |
| High School | 1,029 | 24.0% |
| College / Undergraduate | 437 | 10.2% |
| Graduate / Professional | 105 | 2.5% |
| Total | 4,281 | 100.0% |
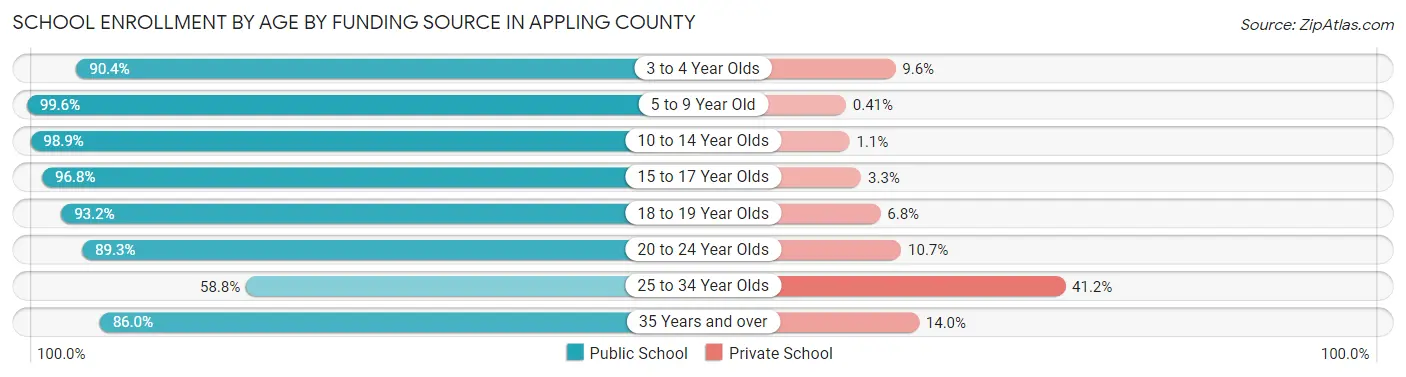
School Enrollment by Age by Funding Source in Appling County
Out of a total of 4,281 students who are enrolled in schools in Appling County, 205 (4.8%) attend a private institution, while the remaining 4,076 (95.2%) are enrolled in public schools. The age group of 25 to 34 year olds has the highest likelihood of being enrolled in private schools, with 80 (41.2% in the age bracket) enrolled. Conversely, the age group of 5 to 9 year old has the lowest likelihood of being enrolled in a private school, with 1,217 (99.6% in the age bracket) attending a public institution.
| Age Bracket | Public School | Private School |
| 3 to 4 Year Olds | 197 (90.4%) | 21 (9.6%) |
| 5 to 9 Year Old | 1,217 (99.6%) | 5 (0.4%) |
| 10 to 14 Year Olds | 1,267 (98.9%) | 14 (1.1%) |
| 15 to 17 Year Olds | 685 (96.8%) | 23 (3.3%) |
| 18 to 19 Year Olds | 273 (93.2%) | 20 (6.8%) |
| 20 to 24 Year Olds | 192 (89.3%) | 23 (10.7%) |
| 25 to 34 Year Olds | 114 (58.8%) | 80 (41.2%) |
| 35 Years and over | 129 (86.0%) | 21 (14.0%) |
| Total | 4,076 (95.2%) | 205 (4.8%) |
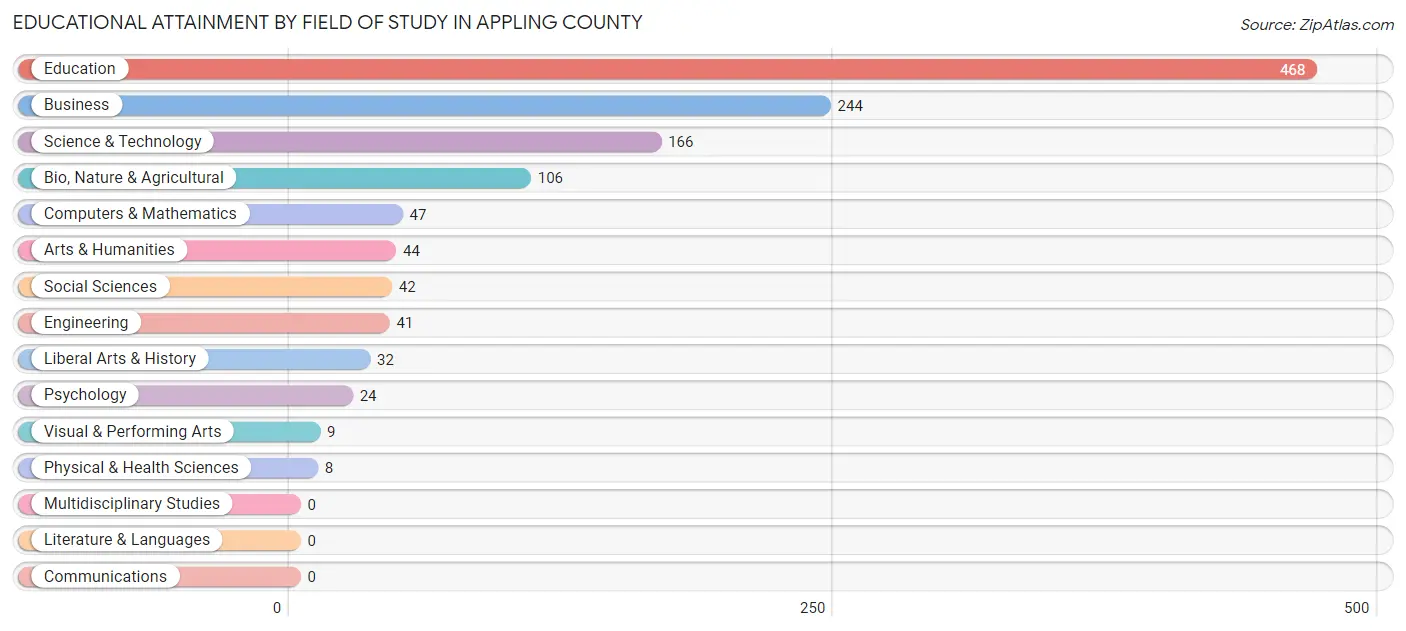
Educational Attainment by Field of Study in Appling County
Education (468 | 38.0%), business (244 | 19.8%), science & technology (166 | 13.5%), bio, nature & agricultural (106 | 8.6%), and computers & mathematics (47 | 3.8%) are the most common fields of study among 1,231 individuals in Appling County who have obtained a bachelor's degree or higher.
| Field of Study | # Graduates | % Graduates |
| Computers & Mathematics | 47 | 3.8% |
| Bio, Nature & Agricultural | 106 | 8.6% |
| Physical & Health Sciences | 8 | 0.6% |
| Psychology | 24 | 1.9% |
| Social Sciences | 42 | 3.4% |
| Engineering | 41 | 3.3% |
| Multidisciplinary Studies | 0 | 0.0% |
| Science & Technology | 166 | 13.5% |
| Business | 244 | 19.8% |
| Education | 468 | 38.0% |
| Literature & Languages | 0 | 0.0% |
| Liberal Arts & History | 32 | 2.6% |
| Visual & Performing Arts | 9 | 0.7% |
| Communications | 0 | 0.0% |
| Arts & Humanities | 44 | 3.6% |
| Total | 1,231 | 100.0% |
Transportation & Commute in Appling County
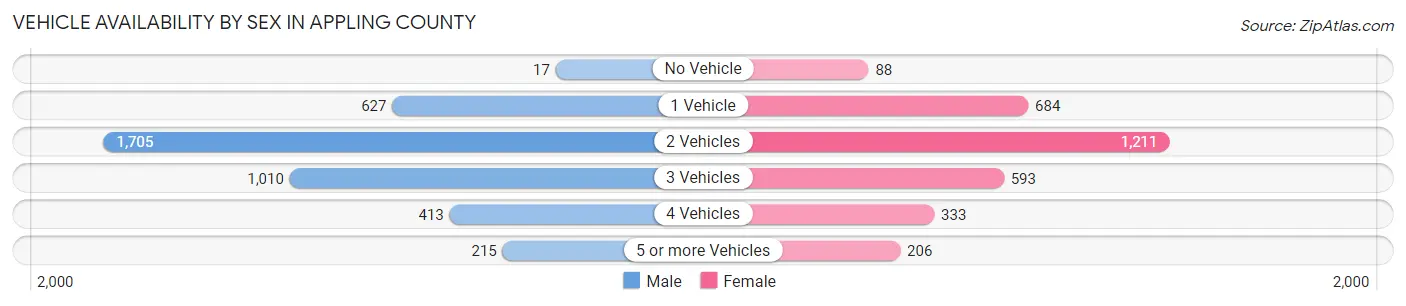
Vehicle Availability by Sex in Appling County
The most prevalent vehicle ownership categories in Appling County are males with 2 vehicles (1,705, accounting for 42.8%) and females with 2 vehicles (1,211, making up 54.7%).
| Vehicles Available | Male | Female |
| No Vehicle | 17 (0.4%) | 88 (2.8%) |
| 1 Vehicle | 627 (15.7%) | 684 (22.0%) |
| 2 Vehicles | 1,705 (42.8%) | 1,211 (38.9%) |
| 3 Vehicles | 1,010 (25.3%) | 593 (19.0%) |
| 4 Vehicles | 413 (10.4%) | 333 (10.7%) |
| 5 or more Vehicles | 215 (5.4%) | 206 (6.6%) |
| Total | 3,987 (100.0%) | 3,115 (100.0%) |
Commute Time in Appling County
The most frequently occuring commute durations in Appling County are 10 to 14 minutes (1,800 commuters, 25.5%), 15 to 19 minutes (1,272 commuters, 18.0%), and 20 to 24 minutes (922 commuters, 13.1%).
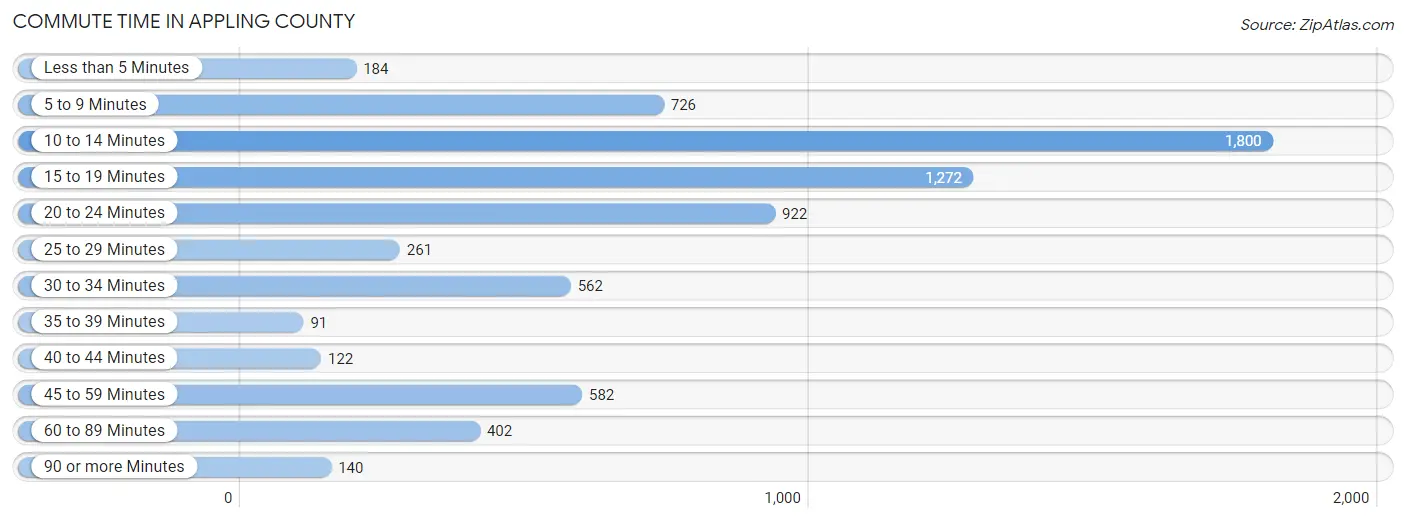
| Commute Time | # Commuters | % Commuters |
| Less than 5 Minutes | 184 | 2.6% |
| 5 to 9 Minutes | 726 | 10.3% |
| 10 to 14 Minutes | 1,800 | 25.5% |
| 15 to 19 Minutes | 1,272 | 18.0% |
| 20 to 24 Minutes | 922 | 13.1% |
| 25 to 29 Minutes | 261 | 3.7% |
| 30 to 34 Minutes | 562 | 8.0% |
| 35 to 39 Minutes | 91 | 1.3% |
| 40 to 44 Minutes | 122 | 1.7% |
| 45 to 59 Minutes | 582 | 8.2% |
| 60 to 89 Minutes | 402 | 5.7% |
| 90 or more Minutes | 140 | 2.0% |
Commute Time by Sex in Appling County
The most common commute times in Appling County are 10 to 14 minutes (1,094 commuters, 27.2%) for males and 10 to 14 minutes (706 commuters, 23.2%) for females.
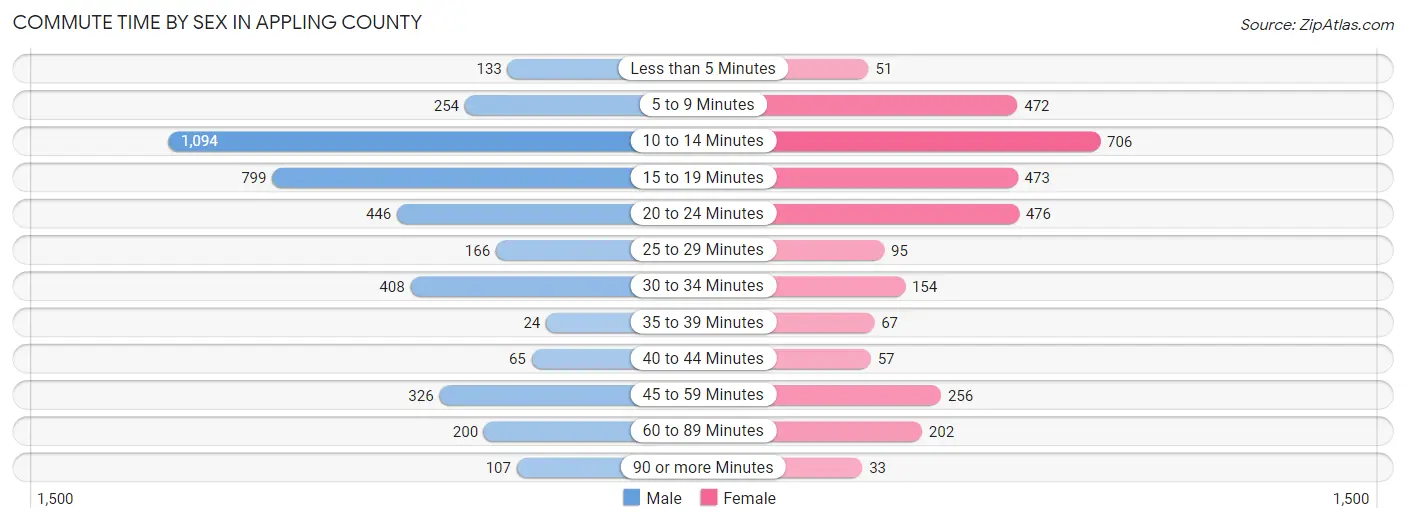
| Commute Time | Male | Female |
| Less than 5 Minutes | 133 (3.3%) | 51 (1.7%) |
| 5 to 9 Minutes | 254 (6.3%) | 472 (15.5%) |
| 10 to 14 Minutes | 1,094 (27.2%) | 706 (23.2%) |
| 15 to 19 Minutes | 799 (19.9%) | 473 (15.5%) |
| 20 to 24 Minutes | 446 (11.1%) | 476 (15.7%) |
| 25 to 29 Minutes | 166 (4.1%) | 95 (3.1%) |
| 30 to 34 Minutes | 408 (10.1%) | 154 (5.1%) |
| 35 to 39 Minutes | 24 (0.6%) | 67 (2.2%) |
| 40 to 44 Minutes | 65 (1.6%) | 57 (1.9%) |
| 45 to 59 Minutes | 326 (8.1%) | 256 (8.4%) |
| 60 to 89 Minutes | 200 (5.0%) | 202 (6.6%) |
| 90 or more Minutes | 107 (2.7%) | 33 (1.1%) |
Time of Departure to Work by Sex in Appling County
The most frequent times of departure to work in Appling County are 6:30 AM to 6:59 AM (683, 17.0%) for males and 6:00 AM to 6:29 AM (480, 15.8%) for females.
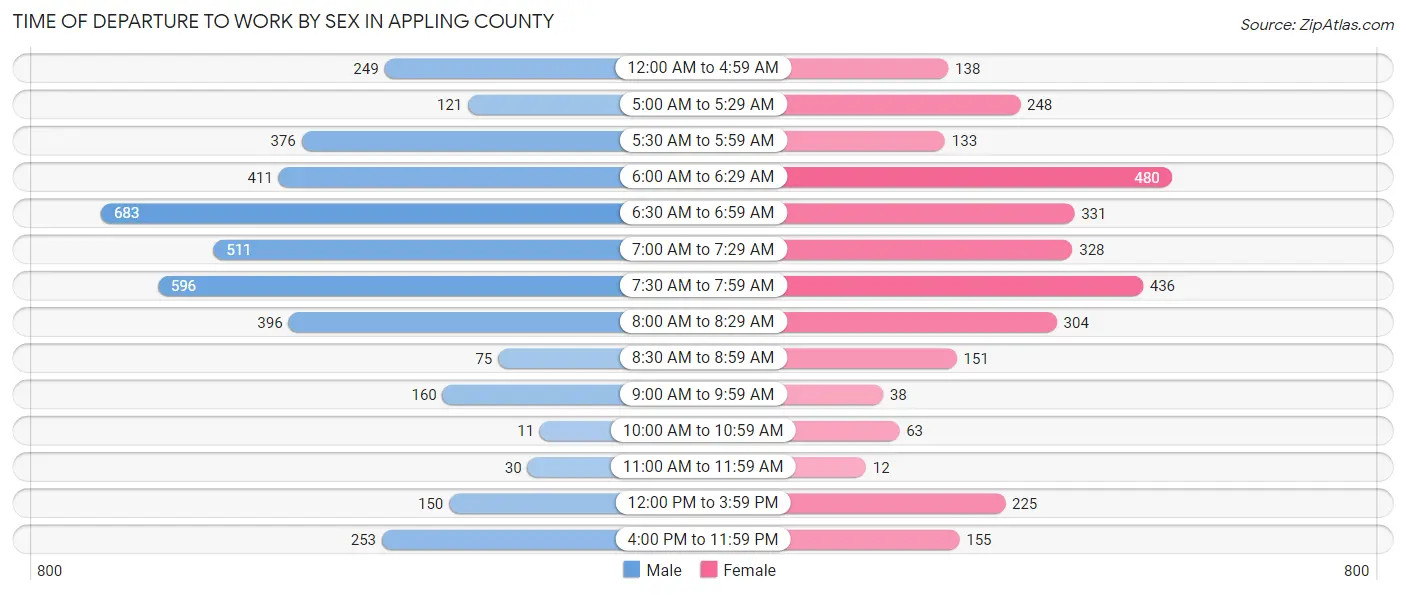
| Time of Departure | Male | Female |
| 12:00 AM to 4:59 AM | 249 (6.2%) | 138 (4.5%) |
| 5:00 AM to 5:29 AM | 121 (3.0%) | 248 (8.2%) |
| 5:30 AM to 5:59 AM | 376 (9.3%) | 133 (4.4%) |
| 6:00 AM to 6:29 AM | 411 (10.2%) | 480 (15.8%) |
| 6:30 AM to 6:59 AM | 683 (17.0%) | 331 (10.9%) |
| 7:00 AM to 7:29 AM | 511 (12.7%) | 328 (10.8%) |
| 7:30 AM to 7:59 AM | 596 (14.8%) | 436 (14.3%) |
| 8:00 AM to 8:29 AM | 396 (9.9%) | 304 (10.0%) |
| 8:30 AM to 8:59 AM | 75 (1.9%) | 151 (5.0%) |
| 9:00 AM to 9:59 AM | 160 (4.0%) | 38 (1.3%) |
| 10:00 AM to 10:59 AM | 11 (0.3%) | 63 (2.1%) |
| 11:00 AM to 11:59 AM | 30 (0.7%) | 12 (0.4%) |
| 12:00 PM to 3:59 PM | 150 (3.7%) | 225 (7.4%) |
| 4:00 PM to 11:59 PM | 253 (6.3%) | 155 (5.1%) |
| Total | 4,022 (100.0%) | 3,042 (100.0%) |
Housing Occupancy in Appling County
Occupancy by Ownership in Appling County
Of the total 6,890 dwellings in Appling County, owner-occupied units account for 4,990 (72.4%), while renter-occupied units make up 1,900 (27.6%).
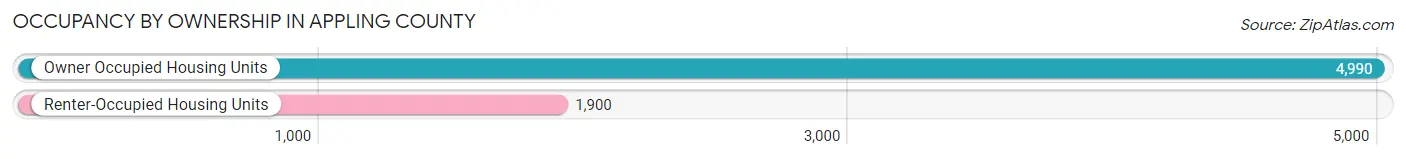
| Occupancy | # Housing Units | % Housing Units |
| Owner Occupied Housing Units | 4,990 | 72.4% |
| Renter-Occupied Housing Units | 1,900 | 27.6% |
| Total Occupied Housing Units | 6,890 | 100.0% |
Occupancy by Household Size in Appling County
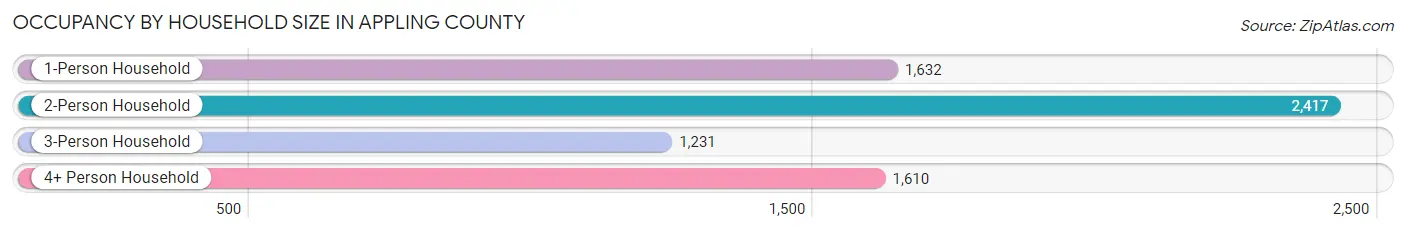
| Household Size | # Housing Units | % Housing Units |
| 1-Person Household | 1,632 | 23.7% |
| 2-Person Household | 2,417 | 35.1% |
| 3-Person Household | 1,231 | 17.9% |
| 4+ Person Household | 1,610 | 23.4% |
| Total Housing Units | 6,890 | 100.0% |
Occupancy by Ownership by Household Size in Appling County
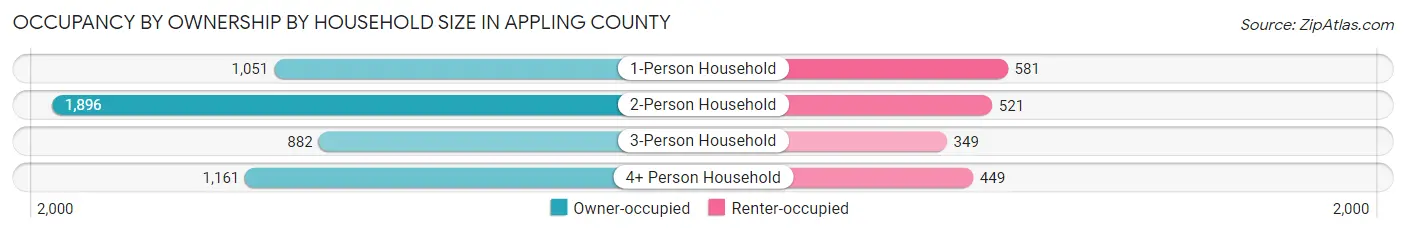
| Household Size | Owner-occupied | Renter-occupied |
| 1-Person Household | 1,051 (64.4%) | 581 (35.6%) |
| 2-Person Household | 1,896 (78.4%) | 521 (21.6%) |
| 3-Person Household | 882 (71.7%) | 349 (28.3%) |
| 4+ Person Household | 1,161 (72.1%) | 449 (27.9%) |
| Total Housing Units | 4,990 (72.4%) | 1,900 (27.6%) |
Occupancy by Educational Attainment in Appling County
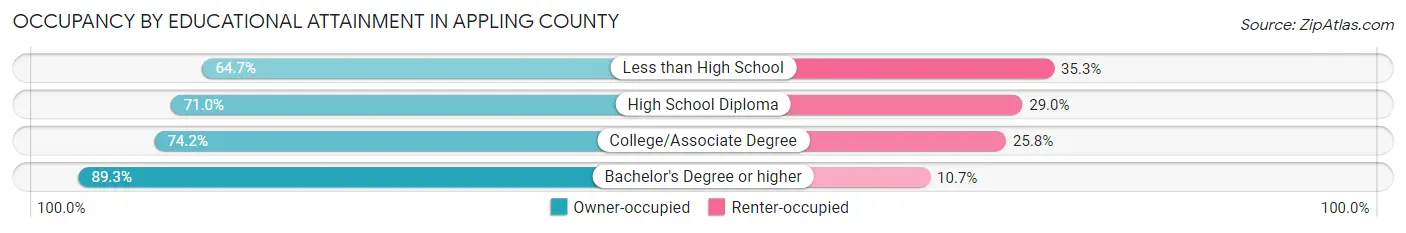
| Household Size | Owner-occupied | Renter-occupied |
| Less than High School | 904 (64.7%) | 493 (35.3%) |
| High School Diploma | 1,881 (71.0%) | 767 (29.0%) |
| College/Associate Degree | 1,654 (74.2%) | 574 (25.8%) |
| Bachelor's Degree or higher | 551 (89.3%) | 66 (10.7%) |
Occupancy by Age of Householder in Appling County
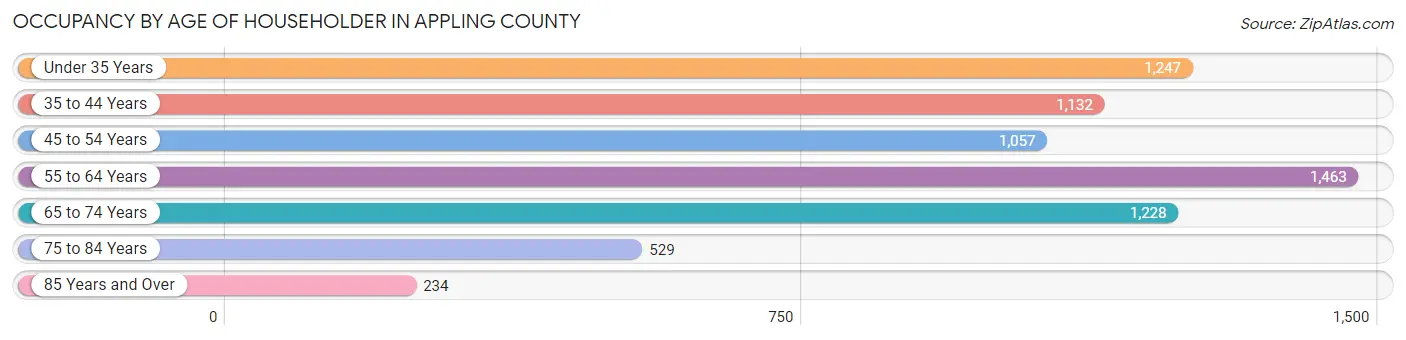
| Age Bracket | # Households | % Households |
| Under 35 Years | 1,247 | 18.1% |
| 35 to 44 Years | 1,132 | 16.4% |
| 45 to 54 Years | 1,057 | 15.3% |
| 55 to 64 Years | 1,463 | 21.2% |
| 65 to 74 Years | 1,228 | 17.8% |
| 75 to 84 Years | 529 | 7.7% |
| 85 Years and Over | 234 | 3.4% |
| Total | 6,890 | 100.0% |
Housing Finances in Appling County
Median Income by Occupancy in Appling County
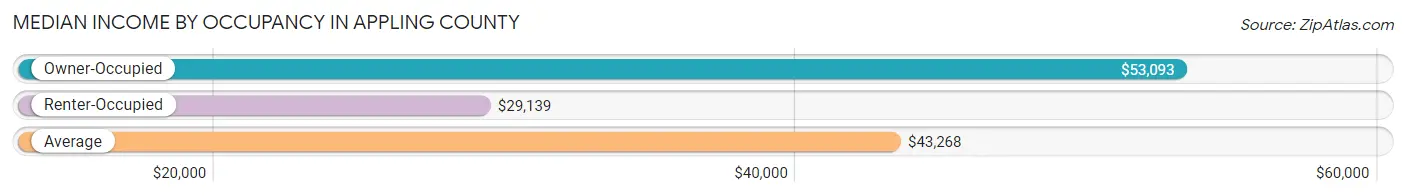
| Occupancy Type | # Households | Median Income |
| Owner-Occupied | 4,990 (72.4%) | $53,093 |
| Renter-Occupied | 1,900 (27.6%) | $29,139 |
| Average | 6,890 (100.0%) | $43,268 |
Occupancy by Householder Income Bracket in Appling County
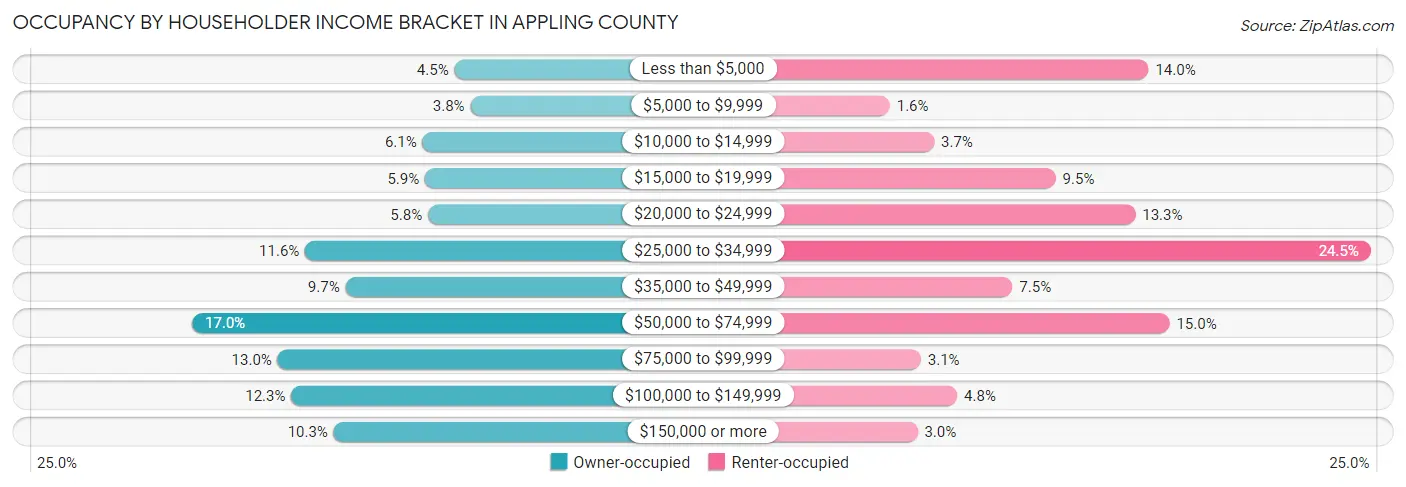
| Income Bracket | Owner-occupied | Renter-occupied |
| Less than $5,000 | 226 (4.5%) | 265 (14.0%) |
| $5,000 to $9,999 | 188 (3.8%) | 31 (1.6%) |
| $10,000 to $14,999 | 302 (6.0%) | 71 (3.7%) |
| $15,000 to $19,999 | 296 (5.9%) | 181 (9.5%) |
| $20,000 to $24,999 | 289 (5.8%) | 253 (13.3%) |
| $25,000 to $34,999 | 581 (11.6%) | 466 (24.5%) |
| $35,000 to $49,999 | 485 (9.7%) | 142 (7.5%) |
| $50,000 to $74,999 | 850 (17.0%) | 284 (14.9%) |
| $75,000 to $99,999 | 646 (13.0%) | 59 (3.1%) |
| $100,000 to $149,999 | 614 (12.3%) | 92 (4.8%) |
| $150,000 or more | 513 (10.3%) | 56 (2.9%) |
| Total | 4,990 (100.0%) | 1,900 (100.0%) |
Monthly Housing Cost Tiers in Appling County
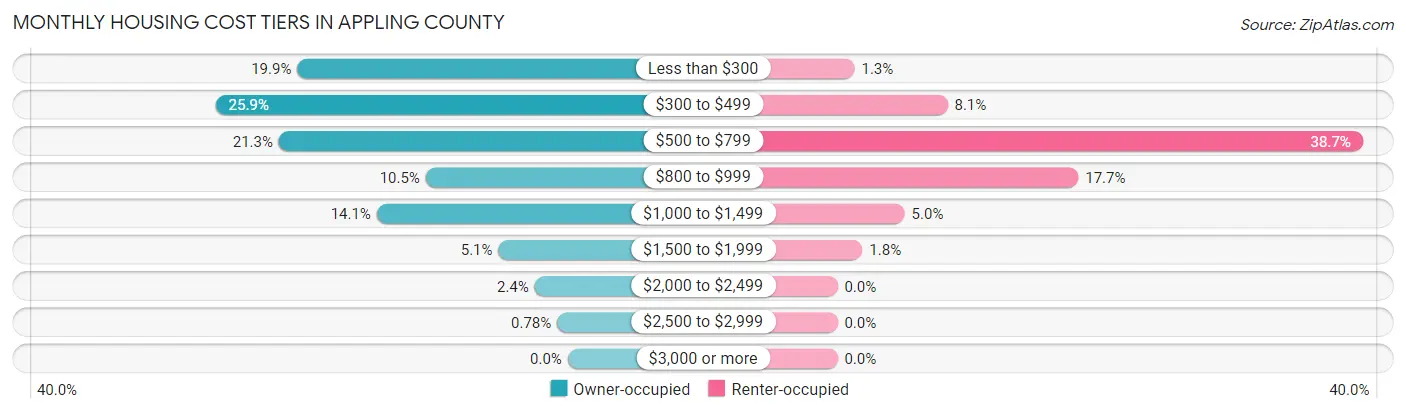
| Monthly Cost | Owner-occupied | Renter-occupied |
| Less than $300 | 994 (19.9%) | 24 (1.3%) |
| $300 to $499 | 1,294 (25.9%) | 154 (8.1%) |
| $500 to $799 | 1,062 (21.3%) | 735 (38.7%) |
| $800 to $999 | 522 (10.5%) | 337 (17.7%) |
| $1,000 to $1,499 | 702 (14.1%) | 94 (5.0%) |
| $1,500 to $1,999 | 255 (5.1%) | 35 (1.8%) |
| $2,000 to $2,499 | 122 (2.4%) | 0 (0.0%) |
| $2,500 to $2,999 | 39 (0.8%) | 0 (0.0%) |
| $3,000 or more | 0 (0.0%) | 0 (0.0%) |
| Total | 4,990 (100.0%) | 1,900 (100.0%) |
Physical Housing Characteristics in Appling County
Housing Structures in Appling County
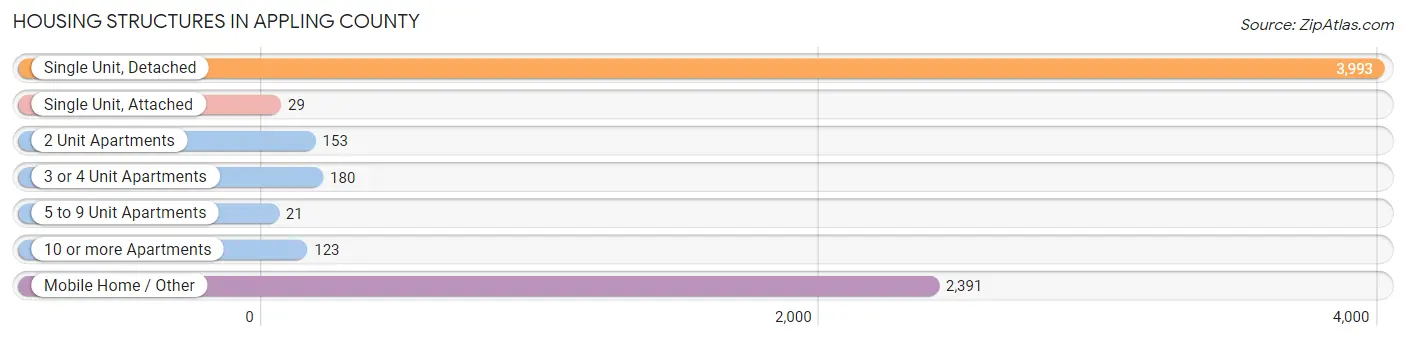
| Structure Type | # Housing Units | % Housing Units |
| Single Unit, Detached | 3,993 | 58.0% |
| Single Unit, Attached | 29 | 0.4% |
| 2 Unit Apartments | 153 | 2.2% |
| 3 or 4 Unit Apartments | 180 | 2.6% |
| 5 to 9 Unit Apartments | 21 | 0.3% |
| 10 or more Apartments | 123 | 1.8% |
| Mobile Home / Other | 2,391 | 34.7% |
| Total | 6,890 | 100.0% |
Housing Structures by Occupancy in Appling County
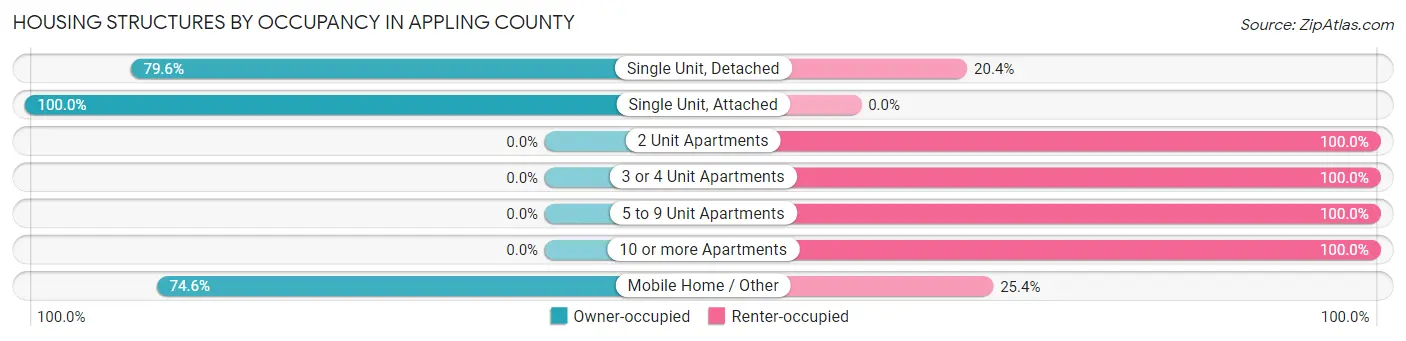
| Structure Type | Owner-occupied | Renter-occupied |
| Single Unit, Detached | 3,178 (79.6%) | 815 (20.4%) |
| Single Unit, Attached | 29 (100.0%) | 0 (0.0%) |
| 2 Unit Apartments | 0 (0.0%) | 153 (100.0%) |
| 3 or 4 Unit Apartments | 0 (0.0%) | 180 (100.0%) |
| 5 to 9 Unit Apartments | 0 (0.0%) | 21 (100.0%) |
| 10 or more Apartments | 0 (0.0%) | 123 (100.0%) |
| Mobile Home / Other | 1,783 (74.6%) | 608 (25.4%) |
| Total | 4,990 (72.4%) | 1,900 (27.6%) |
Housing Structures by Number of Rooms in Appling County
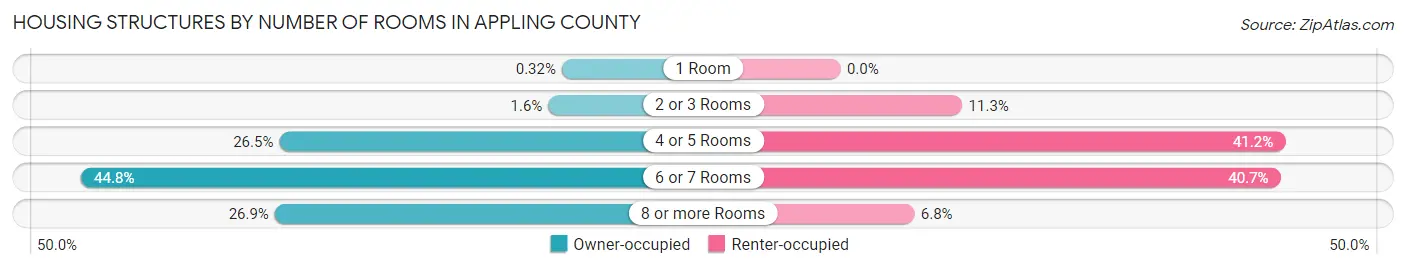
| Number of Rooms | Owner-occupied | Renter-occupied |
| 1 Room | 16 (0.3%) | 0 (0.0%) |
| 2 or 3 Rooms | 79 (1.6%) | 214 (11.3%) |
| 4 or 5 Rooms | 1,320 (26.5%) | 782 (41.2%) |
| 6 or 7 Rooms | 2,234 (44.8%) | 774 (40.7%) |
| 8 or more Rooms | 1,341 (26.9%) | 130 (6.8%) |
| Total | 4,990 (100.0%) | 1,900 (100.0%) |
Housing Structure by Heating Type in Appling County
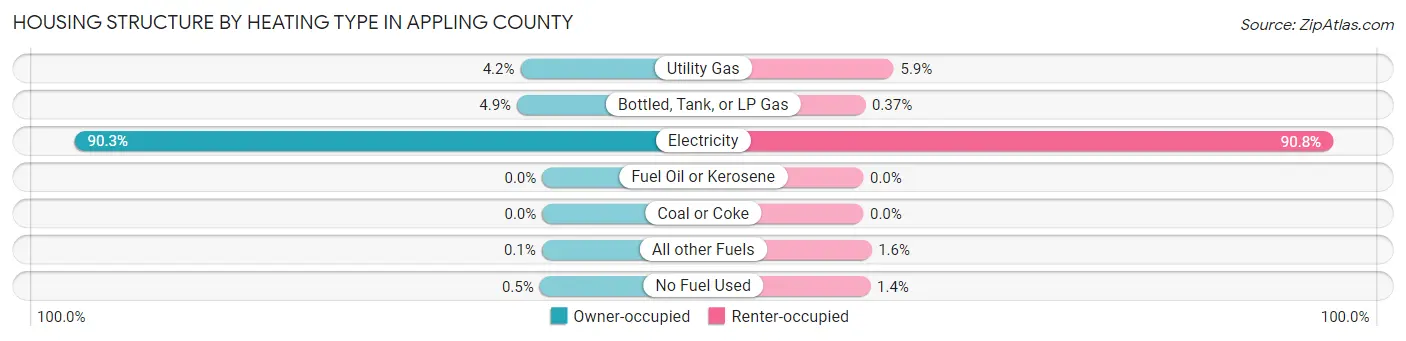
| Heating Type | Owner-occupied | Renter-occupied |
| Utility Gas | 210 (4.2%) | 112 (5.9%) |
| Bottled, Tank, or LP Gas | 243 (4.9%) | 7 (0.4%) |
| Electricity | 4,507 (90.3%) | 1,725 (90.8%) |
| Fuel Oil or Kerosene | 0 (0.0%) | 0 (0.0%) |
| Coal or Coke | 0 (0.0%) | 0 (0.0%) |
| All other Fuels | 5 (0.1%) | 30 (1.6%) |
| No Fuel Used | 25 (0.5%) | 26 (1.4%) |
| Total | 4,990 (100.0%) | 1,900 (100.0%) |
Household Vehicle Usage in Appling County
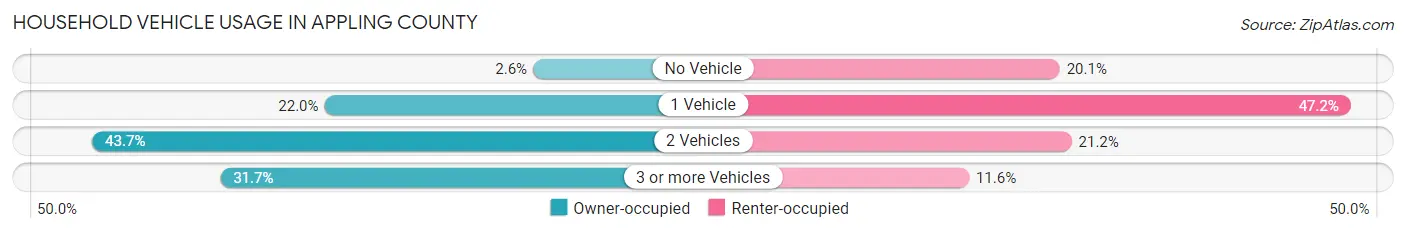
| Vehicles per Household | Owner-occupied | Renter-occupied |
| No Vehicle | 127 (2.5%) | 381 (20.1%) |
| 1 Vehicle | 1,099 (22.0%) | 897 (47.2%) |
| 2 Vehicles | 2,180 (43.7%) | 402 (21.2%) |
| 3 or more Vehicles | 1,584 (31.7%) | 220 (11.6%) |
| Total | 4,990 (100.0%) | 1,900 (100.0%) |
Real Estate & Mortgages in Appling County
Real Estate and Mortgage Overview in Appling County
| Characteristic | Without Mortgage | With Mortgage |
| Housing Units | 2,939 | 2,051 |
| Median Property Value | $84,400 | $92,400 |
| Median Household Income | $44,872 | $284 |
| Monthly Housing Costs | $356 | $0 |
| Real Estate Taxes | $611 | $241 |
Property Value by Mortgage Status in Appling County
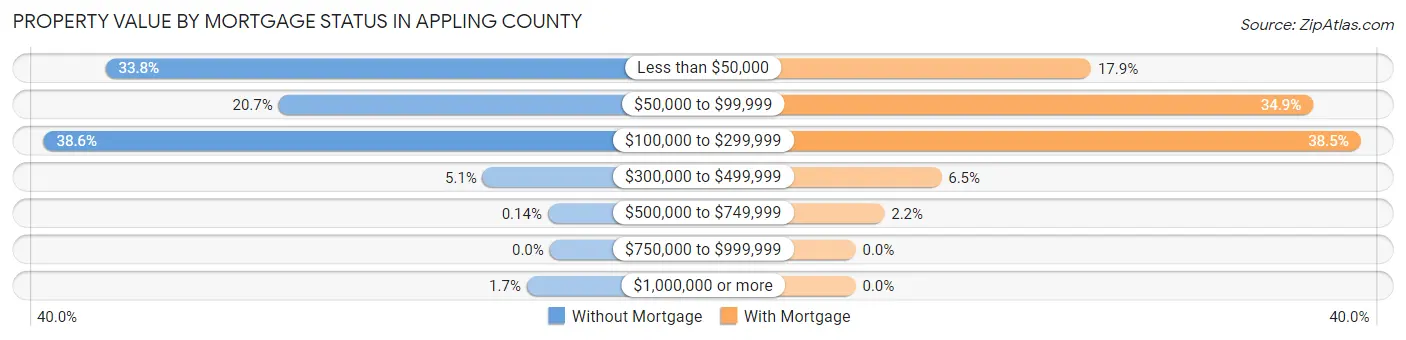
| Property Value | Without Mortgage | With Mortgage |
| Less than $50,000 | 994 (33.8%) | 368 (17.9%) |
| $50,000 to $99,999 | 607 (20.6%) | 715 (34.9%) |
| $100,000 to $299,999 | 1,133 (38.6%) | 789 (38.5%) |
| $300,000 to $499,999 | 150 (5.1%) | 134 (6.5%) |
| $500,000 to $749,999 | 4 (0.1%) | 45 (2.2%) |
| $750,000 to $999,999 | 0 (0.0%) | 0 (0.0%) |
| $1,000,000 or more | 51 (1.7%) | 0 (0.0%) |
| Total | 2,939 (100.0%) | 2,051 (100.0%) |
Household Income by Mortgage Status in Appling County
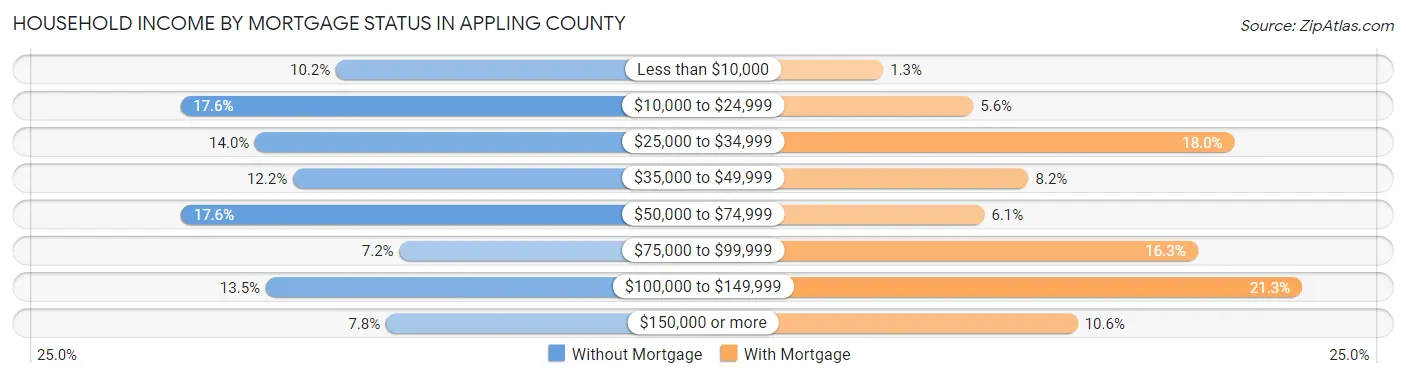
| Household Income | Without Mortgage | With Mortgage |
| Less than $10,000 | 299 (10.2%) | 27 (1.3%) |
| $10,000 to $24,999 | 517 (17.6%) | 115 (5.6%) |
| $25,000 to $34,999 | 412 (14.0%) | 370 (18.0%) |
| $35,000 to $49,999 | 359 (12.2%) | 169 (8.2%) |
| $50,000 to $74,999 | 516 (17.6%) | 126 (6.1%) |
| $75,000 to $99,999 | 210 (7.1%) | 334 (16.3%) |
| $100,000 to $149,999 | 397 (13.5%) | 436 (21.3%) |
| $150,000 or more | 229 (7.8%) | 217 (10.6%) |
| Total | 2,939 (100.0%) | 2,051 (100.0%) |
Property Value to Household Income Ratio in Appling County
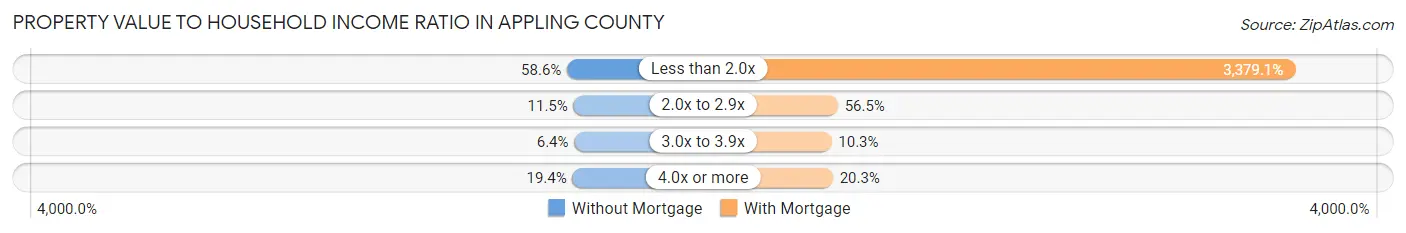
| Value-to-Income Ratio | Without Mortgage | With Mortgage |
| Less than 2.0x | 1,721 (58.6%) | 69,306 (3,379.1%) |
| 2.0x to 2.9x | 338 (11.5%) | 1,158 (56.5%) |
| 3.0x to 3.9x | 187 (6.4%) | 212 (10.3%) |
| 4.0x or more | 569 (19.4%) | 416 (20.3%) |
| Total | 2,939 (100.0%) | 2,051 (100.0%) |
Real Estate Taxes by Mortgage Status in Appling County
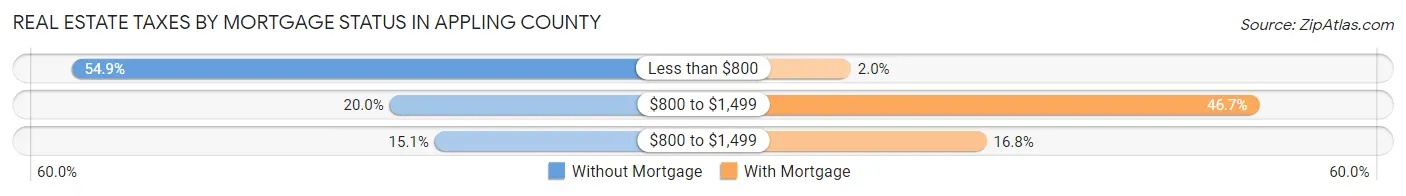
| Property Taxes | Without Mortgage | With Mortgage |
| Less than $800 | 1,612 (54.8%) | 40 (1.9%) |
| $800 to $1,499 | 588 (20.0%) | 958 (46.7%) |
| $800 to $1,499 | 443 (15.1%) | 345 (16.8%) |
| Total | 2,939 (100.0%) | 2,051 (100.0%) |
Health & Disability in Appling County
Health Insurance Coverage by Age in Appling County
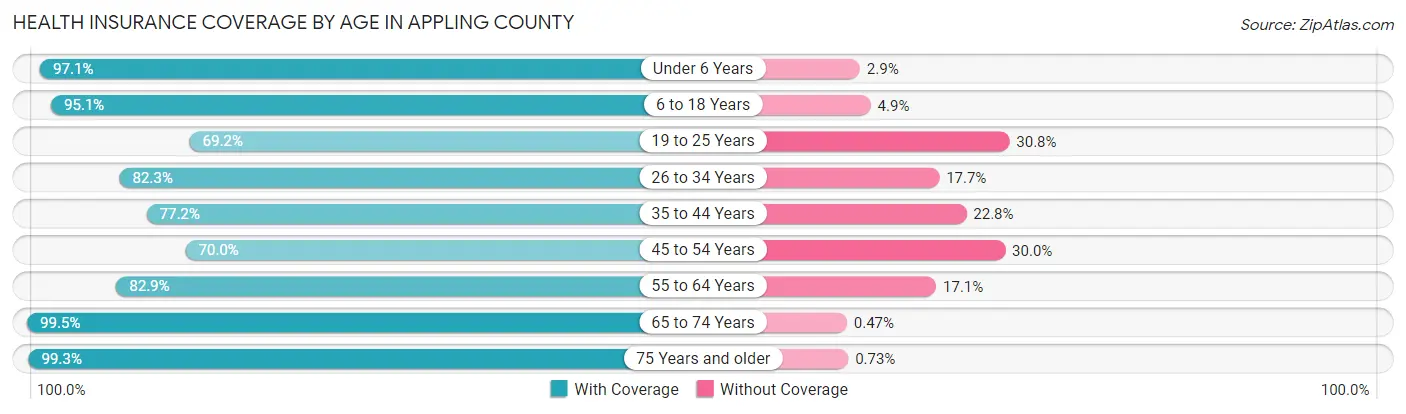
| Age Bracket | With Coverage | Without Coverage |
| Under 6 Years | 1,368 (97.1%) | 41 (2.9%) |
| 6 to 18 Years | 3,287 (95.1%) | 170 (4.9%) |
| 19 to 25 Years | 1,039 (69.2%) | 462 (30.8%) |
| 26 to 34 Years | 1,427 (82.3%) | 307 (17.7%) |
| 35 to 44 Years | 1,707 (77.2%) | 503 (22.8%) |
| 45 to 54 Years | 1,542 (70.0%) | 661 (30.0%) |
| 55 to 64 Years | 2,019 (82.9%) | 417 (17.1%) |
| 65 to 74 Years | 1,893 (99.5%) | 9 (0.5%) |
| 75 Years and older | 1,220 (99.3%) | 9 (0.7%) |
| Total | 15,502 (85.7%) | 2,579 (14.3%) |
Health Insurance Coverage by Citizenship Status in Appling County
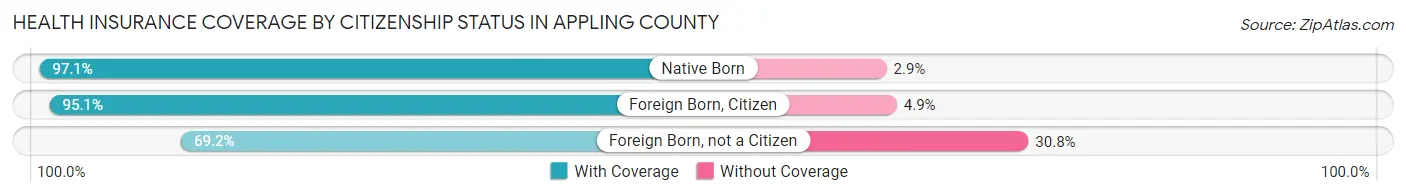
| Citizenship Status | With Coverage | Without Coverage |
| Native Born | 1,368 (97.1%) | 41 (2.9%) |
| Foreign Born, Citizen | 3,287 (95.1%) | 170 (4.9%) |
| Foreign Born, not a Citizen | 1,039 (69.2%) | 462 (30.8%) |
Health Insurance Coverage by Household Income in Appling County
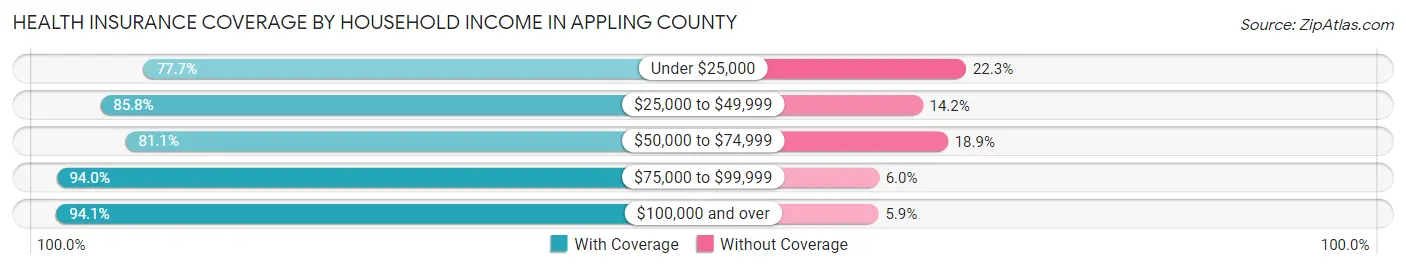
| Household Income | With Coverage | Without Coverage |
| Under $25,000 | 3,241 (77.7%) | 932 (22.3%) |
| $25,000 to $49,999 | 3,821 (85.8%) | 632 (14.2%) |
| $50,000 to $74,999 | 2,645 (81.1%) | 617 (18.9%) |
| $75,000 to $99,999 | 2,107 (94.0%) | 134 (6.0%) |
| $100,000 and over | 3,613 (94.1%) | 228 (5.9%) |
Public vs Private Health Insurance Coverage by Age in Appling County
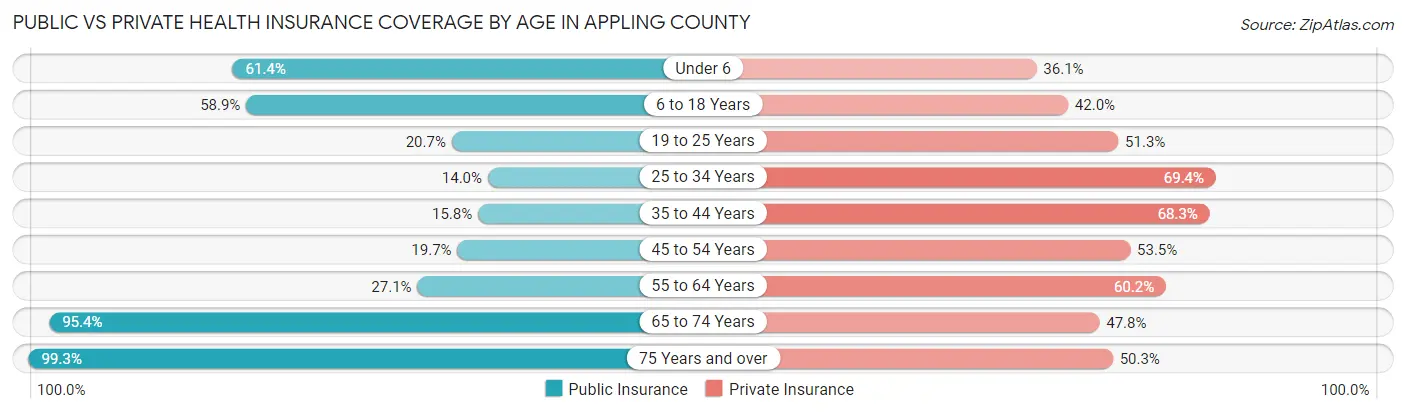
| Age Bracket | Public Insurance | Private Insurance |
| Under 6 | 865 (61.4%) | 509 (36.1%) |
| 6 to 18 Years | 2,035 (58.9%) | 1,451 (42.0%) |
| 19 to 25 Years | 311 (20.7%) | 770 (51.3%) |
| 25 to 34 Years | 243 (14.0%) | 1,204 (69.4%) |
| 35 to 44 Years | 350 (15.8%) | 1,509 (68.3%) |
| 45 to 54 Years | 433 (19.7%) | 1,179 (53.5%) |
| 55 to 64 Years | 660 (27.1%) | 1,466 (60.2%) |
| 65 to 74 Years | 1,815 (95.4%) | 909 (47.8%) |
| 75 Years and over | 1,220 (99.3%) | 618 (50.3%) |
| Total | 7,932 (43.9%) | 9,615 (53.2%) |
Disability Status by Sex by Age in Appling County
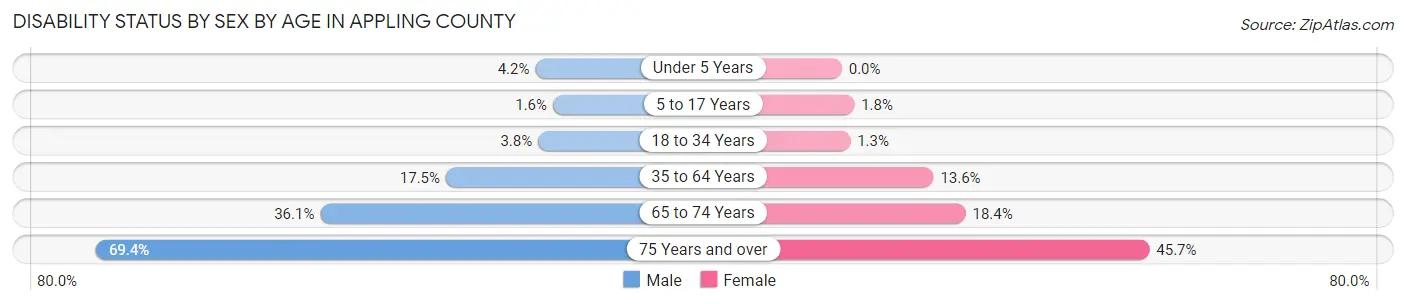
| Age Bracket | Male | Female |
| Under 5 Years | 24 (4.2%) | 0 (0.0%) |
| 5 to 17 Years | 28 (1.6%) | 29 (1.8%) |
| 18 to 34 Years | 71 (3.7%) | 21 (1.3%) |
| 35 to 64 Years | 581 (17.4%) | 479 (13.6%) |
| 65 to 74 Years | 339 (36.1%) | 177 (18.4%) |
| 75 Years and over | 356 (69.4%) | 327 (45.7%) |
Disability Class by Sex by Age in Appling County
Disability Class: Hearing Difficulty
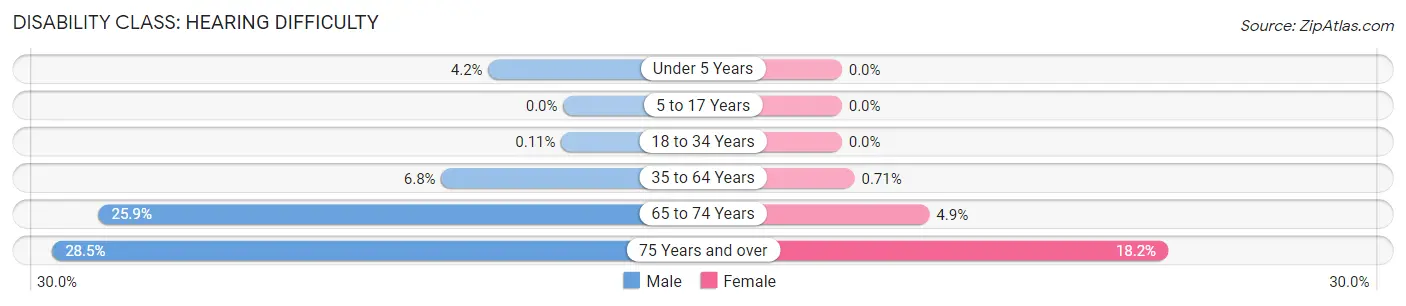
| Age Bracket | Male | Female |
| Under 5 Years | 24 (4.2%) | 0 (0.0%) |
| 5 to 17 Years | 0 (0.0%) | 0 (0.0%) |
| 18 to 34 Years | 2 (0.1%) | 0 (0.0%) |
| 35 to 64 Years | 226 (6.8%) | 25 (0.7%) |
| 65 to 74 Years | 243 (25.9%) | 47 (4.9%) |
| 75 Years and over | 146 (28.5%) | 130 (18.2%) |
Disability Class: Vision Difficulty
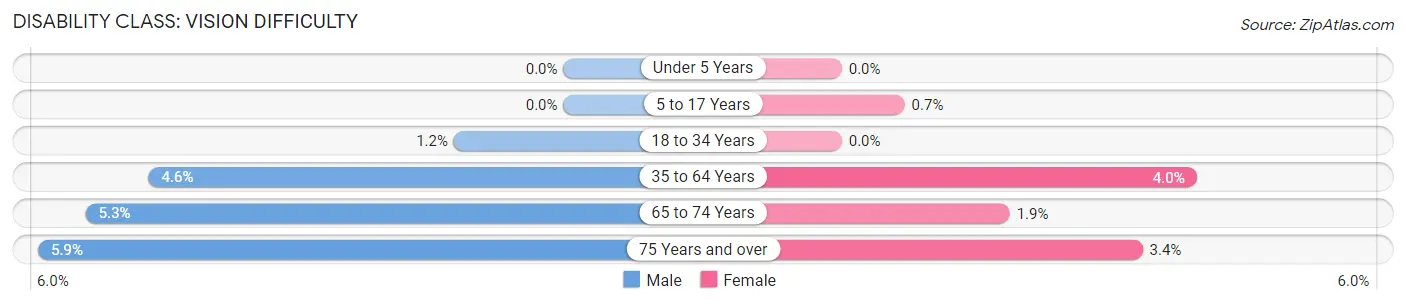
| Age Bracket | Male | Female |
| Under 5 Years | 0 (0.0%) | 0 (0.0%) |
| 5 to 17 Years | 0 (0.0%) | 11 (0.7%) |
| 18 to 34 Years | 23 (1.2%) | 0 (0.0%) |
| 35 to 64 Years | 154 (4.6%) | 139 (4.0%) |
| 65 to 74 Years | 50 (5.3%) | 18 (1.9%) |
| 75 Years and over | 30 (5.9%) | 24 (3.4%) |
Disability Class: Cognitive Difficulty
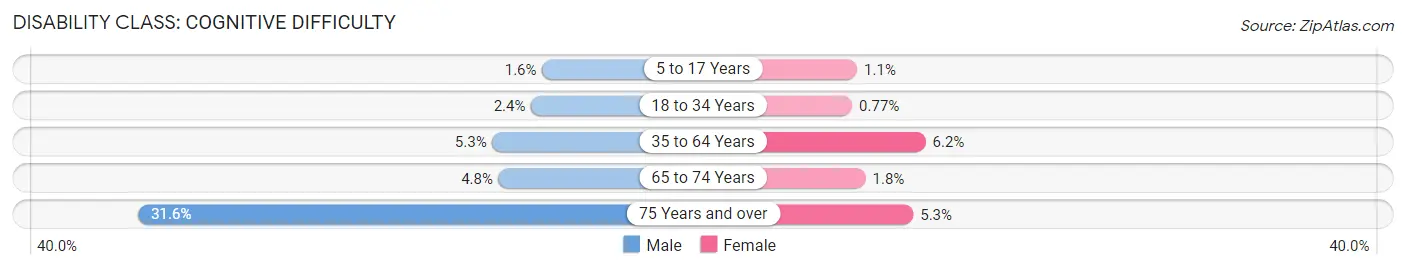
| Age Bracket | Male | Female |
| 5 to 17 Years | 28 (1.6%) | 18 (1.1%) |
| 18 to 34 Years | 45 (2.4%) | 13 (0.8%) |
| 35 to 64 Years | 175 (5.3%) | 219 (6.2%) |
| 65 to 74 Years | 45 (4.8%) | 17 (1.8%) |
| 75 Years and over | 162 (31.6%) | 38 (5.3%) |
Disability Class: Ambulatory Difficulty
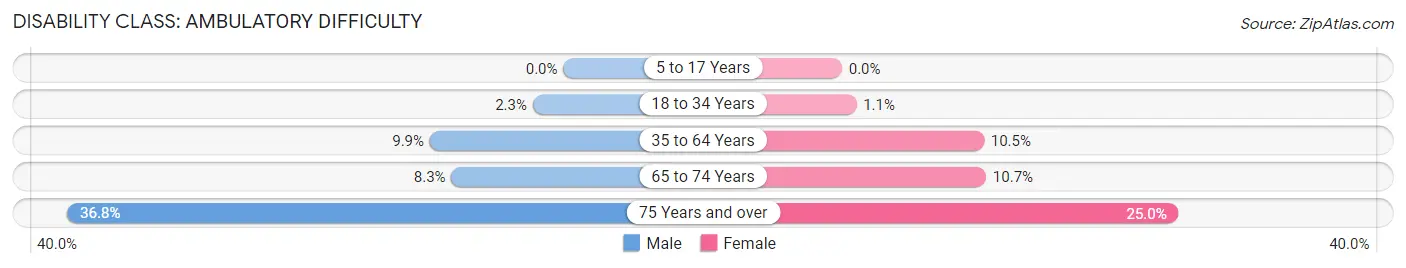
| Age Bracket | Male | Female |
| 5 to 17 Years | 0 (0.0%) | 0 (0.0%) |
| 18 to 34 Years | 43 (2.3%) | 18 (1.1%) |
| 35 to 64 Years | 330 (9.9%) | 371 (10.5%) |
| 65 to 74 Years | 78 (8.3%) | 103 (10.7%) |
| 75 Years and over | 189 (36.8%) | 179 (25.0%) |
Disability Class: Self-Care Difficulty
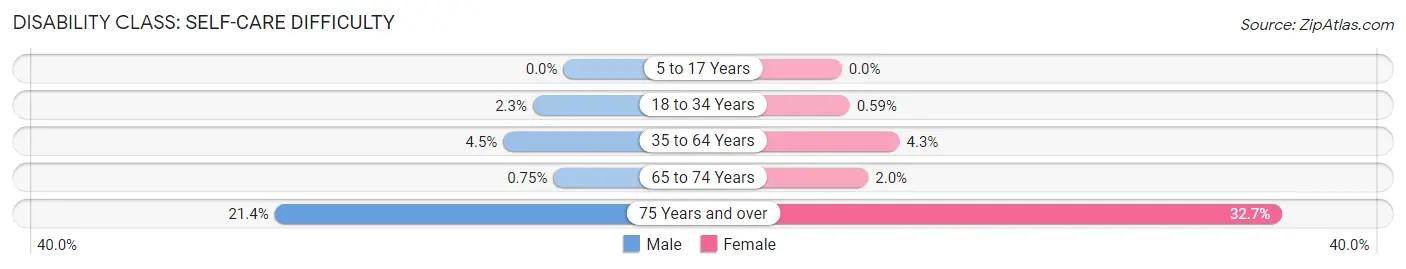
| Age Bracket | Male | Female |
| 5 to 17 Years | 0 (0.0%) | 0 (0.0%) |
| 18 to 34 Years | 43 (2.3%) | 10 (0.6%) |
| 35 to 64 Years | 149 (4.5%) | 151 (4.3%) |
| 65 to 74 Years | 7 (0.7%) | 19 (2.0%) |
| 75 Years and over | 110 (21.4%) | 234 (32.7%) |
Technology Access in Appling County
Computing Device Access in Appling County
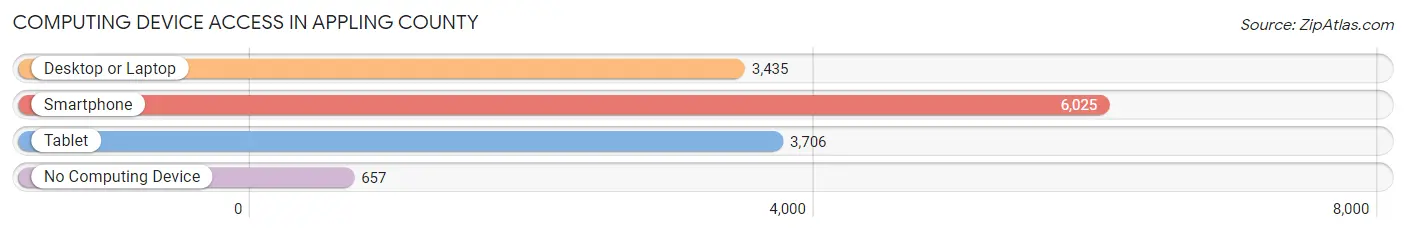
| Device Type | # Households | % Households |
| Desktop or Laptop | 3,435 | 49.8% |
| Smartphone | 6,025 | 87.5% |
| Tablet | 3,706 | 53.8% |
| No Computing Device | 657 | 9.5% |
| Total | 6,890 | 100.0% |
Internet Access in Appling County
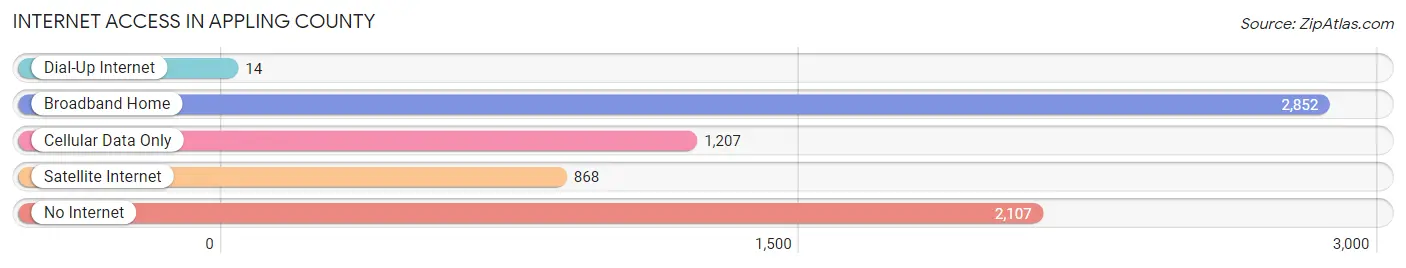
| Internet Type | # Households | % Households |
| Dial-Up Internet | 14 | 0.2% |
| Broadband Home | 2,852 | 41.4% |
| Cellular Data Only | 1,207 | 17.5% |
| Satellite Internet | 868 | 12.6% |
| No Internet | 2,107 | 30.6% |
| Total | 6,890 | 100.0% |
Appling County Summary
Appling County is located in the southeastern part of the U.S. state of Georgia. It is part of the Brunswick, Georgia Metropolitan Statistical Area. The county seat is Baxley. As of the 2010 census, the population was 18,236.
History
Appling County was created in 1818 from parts of Tattnall and Liberty counties. It was named for Lieutenant Colonel Daniel Appling, a hero of the War of 1812. The county was originally part of the Creek Nation, and the Creek Indians were the first inhabitants of the area.
In the early 19th century, the area was settled by European Americans, mostly from South Carolina. The county was developed for cotton plantations, and the county seat of Baxley was established in 1820.
During the American Civil War, Appling County was a center of Confederate activity. The county was the site of several battles, including the Battle of Baxley in 1864.
Geography
Appling County is located in the southeastern part of Georgia, about 60 miles from the Atlantic Ocean. It is bordered by Bacon County to the north, Jeff Davis County to the east, Tattnall County to the south, and Wayne County to the west.
The county has a total area of 545 square miles, of which 543 square miles is land and 2.2 square miles is water. The Altamaha River forms the eastern border of the county.
Economy
The economy of Appling County is largely based on agriculture. The county is one of the leading producers of timber in the state, and the timber industry is the largest employer in the county. Other major industries include poultry, beef, and dairy farming.
The county also has a growing tourism industry, with visitors coming to the area to enjoy the natural beauty of the Altamaha River and the Okefenokee Swamp.
Demographics
As of the 2010 census, there were 18,236 people, 6,845 households, and 4,919 families living in Appling County. The population density was 33.5 people per square mile. The racial makeup of the county was 68.3% White, 28.2% African American, 0.4% Native American, 0.3% Asian, 0.1% Pacific Islander, 0.7% from other races, and 1.9% from two or more races. Hispanic or Latino of any race were 2.2% of the population.
The median income for a household in the county was $30,945, and the median income for a family was $37,945. The per capita income for the county was $15,945. About 17.2% of families and 21.2% of the population were below the poverty line, including 28.2% of those under age 18 and 17.2% of those age 65 or over.
Common Questions
What is Per Capita Income in Appling County?
Per Capita income in Appling County is $23,940.
What is the Median Family Income in Appling County?
Median Family Income in Appling County is $54,028.
What is the Median Household income in Appling County?
Median Household Income in Appling County is $43,268.
What is Income or Wage Gap in Appling County?
Income or Wage Gap in Appling County is 30.2%.
Women in Appling County earn 69.8 cents for every dollar earned by a man.
What is Inequality or Gini Index in Appling County?
Inequality or Gini Index in Appling County is 0.47.
What is the Total Population of Appling County?
Total Population of Appling County is 18,441.
What is the Total Male Population of Appling County?
Total Male Population of Appling County is 9,309.
What is the Total Female Population of Appling County?
Total Female Population of Appling County is 9,132.
What is the Ratio of Males per 100 Females in Appling County?
There are 101.94 Males per 100 Females in Appling County.
What is the Ratio of Females per 100 Males in Appling County?
There are 98.10 Females per 100 Males in Appling County.
What is the Median Population Age in Appling County?
Median Population Age in Appling County is 39.6 Years.
What is the Average Family Size in Appling County
Average Family Size in Appling County is 3.0 People.
What is the Average Household Size in Appling County
Average Household Size in Appling County is 2.6 People.
How Large is the Labor Force in Appling County?
There are 7,667 People in the Labor Forcein in Appling County.
What is the Percentage of People in the Labor Force in Appling County?
53.2% of People are in the Labor Force in Appling County.
What is the Unemployment Rate in Appling County?
Unemployment Rate in Appling County is 3.3%.