Immigrants from Poland vs Immigrants from Norway Married-couple Households
COMPARE
Immigrants from Poland
Immigrants from Norway
Married-couple Households
Married-couple Households Comparison
Immigrants from Poland
Immigrants from Norway
48.1%
MARRIED-COUPLE HOUSEHOLDS
97.7/ 100
METRIC RATING
82nd/ 347
METRIC RANK
46.5%
MARRIED-COUPLE HOUSEHOLDS
52.0/ 100
METRIC RATING
173rd/ 347
METRIC RANK
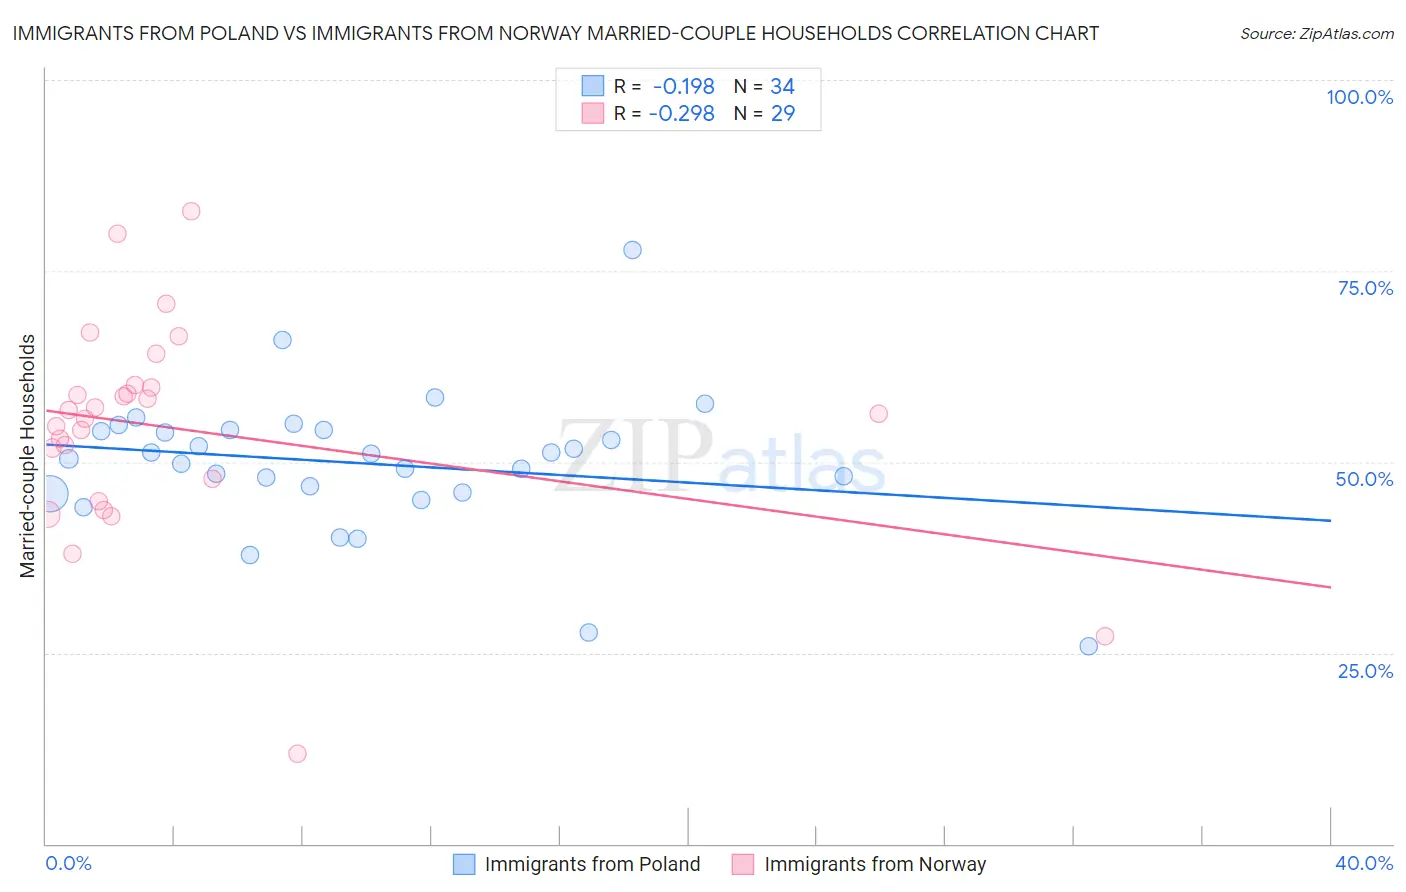
Immigrants from Poland vs Immigrants from Norway Married-couple Households Correlation Chart
The statistical analysis conducted on geographies consisting of 304,780,020 people shows a poor negative correlation between the proportion of Immigrants from Poland and percentage of married-couple family households in the United States with a correlation coefficient (R) of -0.198 and weighted average of 48.1%. Similarly, the statistical analysis conducted on geographies consisting of 116,686,104 people shows a weak negative correlation between the proportion of Immigrants from Norway and percentage of married-couple family households in the United States with a correlation coefficient (R) of -0.298 and weighted average of 46.5%, a difference of 3.4%.
Married-couple Households Correlation Summary
| Measurement | Immigrants from Poland | Immigrants from Norway |
| Minimum | 25.9% | 11.8% |
| Maximum | 77.7% | 82.8% |
| Range | 51.8% | 71.0% |
| Mean | 49.8% | 54.3% |
| Median | 50.8% | 56.2% |
| Interquartile 25% (IQ1) | 46.0% | 46.3% |
| Interquartile 75% (IQ3) | 54.1% | 59.8% |
| Interquartile Range (IQR) | 8.1% | 13.6% |
| Standard Deviation (Sample) | 9.3% | 14.2% |
| Standard Deviation (Population) | 9.2% | 13.9% |
Similar Demographics by Married-couple Households
Demographics Similar to Immigrants from Poland by Married-couple Households
In terms of married-couple households, the demographic groups most similar to Immigrants from Poland are Guamanian/Chamorro (48.1%, a difference of 0.020%), Ukrainian (48.1%, a difference of 0.040%), Immigrants from Israel (48.0%, a difference of 0.090%), Belgian (48.0%, a difference of 0.11%), and Immigrants from Ireland (48.0%, a difference of 0.13%).
| Demographics | Rating | Rank | Married-couple Households |
| Immigrants | England | 98.4 /100 | #75 | Exceptional 48.2% |
| Immigrants | Fiji | 98.4 /100 | #76 | Exceptional 48.2% |
| Canadians | 98.2 /100 | #77 | Exceptional 48.2% |
| Egyptians | 98.2 /100 | #78 | Exceptional 48.2% |
| Immigrants | Netherlands | 98.2 /100 | #79 | Exceptional 48.2% |
| Russians | 98.1 /100 | #80 | Exceptional 48.2% |
| Finns | 98.0 /100 | #81 | Exceptional 48.1% |
| Immigrants | Poland | 97.7 /100 | #82 | Exceptional 48.1% |
| Guamanians/Chamorros | 97.6 /100 | #83 | Exceptional 48.1% |
| Ukrainians | 97.6 /100 | #84 | Exceptional 48.1% |
| Immigrants | Israel | 97.4 /100 | #85 | Exceptional 48.0% |
| Belgians | 97.4 /100 | #86 | Exceptional 48.0% |
| Immigrants | Ireland | 97.3 /100 | #87 | Exceptional 48.0% |
| Afghans | 97.3 /100 | #88 | Exceptional 48.0% |
| Cypriots | 97.2 /100 | #89 | Exceptional 48.0% |
Demographics Similar to Immigrants from Norway by Married-couple Households
In terms of married-couple households, the demographic groups most similar to Immigrants from Norway are Immigrants from Mexico (46.4%, a difference of 0.070%), Immigrants from Australia (46.5%, a difference of 0.10%), Immigrants from Chile (46.5%, a difference of 0.14%), Immigrants from Colombia (46.4%, a difference of 0.22%), and South American (46.6%, a difference of 0.23%).
| Demographics | Rating | Rank | Married-couple Households |
| Cherokee | 65.7 /100 | #166 | Good 46.7% |
| Immigrants | Croatia | 64.2 /100 | #167 | Good 46.7% |
| Israelis | 62.3 /100 | #168 | Good 46.7% |
| Spanish American Indians | 59.4 /100 | #169 | Average 46.6% |
| South Americans | 58.0 /100 | #170 | Average 46.6% |
| Immigrants | Chile | 55.7 /100 | #171 | Average 46.5% |
| Immigrants | Australia | 54.6 /100 | #172 | Average 46.5% |
| Immigrants | Norway | 52.0 /100 | #173 | Average 46.5% |
| Immigrants | Mexico | 50.0 /100 | #174 | Average 46.4% |
| Immigrants | Colombia | 46.1 /100 | #175 | Average 46.4% |
| Cajuns | 45.2 /100 | #176 | Average 46.4% |
| Immigrants | Immigrants | 43.8 /100 | #177 | Average 46.3% |
| Immigrants | Costa Rica | 43.4 /100 | #178 | Average 46.3% |
| Immigrants | Zimbabwe | 43.0 /100 | #179 | Average 46.3% |
| Mongolians | 42.0 /100 | #180 | Average 46.3% |