Honduran vs Immigrants from Philippines Married-couple Households
COMPARE
Honduran
Immigrants from Philippines
Married-couple Households
Married-couple Households Comparison
Hondurans
Immigrants from Philippines
42.1%
MARRIED-COUPLE HOUSEHOLDS
0.0/ 100
METRIC RATING
290th/ 347
METRIC RANK
49.3%
MARRIED-COUPLE HOUSEHOLDS
99.9/ 100
METRIC RATING
25th/ 347
METRIC RANK
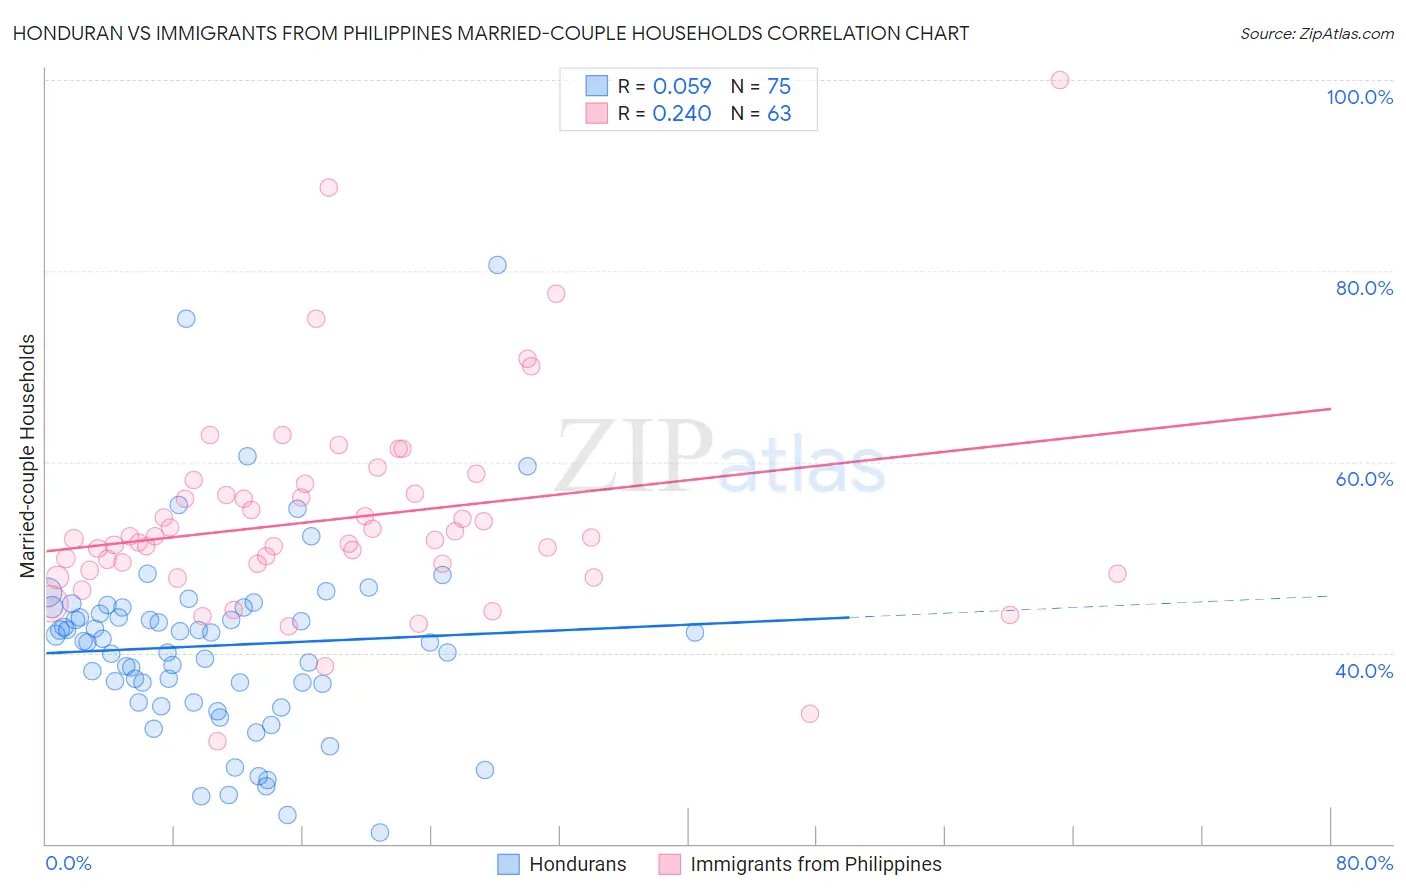
Honduran vs Immigrants from Philippines Married-couple Households Correlation Chart
The statistical analysis conducted on geographies consisting of 357,594,784 people shows a slight positive correlation between the proportion of Hondurans and percentage of married-couple family households in the United States with a correlation coefficient (R) of 0.059 and weighted average of 42.1%. Similarly, the statistical analysis conducted on geographies consisting of 471,010,900 people shows a weak positive correlation between the proportion of Immigrants from Philippines and percentage of married-couple family households in the United States with a correlation coefficient (R) of 0.240 and weighted average of 49.3%, a difference of 17.3%.
Married-couple Households Correlation Summary
| Measurement | Honduran | Immigrants from Philippines |
| Minimum | 21.2% | 30.7% |
| Maximum | 80.6% | 100.0% |
| Range | 59.5% | 69.3% |
| Mean | 40.8% | 54.0% |
| Median | 41.3% | 51.9% |
| Interquartile 25% (IQ1) | 34.9% | 48.6% |
| Interquartile 75% (IQ3) | 44.7% | 56.6% |
| Interquartile Range (IQR) | 9.9% | 8.0% |
| Standard Deviation (Sample) | 10.0% | 11.1% |
| Standard Deviation (Population) | 9.9% | 11.0% |
Similar Demographics by Married-couple Households
Demographics Similar to Hondurans by Married-couple Households
In terms of married-couple households, the demographic groups most similar to Hondurans are Paiute (42.1%, a difference of 0.010%), Sudanese (42.1%, a difference of 0.050%), Indonesian (42.0%, a difference of 0.060%), Immigrants from Eritrea (42.1%, a difference of 0.11%), and Menominee (42.0%, a difference of 0.17%).
| Demographics | Rating | Rank | Married-couple Households |
| Inupiat | 0.0 /100 | #283 | Tragic 42.4% |
| Cheyenne | 0.0 /100 | #284 | Tragic 42.3% |
| Ghanaians | 0.0 /100 | #285 | Tragic 42.2% |
| Belizeans | 0.0 /100 | #286 | Tragic 42.2% |
| Chippewa | 0.0 /100 | #287 | Tragic 42.1% |
| Immigrants | Eritrea | 0.0 /100 | #288 | Tragic 42.1% |
| Sudanese | 0.0 /100 | #289 | Tragic 42.1% |
| Hondurans | 0.0 /100 | #290 | Tragic 42.1% |
| Paiute | 0.0 /100 | #291 | Tragic 42.1% |
| Indonesians | 0.0 /100 | #292 | Tragic 42.0% |
| Menominee | 0.0 /100 | #293 | Tragic 42.0% |
| Immigrants | Yemen | 0.0 /100 | #294 | Tragic 42.0% |
| Kiowa | 0.0 /100 | #295 | Tragic 42.0% |
| Immigrants | Sudan | 0.0 /100 | #296 | Tragic 41.9% |
| Arapaho | 0.0 /100 | #297 | Tragic 41.8% |
Demographics Similar to Immigrants from Philippines by Married-couple Households
In terms of married-couple households, the demographic groups most similar to Immigrants from Philippines are Immigrants from Scotland (49.3%, a difference of 0.13%), Bhutanese (49.3%, a difference of 0.15%), Czech (49.4%, a difference of 0.19%), Dutch (49.5%, a difference of 0.27%), and Asian (49.5%, a difference of 0.28%).
| Demographics | Rating | Rank | Married-couple Households |
| English | 99.9 /100 | #18 | Exceptional 49.6% |
| Europeans | 99.9 /100 | #19 | Exceptional 49.6% |
| Scandinavians | 99.9 /100 | #20 | Exceptional 49.6% |
| Norwegians | 99.9 /100 | #21 | Exceptional 49.5% |
| Asians | 99.9 /100 | #22 | Exceptional 49.5% |
| Dutch | 99.9 /100 | #23 | Exceptional 49.5% |
| Czechs | 99.9 /100 | #24 | Exceptional 49.4% |
| Immigrants | Philippines | 99.9 /100 | #25 | Exceptional 49.3% |
| Immigrants | Scotland | 99.8 /100 | #26 | Exceptional 49.3% |
| Bhutanese | 99.8 /100 | #27 | Exceptional 49.3% |
| Germans | 99.8 /100 | #28 | Exceptional 49.2% |
| Maltese | 99.8 /100 | #29 | Exceptional 49.2% |
| Bolivians | 99.8 /100 | #30 | Exceptional 49.2% |
| Native Hawaiians | 99.8 /100 | #31 | Exceptional 49.1% |
| Hungarians | 99.8 /100 | #32 | Exceptional 49.1% |