Honduran vs Immigrants from Fiji Married-couple Households
COMPARE
Honduran
Immigrants from Fiji
Married-couple Households
Married-couple Households Comparison
Hondurans
Immigrants from Fiji
42.1%
MARRIED-COUPLE HOUSEHOLDS
0.0/ 100
METRIC RATING
290th/ 347
METRIC RANK
48.2%
MARRIED-COUPLE HOUSEHOLDS
98.4/ 100
METRIC RATING
76th/ 347
METRIC RANK
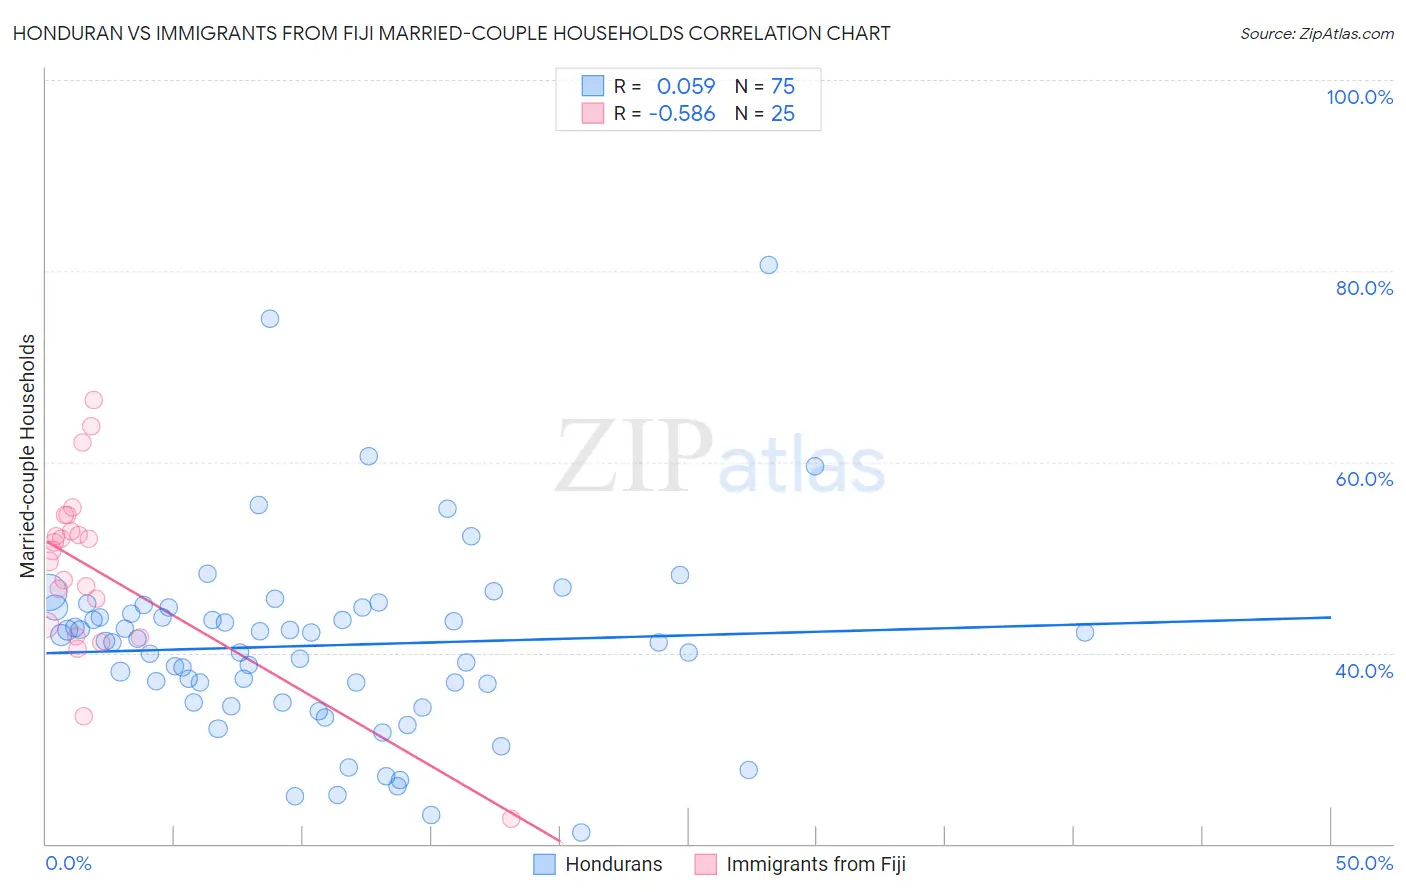
Honduran vs Immigrants from Fiji Married-couple Households Correlation Chart
The statistical analysis conducted on geographies consisting of 357,594,784 people shows a slight positive correlation between the proportion of Hondurans and percentage of married-couple family households in the United States with a correlation coefficient (R) of 0.059 and weighted average of 42.1%. Similarly, the statistical analysis conducted on geographies consisting of 93,754,900 people shows a substantial negative correlation between the proportion of Immigrants from Fiji and percentage of married-couple family households in the United States with a correlation coefficient (R) of -0.586 and weighted average of 48.2%, a difference of 14.7%.
Married-couple Households Correlation Summary
| Measurement | Honduran | Immigrants from Fiji |
| Minimum | 21.2% | 22.7% |
| Maximum | 80.6% | 66.5% |
| Range | 59.5% | 43.8% |
| Mean | 40.8% | 48.8% |
| Median | 41.3% | 50.7% |
| Interquartile 25% (IQ1) | 34.9% | 42.3% |
| Interquartile 75% (IQ3) | 44.7% | 53.6% |
| Interquartile Range (IQR) | 9.9% | 11.2% |
| Standard Deviation (Sample) | 10.0% | 9.3% |
| Standard Deviation (Population) | 9.9% | 9.1% |
Similar Demographics by Married-couple Households
Demographics Similar to Hondurans by Married-couple Households
In terms of married-couple households, the demographic groups most similar to Hondurans are Paiute (42.1%, a difference of 0.010%), Sudanese (42.1%, a difference of 0.050%), Indonesian (42.0%, a difference of 0.060%), Immigrants from Eritrea (42.1%, a difference of 0.11%), and Menominee (42.0%, a difference of 0.17%).
| Demographics | Rating | Rank | Married-couple Households |
| Inupiat | 0.0 /100 | #283 | Tragic 42.4% |
| Cheyenne | 0.0 /100 | #284 | Tragic 42.3% |
| Ghanaians | 0.0 /100 | #285 | Tragic 42.2% |
| Belizeans | 0.0 /100 | #286 | Tragic 42.2% |
| Chippewa | 0.0 /100 | #287 | Tragic 42.1% |
| Immigrants | Eritrea | 0.0 /100 | #288 | Tragic 42.1% |
| Sudanese | 0.0 /100 | #289 | Tragic 42.1% |
| Hondurans | 0.0 /100 | #290 | Tragic 42.1% |
| Paiute | 0.0 /100 | #291 | Tragic 42.1% |
| Indonesians | 0.0 /100 | #292 | Tragic 42.0% |
| Menominee | 0.0 /100 | #293 | Tragic 42.0% |
| Immigrants | Yemen | 0.0 /100 | #294 | Tragic 42.0% |
| Kiowa | 0.0 /100 | #295 | Tragic 42.0% |
| Immigrants | Sudan | 0.0 /100 | #296 | Tragic 41.9% |
| Arapaho | 0.0 /100 | #297 | Tragic 41.8% |
Demographics Similar to Immigrants from Fiji by Married-couple Households
In terms of married-couple households, the demographic groups most similar to Immigrants from Fiji are Immigrants from England (48.2%, a difference of 0.0%), Immigrants from Romania (48.3%, a difference of 0.090%), Immigrants from Singapore (48.3%, a difference of 0.10%), Canadian (48.2%, a difference of 0.10%), and Egyptian (48.2%, a difference of 0.12%).
| Demographics | Rating | Rank | Married-couple Households |
| Immigrants | China | 98.9 /100 | #69 | Exceptional 48.4% |
| Immigrants | North America | 98.9 /100 | #70 | Exceptional 48.4% |
| Laotians | 98.8 /100 | #71 | Exceptional 48.4% |
| Scotch-Irish | 98.6 /100 | #72 | Exceptional 48.3% |
| Immigrants | Singapore | 98.6 /100 | #73 | Exceptional 48.3% |
| Immigrants | Romania | 98.6 /100 | #74 | Exceptional 48.3% |
| Immigrants | England | 98.4 /100 | #75 | Exceptional 48.2% |
| Immigrants | Fiji | 98.4 /100 | #76 | Exceptional 48.2% |
| Canadians | 98.2 /100 | #77 | Exceptional 48.2% |
| Egyptians | 98.2 /100 | #78 | Exceptional 48.2% |
| Immigrants | Netherlands | 98.2 /100 | #79 | Exceptional 48.2% |
| Russians | 98.1 /100 | #80 | Exceptional 48.2% |
| Finns | 98.0 /100 | #81 | Exceptional 48.1% |
| Immigrants | Poland | 97.7 /100 | #82 | Exceptional 48.1% |
| Guamanians/Chamorros | 97.6 /100 | #83 | Exceptional 48.1% |