Alsatian vs African Married-couple Households
COMPARE
Alsatian
African
Married-couple Households
Married-couple Households Comparison
Alsatians
Africans
44.8%
MARRIED-COUPLE HOUSEHOLDS
2.3/ 100
METRIC RATING
226th/ 347
METRIC RANK
40.9%
MARRIED-COUPLE HOUSEHOLDS
0.0/ 100
METRIC RATING
312th/ 347
METRIC RANK
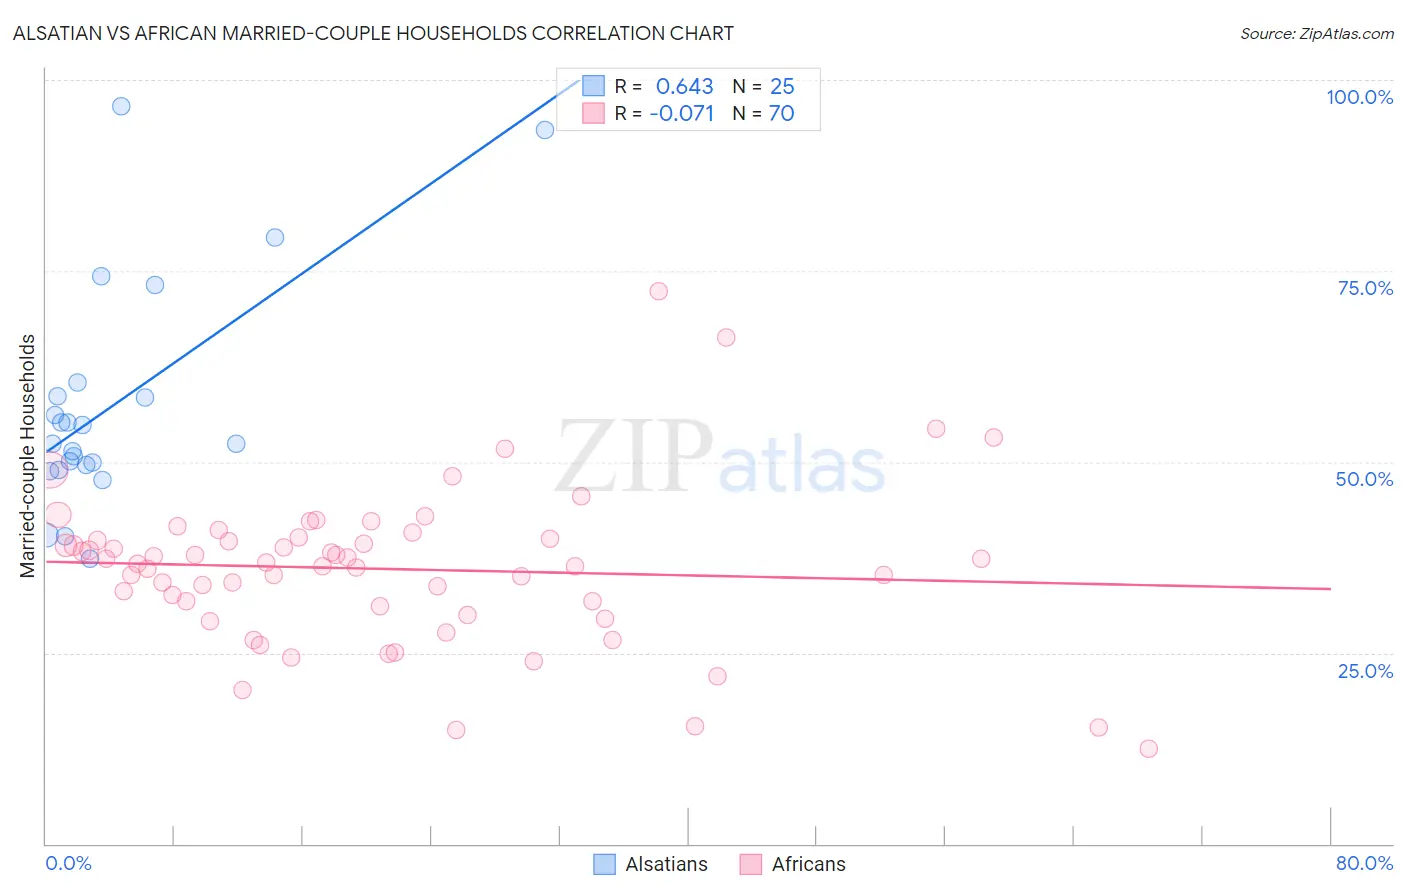
Alsatian vs African Married-couple Households Correlation Chart
The statistical analysis conducted on geographies consisting of 82,680,020 people shows a significant positive correlation between the proportion of Alsatians and percentage of married-couple family households in the United States with a correlation coefficient (R) of 0.643 and weighted average of 44.8%. Similarly, the statistical analysis conducted on geographies consisting of 469,585,166 people shows a slight negative correlation between the proportion of Africans and percentage of married-couple family households in the United States with a correlation coefficient (R) of -0.071 and weighted average of 40.9%, a difference of 9.5%.
Married-couple Households Correlation Summary
| Measurement | Alsatian | African |
| Minimum | 37.3% | 12.5% |
| Maximum | 96.6% | 72.3% |
| Range | 59.3% | 59.8% |
| Mean | 57.4% | 36.0% |
| Median | 52.4% | 36.7% |
| Interquartile 25% (IQ1) | 49.3% | 31.1% |
| Interquartile 75% (IQ3) | 59.5% | 39.9% |
| Interquartile Range (IQR) | 10.2% | 8.8% |
| Standard Deviation (Sample) | 15.0% | 10.3% |
| Standard Deviation (Population) | 14.7% | 10.2% |
Similar Demographics by Married-couple Households
Demographics Similar to Alsatians by Married-couple Households
In terms of married-couple households, the demographic groups most similar to Alsatians are Dutch West Indian (44.9%, a difference of 0.10%), Immigrants from Micronesia (44.9%, a difference of 0.12%), Immigrants from Cambodia (44.9%, a difference of 0.14%), Salvadoran (44.7%, a difference of 0.19%), and Kenyan (44.7%, a difference of 0.32%).
| Demographics | Rating | Rank | Married-couple Households |
| Nicaraguans | 5.3 /100 | #219 | Tragic 45.2% |
| Immigrants | Thailand | 5.1 /100 | #220 | Tragic 45.2% |
| Tlingit-Haida | 4.9 /100 | #221 | Tragic 45.1% |
| Immigrants | Laos | 4.6 /100 | #222 | Tragic 45.1% |
| Immigrants | Cambodia | 2.7 /100 | #223 | Tragic 44.9% |
| Immigrants | Micronesia | 2.6 /100 | #224 | Tragic 44.9% |
| Dutch West Indians | 2.6 /100 | #225 | Tragic 44.9% |
| Alsatians | 2.3 /100 | #226 | Tragic 44.8% |
| Salvadorans | 1.9 /100 | #227 | Tragic 44.7% |
| Kenyans | 1.7 /100 | #228 | Tragic 44.7% |
| Immigrants | Latin America | 1.6 /100 | #229 | Tragic 44.7% |
| Soviet Union | 1.6 /100 | #230 | Tragic 44.6% |
| Houma | 1.5 /100 | #231 | Tragic 44.6% |
| Marshallese | 1.5 /100 | #232 | Tragic 44.6% |
| Immigrants | Uganda | 1.5 /100 | #233 | Tragic 44.6% |
Demographics Similar to Africans by Married-couple Households
In terms of married-couple households, the demographic groups most similar to Africans are Immigrants from Haiti (40.9%, a difference of 0.060%), Colville (41.0%, a difference of 0.090%), Jamaican (40.9%, a difference of 0.14%), Trinidadian and Tobagonian (40.9%, a difference of 0.22%), and Immigrants from Caribbean (40.8%, a difference of 0.40%).
| Demographics | Rating | Rank | Married-couple Households |
| Sioux | 0.0 /100 | #305 | Tragic 41.5% |
| Guyanese | 0.0 /100 | #306 | Tragic 41.4% |
| Immigrants | Western Africa | 0.0 /100 | #307 | Tragic 41.4% |
| Crow | 0.0 /100 | #308 | Tragic 41.4% |
| Immigrants | Trinidad and Tobago | 0.0 /100 | #309 | Tragic 41.2% |
| Haitians | 0.0 /100 | #310 | Tragic 41.2% |
| Colville | 0.0 /100 | #311 | Tragic 41.0% |
| Africans | 0.0 /100 | #312 | Tragic 40.9% |
| Immigrants | Haiti | 0.0 /100 | #313 | Tragic 40.9% |
| Jamaicans | 0.0 /100 | #314 | Tragic 40.9% |
| Trinidadians and Tobagonians | 0.0 /100 | #315 | Tragic 40.9% |
| Immigrants | Caribbean | 0.0 /100 | #316 | Tragic 40.8% |
| Immigrants | Jamaica | 0.0 /100 | #317 | Tragic 40.7% |
| Liberians | 0.0 /100 | #318 | Tragic 40.7% |
| Bahamians | 0.0 /100 | #319 | Tragic 40.5% |